Article

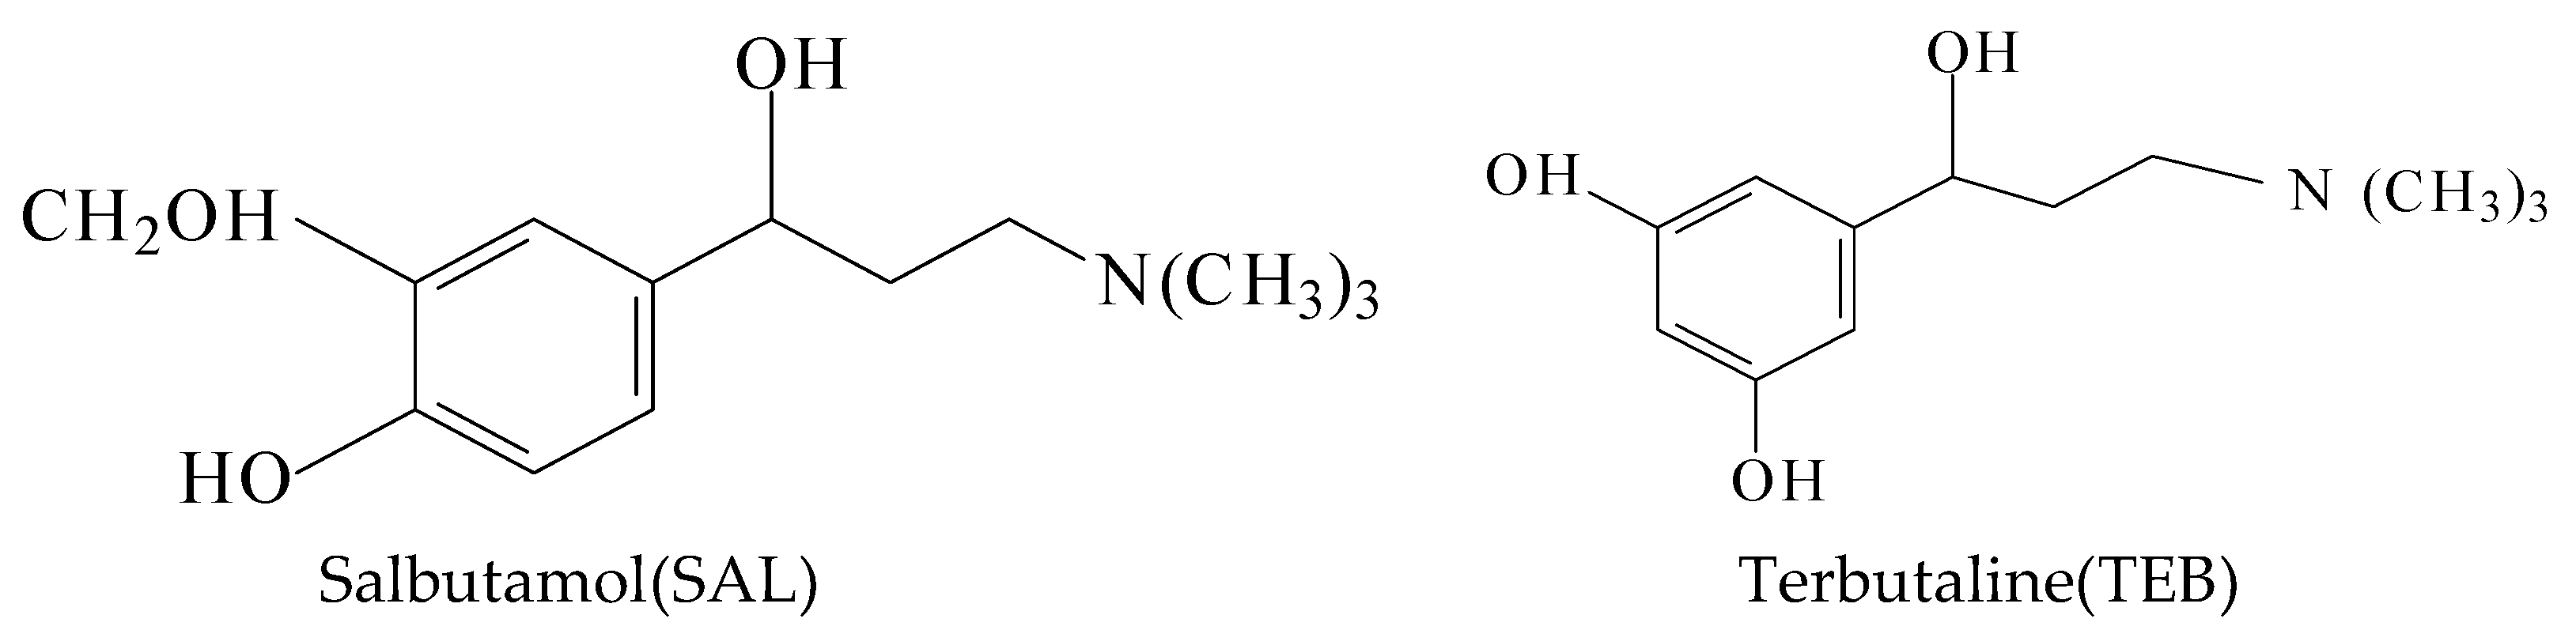
Investigation on a Sensitive Chemiluminescence System Based on Ni(IV) Complex to Determine Two β2-Agonist Drugs in Urine and Swine Feed and Their Mechanism

1
Department of Nursing, Xingtai Medical College, Xingtai 054000, China
2
School of Public Health, Hebei Medical University, Hebei Key Laboratory of Environment and Human Health, Shijiazhuang 050017, China
*
Authors to whom correspondence should be addressed.
Appl. Sci. 2018, 8(5), 663; https://doi.org/10.3390/app8050663
Submission received: 15 March 2018 / Revised: 1 April 2018 / Accepted: 10 April 2018 / Published: 25 April 2018
(This article belongs to the Section Chemical and Molecular Sciences)

Abstract

:
Veterinary drug residues, particularly traces of β2-agonists, can cause various kinds of harmful impact to the environment and public health. Here, a sensitive chemiluminescence (CL) method incorporated with a flow injection analysis is developed for the determination of two β2-agonists [i.e., salbutamol (SAL) and terbutaline (TEB)]. The system is based on the CL reaction of Ni(IV) complex with luminol in alkaline solutions, whereas SAL and TEB can significantly enhance CL intensities. Under optimum conditions, CL intensities are proportional to the SAL and TEB concentration in the range of 1.0 × 10⁻⁹ M to 5.0 × 10⁻⁷ M and 1.0 × 10⁻⁹ M to 1.0 × 10⁻⁷ M, respectively. The limits of detection (3σ) are 1.0 × 10⁻¹¹ M for TEB, and 1.3 × 10⁻¹¹ for SAL respectively. Relative standard deviations (n = 11) are less than 2% for 5.0 × 10⁻⁸ M SAL and TEB. Possible reaction mechanisms for the CL system are suggested based on the CL system spectra, Ni(IV) complex oxidation characteristics, and electron spin resonance (ESR) techniques. The proposed method has been applied to the analysis of urine and swine feed samples with satisfactory results.

Graphical Abstract

1. Introduction

Salbutamol [1-(4-hydroxy-3-hydroxymethylphenyl)-2-(tertbutylamino) ethanol] (SAL) and [1-(3,5-dihydroxyphenyl)-2-(tertbutylamino) ethanol] (TEB, chemical structures are shown in Figure 1) are both selective β2-adenocepter agonists used as anti-asthmatic drugs for the treatment of asthma and chronic obstructive pulmonary disease. But in recent years, traces of β2-agonist used as an animal growth promoter into animal feed lawlessly resulted in toxicity to animals and veterinary drug residues that could cause extensive harm to public health. SAL and TEB are at the top of the list. Analytical methods reported for the determination of SAL and its sulfate include fluorescence spectroscopy [1,2], capillary electrophoresis [3,4], HPLC [5,6], quantum dot techniques [7], and electrochemistry [8,9]. Detection for TEB include HPLC [10,11,12], and electrochemistry [13], etc. Many of these analytical techniques are expensive or require time-consuming derivatization steps. Unlike other methods, chemiluminescence (CL), due to its more sensitive, economical, convenient and lower detection limits, has attracted considerable attention in several fields such as clinical research, biotechnology, pharmacology, and environmental chemistry [14,15,16,17] in the recent years. Several chemiluminescence systems has been successfully used in determination for SAL and TEB in variety of samples [18,19,20,21,22,23,24]. Frequently used CL systems are based on the reactions of luminol (Lu) with different oxidants, such as K3[Fe(CN)6] [18,19], H2O2 [20], and Cu(III) complex [21], others are such as Immunoassay CL [22], Micro Flow Sensor [23] and Liquid-Core Waveguide CL detection system [24].
Over the last few years, part of our research effort has been devoted to the studies of oxidation reactions by an unusual oxidation states of transition metal complexes (UTMC), Ag(III) ([Ag(HIO6)2]5−) [25,26]. The Ag(III) complex can react with luminol (Lu) to produce CL, which has been successfully utilized to determine several biological samples [27,28,29,30] with unusually high sensitivities. In this work, we developed a CL system based on another UTMC complex (i.e., Ni(IV) complex, [Ni(OH)2(HIO6)2]6−), which is fairly stable in alkaline medium, and has steady oxidation characters than Ag(III) complex. Its structure [31] is illustrated as follows (Figure 2).
The Ni(IV)-Lu CL system incorporated with a flow injection analysis (FIA) has been established for SAL and TEB determination. The proposed method is based on the CL reaction of luminol with Ni(IV) in alkaline solution, whereas SAL and TEB can significantly enhance CL intensities. This method has suitable linearity, higher sensitivity, precision, and potential capability for the residue analysis of β2-agonists in urine and swine feed samples. Possible reaction mechanisms for the CL system are suggested based on the UV absorption spectra, CL spectra, and results of the electron spin resonance (ESR) experiment performed in this study.

2. Materials and Methods

2.1. Reagents and Solution

SAL and TEB sulfate were obtained from Sigma-Aldrich (St. Louis, MO, USA). A stock standard solution of SAL (4.18 × 10⁻³ M) was prepared by dissolving a suitable amount of SAL sulfate in 2 mL methanol and diluted with deionized water to 25 mL. A stock solution of TEB (3.88 × 10⁻⁵ M) was prepared by dissolving a suitable amount of TEB sulfate in water and diluted to 25 mL. Luminol solution (0.020 M) was prepared by dissolving 0.8860 g luminol (Merck, Darmstadt, Germany) in 7.00 mL 1.00 M NaOH and then diluted with water to 250 mL. Ni(NO3)2·6H2O, KIO4, K2S2O8, and KOH (prepared for Ni(IV) solution) were obtained from the Shanghai Chemical Reagent Company (Shanghai, China). All of the above reagents were of analytical grade without further purification. Double-distilled water (or pure water thereafter) was used as carrier flow and for the solution preparation. Diluted working solutions were prepared and used fresh and daily.
[Ni(OH)2(HIO6)2]6− complex was synthesized according to the procedure described previously [31]. Concentration of the Ni(IV) stock solution was determined spectrophotometrically at 410 nm using the molar absorptivity of ε = 1.06 × 10⁵ L (mol)−1 (cm)−1 [31].

2.2. Sample Handling and Extraction Procedure
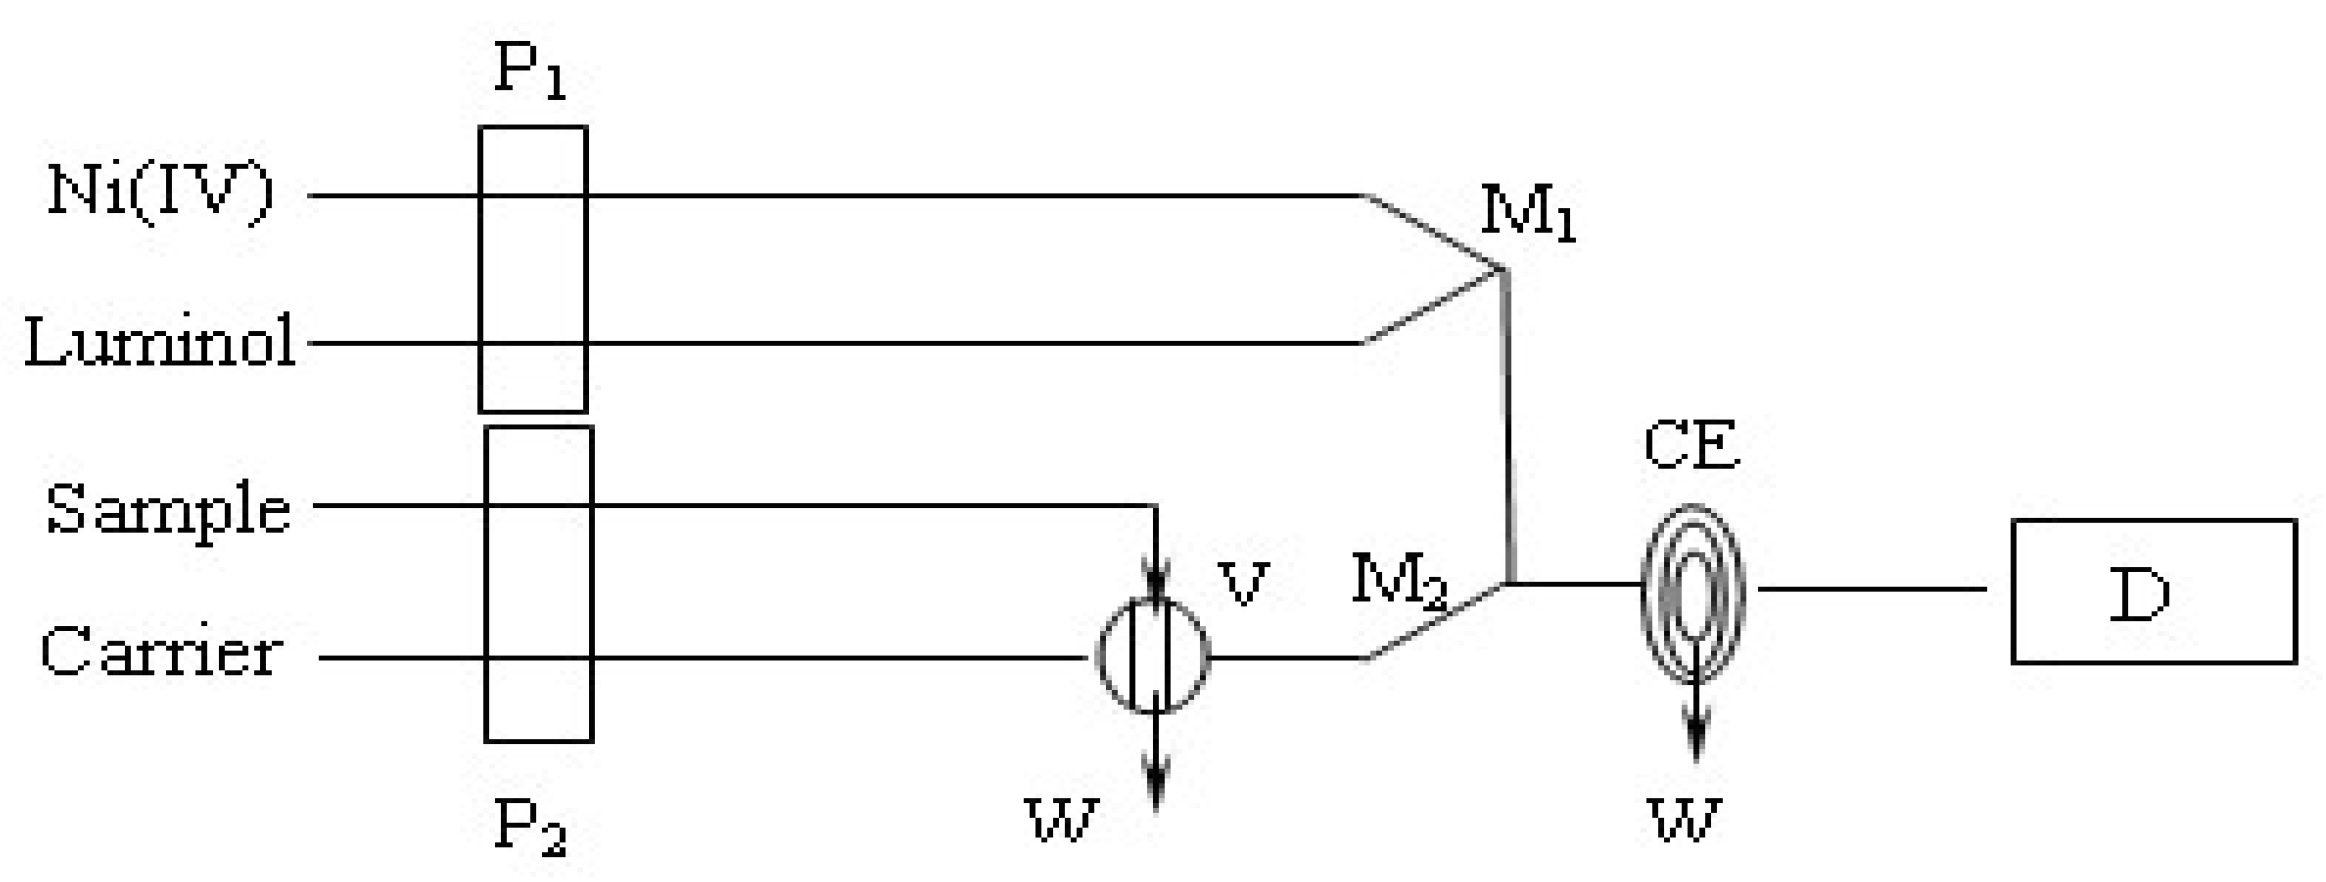
Urine samples were provided by the Hospital of Hebei Medical University. A 1.0 mL urine sample was diluted to 10 mL with pure water. Approximately 1.0 g of PbO2 powder was then added and stirred for 10 min eliminate urine acid, thiourea, and ascorbic acid. The supernatant was filtrated after centrifuging for 10 min at 10,000 rpm. The filtrate was then applied to a cation exchange column (4 cm × 1.2 cm) for cleanup. The clear liquid was diluted to 100 mL with pure water.
Artificial swine feed samples were obtained from feed market. Each of the homogenized feed samples (2.0 g) was weighed into 50 mL polypropylene tube. Extraction with 15 mL 0.03 M HCl solution (adjusted extraction solution to pH 4–5) was performed by oscillating extraction for 30 min. Approximately 5.0 mL of the supernatant solution was transferred to a centrifuge tube and centrifuged for 10 min at 10,000 rpm. The 3.0 mL of upper clear liquid was filtered through 0.45 μm water membrane filter. Solid phase extraction cartridges (SPE-ProElut PXC) with a water extraction vacuum manifold were used as clean-up and enrichment devices for the feed samples according to the following steps:
Condition: 3 mL methanol followed by 3 mL deionized water and 3 mL 30 mM HCl.
Load: 3 mL of the above filtrate were loaded to the cartridges.
Wash: 2 mL water, 2 mL methanol, and 2 mL 20% acetone.
Elute: 3 mL 4% ammonia-methanol.
Evaporation with nitrogen stream at 50 °C and were diluted with deionized water to 100 mL.

2.3. Instruments

The FIA-CL system (Xi’an Remax Electronic Science-Tech Co. Ltd., Xi’an, China) is shown in Figure 3. UV-visible spectra are recorded on a TU-1901 spectrophotometer (Purkinje, Beijing, China). CL spectra are obtained by an F-7000 fluorescence spectrophotometer (Hitachi, Tokyo, Japan), and ESR experiments are completed by an electron spin resonance spectroscopy (FA-300, JEOL Ltd., Tokyo, Japan).

3. Results

3.1. Optimization of CL Conditions

3.1.1. Effect of Ni(IV) Concentration on CL Intensities

The CL intensities, as functions of [Ni(IV)], [Lu], and [OH] in both Ni(IV) and luminol solutions, flow rate, and characters of the carrier flow, have been determined and summarized. CL intensity increased with the increasing flow rate, and a 2.5 mL/min flow rate was selected for all solutions in the measurements. Pure water was used as carrier flow.
At constant [Lu], [OH] in both Ni(IV) and luminol solutions, the influence of Ni(IV) concentration on CL emission intensities have been determined in the region of 2.0 × 10⁻⁸ M to 2.0 × 10⁻⁵ M. The CL relative intensities of TEB and SAL increased with the increasing Ni(IV) concentration, but higher concentrations of [Ni(IV)] lowered the CL intensity probably because of self-absorption by Ni(IV) complex anion. Maximum CL intensities were obtained for TEB and SAL. The optimum concentrations of Ni(IV) were thus selected as 6.0 × 10⁻⁷ M for TEB and 2.0 × 10⁻⁶ M for SAL.

3.1.2. Effect of Luminol Concentration on CL Intensities

The influence of luminol concentration on CL emission intensities was determined in the region 2.0 × 10⁻⁸ ≤ [Lu] ≤ 4.0 × 10⁻⁵ M. The relative CL intensities both of TEB and SAL increased with an increasing luminol concentration. The base signal of CL generated by the reaction between Ni(IV) and luminol also increased, and the signal-to-noise ratio (S/N) also increased. After an analysis of S/N ratio of the baseline and system sensitivity, the best luminol concentrations were selected as 2.0 × 10⁻⁷ M for TEB and 2.0 × 10⁻⁶ M for SAL.

3.1.3. Effect of [OH-] in Ni(IV) and Luminol Solutions

Changing [OH] in both the Ni(IV) and luminol solutions can clearly affect the CL intensities of the Ni(IV)-Lu-TEB and Ni(IV)-Lu-SAL CL systems. We systematically studied the influence of varying [OH] in the region 0.0001 ≤ [OH] ≤ 0.05 M in Ni(IV), and 0.0001 ≤ [OH] ≤ 0.01 M in luminol solutions on the CL intensities, respectively. The optimum [OH] in Ni(IV) and luminol solution for TEB determination were 0.003 M and 0.001 M, respectively. Approximately 0.001 M [OH] in Ni(IV) and 0.002 M [OH] in the luminol solution were the best concentrations for detecting SAL. All these optimum values are listed in Table 1 (Shown in Figures S1–S4).

3.2. Application of the New CL System

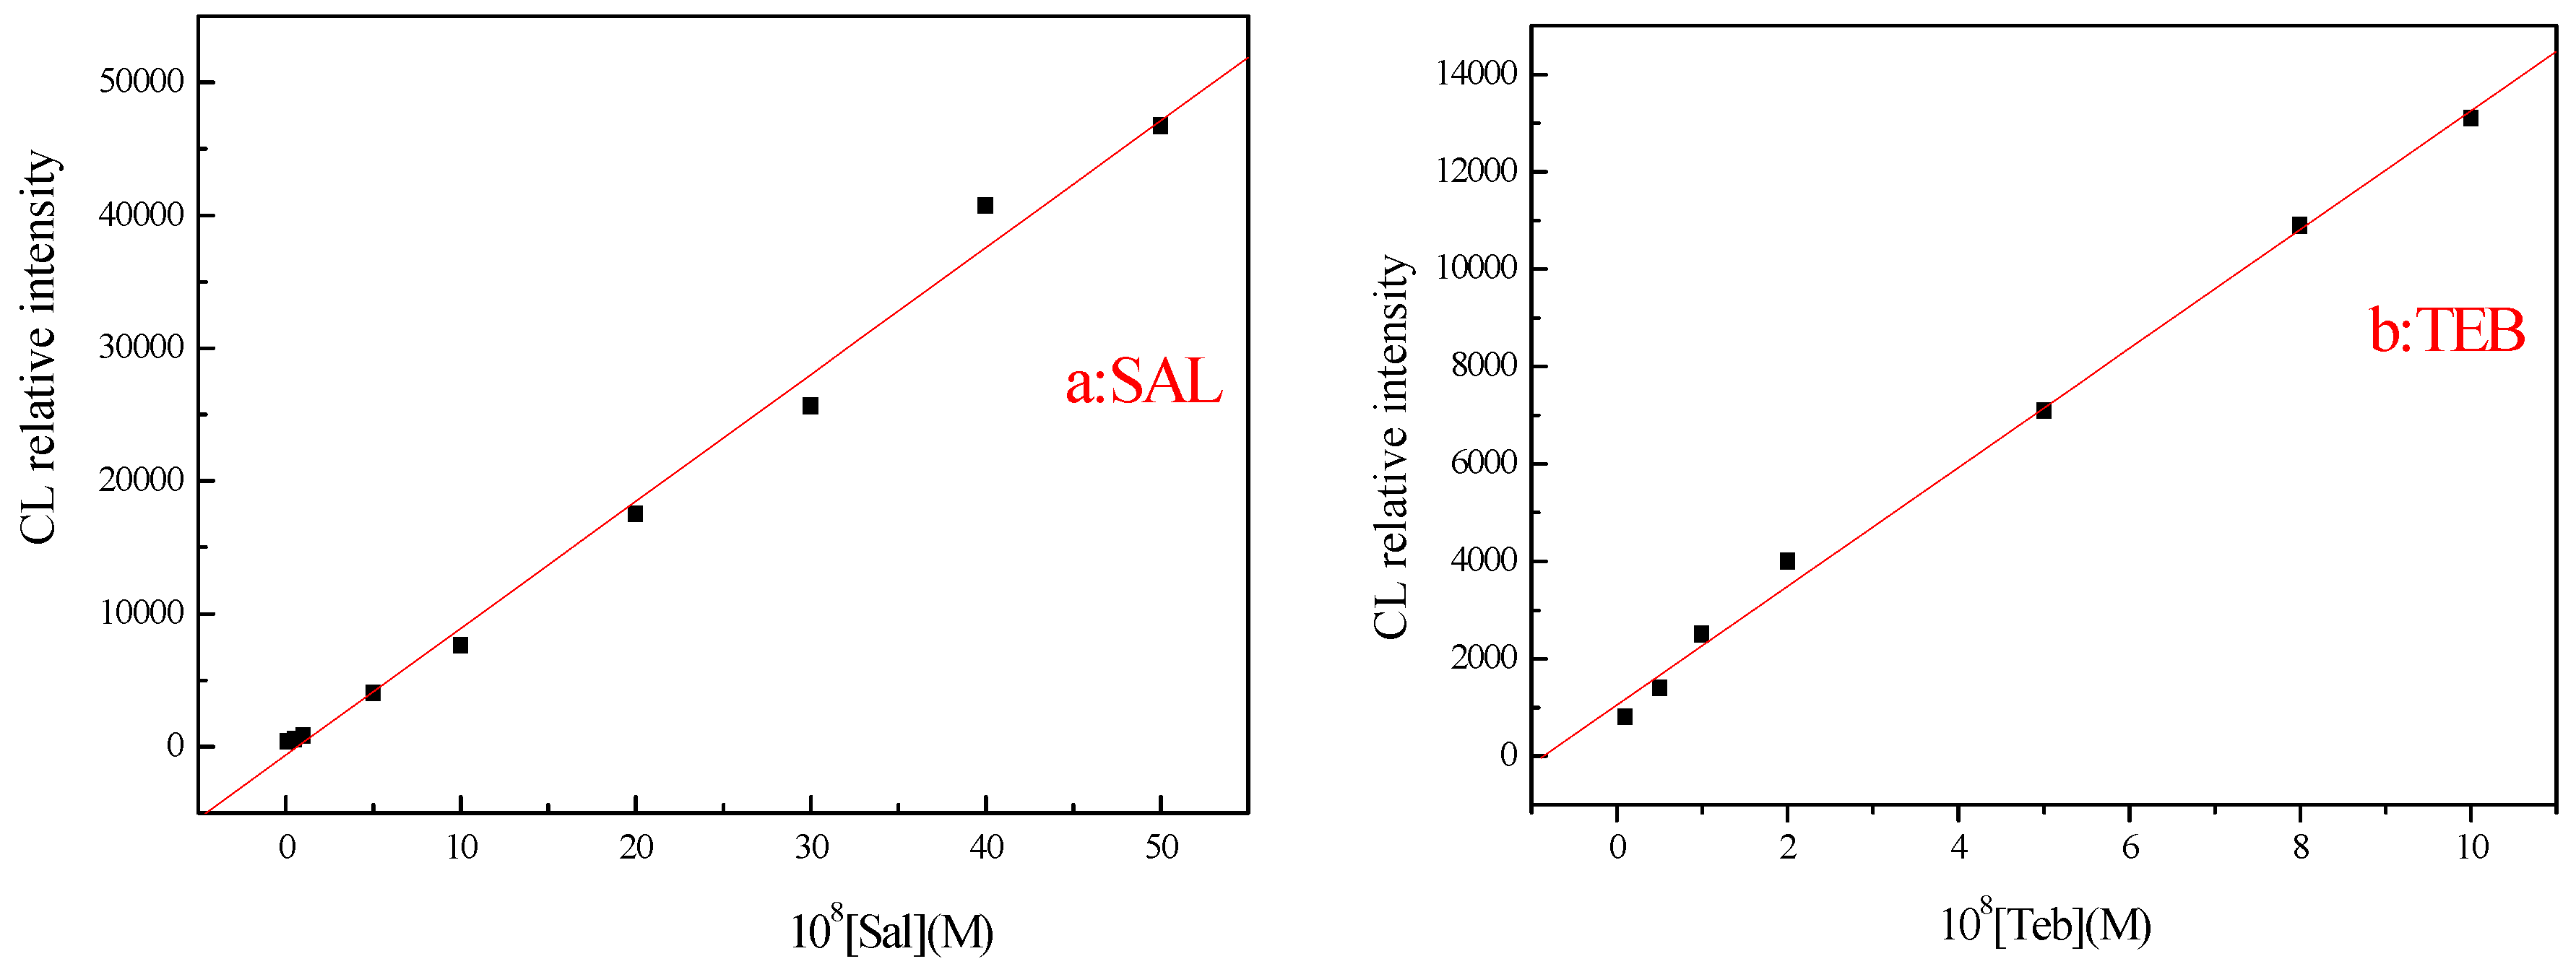
3.2.1. Dynamic Range, Detection Limit, and Relative Standard Deviation

The Ni(IV)-luminol CL system was applied to determine SAL and TEB. Linearities for the TEB and SAL determination were investigated under their optimum conditions described above. Linear ranges of TEB and SAL were 1.0 × 10⁻⁹ M to 1.0 × 10⁻⁷ M (r = 0.998), and 1.0 × 10⁻⁹ M to 5.0 × 10⁻⁷ M (r = 0.996), respectively (Figure 4). Regression equations were obtained as: It = 1047.25 + 1220.65 × 108 [TEB], and It = −643.16 + 955.23 × 10⁸ [SAL]. The detection limits (3σ) for the regression equation were 1.0 × 10⁻¹¹ M for TEB, and 1.3× 10⁻¹¹ M for SAL. According to the precision of the experiment, quantification limit for SAL/TEB was set the lowest concentration of the linear range that is 1.0 × 10⁻⁹ M for SAL and TEB by the standard requirement. The precision values were less than 2% RSD (n = 11) for 5.0 × 10⁻⁸ M TEB and SAL.
This new CL system is highly sensitive and has a detection limit much lower than that by CZE (4.47 × 10⁻⁶ M) [4], HPLC/MS (0.006 μg/kg) [5] for SAL, HPLC (8.43 × 10⁻⁶ M) [10], MELC (3.55 × 10⁻⁸ M) [11], and other CL systems (3.12 × 10⁻⁶ M) [18] for TEB, (1.0 × 10⁻⁷ M) for SAL [24] compared with other published methods.

3.2.2. Recovery Experiments and Analysis of Urine and Feed Samples

Approximately 100 mL urine or feed prepared sample solution was divided into four portions: one was a blank solution, whereas the others were added with standard solution to determine recoveries. All test solutions were then diluted appropriately with pure water to within the linear range of determination. Recoveries were 95% to 105% for SAL and 95% to 108% for TEB in urine and feed samples, respectively. The results of the blank samples agreed with those obtained by the HPLC–UV method [32]. Chromatographic separation was performed on a CN column (10 μm, 250 mm × 4.6 mm i.d.). The mobile phase used consisted of acetonitrile and KH2PO4 (0.075 M) in a ratio of 85:15 at a flow rate of 1.0 mL/min. UV detector wavelength was set at 215 nm according to UV scan spectra. The results by HPLC measurement were no detection. All results are listed in Table 2.

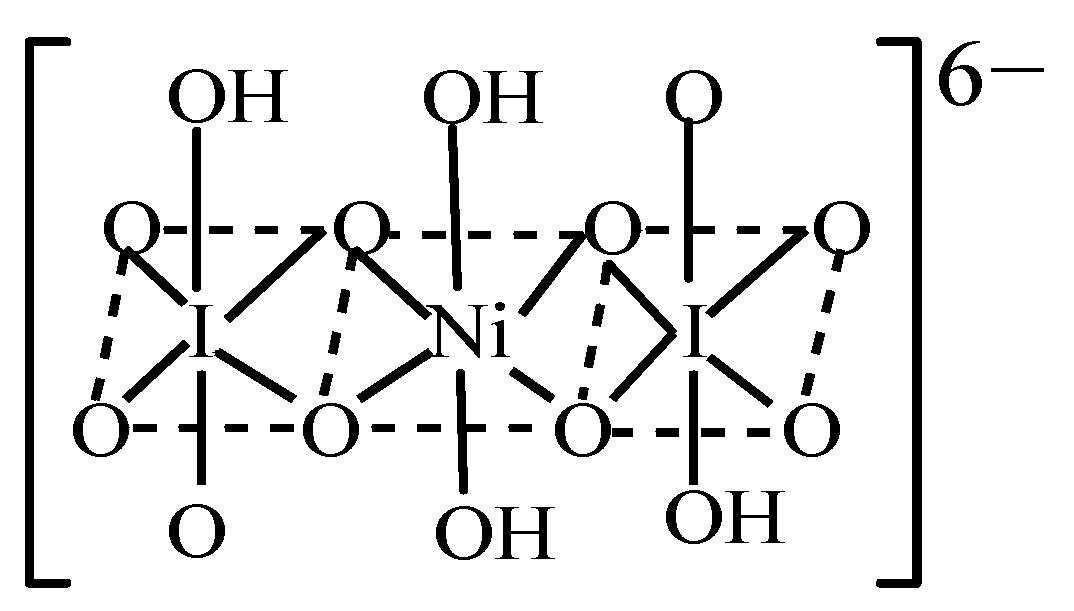
4. Discussion: Mechanistic Studies of the CL Detection System
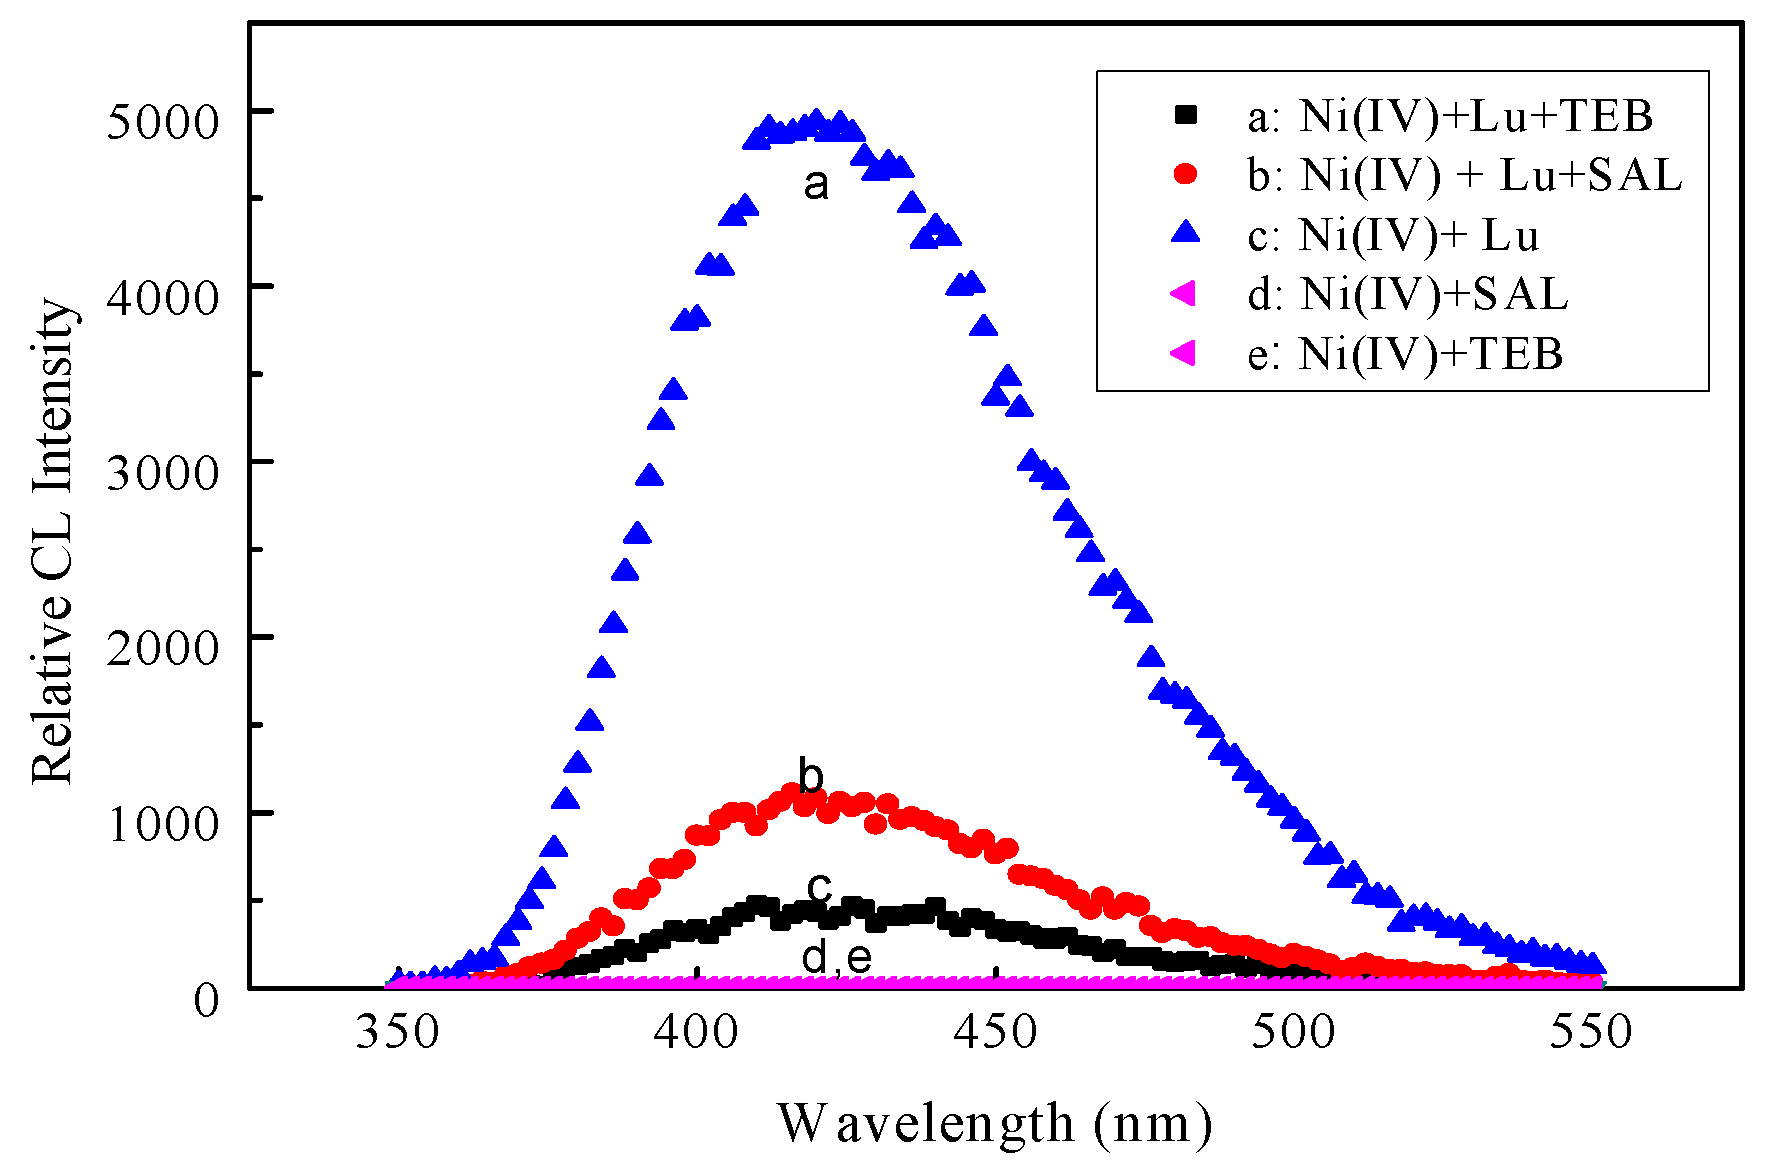
4.1. CL Spectra

The mechanism of this CL reaction system were investigated by the CL spectra (Figure 5) obtained from an F-7000 fluorescence spectrophotometer, where (a) luminol-Ni(IV)-TEB; (b) luminol-Ni(IV)-SAL; (c) luminol-Ni(IV); (d,e) Ni(IV)-SAL/TEB. It can be seen that all curve charts have same absorption peak at approximately 425 nm, which implies that all these CL reactions shared a common emitting species derived from the aminophthalate spectrum belong to CL species of luminol [33]. The CL intensities of luminol-Ni(IV) could also significantly enhance with the TEB or SAL addition, and TEB was more sensitive to this system than SAL. This result is consistent with experimental data.

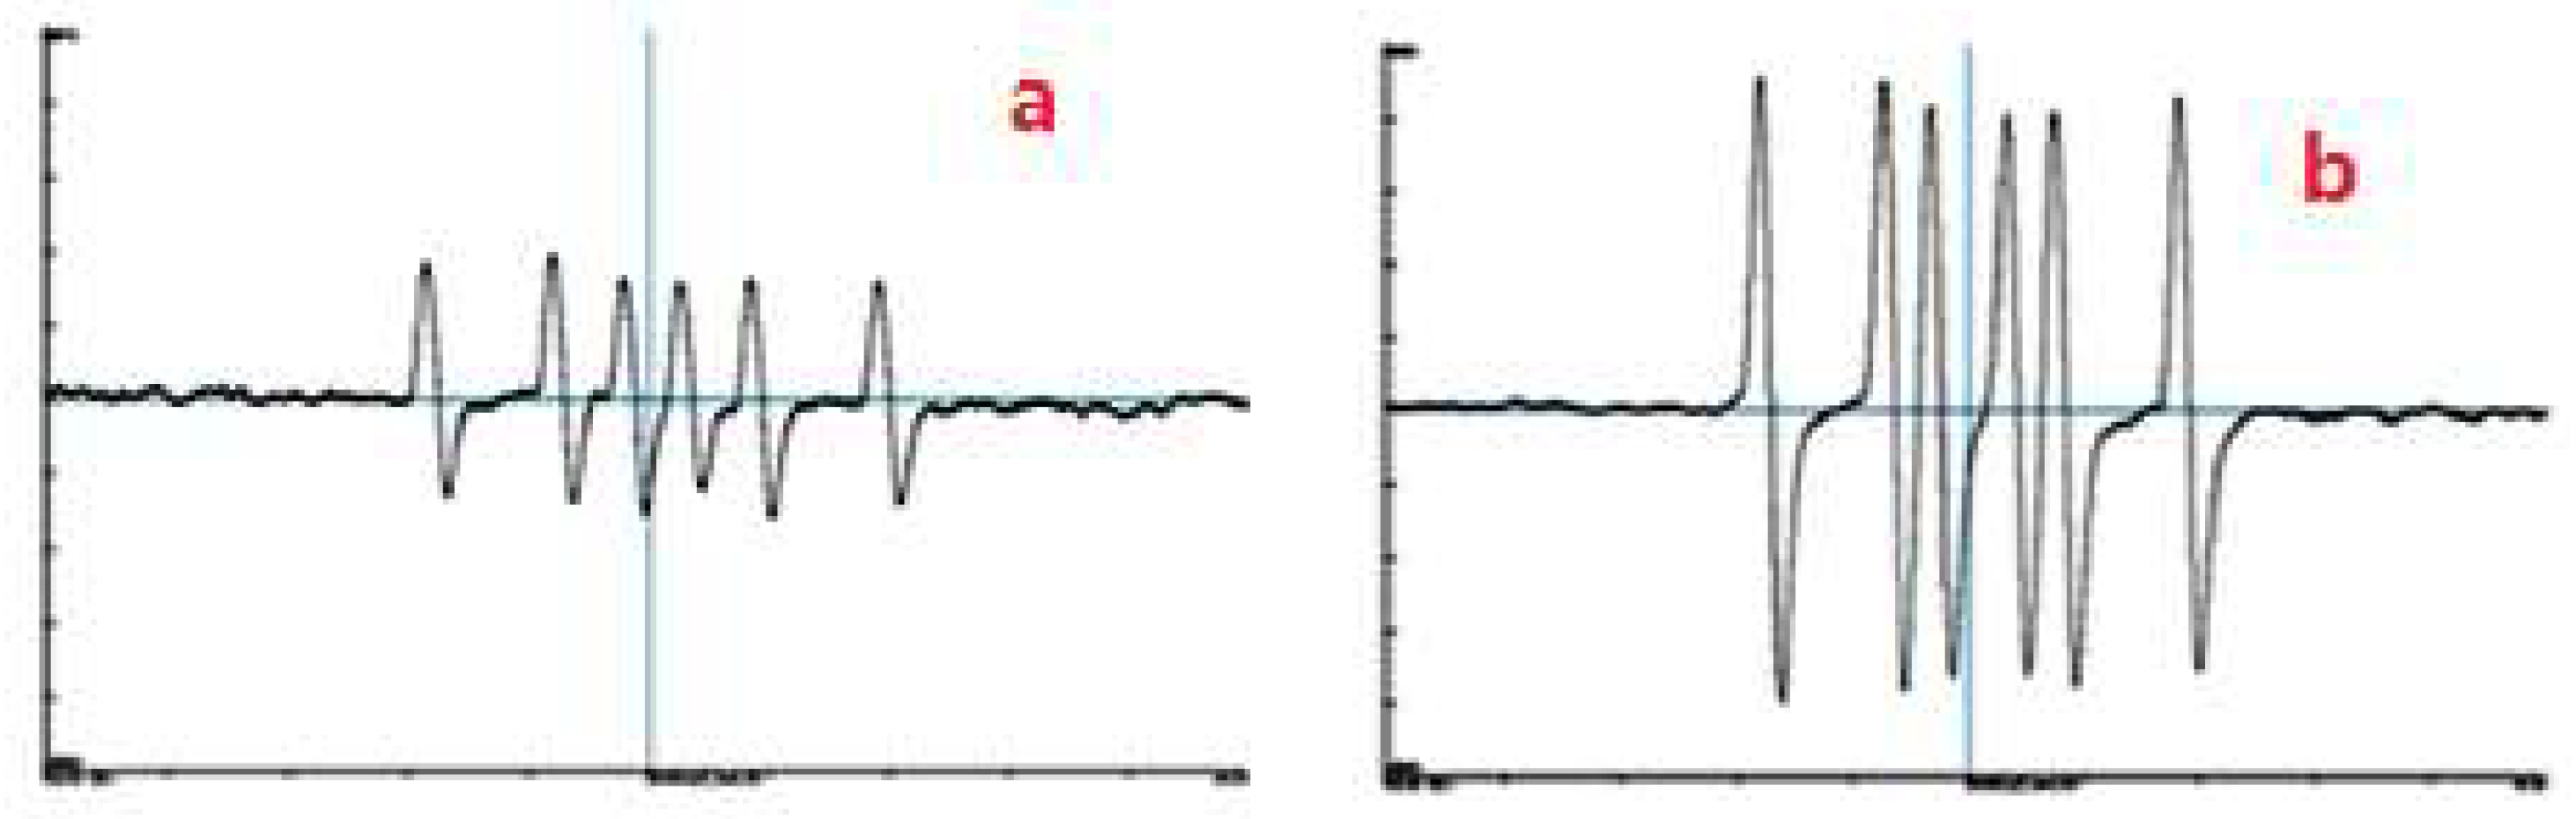
4.2. Verifying Free Radicals by ESR Spectra

The presence of free radicals in Ni(IV) complex-Luminol-SAL molecule CL system was further verified by electron spin resonance technique. In the above CL system, there may be free radicals including OH, O2− and free radicals of luminol and salbutamol molecules as reaction reductants. The free radical life of OH, O2−, luminol and target molecules can be as short as 10−15 s, therefore, free radical trapping agent (5,5-dimethyl-1-pyrroline N-oxide, DMPO) was added to the reaction solution, and the ESR spectra of the reaction system was determined under nitrogen protection. The results showed that resonance spectra types of the free radicals in these systems were R or RO type, which verified the existence of free radicals of luminol and target drug molecules. Figure 6a is the ESR spectrum of luminol radical in the Ni (IV)-Luminol system. Figure 6b is the ESR spectrum of Ni (IV)-Luminol-Salbutamol system. It can be seen from the diagram that the free radicals in the two systems are R or RO type, and after adding salbutamol to Ni (IV)-Luminol system, the peak area of ESR spectrum of the system is enhanced, but the radical type remains unchanged.

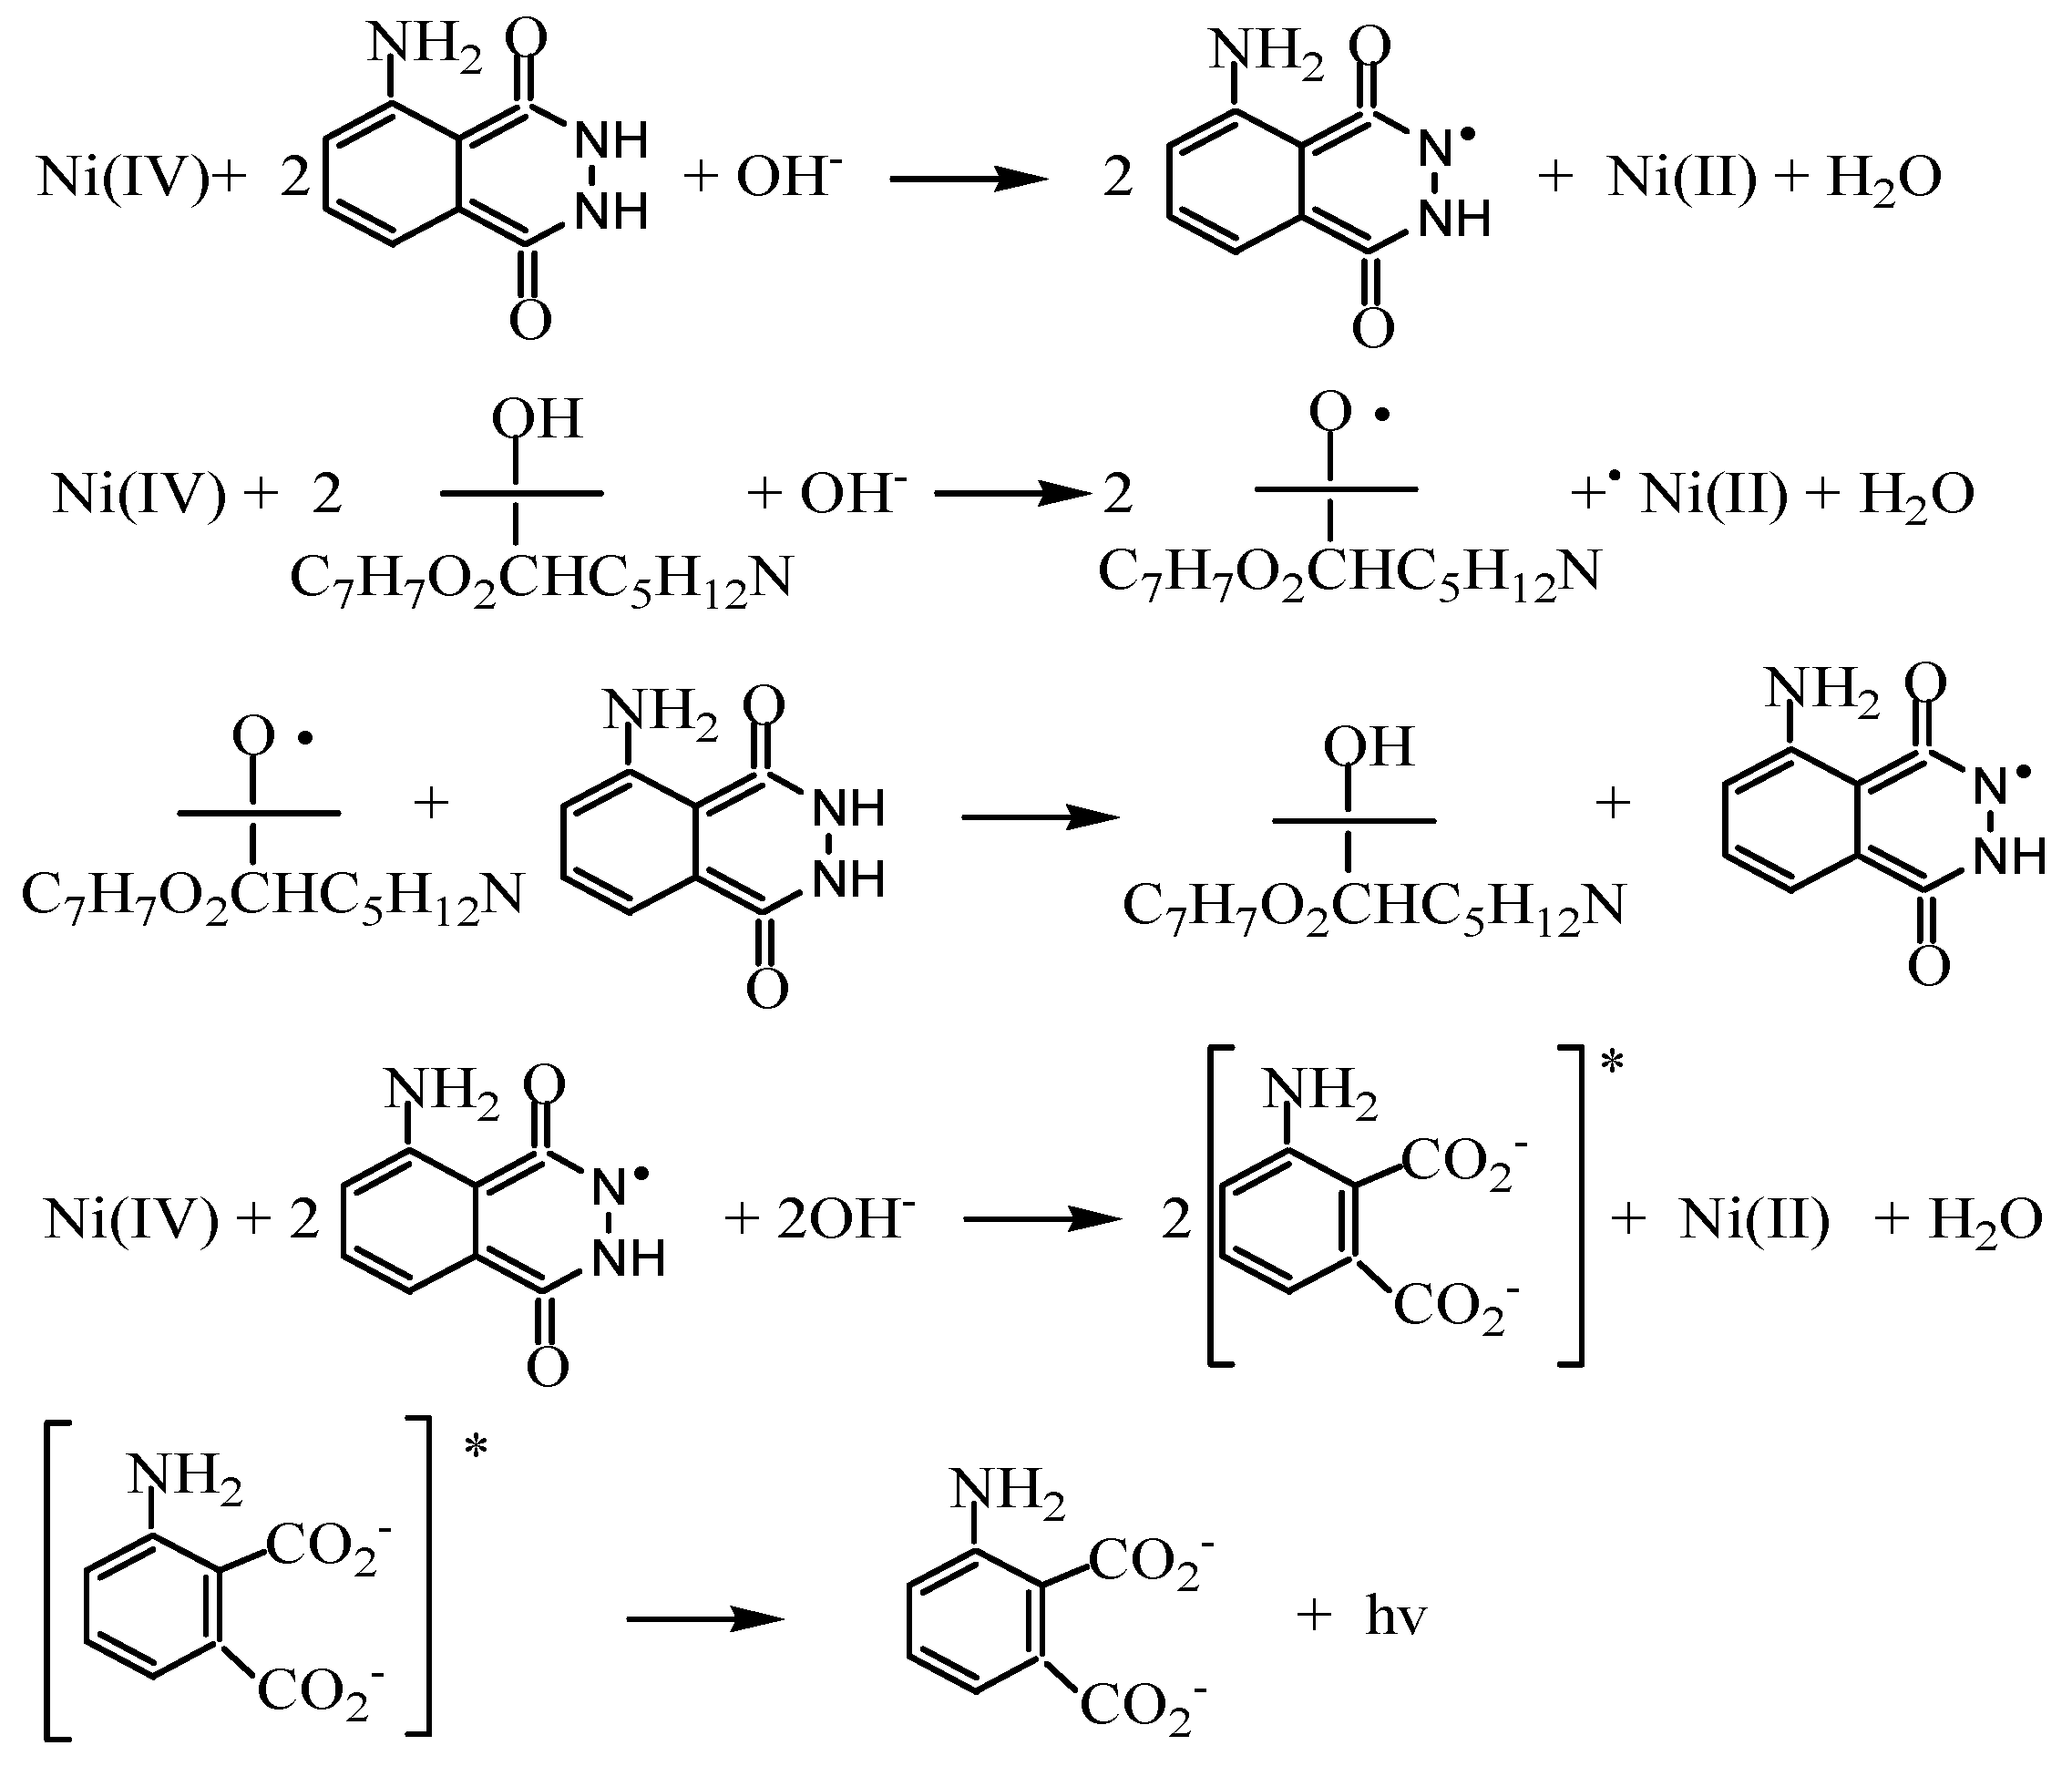
4.3. Reaction Mechanism

Batch experimental results in the present study, UV absorption spectra, CL spectra, and ESR spectra of the proposed CL detection system were conducted to investigate the CL reaction mechanism between Ni(IV) complex and luminol/salbutamol. According to these results, a CL reaction mechanism (Scheme 1) was proposed.
It is speculated that free radical is formation in the reaction of Ni(IV) complex with luminol/salbutamol, respectively. The produced luminol radical reacts with Ni(IV) to yield an unstable endoperoxide and electronically excited 3-aminophthalate anion to create chemiluminescence. A portion radicals came from salbutamol-Ni(IV) reaction give to luminol rapidly in the course, which leads to more luminol radicals that increase CL enhancement (Scheme 1).

5. Conclusions

The proposed new CL detection system based on the CL reaction of Ni(IV) complex with luminol incorporated with flow injection can be successfully used for salbutamol and terbutaline determination in urine and swine feed. Complementing current methodologies, the newly developed analytical method is more sensitive and experimental costs are lower than the HPLC and LC/MS/MS techniques. These features implicate that the method have a wide application in the determination of other β2-agonists and veterinary drug residues in food or in biological samples. Otherwise, the possible use of the Ni(IV) complex-luminol CL system as an HPLC and in capillary electrophoresis detection can expand its application in other fields. Studies are now working toward this direction.

Supplementary Materials

The following are available online at https://www.mdpi.com/2076-3417/8/5/663/s1, Figure S1: Effect of Ni(IV) concentrations on CL intensity; Figure S2: Effect of [OH] in Ni(IV) solutions on CL intensity; Figure S3: Effect of luminol concentrations on CL intensity; Figure S4: Effect of [OH] in luminol solutiosn on CL intensity.

Author Contributions

H.S. and S.L. conceived and designed the experiments. X.D., Y.D., X.L. and T.D. performed the experiments. H.S. analyzed the data and wrote the paper.

Acknowledgments

Financial support to this work by grants from the National Natural Science Foundation of China (Nos. 81773481, 81273128) is sincerely acknowledged.

Conflicts of Interest

The authors declare no conflict interest.

References

  1. Li, M.; Zhang, Y.; Xue, Y.; Hong, X.; Cui, Y.; Liu, Z.; Du, D. Simulataneous determination of â2-agonists clenbuterol and sablutamol in water and swine feed samples by dual-labeled time-resolved fluoroimmunoassay. Food Control. 2017, 73, 1039–1044. [Google Scholar] [CrossRef]
  2. Zhang, Q.; Ni, Y.; Kokot, S. Competitive interactions of ionic surfactants with salbutamol and bovine serum albumin: A molecular spectroscopy study with implications for salbutamol in food analysis. J. Agric. Food Chem. 2013, 61, 7730–7738. [Google Scholar] [CrossRef] [PubMed]
  3. Loden, H.; Pettersson, C.; Arvidsson, T.; Amini, A. Quantitative determination of salbutamol in tablets by multiple-injection capillary zone electrophoresis. J. Chromatogr. A 2008, 1207, 181–185. [Google Scholar] [CrossRef] [PubMed]
  4. Chen, Q.; Fan, L.Y.; Zhang, W.; Cao, C.X. Separation and determination of abused drugs clenbuterol and salbutamol from complex extractants in swine feed by capillary zone electrophoresis with simple pretreatment. Talanta 2008, 76, 282–287. [Google Scholar] [CrossRef] [PubMed]
  5. Li, C.; Wu, Y.; Yang, T.; Zhang, Y.; Huang-Fu, W. Simultaneous determination of clenbuterol, salbutamol and ractopamine in milk by reversed-phase liquid chromatography tandem mass spectrometry with isotope dilution. J. Chromatogr. A 2010, 1217, 7873–7877. [Google Scholar] [CrossRef] [PubMed]
  6. Guo, Z.; Chen, Y.; Ding, X.; Huang, C.; Miao, L. Simultaneous determination of ambroxol and salbutamol in human plasma by ultra-performance liquid chromatography–tandem mass spectrometry and its application to a pharmacokinetic study. Biomed. Chromatogr. 2016, 30, 1789–1795. [Google Scholar] [CrossRef] [PubMed]
  7. Raksawong, P.; Chullasat, K.; Nurerk, P.; Kanatharana, P.; Davis, F.; Bunkoed, O. A hybrid molecularly imprinted polymer coated quantum dot nanocomposite optosensor for highly sensitive and selective determination of salbutamol in animal feeds and meat samples. Anal. Bioanal. Chem. 2017, 409, 4697–4707. [Google Scholar] [CrossRef] [PubMed]
  8. Antonio, L.C.; Bulhões, L.O.S. Determination of fenoterol and salbutamol in pharmaceutical formulations by electrogenerated chemiluminescence. Talanta 2007, 72, 1746–1751. [Google Scholar]
  9. Goyal, R.N.; Oyama, M.; Singh, S.P. Fast determination of salbutamol, abused by athletes for doping, in pharmaceuticals and human biological fluids by square wave voltammetry. J. Electroanal. Chem. 2007, 611, 140–148. [Google Scholar] [CrossRef]
  10. Rao, K.L.N.; Krishnaiah, C.; Babu, K.S.; Reddy, K.P. Development and validation of a stability-indicating LC method for simultaneous determination of related compounds of guaifenesin, terbutaline sulfate and ambroxol HCl in cough syrup formulation. J. Saudi Chem. Soc. 2014, 18, 593–600. [Google Scholar]
  11. Althanyan, M.S.; Assi, K.H.; Clark, B.J.; Hanaee, J. Microemulsion high performance liquid chromatography (MELC) method for the determination of terbutaline in pharmaceutical preparation. J. Pharm. Biomed. Anal. 2011, 55, 397–402. [Google Scholar] [CrossRef] [PubMed]
  12. Faiyazuddin, M.; Rauf, A.; Ahmad, N.; Ahmad, S.; Lqbal, Z. A validated HPTLC method for determination of terbutaline sulfate in biological samples: Application to pharmacokinetic study. Saudi Pharm. J. 2011, 19, 185–191. [Google Scholar] [CrossRef] [PubMed]
  13. Li, Y.; Ye, Z.; Zhou, J.; Liu, J.; Song, G. A new voltammetric sensor based on poly(l-arginine)/graphene–Nafion composite film modified electrode for sensitive determination of terbutaline sulfate. J. Electroanal. Chem. 2012, 687, 51–57. [Google Scholar] [CrossRef]
  14. Kricka, L.J. Clinical applications of chemiluminescence. Anal. Chim. Acta 2003, 500, 279–286. [Google Scholar] [CrossRef]
  15. Roda, A.; Pasin, I.P.; Mirasoli, M.; Michelini, E.; Guardigli, M. Biotechnological applications of bioluminescence and chemiluminescence. Trends Biotechnol. 2004, 22, 295–303. [Google Scholar] [CrossRef] [PubMed]
  16. He, H.; Zhang, L.; He, L.; Liu, G. Chemiluminescence Analysis and its Application in Pharmacology. Prog. Pharm. Sci. 2004, 28, 257–269. [Google Scholar]
  17. Meseguer-Lloret, S.; Torres-Cartas, S.; Gomez-Benito, M.C. Flow injection photoinduced chemiluminescence determination of imazalil in water samples. Anal. Bioanal. Chem. 2010, 398, 3175–3182. [Google Scholar] [CrossRef] [PubMed]
  18. Han, L.; Zhang, Y.; Kang, J.; Tang, J.; Zhang, Y. Chemiluminescence determination of terbutaline sulfate in bovine urine and pharmaceutical preparations based on enhancement of the 2-phenyl-4,5-di (2-furyl) imidazole–potassium ferricyanide system. J. Pharm. Biomed. Anal. 2012, 58, 141–145. [Google Scholar] [CrossRef] [PubMed]
  19. Chen, X.; Luo, Y.; Shi, B.; Gao, Z.; Du, Y.; Liu, X.; Lin, B. Determination of beta-agonists in swine hair by μFIA and chemiluminescence. Electrophoresis 2015, 36, 986–993. [Google Scholar] [CrossRef] [PubMed]
  20. Gao, H.; Han, J.; Yang, S.; Wang, Z.; Wang, L.; Fu, Z. Highly sensitive multianalyte immunochromatographic test strip for rapid chemiluminescent detection of ractopamine and salbutamol. Anal. Chim. Acta 2014, 839, 91–96. [Google Scholar] [CrossRef] [PubMed]
  21. Zhang, Y.; Zhang, Z.; Sun, Y.; Wei, Y. Development of an Analytical Method for the Determination of β2-Agonist Residues in Animal Tissues by High-Performance Liquid Chromatography with On-line Electrogenerated [Cu(HIO6)2]5−-Luminol Chemiluminescence Detection. J. Agric. Food Chem. 2007, 55, 4949–4956. [Google Scholar] [CrossRef] [PubMed]
  22. Xu, M.; Qian, X.; Zhao, K.; Deng, A.; Li, J. Flow injection chemiluminescent competitive immunoassay for the beta-adrenergic agonist salbutamol using carboxylic resin beads and enzymatic amplification. Sens. Actuators B Chem. 2015, 215, 323–329. [Google Scholar] [CrossRef]
  23. He, D.; Zhang, Z.; Zhou, H.; Huang, Y. Micro flow sensor on a chip for the determination of terbutaline in human serum based on chemiluminescence and a molecularly imprinted polymer. Talanta 2006, 69, 1215–1220. [Google Scholar] [CrossRef] [PubMed]
  24. Sanchez, M.A.; Rocha, F.R.P. A Flow-Based Analytical Procedure for Salbutamol Determination Exploiting Chemiluminescence in a Liquid-Core Waveguide. Anal. Lett. 2008, 41, 1579–1591. [Google Scholar] [CrossRef]
  25. Shi, H.; Shen, S.; Sun, H.; Liu, Z.; Li, L. Oxidaition of L-serine and L-threonine by Bis(hydrogen periodato)argentite(III) Complex anion: a Mechanistic study. J. Inorg. Biochem. 2007, 101, 165–172. [Google Scholar] [CrossRef] [PubMed]
  26. Shi, H.; Zhang, J.; Huo, S.; Shen, S.; Kang, W.; Shi, T. Kinetics and Mechanism of Oxidation of the Drug Intermediate 1-(2-Hydroxyethyl)piperidine by Bis(hydrogenperiodato)argentate(III). J. Braz. Chem. Soc. 2013, 24, 1307–1313. [Google Scholar] [CrossRef]
  27. Shi, H.; Xu, X.; Ding, Y.; Liu, S.; Kang, W. Determination of cortisol in human blood serums by a new Ag(III) complex- luminol chemiluminescent system. Anal. Biochem. 2009, 387, 178–183. [Google Scholar] [CrossRef] [PubMed]
  28. Xu, X.; Zhang, H.; Shi, H.; Ma, C.; Cong, B.; Kang, W. Determination of three major catecholamines in human urine by capillary zone electrophoresis with chemiluminescence detection. Anal. Biochem. 2012, 427, 10–17. [Google Scholar] [CrossRef] [PubMed]
  29. Ma, L.; Shi, H.; Lian, K.; Diao, Y.; Chen, Y.; Ma, C.; Kang, W. Highly selective and sensitive determination of several antioxidants in human breast milk using high-performance liquid chromatography based on Ag(III) complex chemiluminescence detection. Food Chem. 2017, 218, 422–426. [Google Scholar] [CrossRef] [PubMed]
  30. Dai, T.; Duan, J.; Li, X.; Xu, X.; Shi, H.; Kang, W. Determination of Sulfonamide Residues in Food by Capillary Zone Electrophoresis with On-Line Chemiluminescence Detection Based on an Ag(III) Complex. Int. J. Mol. Sci. 2017, 18, 1286. [Google Scholar] [CrossRef] [PubMed]
  31. Murthy, C.P.; Sethurant, B.; Rao, T.N. Oxidation by tetravalent nickel Part 1: Kinetics of electron transfer from some aliphatic alcohols to Ni(IV) in aqueous alkaline media. Z. Phys. Chem. 1986, 267, 1212–1218. [Google Scholar]
  32. People’s Republic of China Entry and Exit Inspection and Quarantine Industry Standard. Determination of Salbutamol Residues in Animal Feed for Import and Export—Liquid Chromatographic Method; SN/T 1116-2002; China Standard Publishing House: Beijing, China, 2002.
  33. Safavi, A.; Karimi, M.A. Flow injection determination of cationic surfactants by using N-bromosuccinimide and N-chlorosuccinimide as new oxidizing agents for luminol chemiluminescence. Anal. Chim. Acta 2002, 468, 53–63. [Google Scholar] [CrossRef]
Figure 1. Salbutamol and terbutaline chemical structures.
Applsci 08 00663 g001
Figure 2. Chemical structure of [Ni(OH)2(HIO6)2]6− complex anion.
Applsci 08 00663 g002
Figure 3. Schematic of the flow injection analysis CL system for SAL/TEB determination, where P is the peristaltic pumps, V is the six-way injection valve, M is the manifold, CE is reaction cell, W is waste, and D is a photomultiplier tube detector.
Applsci 08 00663 g003
Figure 4. Plots of the CL intensities versus [SAL] and [TEB]. Conditions: (a) [Ni(IV)] = 6.0 × 10⁻⁷ M (in 0.003 M OH); [Lu] = 2.0 × 10⁻⁷ M (in 0.002 M OH); [SAL] = 1.0 × 10⁻⁷ M; (b) [Ni(IV)] = 6.0 × 10⁻⁷ M (in 0.001 M OH); [Lu] = 2.0 × 10⁻⁶ M (in 0.001 M OH); [TEB] = 1.0 × 10⁻⁷ M.
Applsci 08 00663 g004
Figure 5. CL spectra of the Lu-Ni(IV)-SAL/TEB system. Reaction conditions: [Ni] = 3.0 × 10⁻⁷ M; [Lu] = 1.0 × 10⁻⁴ M; [OH] = 0.006 M; [TEB] = 1.0 × 10⁻⁵ M; [SAL] = 1.0 × 10⁻⁵ M.
Applsci 08 00663 g005
Figure 6. ESR spectra of the (a) Ni(IV)-Lu and (b) Ni (IV)-Lu-SAL system. Reaction conditions: [Ni] =2.0 × 10⁻⁴ M; [Lu] = 3.0 × 10⁻³ M; [OH] = 6.0 × 10⁻³ M; [SAL] = 6.0 × 10⁻⁴ M.
Applsci 08 00663 g006
Scheme 1. Possible mechanism for the Ni(IV)-Luminol-Salbutamol CL detection system.
Applsci 08 00663 sch001
Table 1. Optimization of CL conditions for the TEB and SAL determination.
VariableStudied RangeOptimum Condition
TEBSAL
[Ni(IV)]/M2.0 × 10−8–2.0 × 10−56.0 ×10−72.0 × 10⁻⁶
[Luminol]/M2.0 × 10−8–4.0 × 10−52.0 × 10−72.0 × 10⁻⁶
[OH in Ni(IV)]/M0.0001–0.050.0030.001
[OH in Lu]/M0.0001–0.010.0010.002
Table 2. Recoveries obtained for SAL and TEB in Urine and Feed samples.
SampleSpiked (×10−8 M)Found (×10−8 M)Recovery (%, n = 3)RSD (%, n = 3)
SALTEBSALTEBSALTEBSALTEB
Urine1.01.01.051.08105.0108.01.82.0
10.05.010.284.86102.897.21.72.1
40.08.038.038.3395.1104.11.71.8
Feed1.01.01.031.05103.0105.02.02.1
10.05.09.754.7597.595.01.92.3
40.08.039.367.8298.497.81.82.0

