Article

On the Statistical Characterization of Lightning-Induced Voltages

1
University of Naples Federico II, Via Claudio 21, 80125 Naples, Italy
2
University of Naples Parthenope, Centro Direzionale di Napoli, Is. C4, 80143 Naples, Italy
*
Author to whom correspondence should be addressed.
Appl. Sci. 2018, 8(4), 651; https://doi.org/10.3390/app8040651
Submission received: 22 March 2018 / Revised: 13 April 2018 / Accepted: 19 April 2018 / Published: 23 April 2018

Abstract

:
Protection against lightning-induced voltages is a particularly critical issue, especially for smart grids, due to the presence of electronic-based equipment, as well as control and monitoring devices. Analysis of the severity of the induced voltages is then imperative; on the other hand, the random nature of the lightning phenomenon cannot be disregarded. In this paper, the severity of lightning-induced voltage is analyzed by means of a probabilistic approach which, starting from closed-form solutions, uses a Monte Carlo procedure. Parametric distributions that best fit the distributions of the induced voltages are investigated as well. The results show that the lognormal and the generalized extreme value distributions are the best candidates.

1. Introduction

Smart grids require a high level of surge protection, especially because of the presence of electronic-based equipment, as well as control and monitoring devices. Protection of renewable energy generation systems against lightning is also an emerging issue to be addressed [1,2,3,4]. To this aim, a critical issue is the analysis of the severity of the induced voltages generated by the lightning. As the lightning phenomenon is stochastic, a statistical analysis of the induced voltage parameters is fundamental. Statistical analyses of the lightning current parameters have been proposed in the relevant literature with reference to peak values and to the parameters of waveshapes, such as the time intervals between 10% and 90% (or 30% and 90%) of peak value, the corresponding front duration, the average and maximum front steepness, and the maximum rate of rise in the front wave [5,6,7,8,9]. More specifically, the technical literature has proposed parametric probabilistic distributions for the statistical characterization of the aforementioned lightning parameters, which were also adopted in the IEEE Std. 1410 [10]. In the IEEE Std. 1410, a statistical procedure is proposed to infer the lightning performance in terms of the flashover rate, which is the expected number of annual insulation flashovers per 100 km per year occurring on the distribution line. In the IEEE Std. 1410 [10], the flashover rate is evaluated based on the Rusck formula [11]. This formula allows the evaluation of the peak values of the lightning-induced voltage only for the case of the lightning current modeled as a step-function current. In order to face more realistic current waveshapes, numerical models that make use of Monte Carlo techniques have been proposed [4]. They require many iterations to provide accurate results; hence, these tools are not easy to manage due to the required computational burden. Numerical methods, able to reduce the required computational effort related to the use of the Monte Carlo technique, have been recently proposed [12]. On the other hand, efforts have been made to propose accurate analytical solutions able to reproduce more accurate current waveshapes [13,14,15], thus overcoming the problems related to the computation effort.
Aim of this paper is the statistical characterization of the lightning-induced voltages on distribution lines. To this aim, peak values of the induced voltages are evaluated by means of analytical solutions and, specifically, by means of the Andreotti et al. exact solutions (AESs) [13,14,15]. The solutions refer to a horizontal conductor, placed over an infinite-conductivity ground, excited by an external field produced by either a step-function or a linearly-rising current, moving unattenuated and undistorted along a vertical lightning channel (Figure 1). The main contribution of this paper is the use of analytical formulations (more specifically, the exact ones [13,14,15]) for the statistical characterization of the peak-induced voltages, whose inputs were typical parameters of the lightning current. A further contribution is the identification of parametric distributions able to describe the statistical behavior of the induced voltage. Values of the parameters of such distributions are provided, which can be used as reference for future statistical evaluations. Thanks to the analytical formulations, a further contribution is given to statistically characterize the induced voltages in the presence of a mitigation procedure (use of an overhead ground wire) [16,17,18].
The paper is organized as follows. The AESs are briefly reviewed in Section 2. Section 3 describes the method used for the statistical analysis. Section 4 reports the results of the numerical applications. Conclusions are drawn in Section 5.

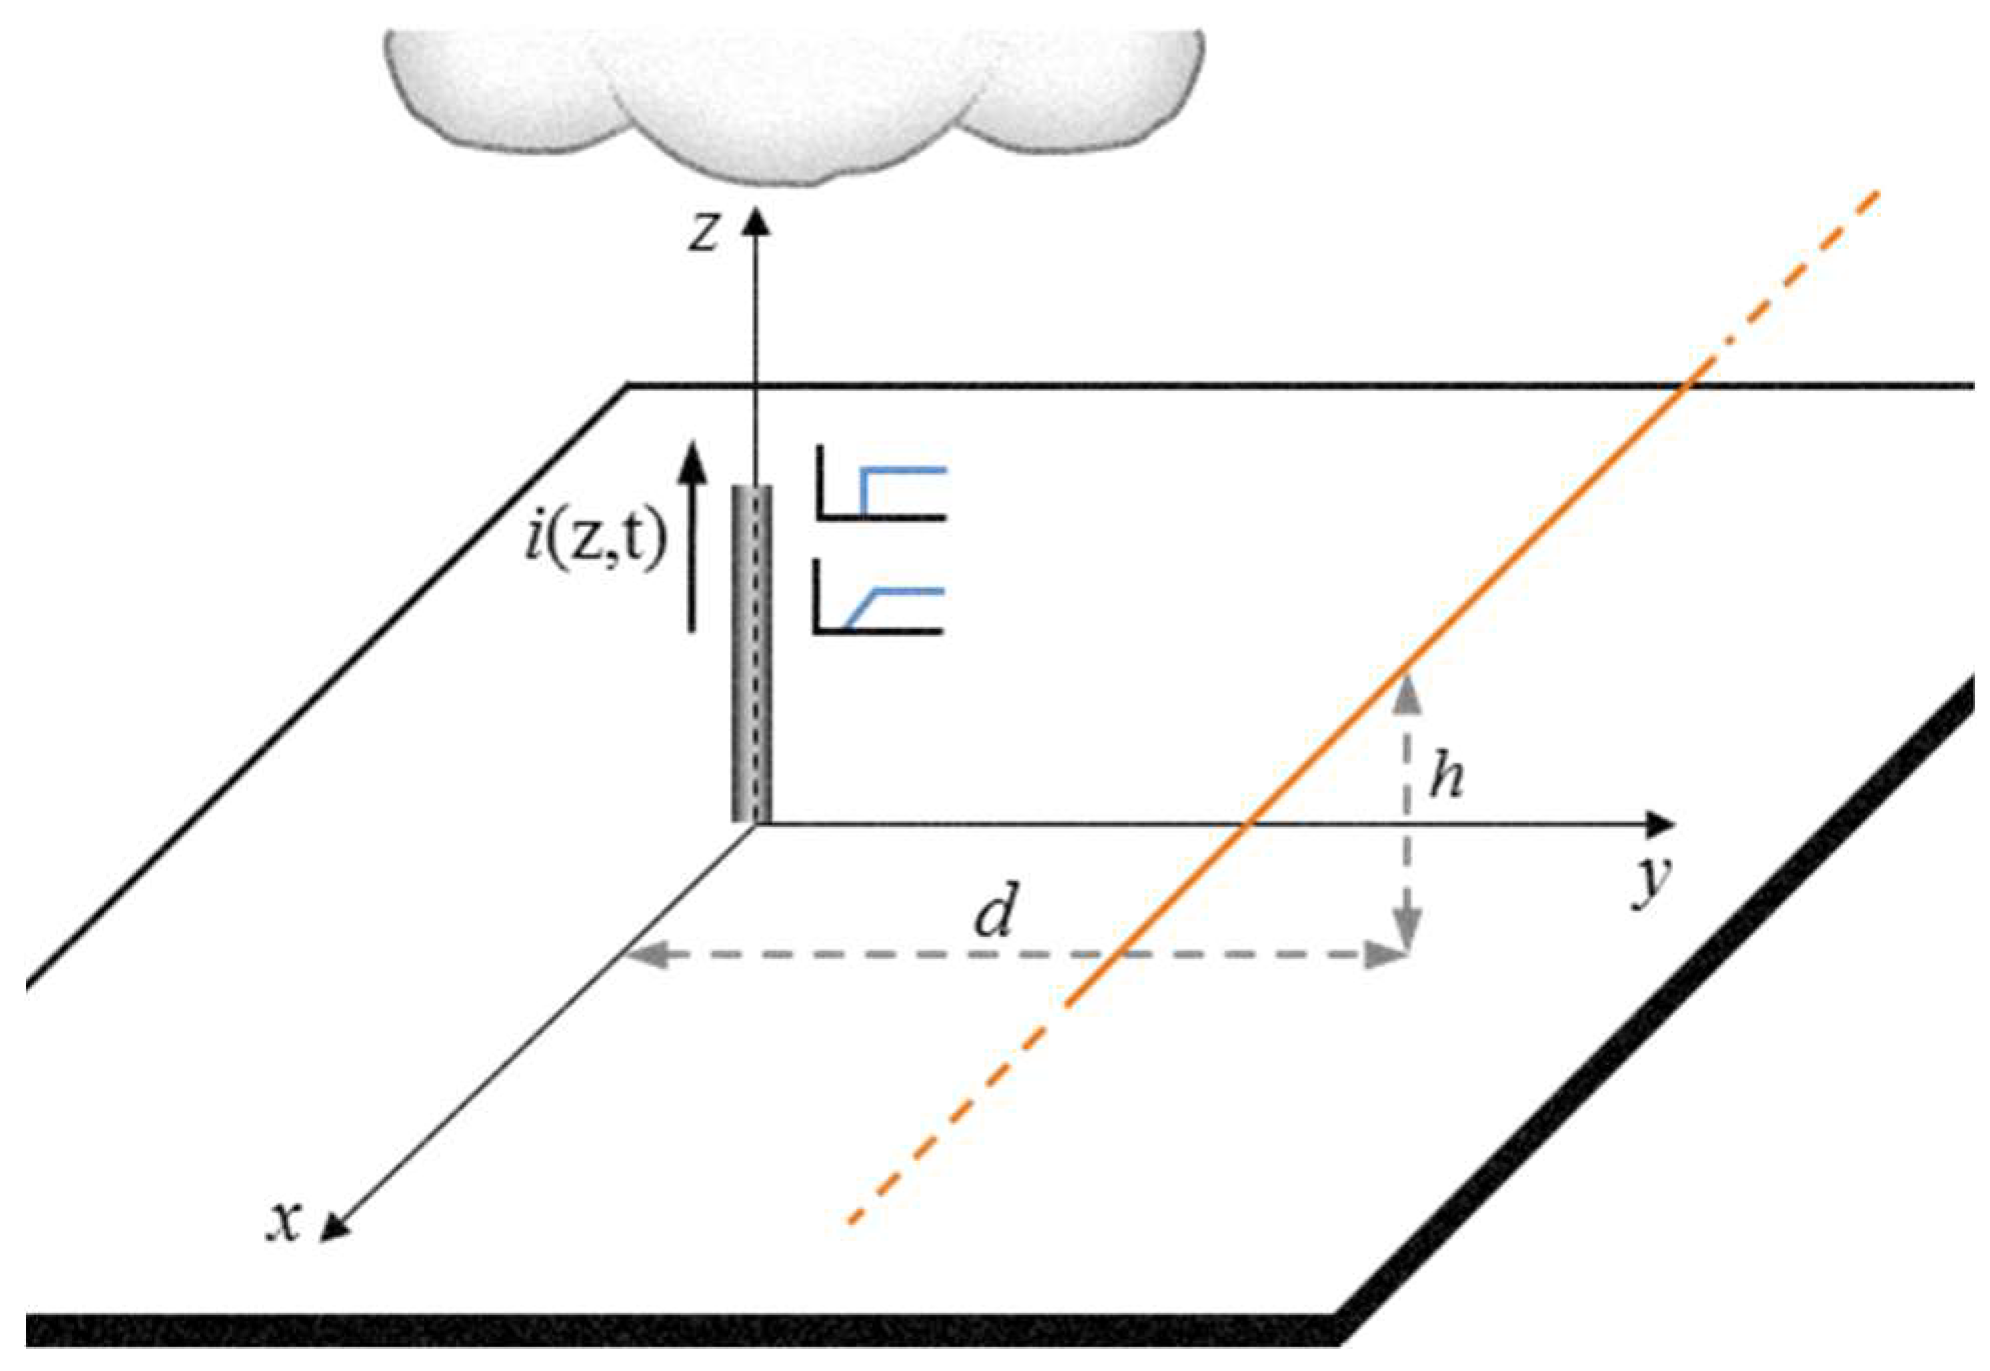
2. Lightning-Induced Voltage: AESs

In this section, AESs are briefly reviewed. The step-function current case is analyzed in Section 2.1, and the linearly-rising current case is discussed in Section 2.2.

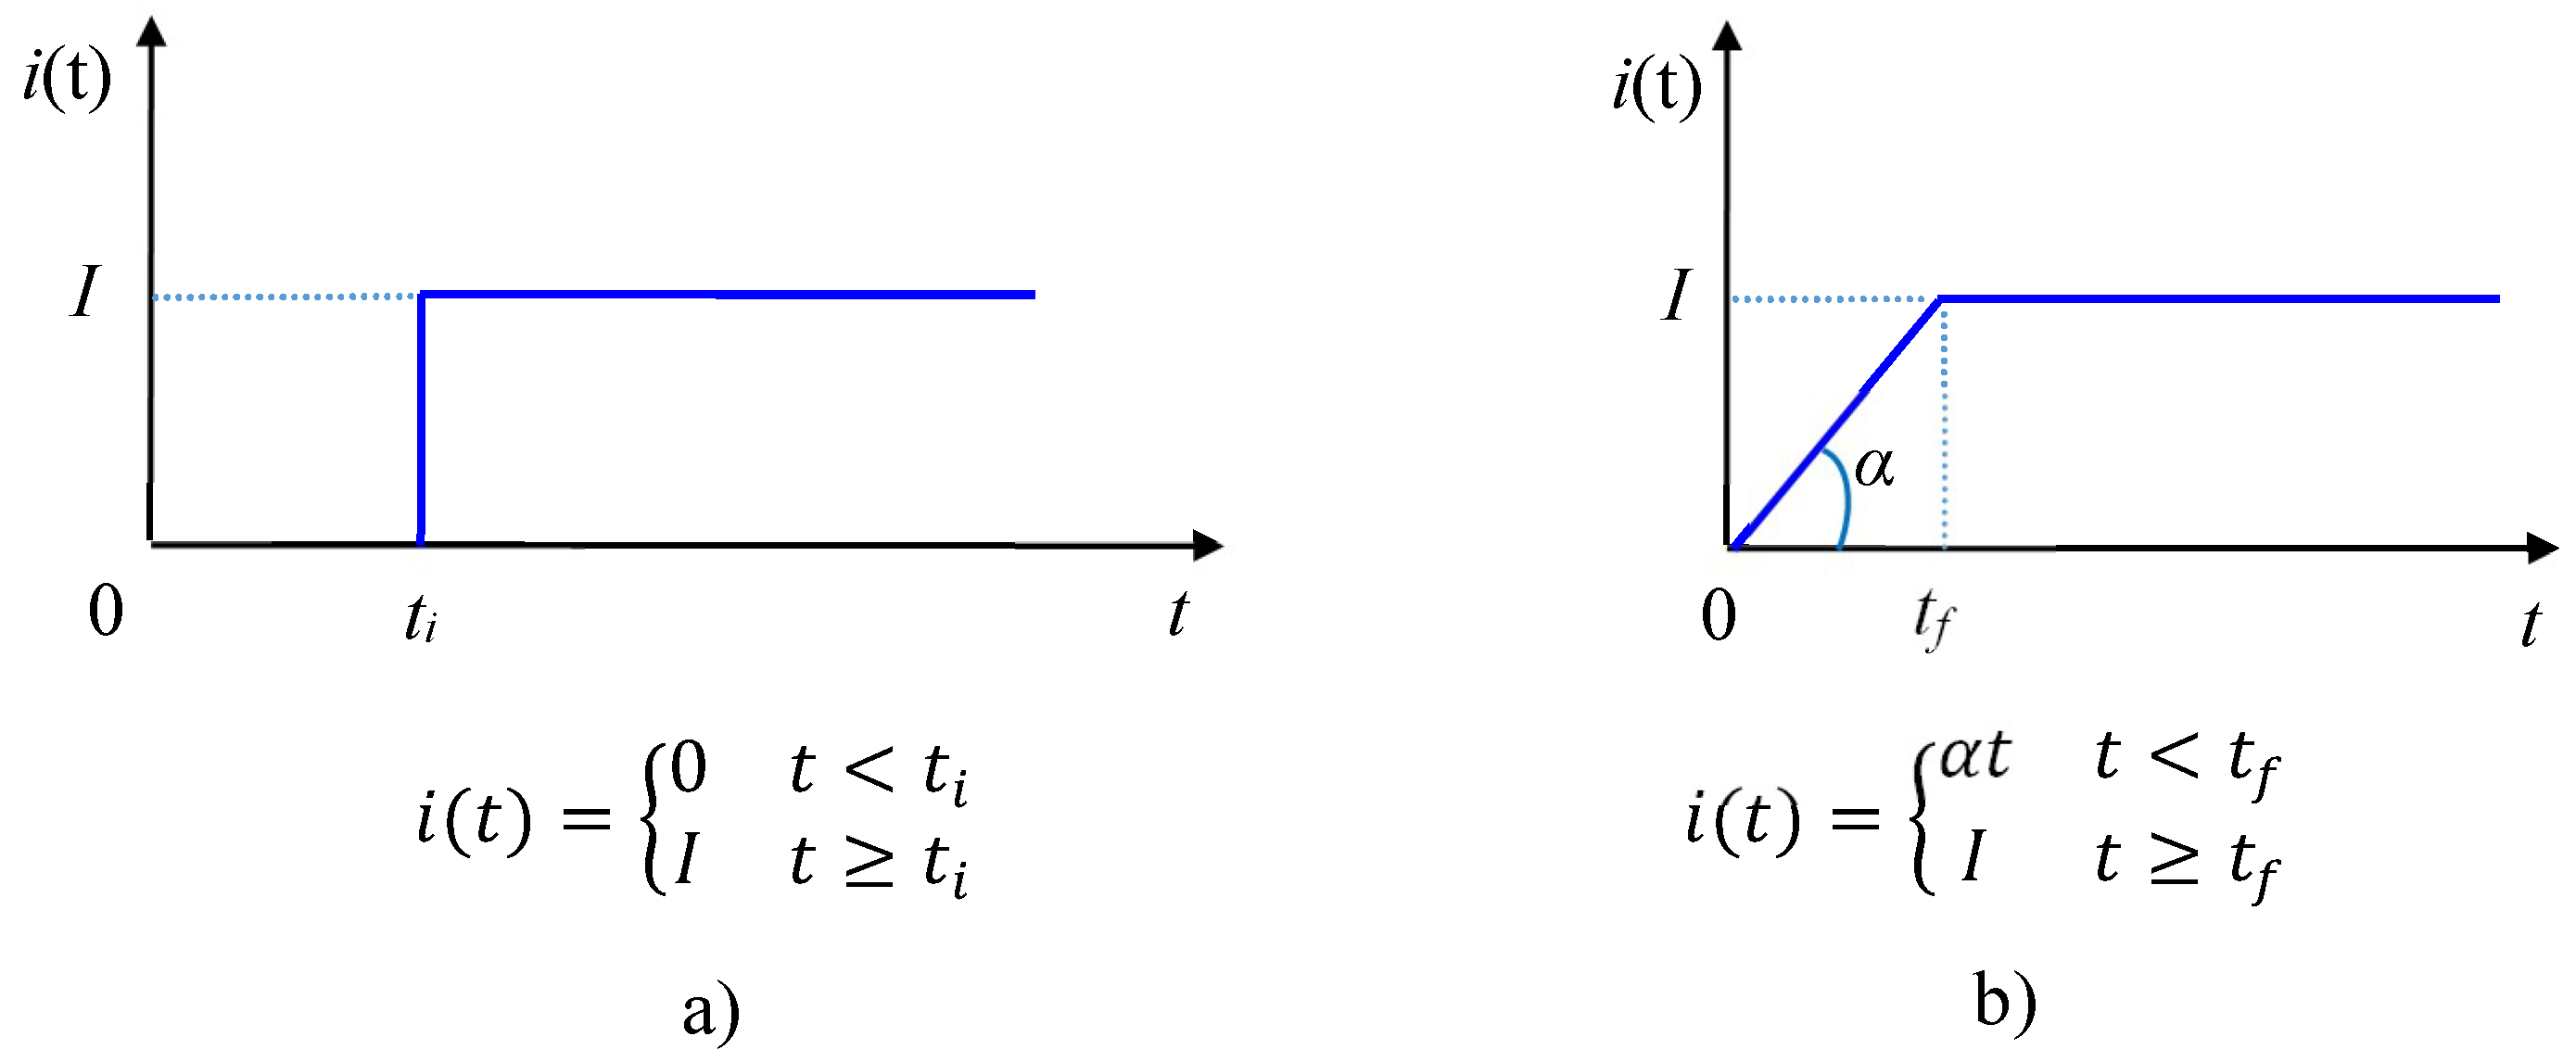
2.1. Step-Funcion Current

In the case of the step-function current (Figure 2a), the exact analytical solution was derived in [13,15]. With reference to the geometry of Figure 1, for x = 0, namely the point closest to the lightning channel, the solution reads as follows:
v ( 0 , t ) = ζ 0 4 π I [ v 1 ( h ) v 1 ( h ) ] ,
with
v 1 ( h ) = l n [ β ( β c t h ) + ( β c t h ) 2 + d 2 / γ 2 ] β l n [ ( β c t h ) + ( β c t h ) 2 + d 2 / γ 2 ] .
where ζ 0 is the free space characteristic impedance, I is the peak value of the return stroke current (Figure 2a), β is the ratio between the return stroke speed and light speed (c), t is the time, h is the line height, d is the line to stroke distance, and γ = 1 / 1 β 2 . Equation (1) is valid for t > t 0 , where t 0 = d 2 + h 2 / c , with the symbols’ meaning inferable by Figure 1. In Figure 3a, an example of induced voltage due to the step-function current at x = 0 ( h = 10 m, d = 50 m, I = 10 kA, β = 0.4) is shown.

2.2. Linearly-Rising Current

In the case of the linearly-rising current, the adopted model can be seen in Figure 2b. The exact analytical solution for this case was derived in [14]. With reference to the geometry of Figure 1, for x = 0, the solution reads as follows:
v ( 0 , t ) = ζ 0 4 π α c [ v 1 ( t , h ) v 1 ( t 0 , h ) v 1 ( t , h ) + v 1 ( t 0 , h ) ] ,
with
v 1 ( t , h ) = { ( β c t h ) { l n ( β c t h + ( β c t h ) 2 + d 2 / γ 2 )                                                           + 1 β [ l n ( β ( β c t h ) + ( β c t h ) 2 + d 2 / γ 2 ) 1 ] }                                                                                                         + d β [ a t a n ( β c t h d ) a t a n ( β d ( β c t h ) 2 + d 2 / γ 2 ) ]                                                                                                                           ( β c t h ) 2 + d 2 / γ 2 }
In (2), α is the current rate-of-rise for the linearly-rising current waveform ( α = I / t f ). In Figure 3b, an example of induced voltage due to a linearly-rising current at x = 0 ( h = 10 m, d = 50 m, I = 10 kA, t f = 0.5 μs, β = 0.4) is shown.

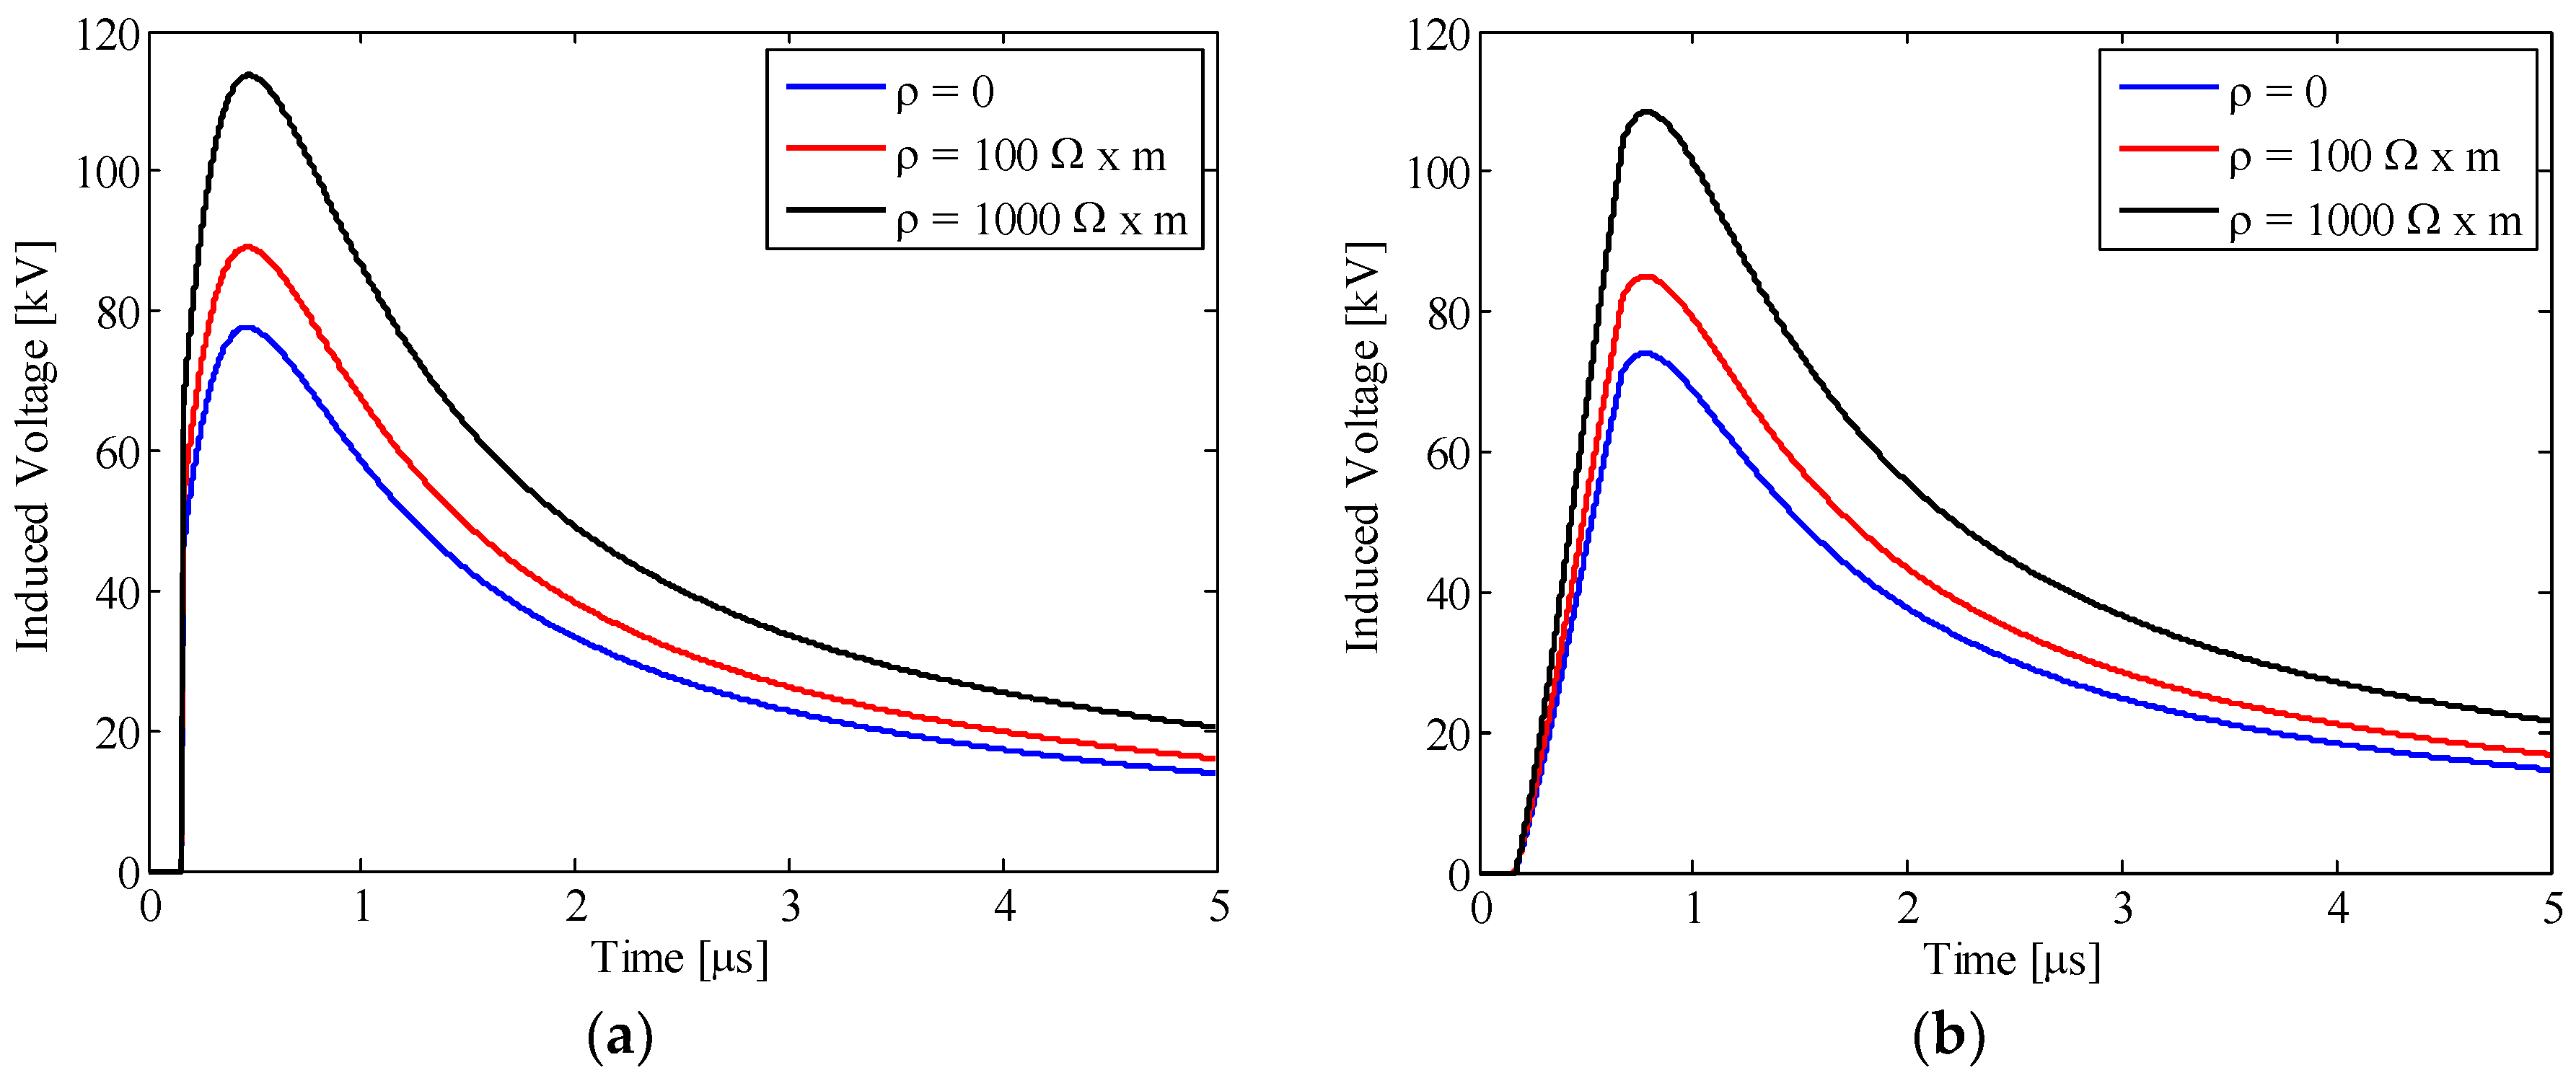
2.3. Finite Conductivity Ground Effects and Countermeasures to Mitigate the Induced Overvoltages

Darverniza [19] presented an empirical formula for the calculation of the peak values of the induced voltages at x = 0, which was derived from experimental data, theoretical considerations, and values obtained from computational simulations. Darveniza’s formula can be an extension of Equations (1) and (2), but in this case the actual height of the line is replaced by an “effective” value that accounts for the ground conductivity. This effective height is given by
h e f f = h + 0.15   ρ ,
where ρ is the ground resistivity.
In Figure 4, as an example, the effects of the ground conductivity on the induced voltage are shown. The waveforms have been obtained by using (3) in (1) and (2).
As for the main countermeasures to mitigate the induced overvoltage, they are as follows: (i) improvement of the critical flashover voltage (CFO) of the line; (ii) use of surge arresters; and (iii) use of ground wire(s). We will focus our attention on the last one. The presence of ground wire(s) allows us to reduce the induced voltage on the phase conductor(s) [11,16,20]. For the case of a line equipped with a ground wire, which is earthed at only one point, the general formulation for the induced voltage evaluated at the grounding connection is [17,18]
v a = v a Z b a Z b b + 2 R b · v b ,
where b denotes the ground wire, v a the voltage induced on the considered conductor, v a the voltage that would be induced in the same conductor by removing the ground wire(s), v b the voltage induced in the ground wire, R b is the grounding resistance, Z b a is the mutual surge impedance of ground wire b and the phase conductor a , and Z b b is the self-surge impedance of the overhead ground wire b (see [11] for more details).
The extension to the case of multiple earthing (e.g., earthing at every pole) can be obtained by selecting a lower effective earth resistance and verifying that the front time of the induced voltages is much longer than the distances between the poles [11].
In Figure 5, the effect of a 16 mm2 ground wire placed 1 m above the line conductor (i.e., at a height of 11 m) and earthed only at x = 0 is shown for different values of the grounding resistance.

3. Statistical Characterization of the Lightning Parameters

The lightning performance of distribution lines has to be assessed taking into account the statistical variations of lightning parameters. In this paper, the statistical characterization of the peak values of the induced voltage ( V p e a k ) is proposed assuming the following current parameters as random variables, which are considered as independent statistical parameters:
the current peak I and the distance d in the case of the step-function current, and
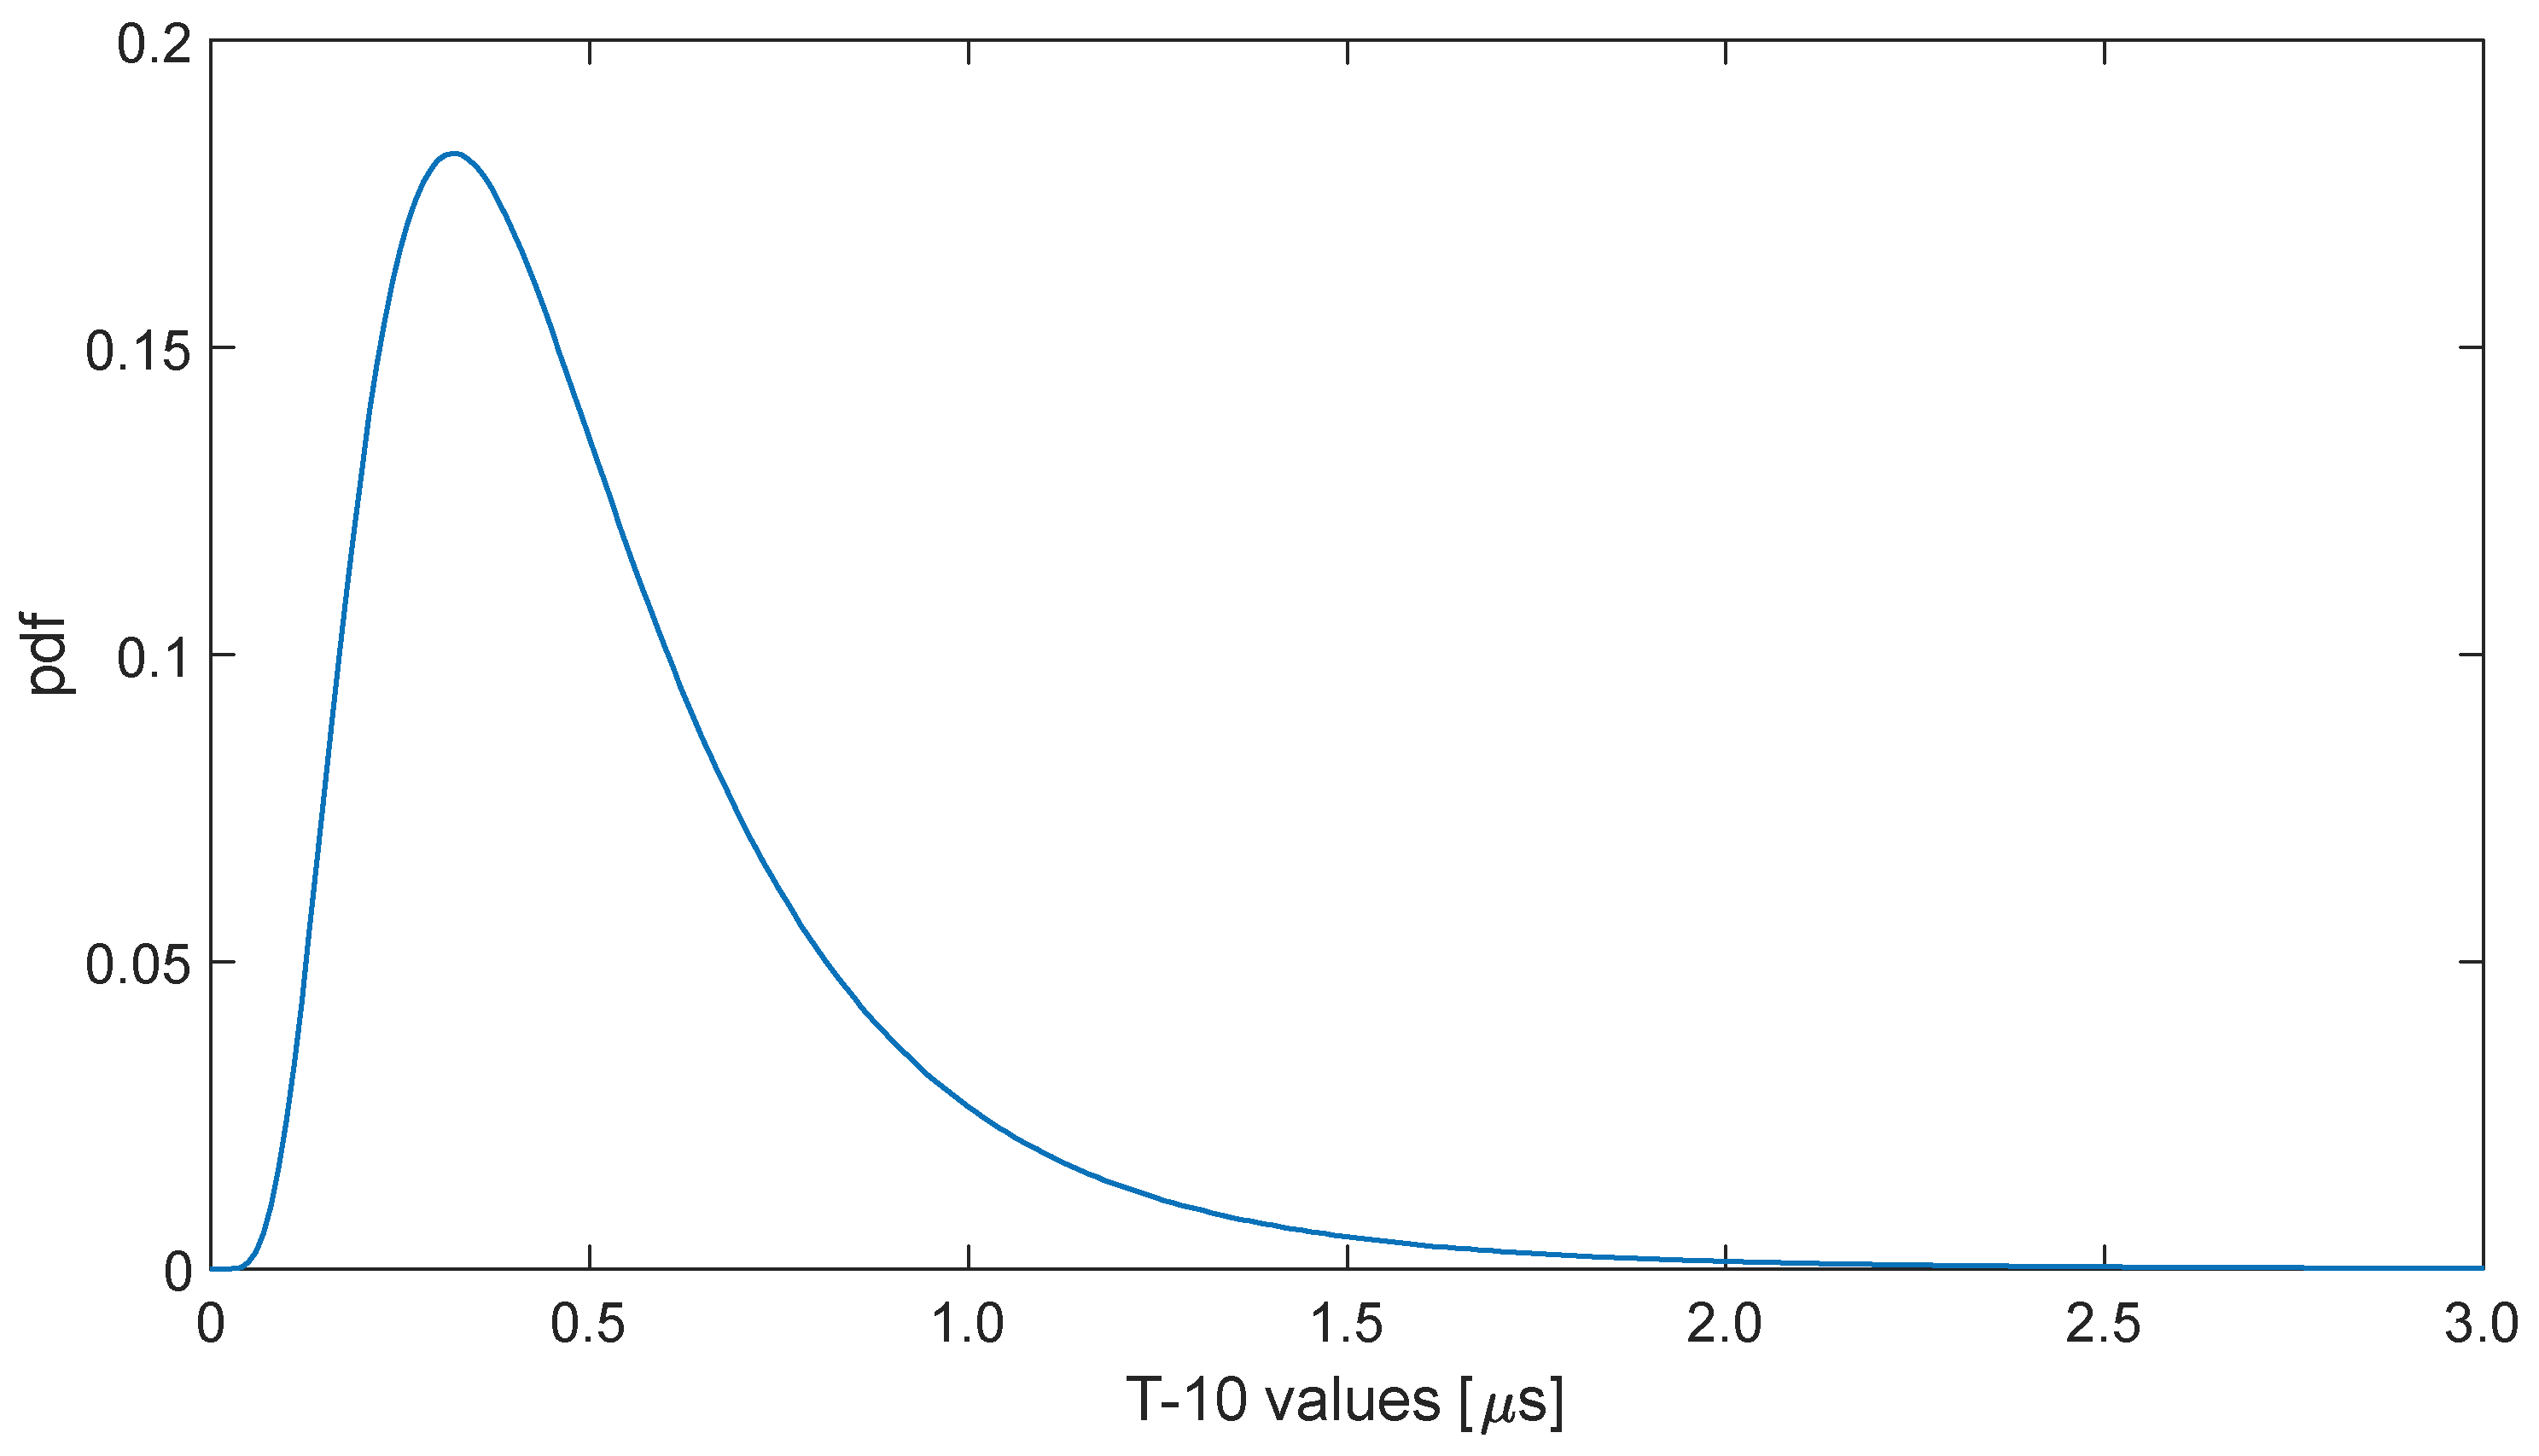
the above two variables along with front time t f , which is provided in terms of T-10 ( t f = T-10/0.8) [10], in the case of the linearly-rising current.
In the relevant literature, approximations by typical probability distributions are proposed to describe the statistical behavior of the lightning parameters. More in detail, I is assumed to have a lognormal (LN) distribution. An LN distribution is assumed for parameter T-10 [8] as well; d can be assumed to be uniformly distributed. The parametric distributions used for the input current parameters, along with their density functions, and the values of the corresponding parameters [8] are reported in Table 1.
For the probabilistic characterization of V p e a k , (1) and (2) are evaluated within a Monte Carlo iterative procedure, whose inputs are extractions of the aforementioned random variables from their parametric distributions and whose outputs are the values of V p e a k obtained by iteratively applying (1) and (2). Thus, the Monte Carlo procedure allows obtaining a distribution of values of V p e a k . The distributions of V p e a k data, obtained by the iterative procedure, are then analyzed and fitted with parametric distributions. To evaluate the goodness of fit, two methods have been used, namely the log likelihood [21] and the determination coefficient [22]. The results obtained by the application of the procedure are reported in Section 4.
As an example of inputs of the Monte Carlo procedure, Figure 6 and Figure 7 show the probabilistic density functions (pdfs) of the distributions used for the peak current and the T-10, whose parameters’ values are presented in Table 1.

4. Numerical Applications

In this section, a statistical analysis is proposed, aimed at evaluating the statistical behavior of the induced voltage peak values, with specific reference to first strokes. In what follows, the results of the analysis are reported with reference to both AESs discussed in Section 2. The Monte Carlo procedure was carried out with 10,000 iterations.

4.1. Step-Function Current

The statistical analysis was carried out with reference to several values of β ranging from 0.2 to 0.4. In Figure 8, the distributions of V p e a k , corresponding to five different values of β are shown. Note that a few occurrences of the extracted data of V p e a k take on values higher than 300 kV that are not shown in the figure.
It is apparent in Figure 8 that the variation of β has a weak influence on the statistical behaviour of the induced voltages. For this reason, in what follows, the results of the statistical characterization of the induced voltages are reported with reference to β = 0.3. The following fitting analysis led to two distributions that, among those analyzed, seem the best fit: the LN distribution and the generalized extreme value (GEV).
The LN distribution’s pdfs and their parameters have been already presented in Table 1. As to the GEV, it is a three-parameter distribution (location parameter μ , scale parameter σ , and shape parameter k     0 ) whose pdf is as follows:
y = f ( x | k ,   μ , σ ) = 1 σ e ( ( 1 + k x μ σ )   1 k ) ( 1 + k x μ σ ) 1 1 k .
The results of the fitting are summarized in Table 2, where the parameters’ estimates, along with the result of the two methods used for evaluating the goodness of fit, are reported. Figure 9 shows the pdfs of the selected distributions as fitting functions, along with the distribution of the extracted data. Figure 10 shows the corresponding cumulative density functions (cdfs).
The analysis of the results reveals that both distributions seem to be suitable as reference parametric distributions for characterizing the lightning-induced voltage peak values; although, the LN underestimates the distribution’s peak value. The log likelihood analysis gave similar values for the two distributions, and the determination coefficient is very close to 1 in both cases.

4.2. Linearly-Rising Current

By adopting the linearly-rising current model, the statistical analysis was carried out by introducing a further random variable, namely the rising time T-10. In this case, the LN distribution parameters reported in [8] were used, namely median 4.5 and σ l o g = 0.25 (expressed in terms of the base 10).
The distribution of V p e a k is shown in Figure 11 for each value of β .
Figure 11 clearly shows that the results are similar to those obtained in the case of the step-function model. In this case too, the statistical characterization was carried out for β = 0.3. Among the analyzed parametric distributions, it appeared that the two distributions that seemed to best fit the data distributions were, again, the GEV and the LN. For each of them, the log likelihood and the determination coefficient were evaluated. The resulting values, along with the parameters’ estimates corresponding to the two distributions, are reported in Table 3. Figure 12 shows the pdfs of the parametric distributions selected as fitting functions along with the distribution of the extracted values. Figure 13 shows the corresponding cdfs.
The analysis highlights that goodness of fit in the linearly-rising current case is even better than that of the step-function. This can be observed in both the values of the log likelihood and determination coefficient reported in Table 3.
Figure 12 and Figure 13 also show a good fitting. Particularly, this is confirmed in Figure 13, where the cdfs of the parametric distributions practically overlap those obtained by the Monte Carlo procedure.

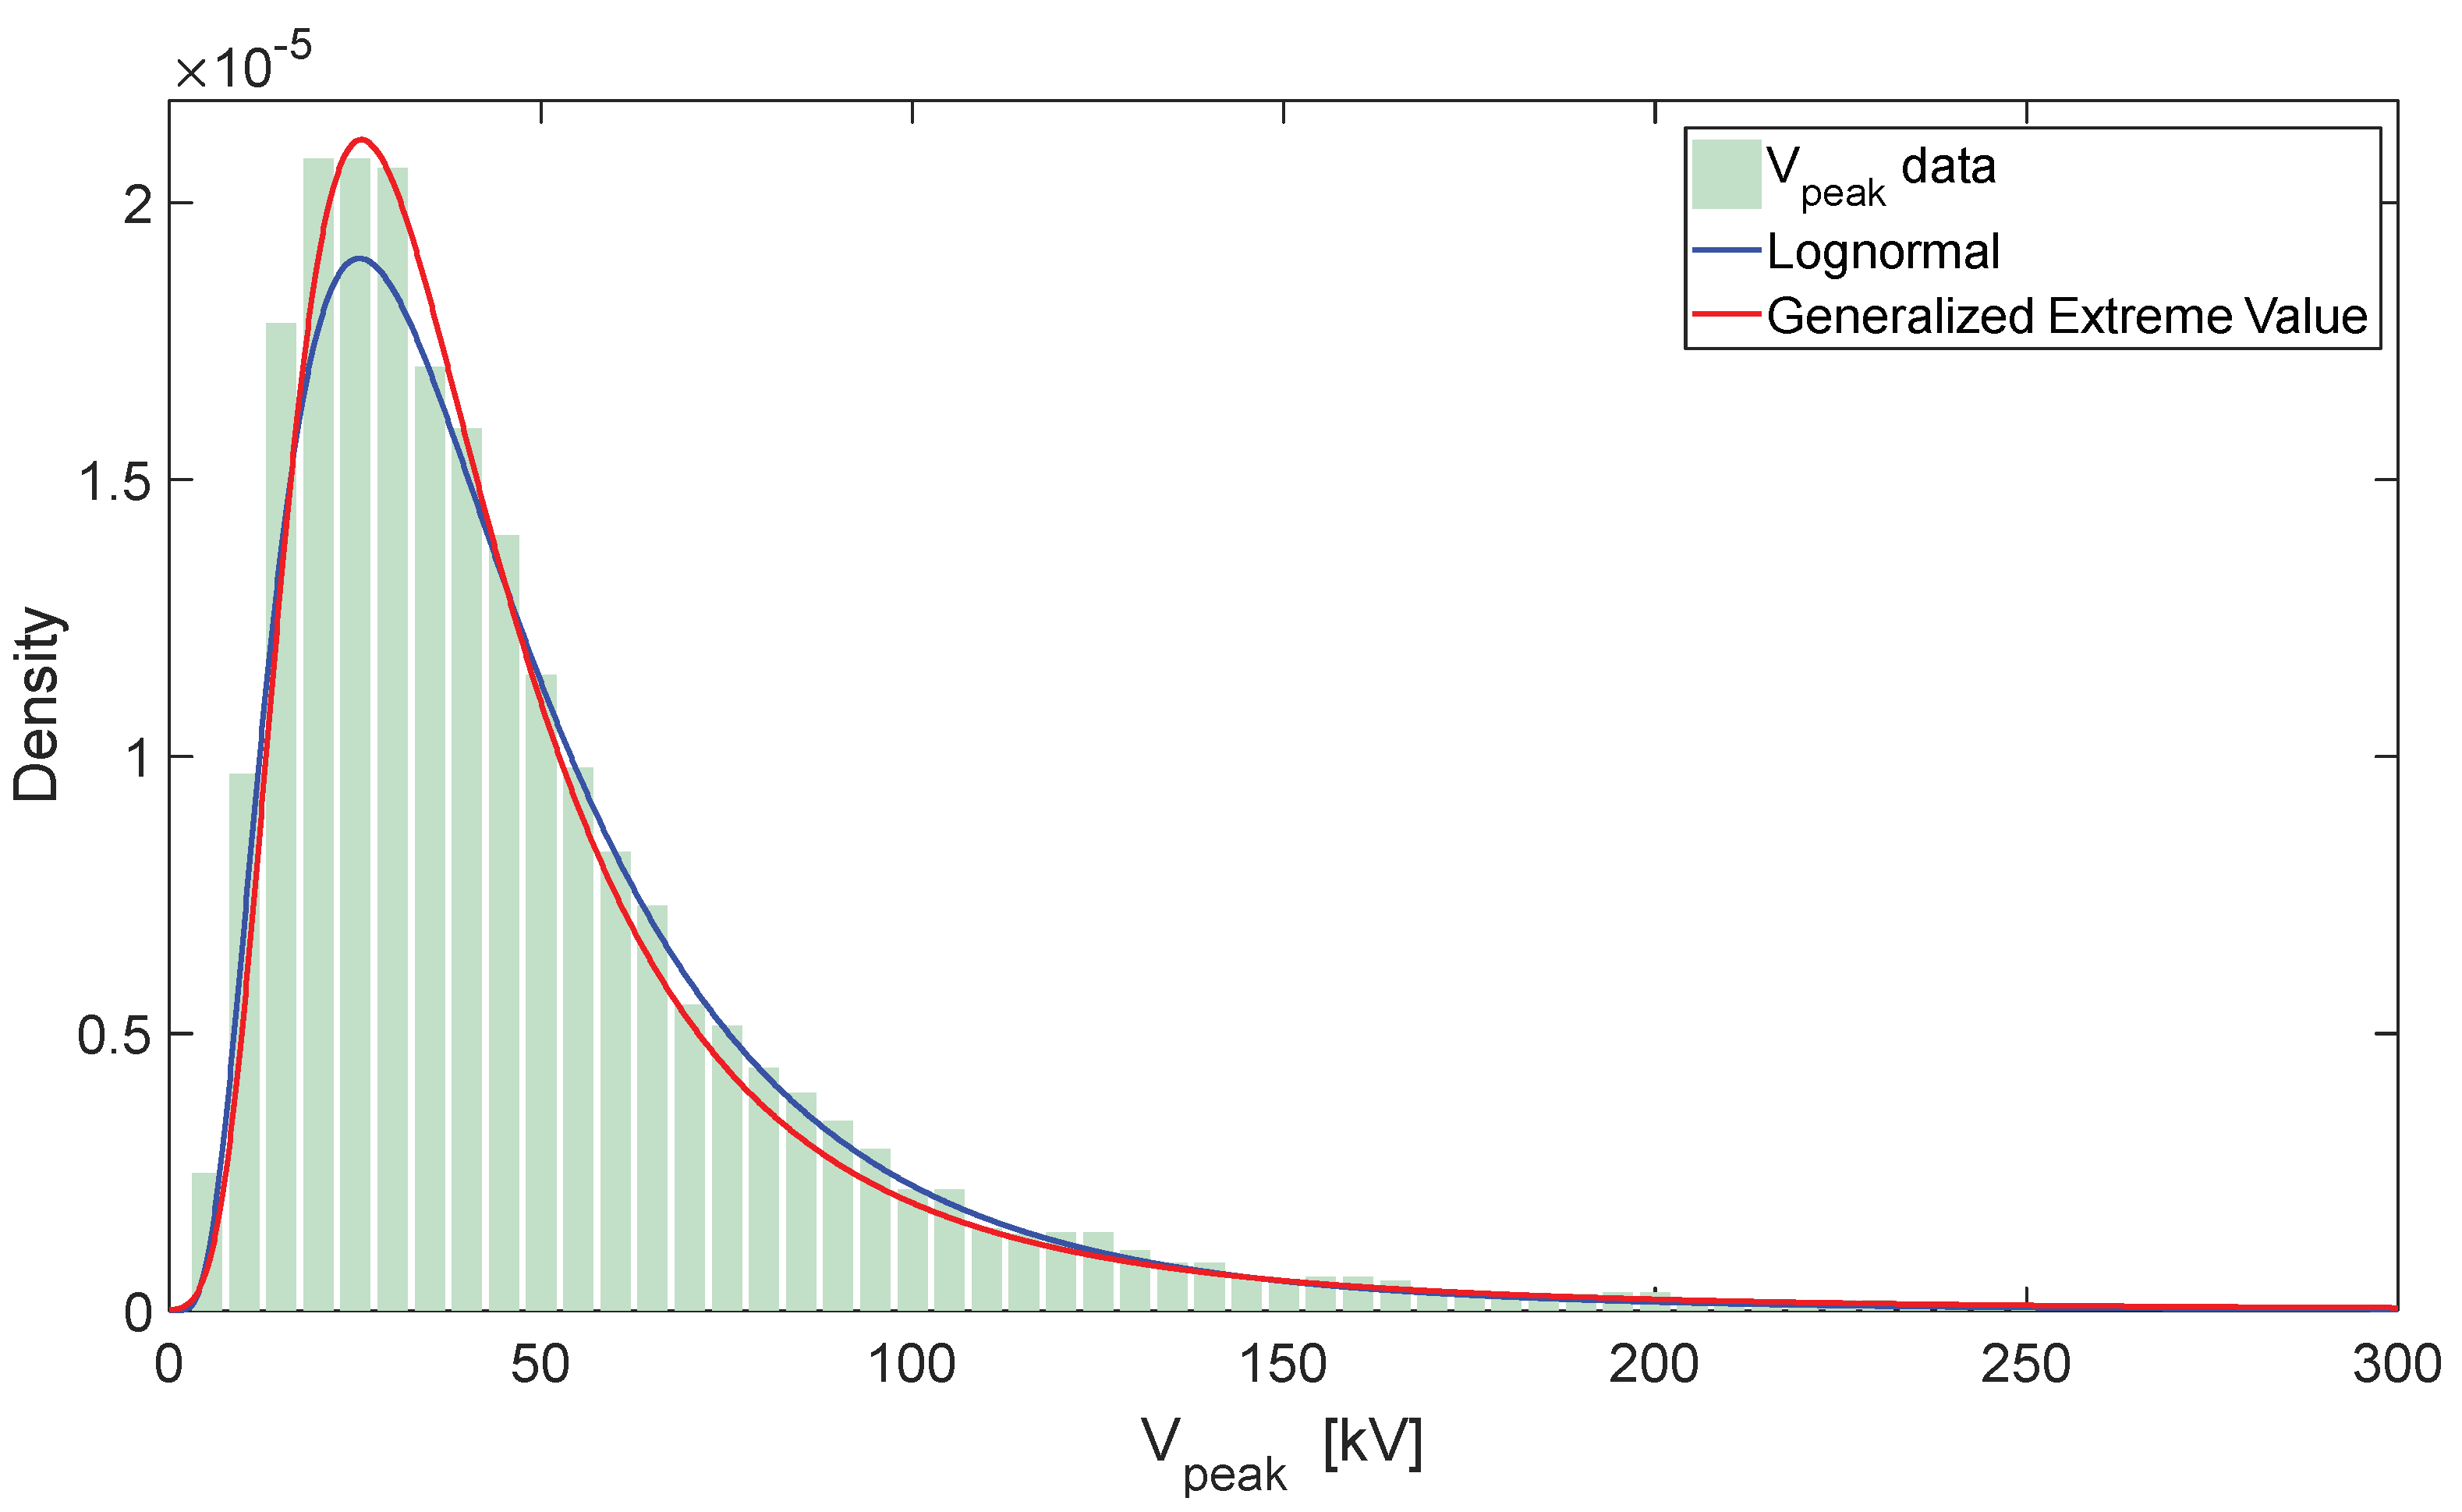
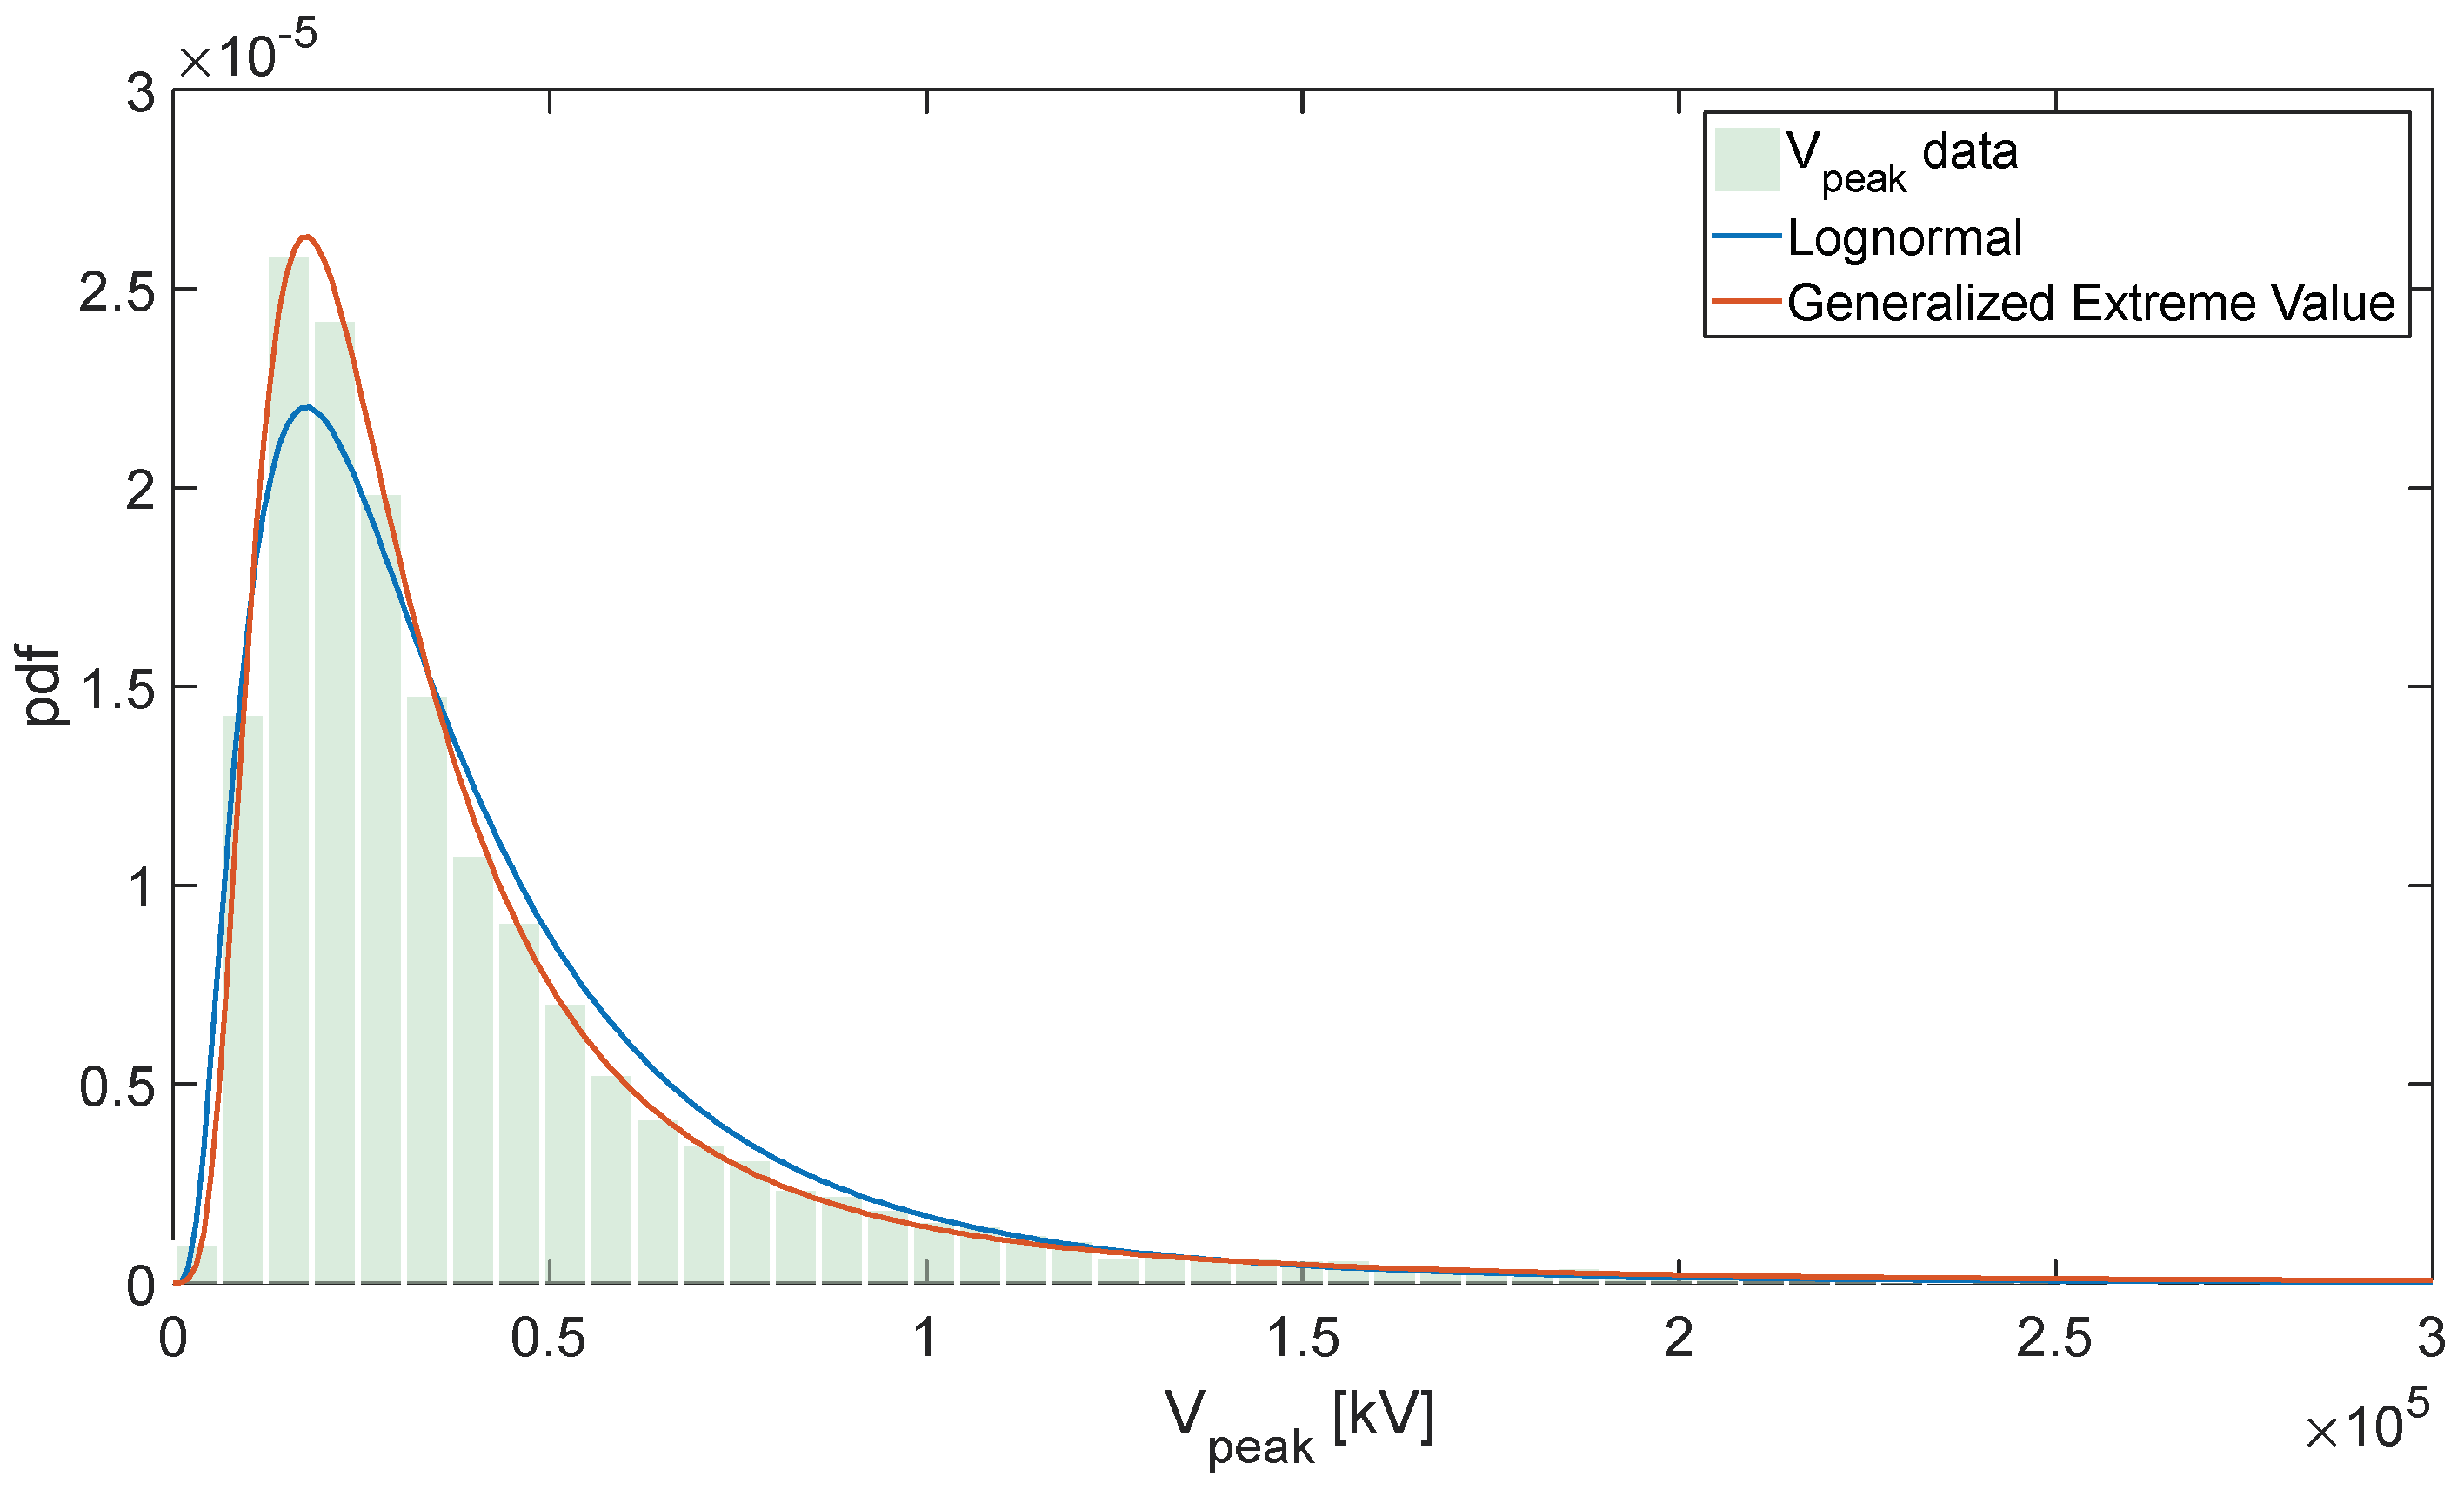
4.3. Comparison with Experimental Data

The proposed procedure was applied to a power line for which experimental overvoltage data are reported in [23], where the results referring to some lightning events are reported in terms of peak values of the induced overvoltages. Despite the limited number of events registered in [23], as well as the lack of details regarding some input data (such as line-to-stroke distance), a qualitative comparison between the reported experimental data and the results of the proposed procedure applied to this power line was attempted in this section. Figure 14 shows the distribution of the experimental induced voltages reported in [23] (Figure 14a) and of those that resulted from the application of the proposed procedure (Figure 14b).
The experimental line is identical to the Standard Tampa Electric Company single-phase distribution line [23]. In the proposed application, the phase conductor’s height is assumed to be 10 m, whereas the neutral conductor’s height is 9 m with ground resistance of 20   . Both conductors are assumed to have a cross-section of 16 mm2.
Both Figure 14a,b refer to first-stroke events. Note that Figure 14a refers to the number of events collected in the experimental test reported in [23]; Figure 14b refers to the 10,000 samples of the Monte Carlo procedure. By the comparison of the figures, it appears that the distribution of theoretical induced voltages reproduces the experimental data reasonably well.

4.4. Effect of the Countermeasures to Mitigate the Induced Overvoltages

Further simulations were performed by introducing an overhead ground wire as a countermeasure to mitigate the induced overvoltages. The ground wire’s height is 11 m and grounding resistance is 20 . Again, the statistical characterization was carried out for β = 0.3 and by using both the step-function current model 1 and the linearly-rising current model 2. In both cases, the presence of the ground wire has been taken into account through Equation (4).
Figure 15 shows the distribution of the extracted values of V p e a k and selected fitting parametric pdfs in the case of the step-function current model. The resulting values, along with the parameters’ estimates corresponding to the two distributions, are reported in Table 4.
Figure 16 shows the distribution of the extracted values of V p e a k and selected fitting parametric pdfs in the case of the linearly-rising current model. Table 5 reports the resulting values, along with the parameters’ estimates corresponding to the two distributions.
In this case too, the selected fitting distributions seem to reproduce the data distribution reasonably well. The effect of the countermeasure is apparent in terms of the mitigation of the induced overvoltages.

4.5. Discussions of the Results

The results obtained in both of the case studies revealed slightly different performance of the two fitting distributions. It can be noted that in the case of the step-function current model, the GEV seems to have a slight better performance in reproducing the distribution of the data. In the case of the linearly-rising current model, the GEV is able to reproduce quite accurately the higher values of the distributions, whereas a better performance can be observed for the LN in reproducing the whole waveshape. This can be explained if one considers that the GEV is based on three parameters, whereas the LN is a two-parameter distribution.
The results of the case study, including the ground wire as countermeasure, also indicated the good performance of the selected parametric distributions for the fitting of the induced voltage data. By observing the values of the determination coefficient (which give an immediate idea of the goodness of fitting when assuming values close to 1), it is clear that the performance of the fitting is even better in this case than in the case of the power line without the ground wire. This allows us to consider still valid the use of parametric distributions even in the case of more realistic power line configurations where the induced overvoltages can be limited by using appropriate countermeasures.
In conclusion, both the proposed distributions can be considered as good references for the statistical characterization of the lightning-induced voltage peak values.

5. Conclusions

This paper focuses on the statistical characterization of lightning-induced voltage peak values; the analysis was carried out by means of a Monte Carlo procedure applied to analytical formulations, namely Andreotti et al. exact solutions. Use of analytical formulations for the evaluation of the peak-induced voltage allowed overcoming the problems related to the computation effort that typically characterizes Monte Carlo procedures.
The analysis has led to the identification of parametric distributions that seem to fit quite accurately the distribution obtained by the Monte Carlo procedure. Specifically, in this paper, we have focused on two parametric distributions, namely lognormal and generalized extreme value. The analysis was carried out in both the cases of power lines with and without ground wire, which was adopted as a countermeasure to limit overvoltages. Both distributions seem to reproduce quite accurately the statistical behavior of the lightning-induced voltage peak values. In order to better evaluate the feasibility of the proposed procedure, a qualitative comparison with some experimental data available in the literature, was performed. The comparison in terms of the distribution of peak values of the induced voltages showed the good performance of the applied method, even if only a limited number of experimental data were available. Future work will focus on further validations by means of more significant number of lightning historical data.

Author Contributions

Amedeo Andreotti, Fabio Mottola, Antonio Pierno and Daniela Proto conceived and designed the applications; Amedeo Andreotti, Fabio Mottola, Antonio Pierno and Daniela Proto performed the applications; Amedeo Andreotti, Fabio Mottola, Antonio Pierno and Daniela Proto analyzed the data; Amedeo Andreotti, Fabio Mottola, Antonio Pierno and Daniela Proto contributed analysis procedures; Amedeo Andreotti, Fabio Mottola, Antonio Pierno and Daniela Proto wrote the paper.

Conflicts of Interest

The authors declare no conflict of interest.

References

  1. Zaini, N.H.; Ab Kadir, M.Z.A.; Mohd Radzi, M.A.; Izadi, M.; Azis, N.; Ahmad, N.I.; Nasir, M.S.M. Lightning surge analysis on a large scale grid-connected solar photovoltaic system. Energies 2017, 10, 2149. [Google Scholar] [CrossRef]
  2. Shaban, M.; Salam, M.A.; Ang, S.P.; Voon, W. Induced sheath voltage in power cables: A review. Renew. Sustain. Energy Rev. 2016, 62, 1236–1251. [Google Scholar] [CrossRef]
  3. Becerra, M.; Long, M.; Schulz, W.; Thottappillil, R. On the estimation of the lightning incidence to offshore wind farms. Electr. Power Syst. Res. 2018, 157, 211–226. [Google Scholar] [CrossRef]
  4. Sarajcev, P.; Vasilj, J.; Jakus, D. Monte–Carlo analysis of wind farm lightning-surge transients aided by LINET lightning-detection network data. Renew. Energy 2016, 99, 501–513. [Google Scholar] [CrossRef]
  5. Anderson, R.B.; Eriksson, A.J. Lightning parameters for engineering applications. Electra 1980, 69, 65–102. [Google Scholar]
  6. Lightning and Insulator Subcommittee of the T&D Committee. Parameters of lightning strokes: A review. IEEE Trans. Power Deliv. 2005, 20, 346–358. [Google Scholar] [CrossRef]
  7. Fisher, R.J.; Schnetzer, G.H.; Thottappillil, R.; Rakov, V.A.; Uman, M.A.; Goldberg, J.D. Parameters of triggered-lightning flashes in Florida and Alabama. J. Geophys. Res. 1993, 98, 22887–22902. [Google Scholar] [CrossRef]
  8. Berger, K.; Anderson, R.B.; Kroninger, H. Parameters of lightning flashes. Electra 1975, 41, 23–37. [Google Scholar]
  9. Andreotti, A.; Mottola, F.; Pagano, M.; Verolino, L. Lightning induced voltages on power lines: A new statistical approach. In Proceedings of the International Symposium on Power Electronics, Electrical Drives, Automation and Motion (SPEEDAM 2008), Ischia, Italy, 11–13 June 2008; pp. 445–451. [Google Scholar] [CrossRef]
  10. IEEE Guide for Improving the Lightning Performance of Electric Power Overhead Distribution Lines; IEEE Standard 1410; IEEE Power Engineering Society: Piscataway, NJ, USA, 2004. [CrossRef]
  11. Rusck, S. Induced lightning overvoltages on power transmission lines with special reference to the overvoltage protection of low-voltage networks. Trans. R. Inst. Technol. 1958, 120, 1–118. [Google Scholar]
  12. Bendato, I.; Brignone, M.; Delfino, F.; Procopio, R.; Rachidi, F. A methodology to reduce the computational effort in the evaluation of the lightning performance of distribution networks. Atmosphere 2016, 7, 147. [Google Scholar] [CrossRef]
  13. Andreotti, A.; Assante, D.; Mottola, F.; Verolino, L. An exact closed-form solution for lightning-induced overvoltages calculations. IEEE Trans. Power Deliv. 2009, 24, 1328–1343. [Google Scholar] [CrossRef]
  14. Andreotti, A.; Pierno, A.; Rakov, V.A.; Verolino, L. Analytical formulations for lightning-induced voltage calculations. IEEE Trans. Electromagn. Compat. 2013, 55, 109–123. [Google Scholar] [CrossRef]
  15. Andreotti, A.; Rakov, V.A.; Verolino, L. Exact and approximate solutions for lightning-induced voltage calculations. IEEE Trans. Electromagn. Compat. 2018. [Google Scholar] [CrossRef]
  16. Yokoyama, S. Calculation of lightning-induced voltages on overhead multiconductor systems. IEEE Trans. Power Appar. Syst. 1984, 103, 100–108. [Google Scholar] [CrossRef]
  17. Yokoyama, S. Experimental analysis of earth wires for induced lightning surges. IEE Proc. C Gener. Transm. Distrib. 1980, 127, 33–40. [Google Scholar] [CrossRef]
  18. Piantini, A. Lightning protection of low-voltage networks. In Lightning Protection; Cooray, V., Ed.; The Institution of Engineering and Technology: London, UK, 2010; pp. 553–634. ISBN 9780863417443. [Google Scholar]
  19. Darveniza, M. A practical extension of Rusck’s formula for maximum lightning-induced voltages that accounts for ground resistivity. IEEE Trans. Power Deliv. 2007, 22, 605–612. [Google Scholar] [CrossRef]
  20. Rachidi, F.; Nucci, C.A.; Ianoz, M.; Mazzetti, C. Response of multiconductor power lines to nearby lightning return stroke electromagnetic fields. IEEE Trans. Power Deliv. 1997, 12, 1404–1411. [Google Scholar] [CrossRef]
  21. Le Cam, L. Maximum likelihood: An introduction. Int. Stat. Rev 1990, 58, 153–171. [Google Scholar] [CrossRef]
  22. Carta, J.A.; Ramirez, P.; Velazquez, S. Influence of the level of fit of a density probability function to wind-speed data on the WECS mean power output estimation. Energy Convers. Manag. 2008, 49, 2647–2655. [Google Scholar] [CrossRef]
  23. Master, M.J.; Uman, M.A.; Beasley, W.; Darveniza, M. Lightning induced voltages on power lines: Experiment. IEEE Trans. Power Appar. Syst. 1984, PAS-103, 2519–2529. [Google Scholar] [CrossRef]
Figure 1. Lightning-induced voltage model.
Applsci 08 00651 g001
Figure 2. Models adopted for the lightning current: step-function (a); linearly-rising (b).
Applsci 08 00651 g002
Figure 3. Induced voltage at x = 0 ( h = 10 m, d = 50 m, I = 10 kA, β = 0.4) due to: step-function current (a); linearly-rising current (b), with t f = 0.5 μs.
Applsci 08 00651 g003
Figure 4. Induced voltage evaluated at x = 0 in the presence of a lossy ground ( h = 10 m, d = 50 m, I = 10 kA, β = 0.4) due to: step-function current (a); linearly-rising current (b), with t f = 0.5 μs.
Applsci 08 00651 g004
Figure 5. Effect of the ground wire on the induced voltage evaluated at x = 0 (line height h a = 10 m, ground wire height h b = 11 m, d = 50 m, I = 10 kA, β = 0.4) due to: step-function current (a); linearly-rising current (b), with t f = 0.5 μs.
Applsci 08 00651 g005
Figure 6. Probabilistic density function (pdf) of the lightning peak current (parameters presented in Table 1).
Applsci 08 00651 g006
Figure 7. Pdf of the lightning peak current (parameters presented in Table 1).
Applsci 08 00651 g007
Figure 8. Distributions of V p e a k corresponding to different values of β (step function model).
Applsci 08 00651 g008
Figure 9. Distribution of the extracted values of V p e a k and selected fitting parametric pdfs (step function model, β = 0.3).
Applsci 08 00651 g009
Figure 10. Cumulative density functions (cdfs) related to the distribution of the extracted values of V p e a k and of the selected fitting parametric distributions (step function model, β = 0.3).
Applsci 08 00651 g010
Figure 11. Distributions of V p e a k corresponding to different values of β (linearly-rising current model).
Applsci 08 00651 g011
Figure 12. Distribution of the extracted values of V p e a k and selected fitting parametric pdfs (linearly-rising current model, β = 0.3).
Applsci 08 00651 g012
Figure 13. Cumulative density functions related to the distribution of the extracted values of V p e a k and of the selected fitting parametric distributions (linearly-rising current model, β = 0.3).
Applsci 08 00651 g013
Figure 14. Distribution of the experimental induced voltages reported in [23] (a) and of those resulted from the application of the proposed procedure (b).
Applsci 08 00651 g014
Figure 15. Distribution of the extracted values of V p e a k and selected fitting parametric pdfs (step current model, β = 0.3).
Applsci 08 00651 g015
Figure 16. Distribution of the extracted values of V p e a k and selected fitting parametric pdfs (linearly-rising current model, β = 0.3).
Applsci 08 00651 g016
Table 1. Statistical variations of the lightning first stroke parameters.
VariableDistributionDensity FunctionsParametersParameter’s Values
d Uniform y = 1 p 2 p 1           x   [ p 1 ,   p 2 ] p 1 lower endpoint (minimum)
p 2 upper endpoint (maximum)
p 1 = 50
p 2 = 500
I Lognormal y = 1 x σ 2 π e l n ( x μ ) ) 2 2 σ 2 mean m and variance υ
m = e μ + σ 2 2
υ = e ( 2 μ + σ 2 ) e ( σ 2 1 )
with μ and σ the mean and standard deviation, of the associated normal distribution.
μ = 3.44
σ = 0.48
T-10Lognormal y = 1 x σ 2 π e l n ( x μ ) ) 2 2 σ 2 mean m and variance υ
m = e μ + σ 2 2
υ = e ( 2 μ + σ 2 ) e ( σ 2 1 )
with μ and σ the mean and standard deviation of the associated normal distribution.
μ = 1.5
σ = 0.58
Table 2. Results of Fitting.
Fitting Distribution
Generalized Extreme Value
Log LikelihoodDet. Coeff.k σ μ
−119,1490.99890.486523,409.235,382.7
Fitting Distribution
Lognormal
Log LikelihoodDet. Coeff. σ   1 μ   1
−119,2230.9940-0.757910.7806
1 μ and σ are the mean and variance of the associated normal distribution, respectively.
Table 3. Results of Fitting.
Fitting Distribution
Generalized Extreme Value
Log LikelihoodDet. Coeff.k σ μ
−115,8980.99900.3407681834830962.5
Fitting Distribution
Lognormal
Log LikelihoodDet. Coeff. σ 1 μ 1
−115,8970.9984 0.66046710.5856
1 μ and σ are the mean and variance of the associated normal distribution, respectively.
Table 4. Results of Fitting.
Fitting Distribution
Generalized Extreme Value
Log LikelihoodDet. Coeff.k σ μ
−114,8270.99930.48942715,166.923,092.8
Fitting Distribution
Lognormal
Log LikelihoodDet. Coeff. σ 1 μ 1
−114,9410.9945 0.75610310.3548
1 μ and σ are the mean and variance of the associated normal distribution, respectively.
Table 5. Results of Fitting.
Fitting Distribution
Generalized Extreme Value
Log LikelihoodDet. Coeff.k σ μ
−111,6390.99920.33990611,990.620,166.9
Fitting Distribution
Lognormal
Log LikelihoodDet. Coeff. σ 1 μ 1
−111,6310.9986 0.66205310.1567
1 μ and σ are the mean and variance of the associated normal distribution, respectively.

