Article

Camera Calibration with Phase-Shifting Wedge Grating Array

Department of Precision Machinery and Precision Instrumentation, University of Science and Technology of China, Hefei 230026, China
*
Author to whom correspondence should be addressed.
Appl. Sci. 2018, 8(4), 644; https://doi.org/10.3390/app8040644
Submission received: 18 March 2018 / Revised: 18 April 2018 / Accepted: 19 April 2018 / Published: 20 April 2018
(This article belongs to the Section Optics and Lasers)

Abstract

:
Planar targets with known features have been widely used for camera calibration in various vision systems. This paper utilizes phase-shifting wedge grating (PWG) arrays as an active calibration target. Features points are encoded into the carrier phase, which can be accurately calculated using the phase-shifting algorithm. The 2π-phase points are roughly extracted with edge detection and then optimized by windowed bicubic fitting with sub-pixel accuracy. Two 2π-phase lines for each PWG are obtained using linear fitting method. The PWG centers that are used as feature points are detected through computing the intersections of 2π-phase lines. Experiment results indicate that the proposed method is accurate and reliable.

Graphical Abstract

1. Introduction

Camera calibration has been extensively studied for few past decades, which attempts to determine the intrinsic and extrinsic parameters of cameras [1,2,3]. Through capturing calibration targets with known features, one can acquire an exact set of one-to-one correspondences between the world and the image coordinates. Camera parameters are then estimated from these correspondences. Thus, the feature detection will directly affect the calibration accuracy. Numerous studies have focused on developing patterns with distinctive features that can be accurately localized in the images [4]. Among various existing patterns, squares [5,6,7,8], and circles [9,10,11,12] have become popular due to their ease of use. In order to avoid the influence of the fabrication to the calibration results and further simplify the calibration procedures, the digital displays have been applied to the camera calibration, which provide an alternative way for planar targets [13,14,15,16,17,18,19].
When compared with the conventional calibration object (a planar target marked by printed patterns), digital displays have many advantages, including adjustable brightness, guaranteed flatness, and known pixel sizes in spite that they may be more expensive and inconvenient to move with power and data cables. Arbitrary features can be realized through simple programming on the computer. Most importantly, digital displays make active targets be possible. Therefore, more and more researchers used phase-shifting patterns, which that could solve the problem of the calibration imprecision that is caused by the coordinate extraction errors of the feature points [14,17] as calibration targets with the advantages of digital displays. Schmalz et al. [14] performed camera calibration with two phase-shifting sequences, one horizontal, and one vertical. Huang et al. [15] also applied horizontal/vertical phase-shifting fringe patterns for camera calibration, and made improvement on feature detection and optimization. Ma et al. [16] used horizontal/vertical fringe patterns as calibration targets, but extracted the two-dimensional (2D) phase-difference pulses as feature points. Xue et al. [17] applied concentric circles and wedge gratings for solving the vanishing points, and then estimated the camera parameters that were based on the orthogonal vanishing point conjugate. Ha et al. [18] proposed an accurate camera calibration method for defocused images. The calibration target included two pairs of horizontal/vertical binary patterns and one black pattern. Bell et al. [19] encoded the feature points into the carrier phase of horizontal/vertical binary patterns, which can be accurately recovered even under severe defocus. These above methods could achieve sufficient accuracy with active targets; yet they require five-frame patterns at least. In other words, we need capture five or more images at each viewpoint, which is tedious and laborious.
In order to obtain accurate calibration results and reduce the workload of capturing images marked by phase-shifting patterns. This paper presents an active calibration target that consists of phase-shifting wedge grating (PWG) arrays. The approach takes advantage of the high precision of the phase-shifting fringes extraction [14,16,17] and uses PWG arrays as calibration pattern to obtain the wrapped phase of the captured images. Meanwhile, the intersections of 2π-phase points that were regarded as feature points can be extracted accurately. The adoption of three-frame patterns could significantly reduce the workload and improve the efficiency of camera calibration. A liquid crystal display (LCD) is served as the planar target to display these patterns, which is flat, effortless and flexible. The three-step phase-shifting algorithm is used for the wrapped phase calculation. The 2π-phase points are roughly extracted with edge detection and are then optimized by windowed bicubic fitting with sub-pixel accuracy. Two 2π-phase lines for each PWG are obtained with linear fitting method. The PWG centers are located through computing the intersections of 2π-phase lines. Camera parameters are estimated using these PWG centers as feature points. The PWG arrays were compared with checkerboard, circle patterns and horizontal/vertical phase-shifting fringe patterns with the feature detection method in [16]. The calibration results confirmed the accuracy and the efficiency of the proposed method.
The rest of the paper is organized as follows: Section 2 explains the principle of the proposed method, including camera model, calibration pattern, and feature detection. Section 3 presents the experimental results to verify the proposed method. Lastly, Section 4 summarizes the paper.

2. Principle

2.1. Camera Model

The camera is modeled as the classic pinhole. Let P = ( X W , Y W , Z W , 1 ) T and P = ( u , v , 1 ) T be the homogeneous coordinates of the 3D world point and the 2D image point, respectively. The relationship between P and P can be mathematically described as [1]:
λ P = K [ R t ] P ,
K = [ f u γ u 0 0 f v v 0 0 0 1 ] ,
R = [ r 11 r 12 r 13 r 21 r 22 r 23 r 31 r 32 r 33 ] , t = [ t 1 t 2 t 3 ] ,
where λ is an arbitrary scale factor, K called the intrinsic parameters contains focal length ( f u , f v ) , principal point ( u 0 , v 0 ) , and skew angle parameter γ . The rotation matrix R and the translation vector t denote the extrinsic parameters. Generally, camera lens consisting of several optical elements does not obey the ideal pinhole model, which will introduce nonlinear distortions to correct the captured images [3]. Radial and tangential distortions are the two most common that can be approximated as [19]:
[ u v ] = [ u ( 1 + k 1 r 2 + k 2 r 4 ) + 2 p 1 u v + p 2 ( r 2 + 2 u 2 ) v ( 1 + k 1 r 2 + k 2 r 4 ) + p 1 ( r 2 + 2 v 2 ) + 2 p 2 u v ] ,
where ( u , v ) and ( u , v ) are the distorted and undistorted image point in normalized image coordinates, k 1 and k 2 are the radial distortion coefficients, p 1 and p 2 are tangential distortion coefficients, and r = ( u u 0 ) 2 + ( v v 0 ) 2 .

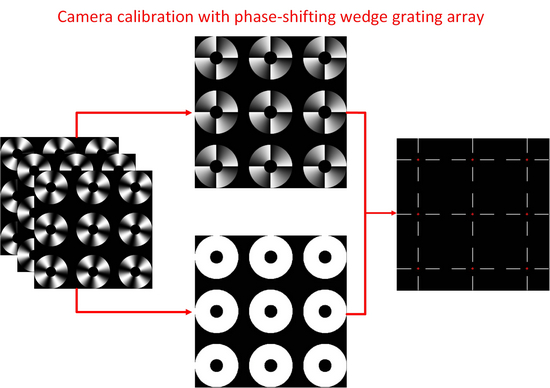
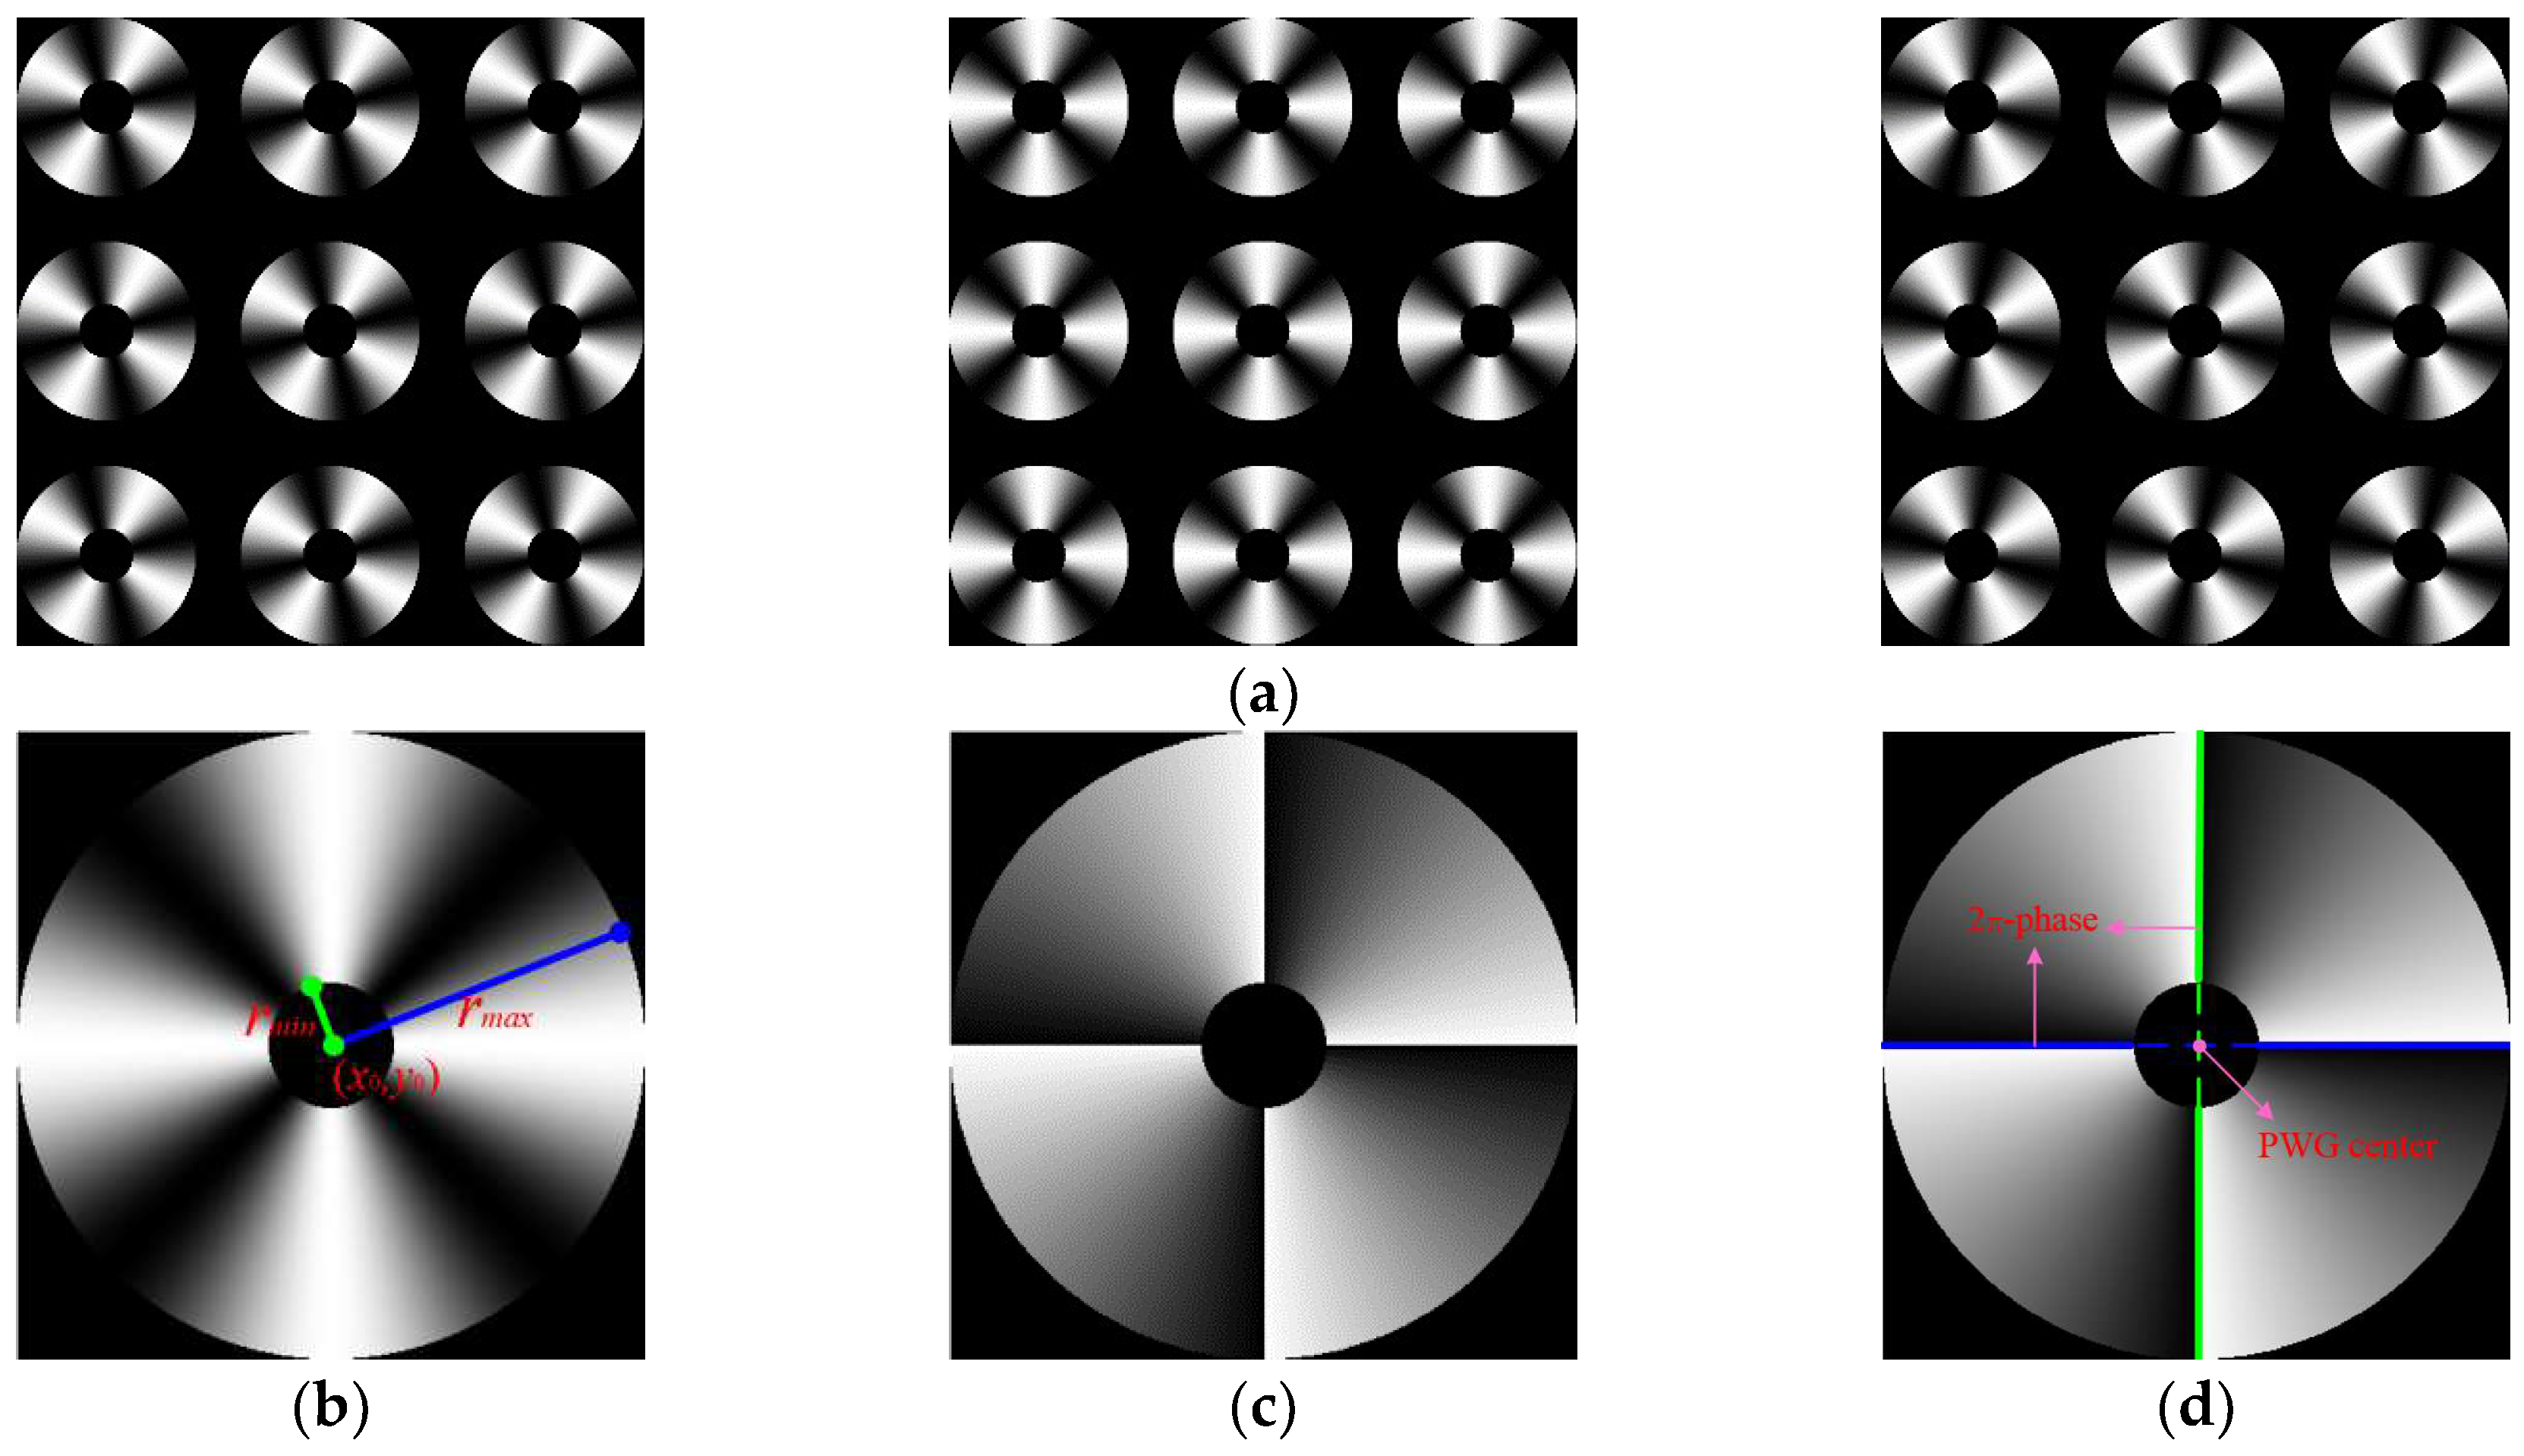
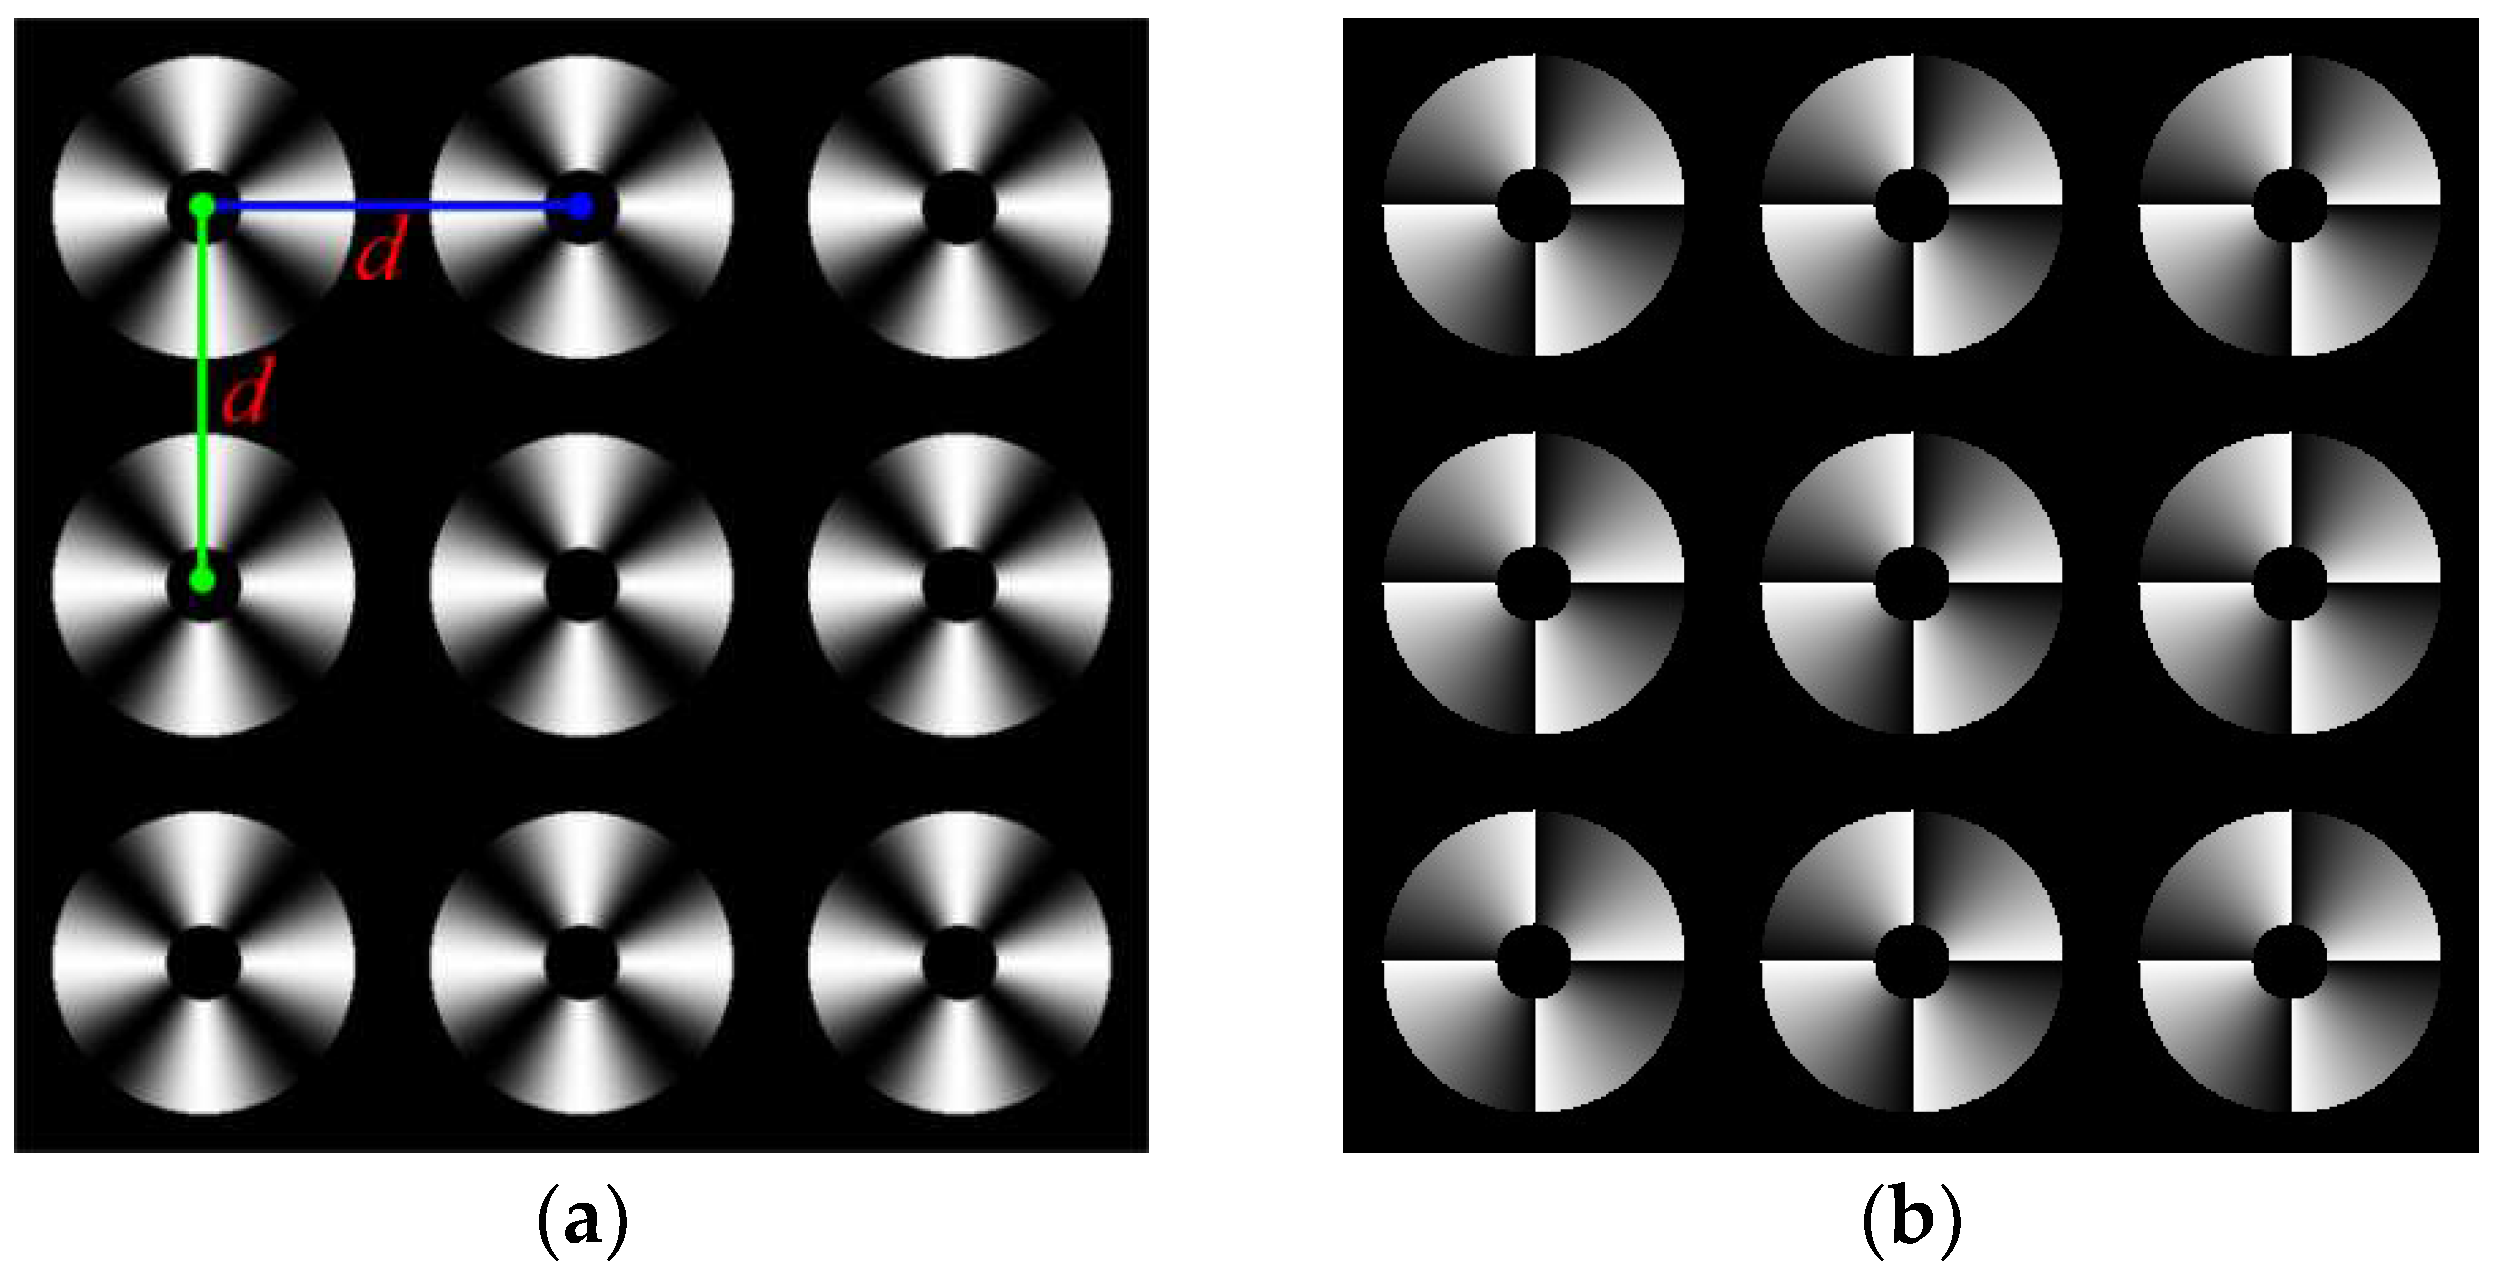
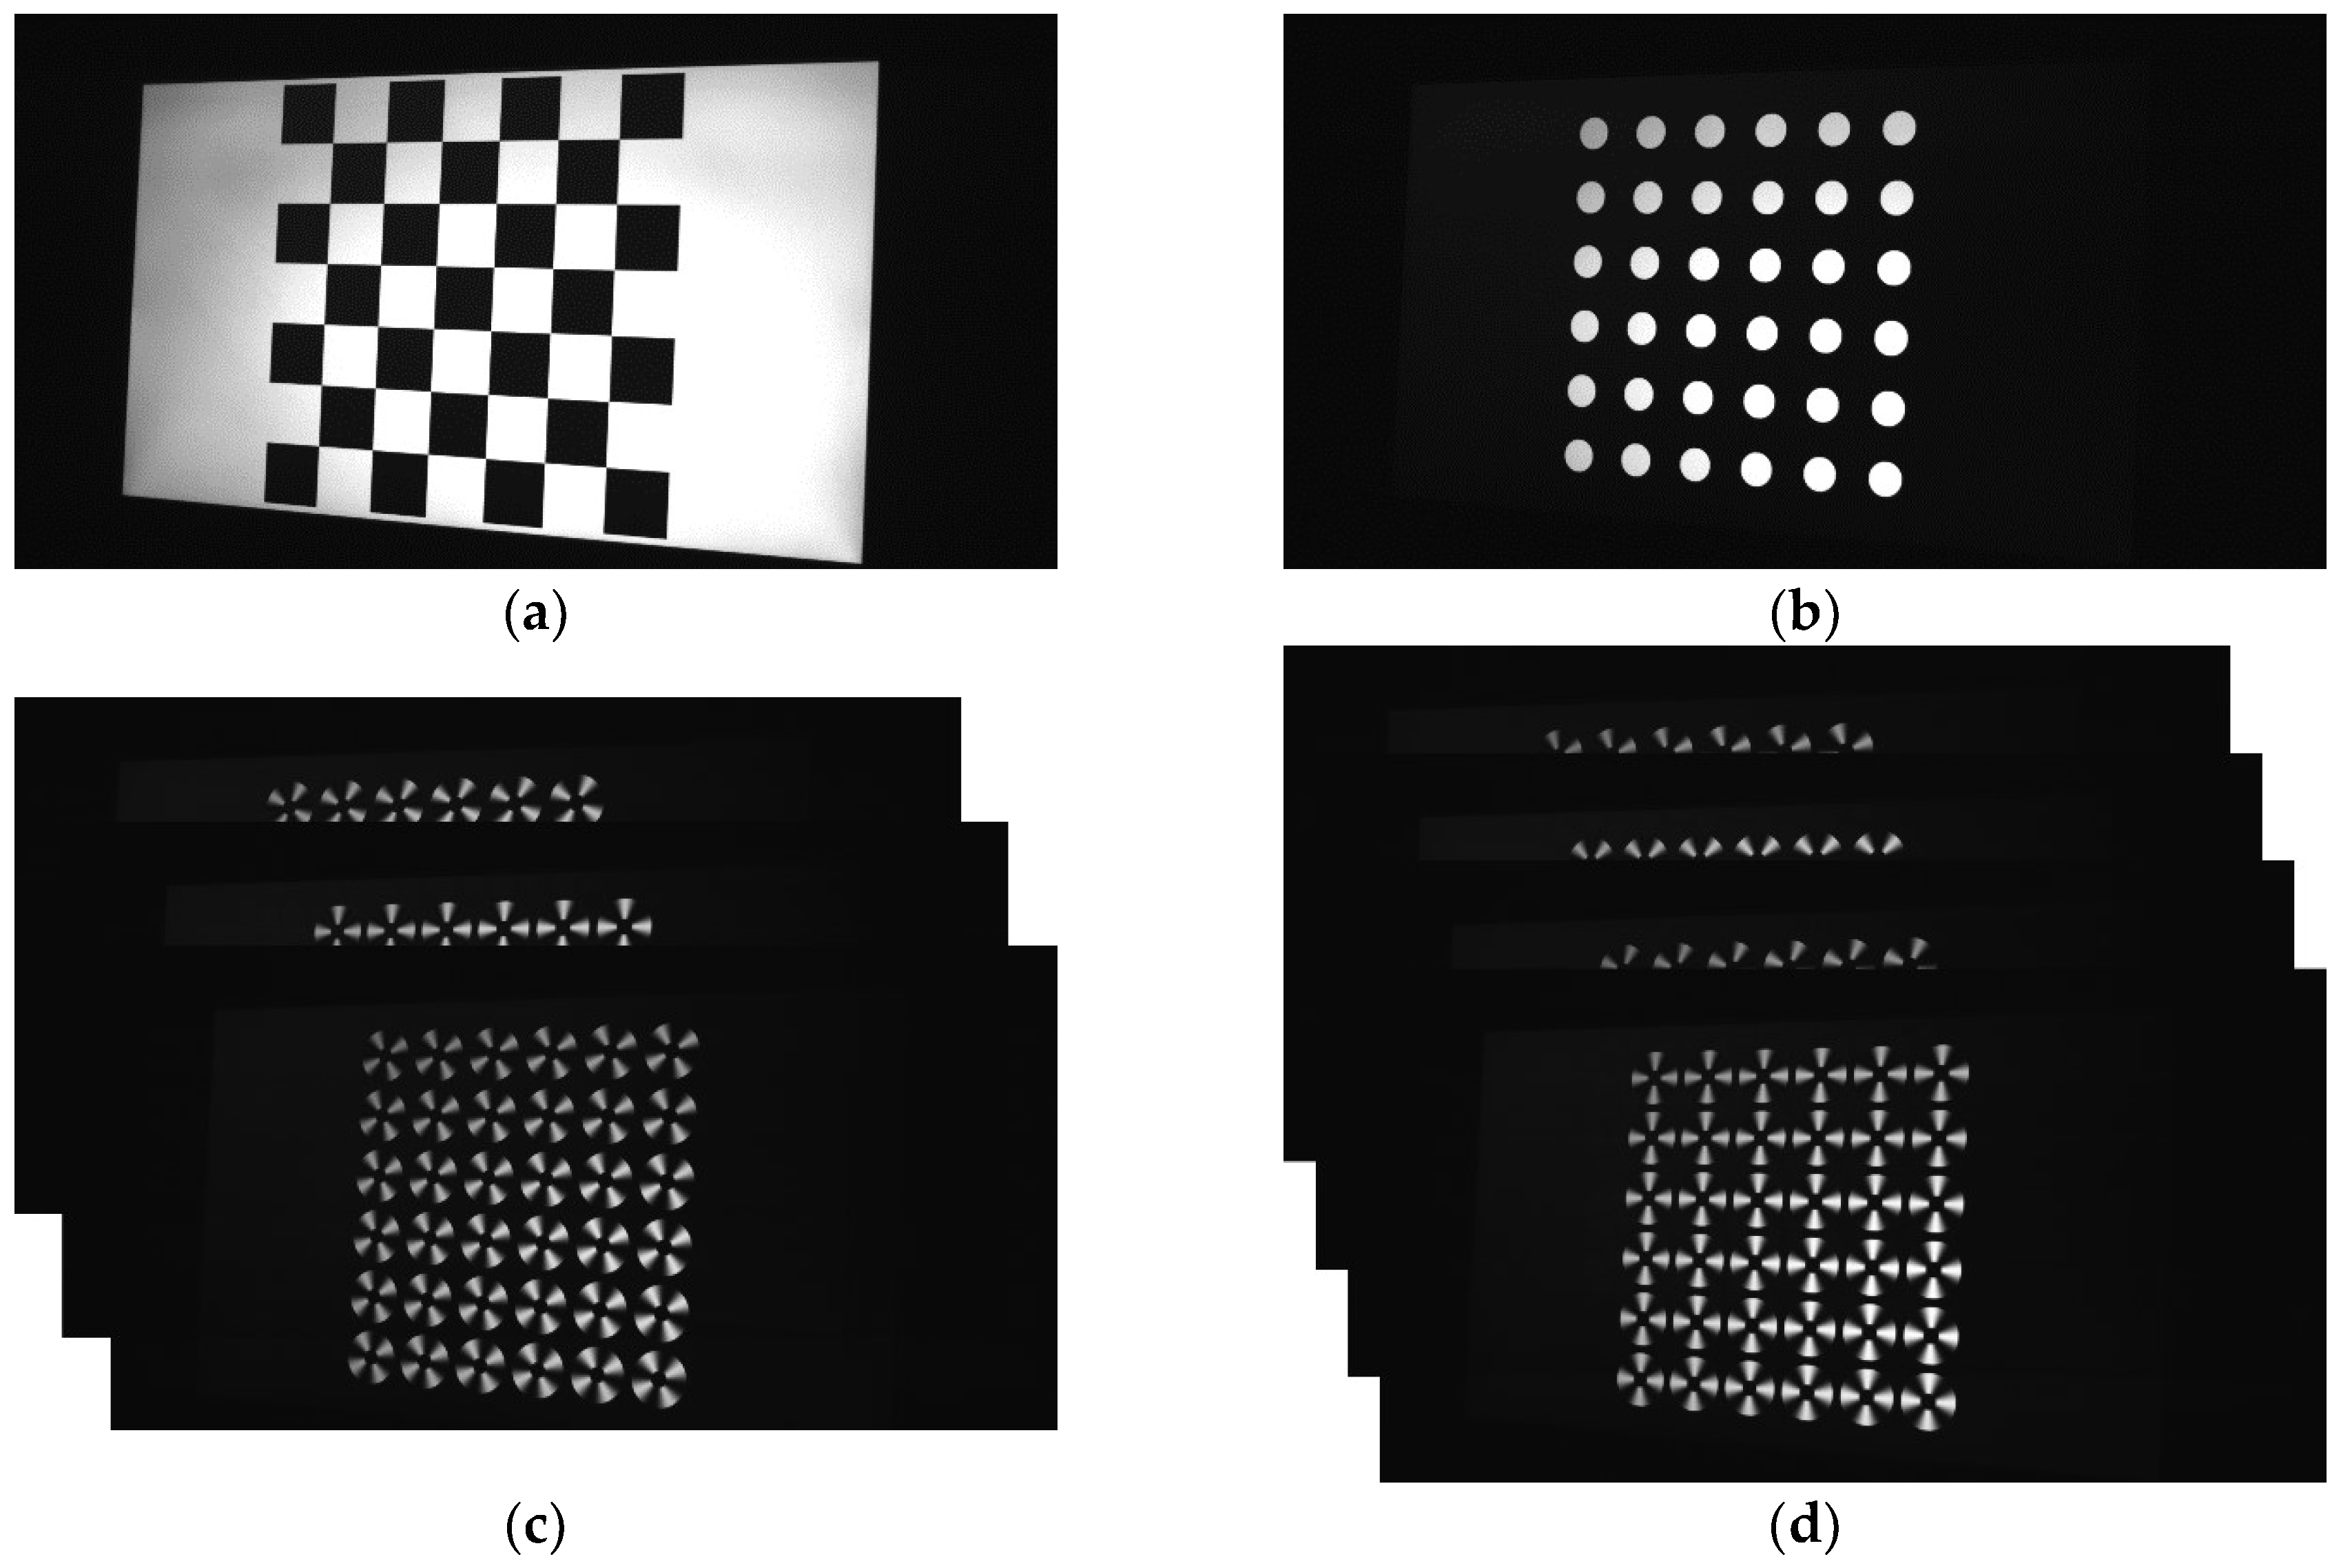
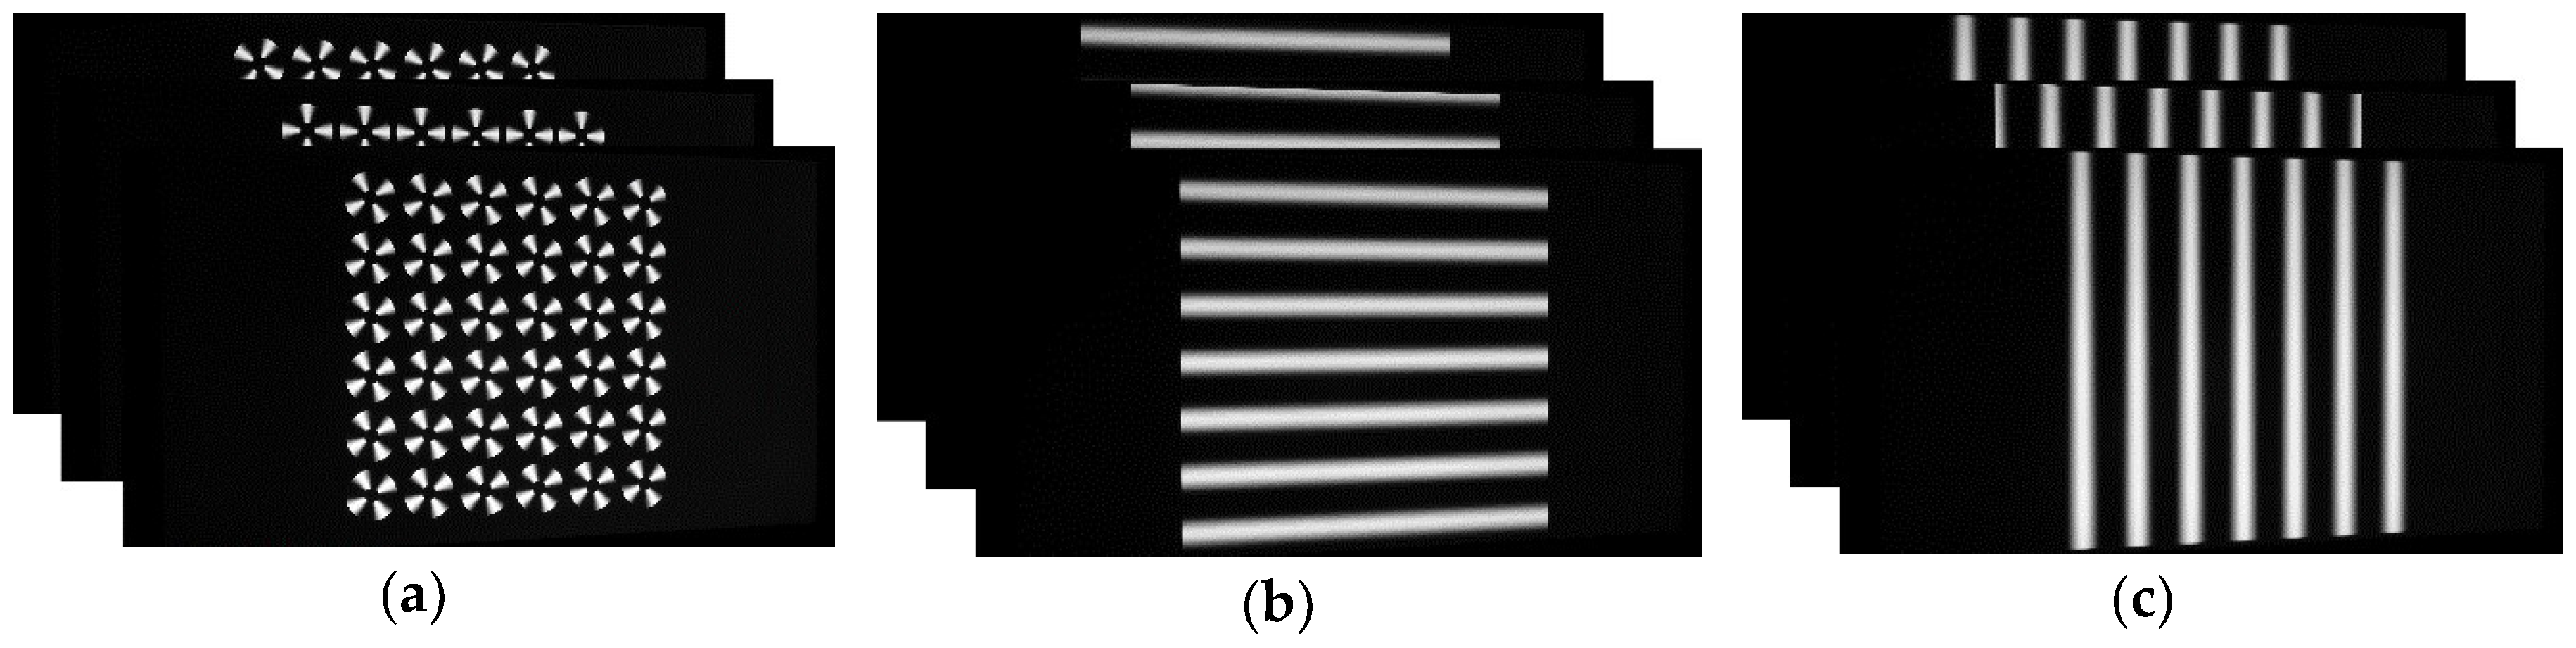
2.2. Calibration Pattern

Phase-shifting methods are widely used in optical metrology, which can provide very high precision and dense coding [14,20]. This paper encodes the feature points into the carrier phase of three PWG arrays with a phase shift of 2 π / 3 . The wrapped phase of the patterns can be recovered with phase-shifting algorithm. The intensities of the PWG are, respectively, described as [17]:
{ I 1 ( x , y ) = A + B cos ( 2 π f θ 2 π / 3 ) I 2 ( x , y ) = A + B cos ( 2 π f θ ) I 3 ( x , y ) = A + B cos ( 2 π f θ + 2 π / 3 ) ,
θ ( x , y ) = arctan ( y y 0 x x 0 ) ,
where ( x , y ) denotes one point on the PWG; A is the average intensity, and B is the intensity modulation; A and B are constant, usually we set A = B = 0.5 ; 2 π f θ is the phase to be determined, and f is the frequency, θ ( x , y ) is the angle with x-axis that is expressed as Equation (6); the radius r = ( x x 0 ) 2 + ( y y 0 ) 2 is the Euclidean distance between the points ( x , y ) and the PWG center ( x 0 , y 0 ) , and r min < r < r max is used to restrict the size of the PWG. Figure 1a shows the PWG arrays contains 3 × 3 uniform PWGs with f = 2 / π and a phase shift of 2 π / 3 . Figure 1b shows a single PWG, also the basic unit of the second PWG array, the corresponding wrapped phase of the PWG is shown in Figure 1c.
Obviously, the 2π-phase points are distributed on two straight lines that intersect at the PWG center, as shown in Figure 1d. If we can detect the two 2π-phase lines in the image, the PWG center can be located through computing the intersection. Since one PWG only has one center, some identical PWGs are arranged to generate PWG array, and their centers are used as feature points. Figure 2a shows the PWG array consisting of 3 × 3 PWGs. Specifically, for the M × N PWG array, the PWG at m t h row and n t h column is centered at:
{ x 0 m n = x 0 + ( n 1 ) d y 0 m n = y 0 + ( m 1 ) d ,
where m = 0 , 1 , , M 1 ; n = 0 , 1 , , N 1 ; d indicates the distance between adjacent PWG centers between the horizontal or vertical direction, which must be greater than 2 r max to avoid interference between adjacent PWGs. Figure 2b shows its wrapped phase image.

2.3. Feature Detection
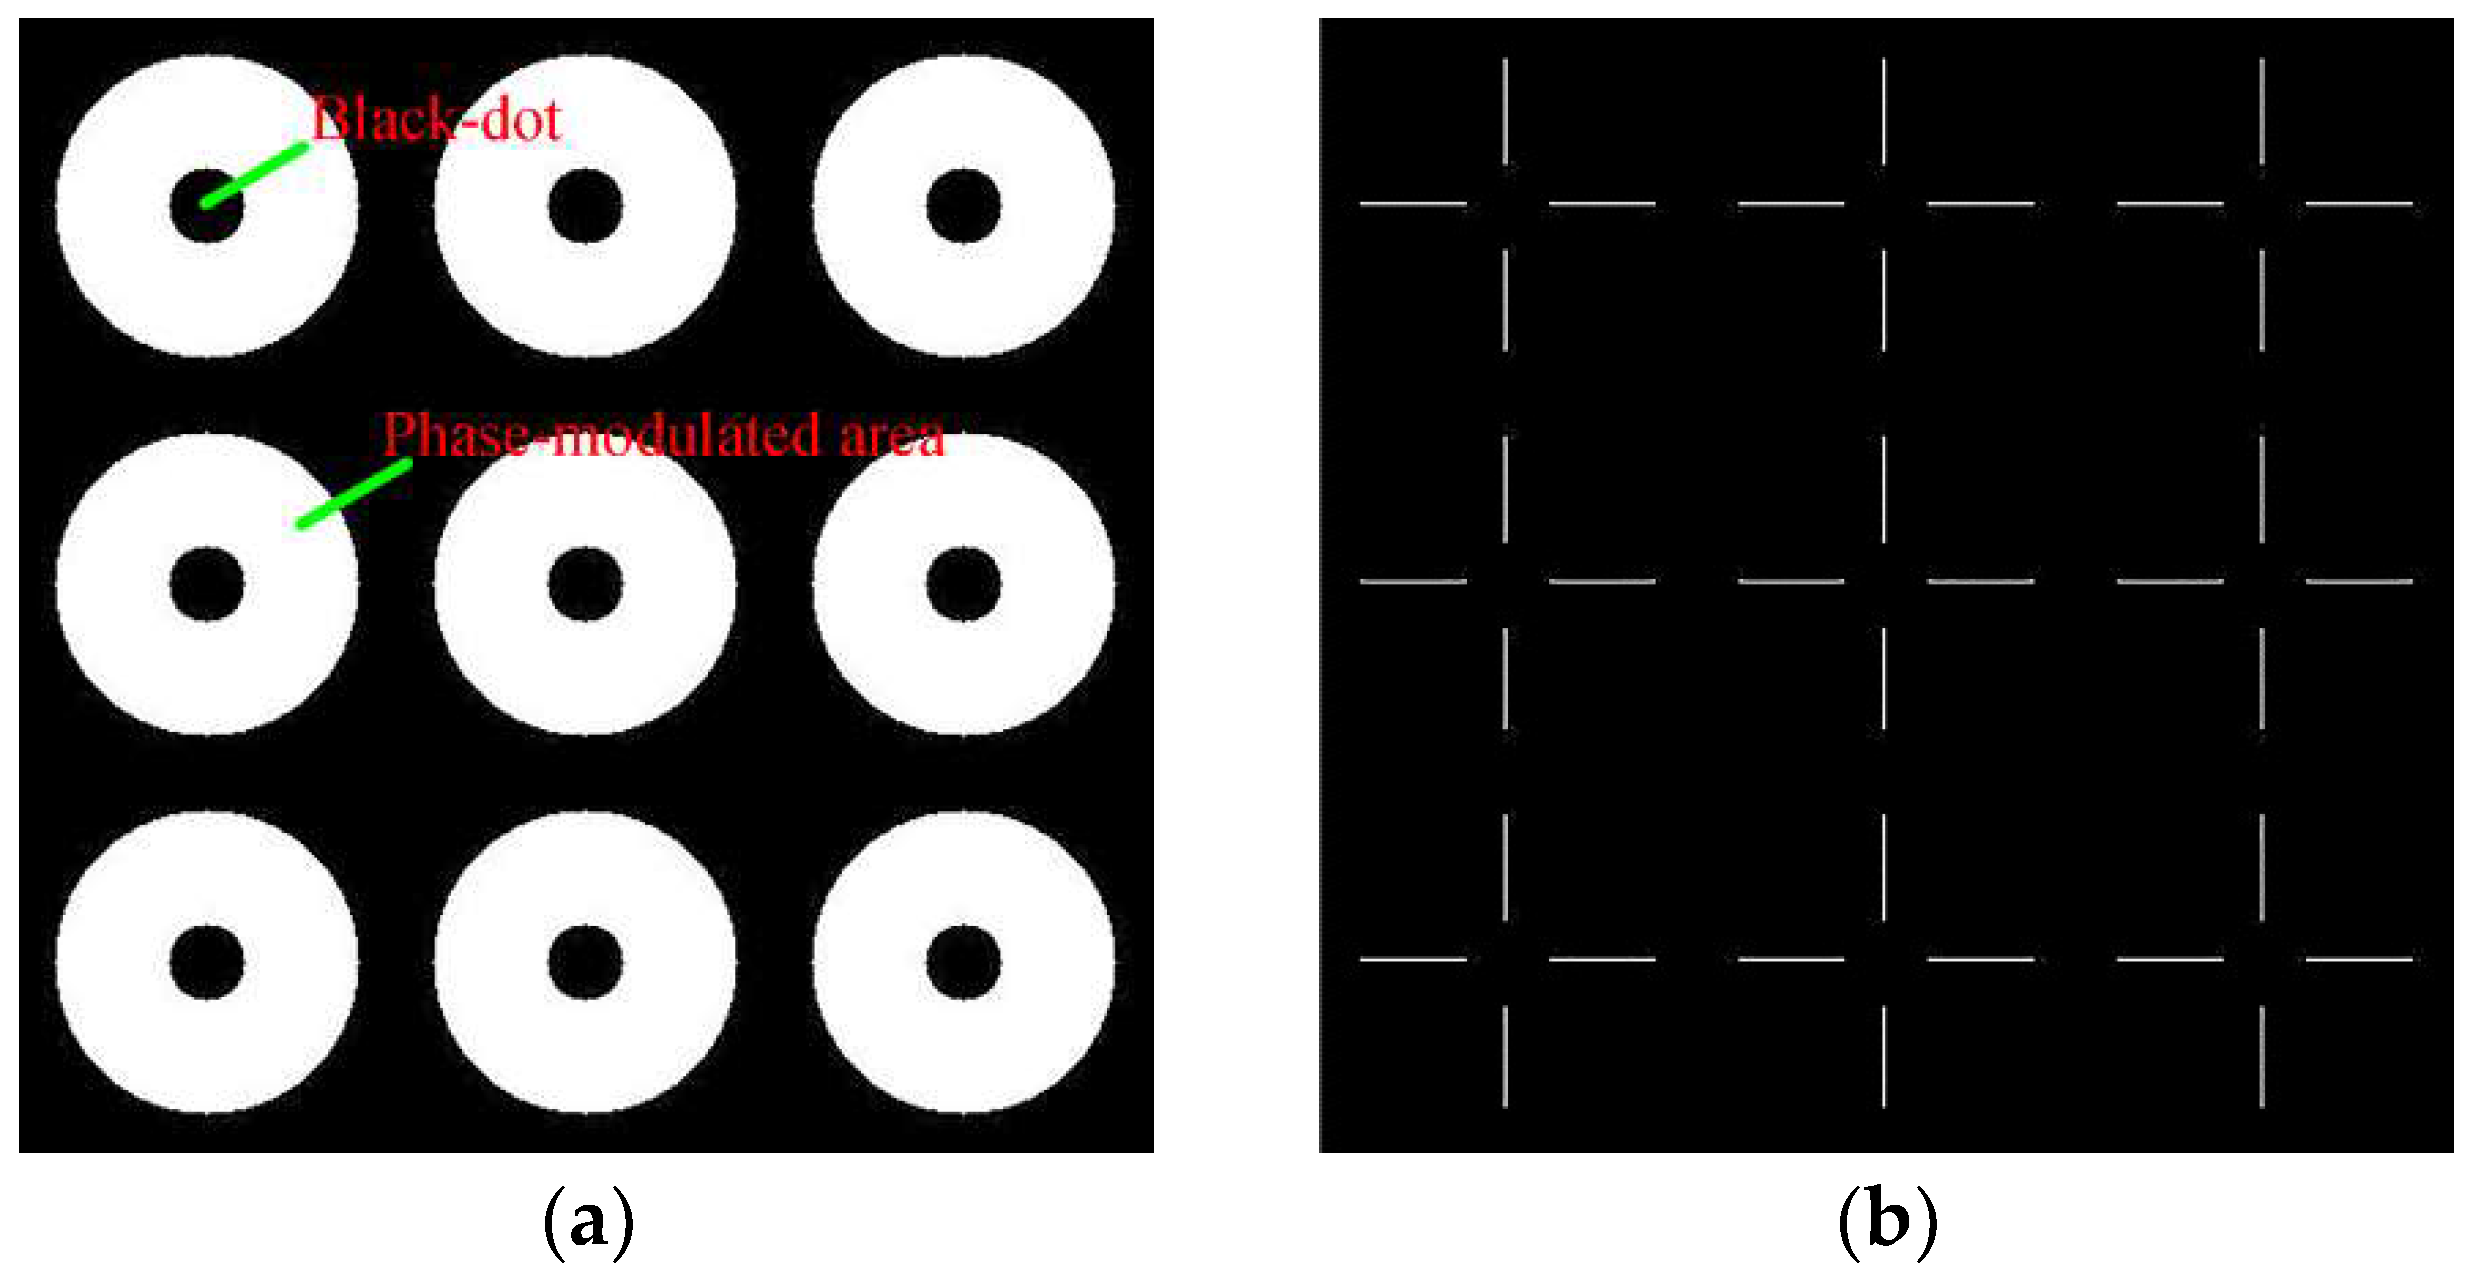
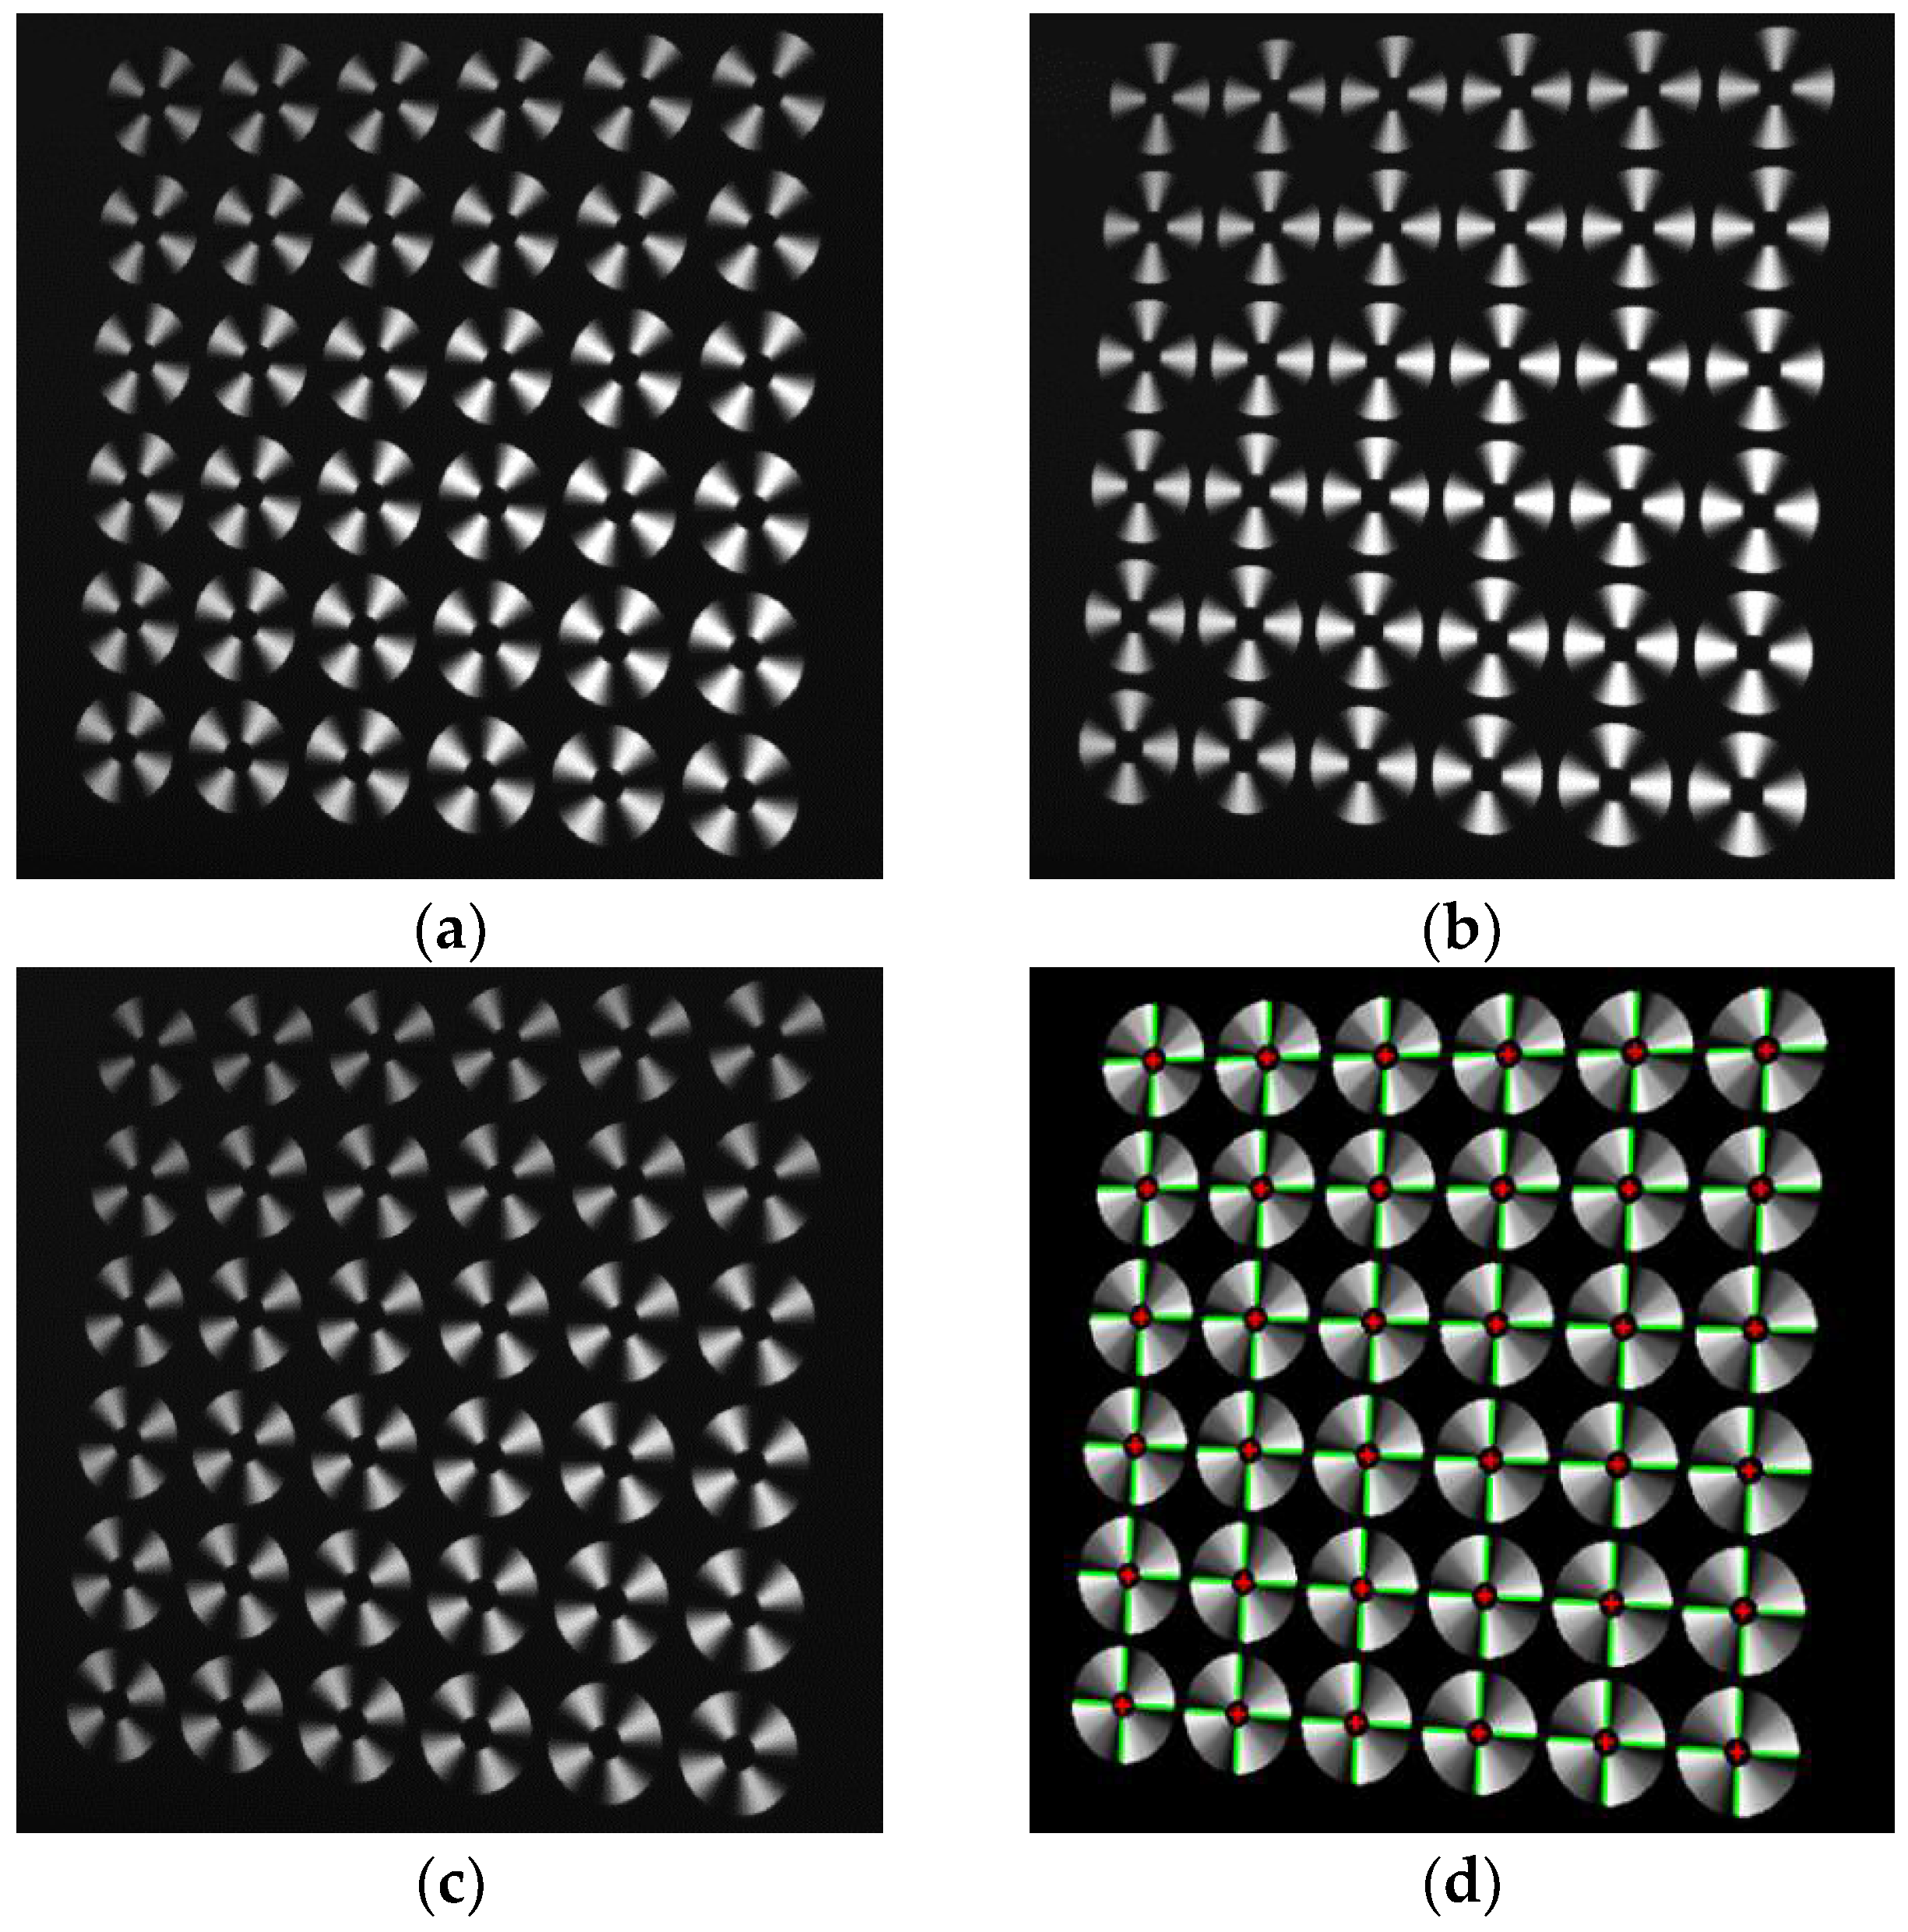
The emphasis of feature detection is how to detect the PWG centers. The detailed procedures of our method can be summarized, as follows:
  • Let J 1 ( u , v ) , J 2 ( u , v ) , and J 3 ( u , v ) respectively represent the three PWG array images that are captured at the same viewpoint. Adding up the three images, the phase-modulated area Ω (Figure 3a) for PWG arrays can be obtained with a suitable gray threshold T :
    Ω = { 1 , i f   J 1 + J 2 + J 3 > T 0 , o t h e r w i s e .
    Label the connected components in the phase-modulated area Ω , the sub-masks Ω k for each PWG can be achieved. Calculate the centroid ( u c k , v c k ) of each Ω k , which can be regarded as the rough location of the PWG center.
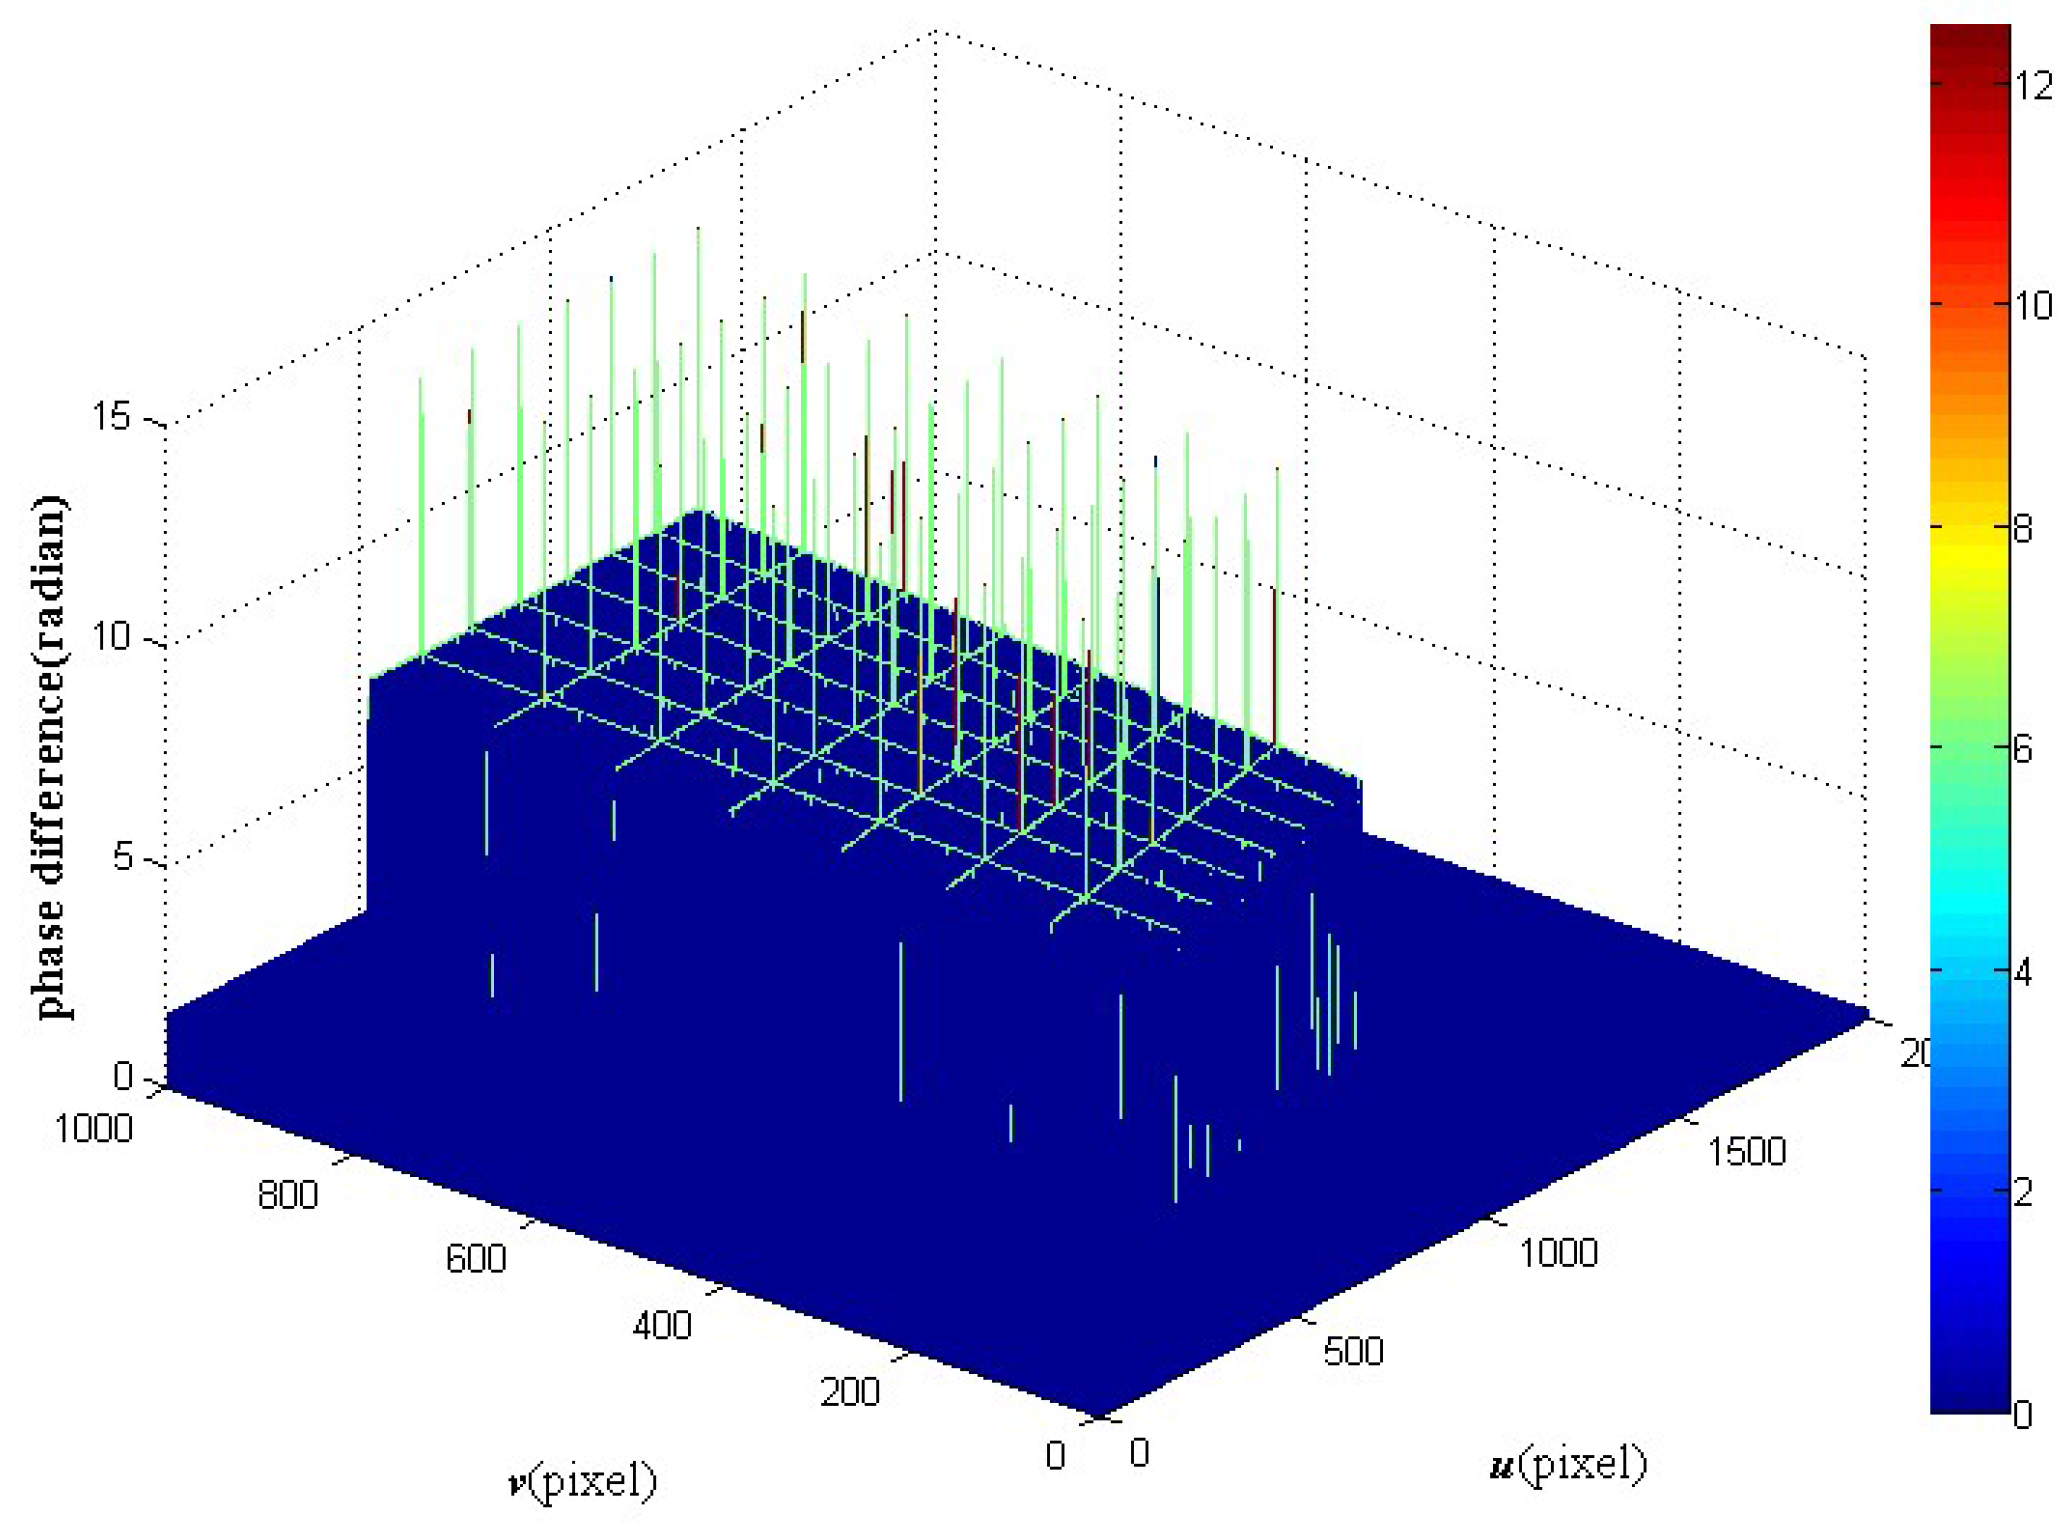
  • Based on the three-step phase-shifting algorithm, the wrapped phase ranging from [0, 2π] can be calculated as:
    ϕ ( u , v ) = arctan ( 3 J 1 J 3 2 J 2 J 1 J 3 ) .
    Clearly, ϕ ( u , v ) abruptly changes at the 2π-phase jump areas. Thus, through edge detection (e.g., Sobel, Canny), we can easily extract the 2π-phase points ( u ^ i , v ^ i ) with pixel-level accuracy. These edge points ( u ^ i , v ^ i ) are distributed on several lines, as shown in Figure 3b.
  • For each ( u ^ i , v ^ i ) , we select its 7 × 7 neighborhood points ( u ^ i j , v ^ i j ) with wrapped phase ϕ ( u ^ i j , v ^ i j ) . The ϕ ( u ^ i j , v ^ i j ) with 2π-phase jumps can be unwrapped as:
    ϕ ( x i j , y i j ) = { ϕ ( x i j , y i j ) , ϕ ( x i j , y i j ) π ϕ ( x i j , y i j ) + 2 π , o t h e r w i s e .
    Let R i j be the Euclidean distance between ( u ^ i j , v ^ i j ) and its corresponding center ( u c , v c ) . Then, we can establish the function relations x = f x ( Φ , R ) and y = f y ( Φ , R ) by the windowed bicubic fitting algorithm. The optimized 2π-phase points ( u ˜ , v ˜ ) can be obtained through substituting Φ = 2 π and R = ( u ^ i j u c ) 2 + ( v ^ i j v c ) 2 . Those 2π-phase points with sub-pixel accuracy are utilized to locate the real center ( u 0 , v 0 ) .
  • When all of the 2π-phase points are optimized, two 2π-phase straight lines for each PWG can be obtained with linear fitting algorithm. The intersection point of the two straight lines can be treated as the PWG center, as well as the feature point. Using the one-to-one correspondences between the world and image coordinates of the PWG centers, the camera parameters can be estimated.

3. Experiments

The performance of the proposed method has been evaluated with some experiments. The experimental setup mainly includes a camera to be calibrated and an LCD used to display the calibration patterns. The camera model is IOI Flare 2M360-CL (IO Industries Inc., London, ON, Canada) with a resolution of 2048 × 1088 pixels. The camera lens has a zoom lens with a focal length of 12–35 mm. The LCD model is Philips 226V4L (Koninklijke Philips N.V., Amsterdam, Holland, The Netherlands), with a resolution of 1920 × 1080 pixels and a pixel pitch of 0.248mm. To begin with, the camera fixed on a device was placed at a suitable distance from the LCD and the optical axis of the camera was perpendicular to the screen. Then, a suitable focal length was adjusted to capture the sharp image of the pattern. The XY plane of the world reference frame was located on the LCD, and the Z axis was perpendicular to the planar monitor. Therefore, the feature points had the same z = 0 , which could simplify the calculation procedures. All of the feature detection methods were implemented in MATLAB R2014a (MATLAB 8.3, MathWorks, Inc., Natick, MA, USA, 2014) and Visual C++ 2012 (Visual Studio 2012 Update 5, Microsoft Corporation, Redmond, Washington, United States, 2015). The camera intrinsic parameters were estimated using the standard calibration method implemented in the MATLAB environment, with the assistance of Camera calibration toolbox [21] and Image Processing Toolbox [22]. The calibration accuracy can be assessed on the basis of the root-mean-square re-projection error (RMSE) of feature points [5,14], which can be computed by the equation:
RMSE = 1 L l = 1 L [ ( u l u ^ l ) 2 + ( v l v ^ l ) 2 ] ,
where L is the total number of the feature points, ( u l , v l ) are the extracted feature point locations, ( u ^ l , v ^ l ) are the re-projection point locations, which were computed from the known world coordinates of the feature point.
The PWG array used to calibrate the camera consists of 6 × 6 uniform PWGs, which can produce 36 feature points per viewpoint. The minimum and maximum radii of the PWG are r min = 20 pixels and r max = 65 pixels. The distance between adjacent PWG centers is d = 150 pixels. The frequency is f = 2 / π .

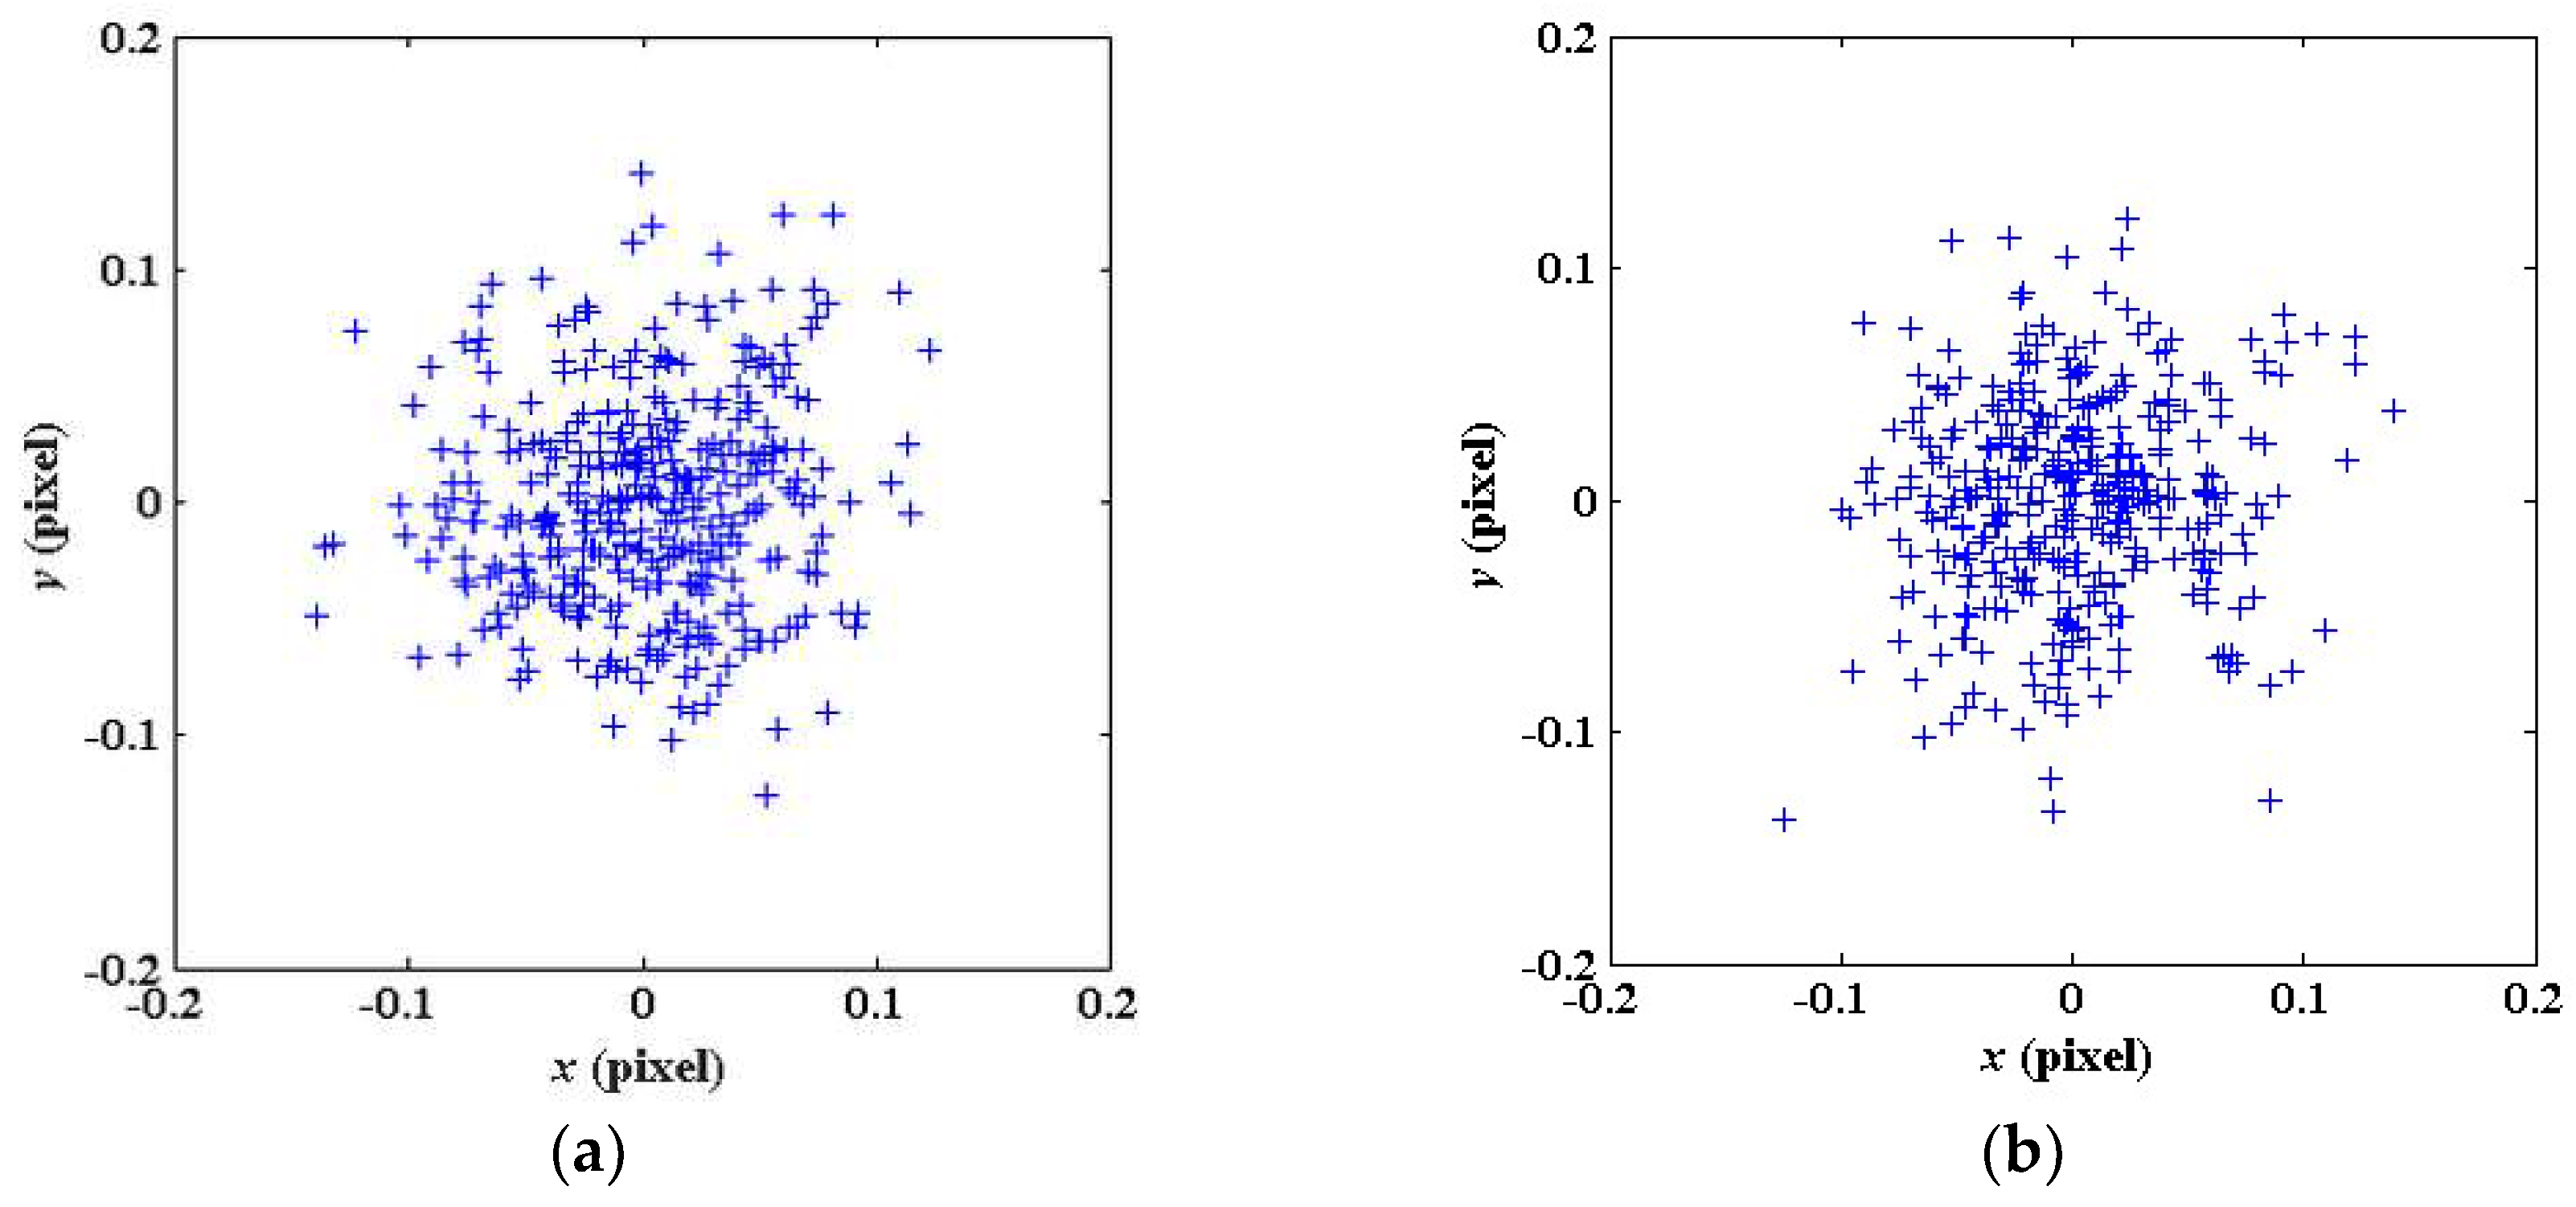
3.1. PWG Arrays VS Checkerboard and Circle Patterns

In this experiment, checkerboard and circle patterns were selected as contrasting objects, which also designed to have 6 × 6 feature points with same locations. Both of the performances for three-step and four-step PWG arrays were explored. The four patterns were displayed on the LCD separately. Through adjusting the location of the camera, we collected four groups of pattern images from 10 different viewpoints. We obtained nine images per viewpoint: one for checkerboard, one for circle patterns, three for three-step PWG arrays, and four for four-step PWG arrays. Figure 4 shows the captured images of the four patterns.
After capturing the calibration target images, we extracted the feature points from the images: the corners for checkerboard with Camera Calibration Toolbox for Matlab [21], the centers for circles with OpenCV function findCirclesGrid [23], and the centers for three-step and four-step PWG arrays with the feature detection method in Section 2.3. Figure 5a–c show the three-step PWG array images and Figure 5d shows their wrapped phase with detected feature points.
Figure 6 shows the re-projection errors of feature points for the four patterns. The results clearly show that PWG arrays have an improvement in RMSEs than checkerboard and circle patterns. Table 1 shows the intrinsic parameters estimated from the four patterns. The calibration results are very close to each other. The tangential coefficients as well as the skew angle parameter are extremely small. It is sufficient to keep radial coefficients for nonlinear distortion. The RMSEs in the presented method are smaller than checkerboard and circles patterns and the four-step PWG arrays are more accurate than three-step PWG arrays. To our knowledge, four-step pattern always recover the wrapped phase with higher precision than three-step pattern. Thus, the calibration results of PWG arrays are more accurate than checkerboard and circle patterns and the calibration accuracy will be higher and higher with the step increases.

3.2. PWG Arrays VS Horizontal/Vertical Phase-Shifting Fringe Patterns

In this experiment, fringe patterns generated with the same phase shift of 2 π / 3 and feature point locations were chosen to compare with three-step PWG arrays. Both of them were phase-shifting patterns, and the fringe patterns consisted of horizontal and vertical phase-shifting fringe patterns. We performed the experimental procedures in the same way that is described in Section 3.1. Nine images per viewpoint consisted of three PWG images, three horizontal fringe pattern images and three vertical phase-shifting fringe pattern images were captured and ninety images were obtained in total. Figure 7 shows the captured images of the two phase-shifting patterns.
Then, we extracted the feature points from the images: the centers for three-step PWG arrays and the centers for three-step phase-shifting fringe patterns with the feature detection method in paper [16], which extracted the two-dimensional (2D) phase-difference pulse signals that were optimized by interpolation as feature points. The workload of capturing images for PWG arrays was reduced by half when compared with the fringe patterns. Figure 8 shows the 2D phase-difference pulses.
Table 2 shows the intrinsic parameters estimated from the two phase-shifting fringe patterns. The RMSE for the presented method is smaller than that for the method in paper [16]. The difference in RMSEs was caused by the precision of feature detection. The method in paper [16] extracted the feature points based on the sum of two 2π-phase point images. While the addition operation brought more noise, which directly influenced the accurate extraction of feature points than the presented method that used one 2π-phase point image. Therefore, the proposed method is accurate and reliable.

4. Conclusions

In this study, PWG arrays are used as calibration patterns for accurate camera calibration, which is displayed on an LCD. The 2π-phase points are detected and optimized to obtain sub-pixel accuracy. Then, the PWG centers used as feature points are precisely extracted from the phase by using linear fitting method rather than directly from the intensity. When compared to horizontal/vertical phase-shifting fringe patterns, it is convenient and time-saving with the workload of capturing images reduced by half. Experimental results indicate that the proposed method is accurate and reliable.

Acknowledgments

This research was supported by National Natural Science Foundation of China (No. 61775209).

Author Contributions

Jiayuan Tao, Yuwei Wang and Keyi Wang conceived and designed the calibration patterns, Jiayuan Tao and Bolin Cai performed the experiments and analyzed the data, Jiayuan Tao wrote the paper.

Conflicts of Interest

The authors declare no conflict of interest.

Funding

This research was funded by [National Natural Science Foundation of China] grant number [[61775209].

References

  1. Zhang, Z. A flexible new technique for camera calibration. IEEE Trans. Pattern Anal. Mach. Intell. 2000, 22, 1330–1334. [Google Scholar] [CrossRef]
  2. Salvi, J.; Armangué, X.; Batlle, J. A comparative review of camera calibrating methods with accuracy evaluation. Pattern Recognit. 2002, 35, 1617–1635. [Google Scholar] [CrossRef]
  3. Heikkila, J. Geometric camera calibration using circular control points. IEEE Trans. Pattern Anal. Mach. Intell. 2000, 22, 1066–1077. [Google Scholar] [CrossRef]
  4. Li, L.; Zhao, W.; Wu, F.; Liu, Y.; Gu, W. Experimental analysis and improvement on camera calibration pattern. Opt. Eng. 2014, 53, 013104. [Google Scholar] [CrossRef]
  5. Liu, Z.; Wu, Q.; Chen, X.; Yin, Y. High-accuracy calibration of low-cost camera using image disturbance factor. Opt. Express 2016, 24, 24321–24336. [Google Scholar] [CrossRef] [PubMed]
  6. Vidas, S.; Lakemond, R.; Denman, S.; Fookes, C.; Sridharan, S.; Wark, T. A mask-based approach for the geometric calibration of thermal-infrared cameras. IEEE Trans. Instrum. Meas. 2012, 61, 1625–1635. [Google Scholar] [CrossRef] [Green Version]
  7. Ricolfe-Viala, C.; Sánchez-Salmerón, A.-J. Robust metric calibration of non-linear camera lens distortion. Pattern Recognit. 2010, 43, 1688–1699. [Google Scholar] [CrossRef]
  8. Mallon, J.; Whelan, P.F. Calibration and removal of lateral chromatic aberration in images. Pattern Recognit. Lett. 2007, 28, 125–135. [Google Scholar] [CrossRef] [Green Version]
  9. Li, D.; Tian, J. An accurate calibration method for a camera with telecentric lenses. Opt. Lasers Eng. 2013, 51, 538–541. [Google Scholar] [CrossRef]
  10. Li, B.; Zhang, S. Structured light system calibration method with optimal fringe angle. Appl. Opt. 2014, 53, 7942–7950. [Google Scholar] [CrossRef] [PubMed]
  11. Li, Z.; Shi, Y.; Wang, C.; Wang, Y. Accurate calibration method for a structured light system. Opt. Eng. 2008, 47, 053604. [Google Scholar] [CrossRef]
  12. Cui, J.S.; Huo, J.; Yang, M. The circular mark projection error compensation in camera calibration. Opt.-Int. J. Light Electron Opt. 2015, 126, 2458–2463. [Google Scholar] [CrossRef]
  13. Liu, Y.; Su, X. Camera calibration with planar crossed fringe patterns. Opt.-Int. J. Light Electron Opt. 2012, 123, 171–175. [Google Scholar] [CrossRef]
  14. Schmalz, C.; Forster, F.; Angelopoulou, E. Camera calibration: Active versus passive targets. Opt. Eng. 2011, 50, 113601. [Google Scholar] [CrossRef]
  15. Huang, L.; Zhang, Q.; Asundi, A. Camera calibration with active phase target: Improvement on feature detection and optimization. Opt. Lett. 2013, 38, 1446–1448. [Google Scholar] [CrossRef] [PubMed]
  16. Ma, M.; Chen, X.; Wang, K. Camera calibration by using fringe patterns and 2D phase-difference pulse detection. Opt.-Int. J. Light Electron Opt. 2014, 125, 671–674. [Google Scholar] [CrossRef]
  17. Xue, J.; Su, X.; Xiang, L.; Chen, W. Using concentric circles and wedge grating for camera calibration. Appl. Opt. 2012, 51, 3811–3816. [Google Scholar] [CrossRef] [PubMed]
  18. Ha, H.; Bok, Y.; Joo, K.; Jung, J.; So Kweon, I. Accurate camera calibration robust to defocus using a smartphone. In Proceedings of the IEEE International Conference on Computer Vision, Santiago, Chile, 13–16 December 2015; pp. 828–836. [Google Scholar]
  19. Bell, T.; Xu, J.; Zhang, S. Method for out-of-focus camera calibration. Appl. Opt. 2016, 55, 2346. [Google Scholar] [CrossRef] [PubMed]
  20. Je, C.; Lee, S.W.; Park, R.-H. Color-phase analysis for sinusoidal structured light in rapid range imaging. In Proceedings of the 6th Asian Conference on Computer Vision, Jeju, Korea, 27–30 January 2004; pp. 270–275. [Google Scholar]
  21. Camera Calibration Toolbox for Matlab. Available online: http://www.vision.caltech.edu/bouguetj/calib_doc/index.html (accessed on 8 April 2018).
  22. Image Processing Toolbox Documentation. Available online: http://www.mathworks.com/help/images/index.html (accessed on 8 April 2018).
  23. Open Computer Vision Library. Available online: http://opencv.org (accessed on 8 April 2018).
Figure 1. Phase-shifting wedge grating (PWG) pattern. (a) Three PWG arrays; (b) a single PWG; (c) its wrapped phase; and, (d) detected 2π-phase lines and their intersection.
Applsci 08 00644 g001
Figure 2. PWG array pattern. (a) a 3 × 3 PWG arrays image; and, (b) its wrapped phase.
Applsci 08 00644 g002
Figure 3. A PWG array’s pattern detection. (a) Phase-modulated area; and, (b) edges of its 2π-phase.
Applsci 08 00644 g003
Figure 4. The captured images of different patterns. (a) Checkerboard; (b) circles; (c) three-step PWG arrays; and, (d) four-step PWG arrays.
Applsci 08 00644 g004
Figure 5. Feature detection example. (ac) three PWG arrays; and, (d) the wrapped phase with detected feature points (red cross ‘+’).
Applsci 08 00644 g005
Figure 6. Re-projection errors of different patterns. (a) Checkerboard; (b) circles; (c) three-step PWG arrays; and, (d) four-step PWG arrays.
Applsci 08 00644 g006aApplsci 08 00644 g006b
Figure 7. The captured images of different phase-shifting patterns. (a) three-step PWG arrays; (b) three-step horizontal phase-shifting fringe patterns; and, (c) Three-step vertical phase-shifting fringe patterns.
Applsci 08 00644 g007
Figure 8. Two-dimensional (2D) phase-difference pulses of the horizontal/vertical fringe patterns.
Applsci 08 00644 g008
Table 1. Camera intrinsic parameters estimated from different patterns.
Parameter f u (Pixel) f v (Pixel) u 0 (Pixel) v 0 (Pixel) k 1 k 2 RMSE (Pixel)
Pattern
Checkerboard2964.72964.31011.3545.5−0.1450.7550.066
Circles2963.52962.81012.8544.8−0.1460.7540.063
Three-step
PWG arrays
2968.22968.01010.3546.5−0.1550.8270.054
Four-step
PWG arrays
2965.12964.81012.1546.3−0.1560.8320.045
Table 2. Camera intrinsic parameters estimated from different phase-shifting patterns.
Parameter f u (Pixel) f v (Pixel) u 0 (Pixel) v 0 (Pixel) k 1 k 2 RMSE (Pixel)
Pattern
Three-step
phase-shifting fringe patterns
2588.22588.41008.7544.4−0.0150.0810.085
Three-step
PWG arrays
2561.62561.51010.3546.8−0.0050.0770.046

