Article

Detection of Azo Dyes in Curry Powder Using a 1064-nm Dispersive Point-Scan Raman System

1
United States Department of Agriculture/Agricultural Research Service, Environmental Microbial and Food Safety Laboratory, Bldg. 303, Beltsville Agricultural Research Center East, 10300 Baltimore Ave., Beltsville, MD 20705-2350, USA
2
Chinese Academy of Sciences (CAS), 350 Shushanhu Road, P.O. Box 1138, Hefei 230031, China
*
Author to whom correspondence should be addressed.
Appl. Sci. 2018, 8(4), 564; https://doi.org/10.3390/app8040564
Submission received: 13 March 2018 / Revised: 27 March 2018 / Accepted: 27 March 2018 / Published: 5 April 2018
(This article belongs to the Special Issue Hyperspectral Chemical Imaging for Food Authentication)

Abstract

:

Featured Application

This study used a 1064 nm dispersive point-scan Raman system for simultaneous detection of Sudan-I and metanil yellow in curry powder. The 1064 nm dispersive Raman system is a potential tool to detect multiple chemical contaminants in a complex food matrix for food authentication.

Abstract

Curry powder is extensively used in Southeast Asian dishes. It has been subject to adulteration by azo dyes. This study used a newly developed 1064 nm dispersive point-scan Raman system for detection of metanil yellow and Sudan-I contamination in curry powder. Curry powder was mixed with metanil yellow and (separately) with Sudan-I, at concentration levels of 1%, 3%, 5%, 7%, and 10% (w/w). Each sample was packed into a nickel-plated sample container (25 mm × 25 mm × 1 mm). One Raman spectral image of each sample was acquired across the 25 mm × 25 mm surface area. Intensity threshold value was applied to the spectral images of Sudan-I mixtures (at 1593 cm−1) and metanil yellow mixtures (at 1147 cm−1) to obtain binary detection images. The results show that the number of detected adulterant pixels is linearly correlated with the sample concentration (R2 = 0.99). The Raman system was further used to obtain a Raman spectral image of a curry powder sample mixed together with Sudan-I and metanil yellow, with each contaminant at equal concentration of 5% (w/w). The multi-component spectra of the mixture sample were decomposed using self-modeling mixture analysis (SMA) to extract pure component spectra, which were then identified as matching those of Sudan-I and metanil yellow using spectral information divergence (SID) values. The results show that the 1064 nm dispersive Raman system is a potential tool for rapid and nondestructive detection of multiple chemical contaminants in the complex food matrix.

1. Introduction

Food spices are often used for food coloring and flavor. Curry powder is extensively used for food seasoning in Southeast Asian dishes. It is a blend of turmeric, coriander, cumin, cardamom, paprika, and other spices. Although these spices are free of economically motivated chemical contamination in their raw form, their powder form is often reported to be contaminated with chemicals for greater economic benefit. Instances of economically motivated adulteration of turmeric and paprika, the primary ingredients in curry powder, by metanil yellow and Sudan-I color dyes have increased the risk of chemical contamination in curry powder [1,2,3].
Metanil yellow (C18H14N3NaO3S) and Sudan-I (C16H12N2O) are azo compounds. There are over 3000 azo compounds that account for 65% of the commercial dye market [4]. Azo dyes which are used as synthetic organic colorants are characterized by chromophoric azo groups (-N=N) [4]. Azo dyes reduce to form aromatic amines under anaerobic condition and pose a carcinogenic risk to human health. Metanil yellow is toxicologically classified as a CII category by the Food and Agriculture Organization of the United Nations [5]. Due to its similar color appearance to turmeric, it is often mixed with turmeric [6]. Long-term consumption of metanil yellow causes neurotoxicity [7], hepatocellular carcinoma [8], tumor development [9], deleterious effect on gastrin mucin [10], and lymphocytic leukemia [11]. Sudan-I is a non-ionic fat-soluble azo compound [12], used as color dye to color waxes, oils, petrol, plastics, printing inks, shoes, and polishes. Sudan-I is carcinogenic to humans [13]. It has been classified as a category III carcinogen by the International Agency for Research on Cancer [14]. Due to the low cost, wide availability, and similar color appearance of Sudan-I to spice powders like chili and paprika, it is illegally used as a food color additive [12,15,16].
Several studies are reported for detection of chemical contamination in spice powders. Conventional analytical methods such as high-performance liquid chromatography (HPLC) [17,18], polymerase chain reaction [19], and high performance capillary electrophoresis [20] are used for detection of chemical contaminants in chili and turmeric. Color dyes contamination in chili powder and paste was determined using HPLC-electrospray ionization tandem mass spectrometry [21]. Dixit et al. (2008) used a two-directional HPLC method for detection of curcumin, metanil yellow, and Sudan dye in turmeric, chili, and curry powder [22]. Although these methods have high accuracy, factors including high operational costs, requirement for skilled personnel, complicated sample preparation procedure, solvent disposal, and protracted sampling time limit their field application for rapid and non-destructive detection for food safety and quality evaluation.
Fourier transform Raman (FT-Raman) spectroscopy using a 1064 nm laser source and a commercial Raman spectroscopic system (using 514 nm and 785 nm laser source), coupled with a surface-enhancement method are used for detecting chemical contamination in food spices [23]. Dhakal et al. (2016) used FT-Raman for detection of metanil yellow contamination in turmeric [1]. Turmeric and metanil yellow were mixed in de-ionized water to obtain a homogenously mixed sample. The liquid sample was filled in a NMR tube, held and adjusted in the sample compartment to focus the laser light on the sample for spectral measurement. Cheung et al. (2010) used a surface-enhancement Raman spectroscopic method to detect Sudan-I contamination in chili [24]. In these systems, the sample is adjusted to focus the incident light on the sample surface for spectral measurement from selected spots. The need for sample adjustment for each subsequent measurement precludes these systems measuring a large surface area of the sample. These techniques, being spot measurement, are useful for evaluation of homogenous samples only. Detection of chemical contaminants in food powders requires spectral measurement of the entire surface area of the sample.
The hyperspectral imaging technique is used for collection of spectral images of large samples. A line-scan 785 nm Raman chemical imaging system was developed for evaluation of food safety and quality [25]. The system has been used for authentication of food powders by detection of chemical contaminants such as azodicarbonamide in flour [25]; melamine, benzoyl peroxide, and maleic anhydride in skim milk powder, wheat flour, and corn starch [26]; and urea in skim milk powder [27]. However, pigmented food samples such as curry powder, turmeric, and paprika and chemical contaminants such as metanil yellow and Sudan dye emit high fluorescence. The 785 nm Raman chemical imaging system cannot be used to measure these samples. It is a challenge for currently available Raman systems to authenticate curry powder contaminated with azo dyes such as Sudan-I and metanil yellow.
This study used a newly developed 1064 nm dispersive Raman system [28] to measure curry powder mixed with Sudan-I and (separately) with metanil yellow at different concentrations for detection of Sudan-I and metanil yellow contamination in curry powder. This study further demonstrates the use of the 1064 nm Raman system for simultaneous detection of multiple contaminants (Sudan-I and metanil yellow) in curry powder. Self-modeling mixture analysis (SMA) was used to decompose the multi-component spectra of the sample mixture and extract pure component spectra of Sudan-I and metanil yellow. The primary objectives of this study are to:
(1)
Obtain Raman spectral images of curry powder–metanil yellow, curry powder–Sudan I, and curry powder–metanil yellow-–Sudan I samples prepared at different concentrations using the 1064 nm Raman system;
(2)
Identify the vibrational modes which are effective markers for specific chemical structural features unique to the metanil yellow and Sudan-I and discrete from the curry powder matrix vibrational modes;
(3)
Detect Sudan-I and metanil yellow contamination in curry powder at different concentrations;
(4)
Use self-modeling mixture analysis to resolve the multi-component spectra of curry powder–metanil yellow–Sudan I mixture sample into pure component spectra and scores for simultaneous detection of Sudan-I and metanil yellow.

2. Materials and Methods

2.1. Point-Scan Raman System

The Raman spectrograph uses a high throughput volume phase grating (VPG) (BaySpec, Inc., San Jose, CA, USA) optimized for 1064 nm laser excitation [28]. The scattering Raman signal from the sample is directed to the VPG through a concave mirror in the spectrograph. The VPG diffracts the incoming light into different angular output paths. The dispersed light is reflected to the 512 pixels Indium-Gallium-Arsenide (InGaAs) detector (Nunavut, Bayspec, Inc., San Jose, CA, USA). A USB cable connects the detector directly with the computer for detector control and data transfer. The detector is thermoelectrically cooled to −55 °C during spectral acquisition to minimize the dark current.
The sample is held and moved in two perpendicular directions using a two-axis motorized positioning table (MAXY4009W1-S4, Velmex, Bloomfield, NY, USA). The sample movement is controlled by stepper motor controller. The sample is moved in X- and Y-axes, below the fixed position Raman probe, collecting Raman spectra of the sample by point-scan method. The Raman spectra are accumulated to obtain a hyperspectral Raman image of the sample, which can be analyzed both spectrally and spatially.
An interface software is developed in-house for parameter setup and data transfer. The software is used to control the operational parameters of the system such as initialization, adjusting exposure time, spectral acquisition and display, sample movement, and data transfer and storage. The interface software was developed using the software development kit (SDK) of the InGaAs detector and the positioning table. The hyperspectral data acquired by the interface software is stored in band interleaved by pixel (BIP) format, which can be analyzed by ENVI (ITT Visual Information Solutions, Boulder, CO, USA) and Matlab (MathWorks, Natick, MA, USA).
Spectral calibration of the Raman system was done using polystyrene and naphthalene. After spectral calibration, the Raman system covered the wavenumber range of 142 cm−1 to 1820 cm−1. The system has a spectral resolution of 12 cm−1 at full width half maximum (FWHM). A standard resolution test chart (Edmund Optics Inc., Barrington, NJ, USA) was used to evaluate the spatial resolution of the system. The system has a spatial resolution of 0.1 mm.

2.2. Sample Preparation

Sudan-I (95% dye, Aldrich, Carson City, NV, USA), metanil yellow (70% dye, Aldrich, Carson City, NV, USA), and organic curry powder (Frontier Natural Products CO-OP, Norway, IA, USA) were used to prepare mixture samples. Curry powder–Sudan I and curry powder–metanil yellow mixture samples were prepared separately at 1%, 3%, 5%, 7%, and 10% (w/w) concentrations by mixing the powders in a vortex mixer (Scientific Industries Inc., Bohemia, NY, USA) for 10 min. For simultaneous detection of the two azo compounds in the curry powder, Sudan-I and metanil yellow (5% each, w/w) were mixed together with the curry powder in the vortex mixer for 10 min. Each sample was packed in a shallow nickel-plated sample container (25 mm × 25 mm × 1 mm), and the surface was leveled flush with the top edge of the sample container. An amount of 0.27 g of mixture sample at each concentration level was prepared to completely fill the volume of the sample container for Raman spectral measurement.

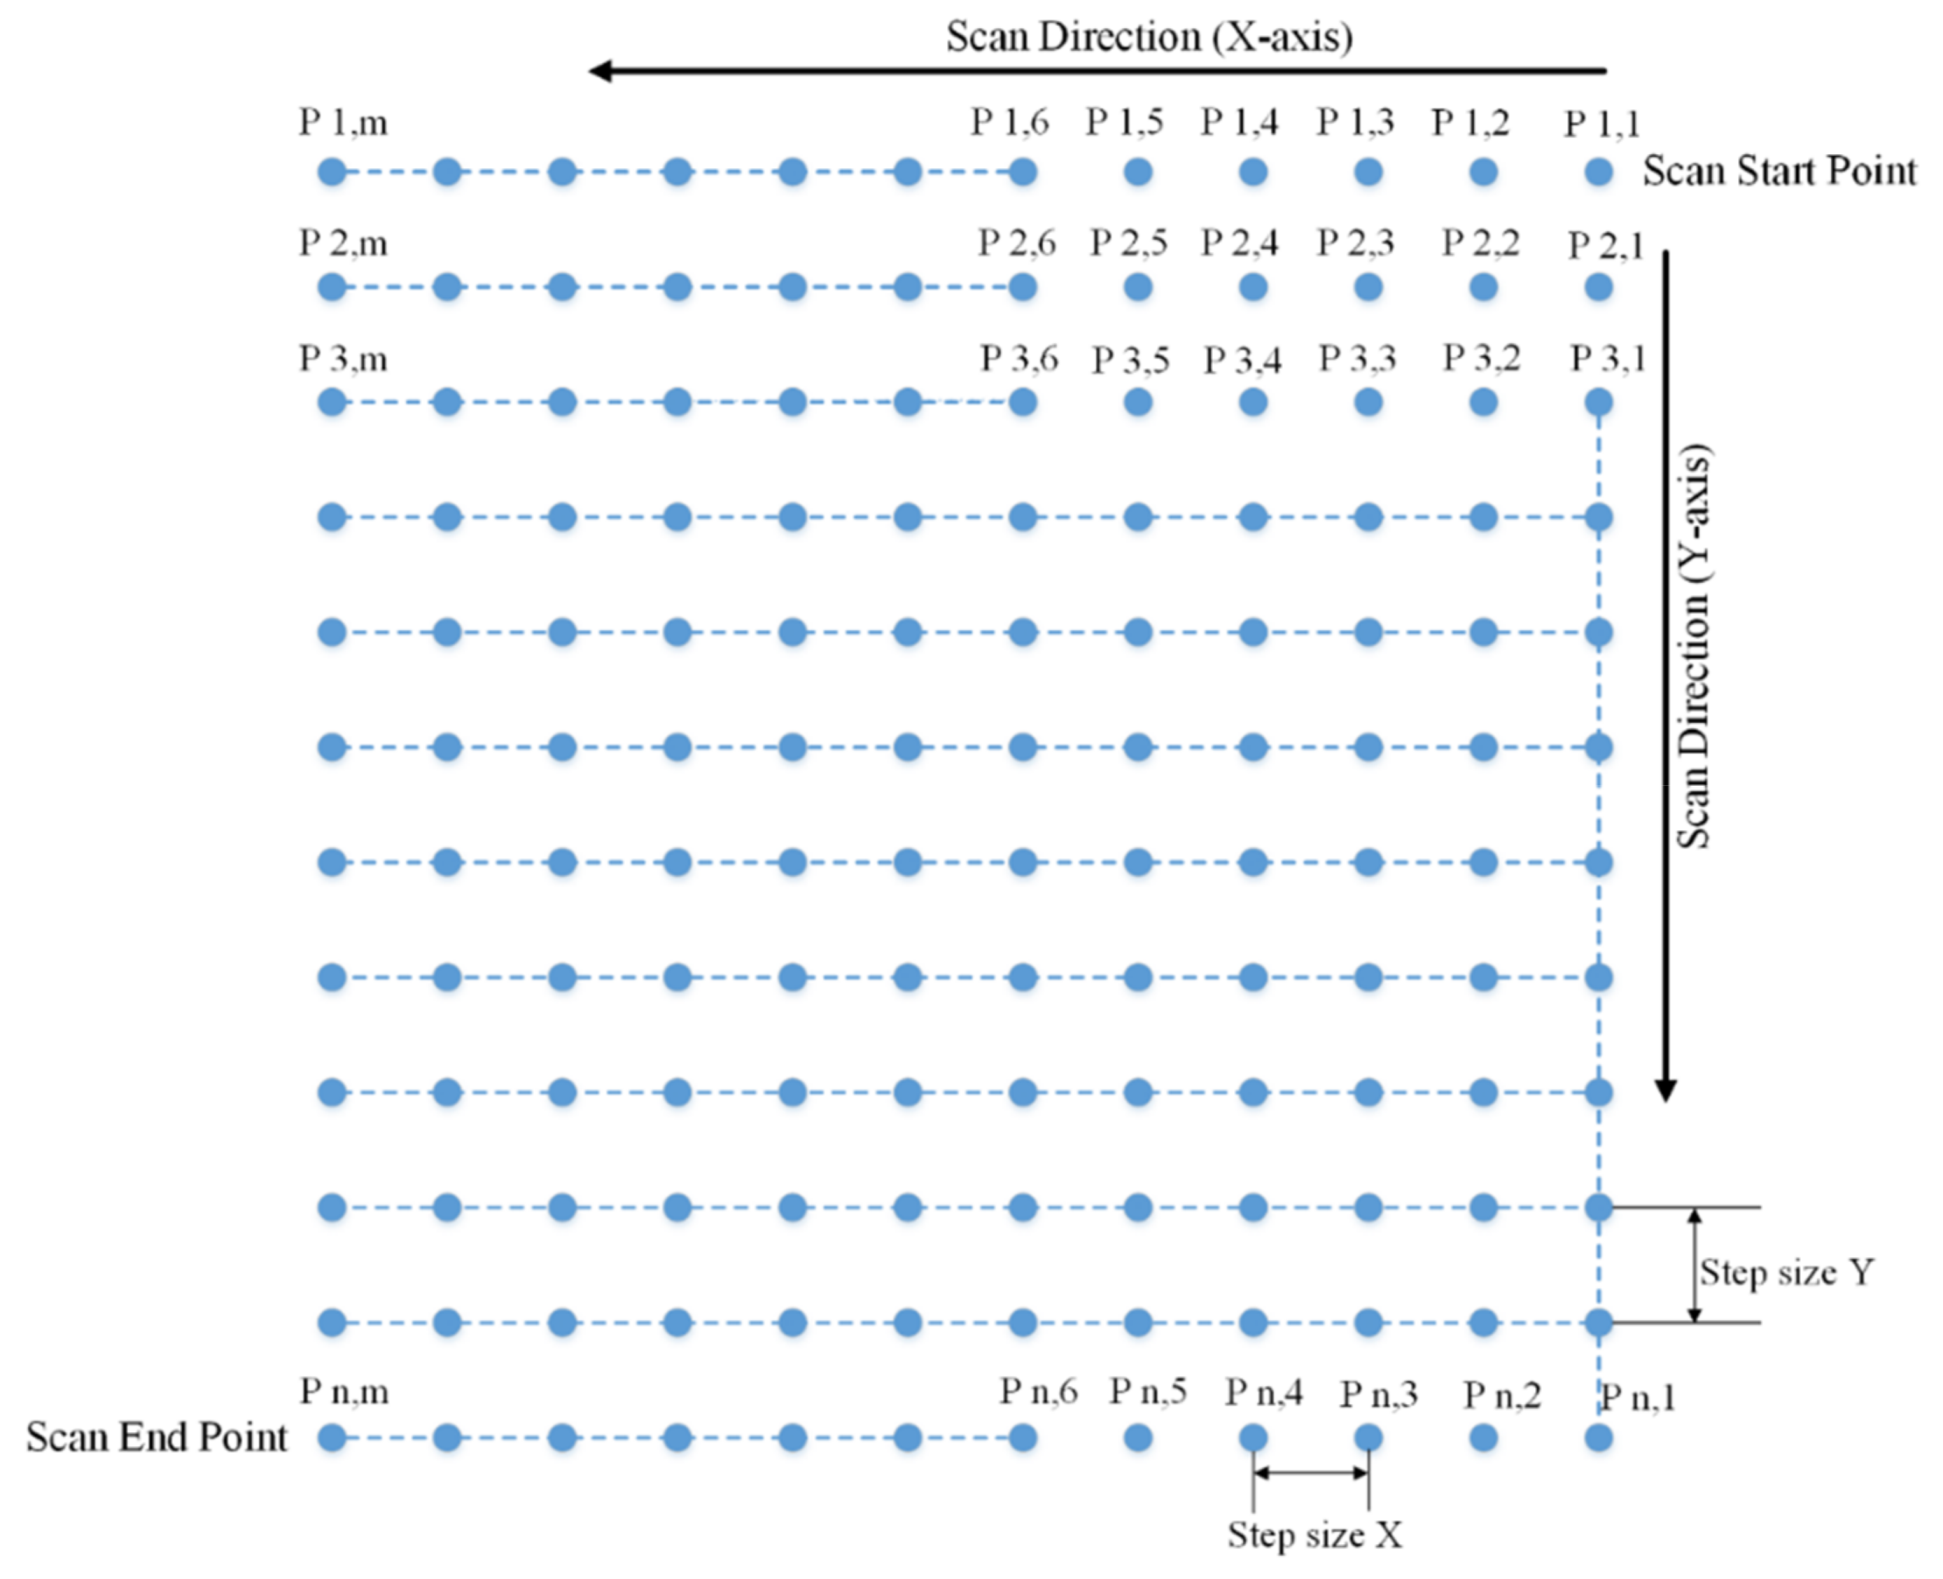
2.3. Acquisition of Spectral Image

Each sample was held immobile in the two-stage moving platform. An exposure time of 1 s and laser power of 120 mW was used for collection of spectral signal. Figure 1 shows the process of acquiring the spectral image by the point-scan method. The process is a row-wise scan. After collecting Raman spectrum from a point, the sample is moved horizontally (X-axis) with a 0.25 mm increment to the next point. After completing the Raman spectral measurement from the first row, the sample is moved vertically (Y-axis) to the next row with a 0.25 mm increment. The process was repeated to collect Raman spectra across the 25 mm × 25 mm surface area of the sample. The Raman spectra were accumulated spatially to construct a hyperspectral image of the sample. The final sample image was a 100 × 100 × 512 hyperspectral cube with 10,000 spatial pixels, each of 512 spectral wavenumbers. One hyperspectral cube was constructed for each mixture sample. Prior to acquisition of Raman spectra, a dark current spectrum was acquired with the laser off and a cap covering the probe. The dark current spectrum was subtracted from the Raman spectrum at each pixel during spectral measurement.

2.4. Spectral Image Analysis

For identification of Sudan-I and metanil yellow mixed separately with curry powder, the hyperspectral images were analyzed in ENVI (4.5, IIT Visual Information Solutions, Boulder, CO, USA). The hyperspectral images of the curry powder–Sudan I sample across all the concentration range were converted into a single band images using the spectral peak of Sudan-I. Similarly, curry powder–metanil yellow hyperspectral images were converted into single band images using the spectral peak of metanil yellow. It was observed that the spectral intensity of the Sudan-I and metanil yellow were intense compared to the spectral intensity of curry powder in the single band images. An intensity threshold value was set to obtain binary detection images by converting all the pixels with intensities below the threshold value into background (curry powder) pixels, and the pixels with intensities above the threshold value into white pixels representing the chemical contaminant in the mixture.
The hyperspectral Raman image of curry powder–Sudan I–metanil yellow mixture sample contained mixed spectral information of each component. The three-dimensional hyperspectral Raman image (100 × 100 × 512) of the sample was reshaped into two-dimensional spectral data (10,000 × 512) using Matlab (R2013a, MathWorks, Natick, MA, USA). The mixed spectral signal from the mixture sample was decomposed into pure component spectra of individual components using the self-modeling mixture analysis (SMA) method. Using SMA requires a pure variable in the mixed spectral data. This is the Raman wavenumber at which only one component contributes significant signal intensity. SMA determines pure variables in the first step; next it resolves mixed spectral data into pure component spectra (and contributions) by alternating least squares method [29,30,31]. Extraction of pure components spectra by SMA requires obtaining a series of purity spectra, for which the average and standard deviation spectra of the data being analyzed is calculated. A correction factor is added to the average spectrum to reduce the effect of noise. The first purity spectrum is obtained by dividing the standard deviation spectrum by the average spectrum. The first pure variable is the Raman wavenumber with the maximum intensity in the first purity spectrum. The second purity spectrum is obtained by multiplying the first purity spectrum with the determinant-based weight function. The weight function is obtained by calculating the correlation matrix from the mixed data matrix being analyzed. The Raman wavenumber with the maximum intensity in the second purity spectrum is the second pure variable. The process of obtaining purity spectrum and pure variable is repeated until the purity spectra no longer exhibit spectral features [29,30,32]. The purity function in the PLS_Toolbox (Eigenvector Research, Inc., Wenatchee, WA, USA) was used to decompose the 10,000 × 512 mixed spectral matrix from the sample mixture to obtain pure component spectra and corresponding score vectors. The score vectors (10,000 × 1) of each component were converted into two-dimensional contribution images (100 × 100) to match the spatial dimension of the hyperspectral Raman image of the sample.
After obtaining the pure component spectra of two chemical contaminants, spectral information divergence (SID) was used to match each spectrum to their corresponding components. SID compares the dissimilarity between two spectra by relative entropy [33]. Two similar spectra with less discrepancy have low SID value. Each pure component spectra were compared with the reference spectra of the components and SID value was obtained. The spectra with least SID value was assigned as the spectra matching the component.
The contribution images of each component were imported into ENVI for further analysis. A pixel intensity threshold value was set to obtain a binary image of each component in the contribution images. A pixel value greater than the set threshold value represented a contaminant pixel. For visualization purpose, the binary images of Sudan-I and metanil yellow were fused together and simple image processing was performed to color code the detected Sudan-I and metanil yellow pixels [34].

3. Results and Discussion

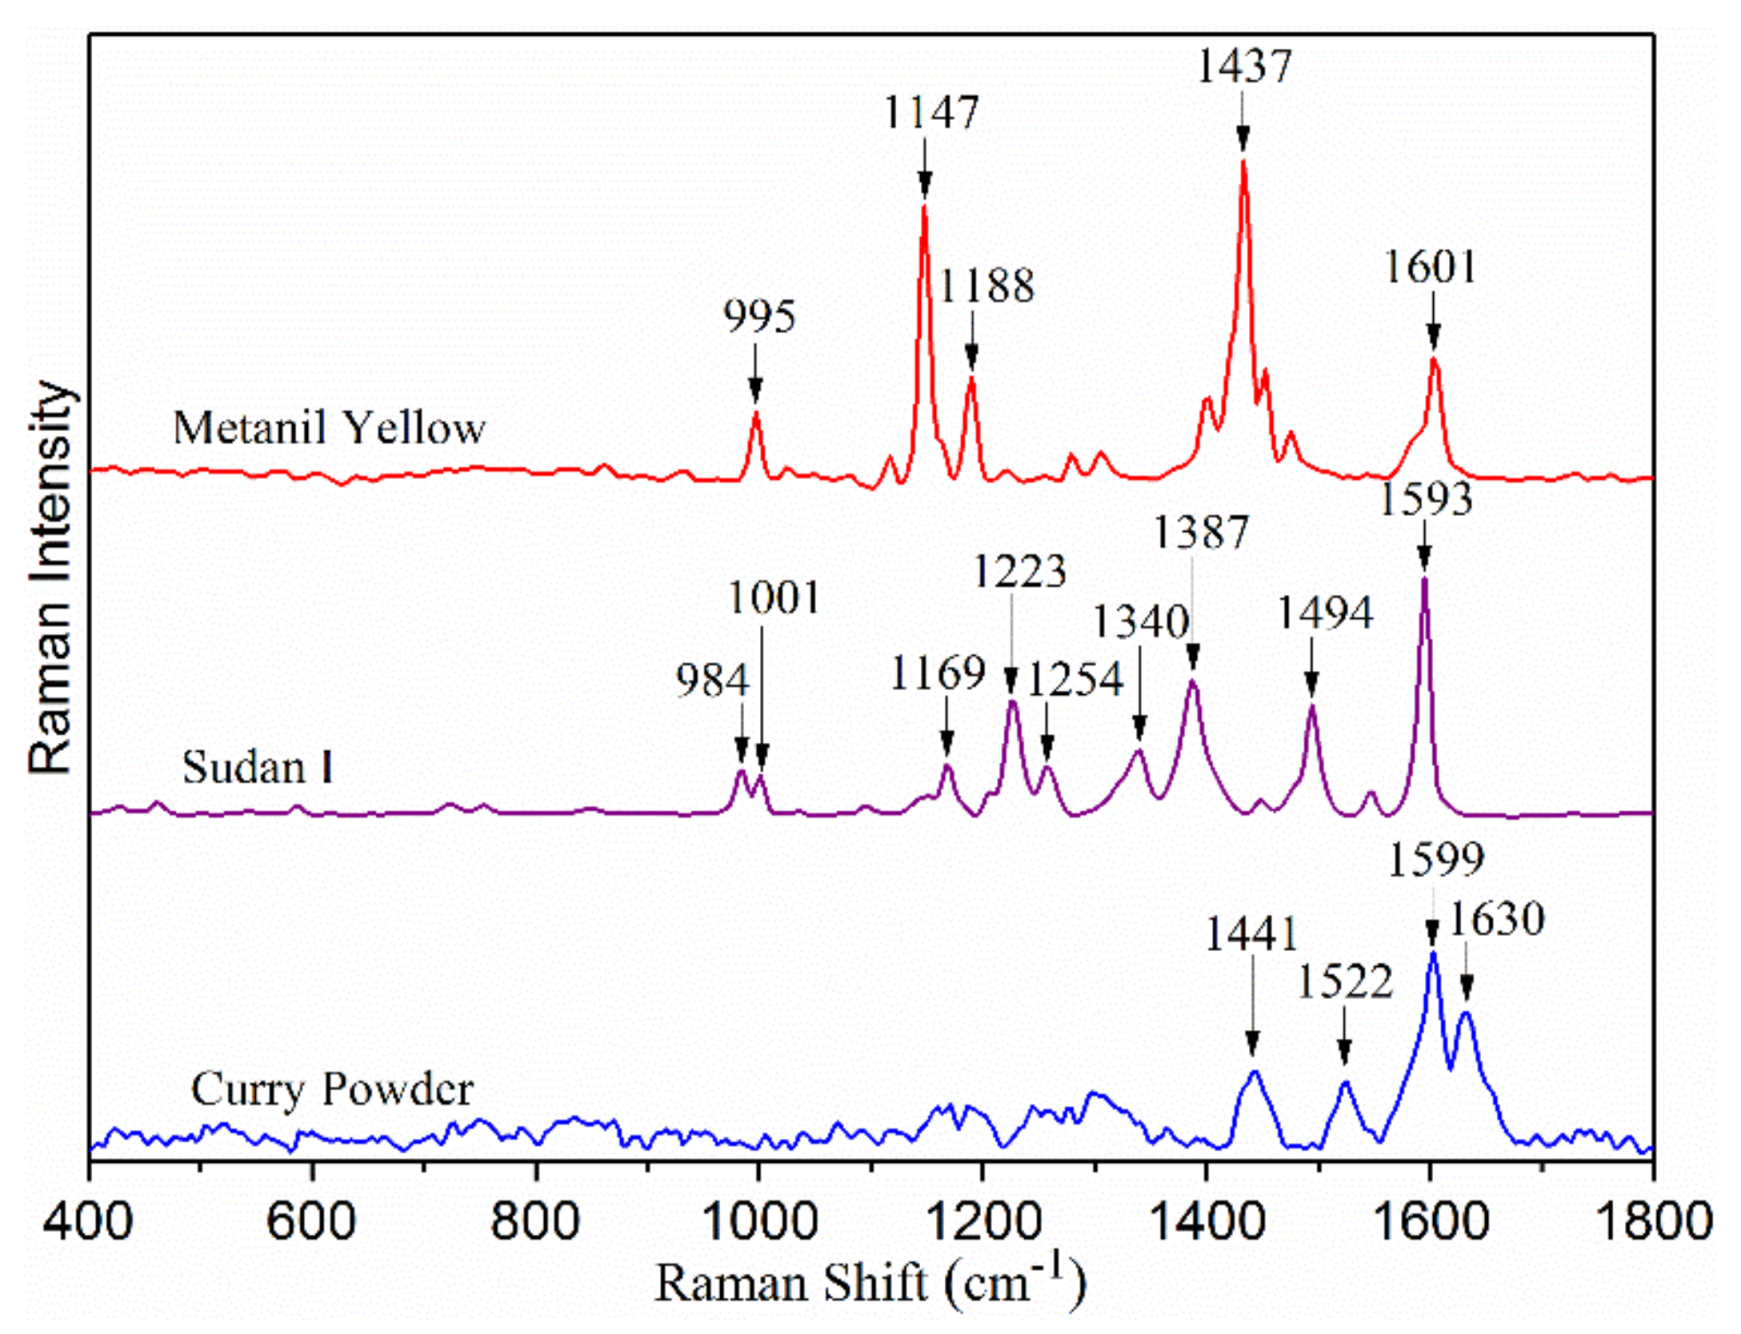
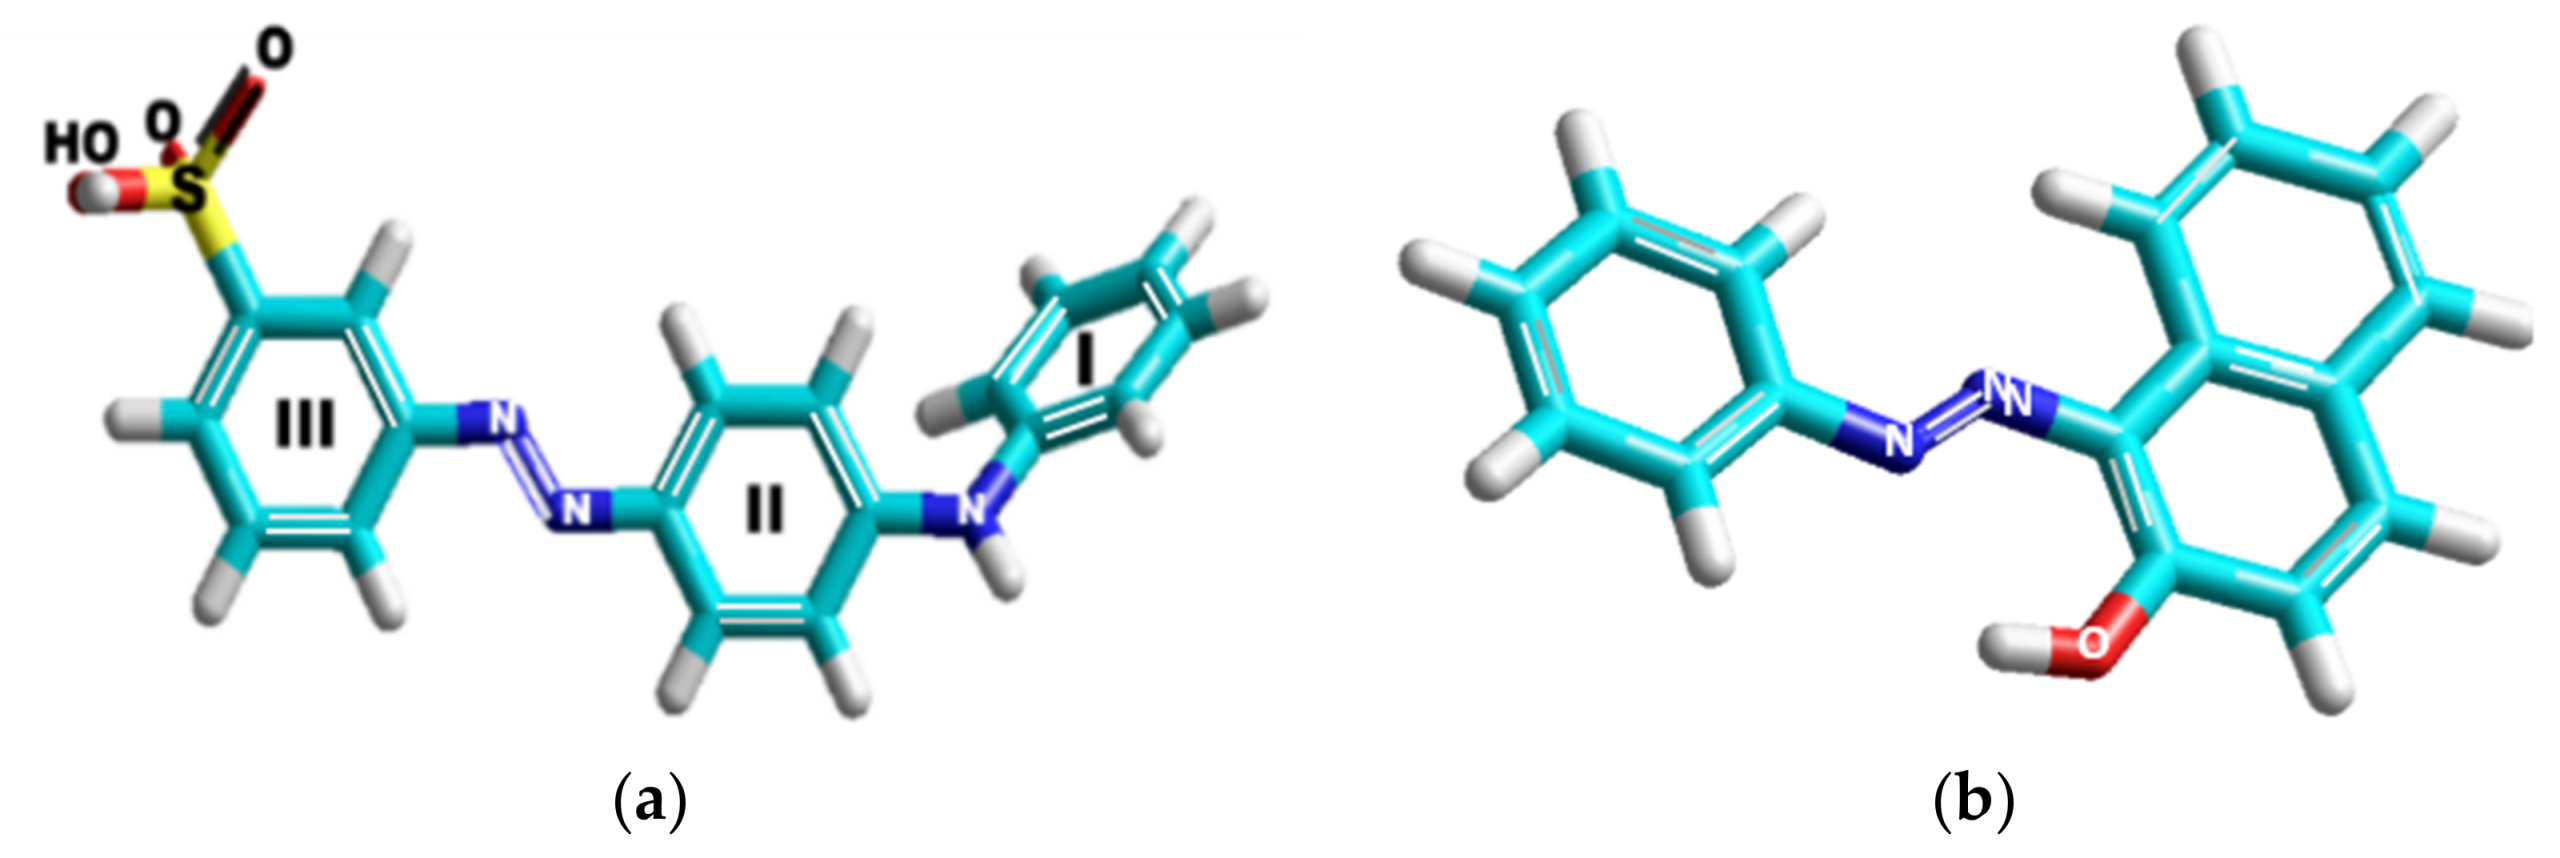
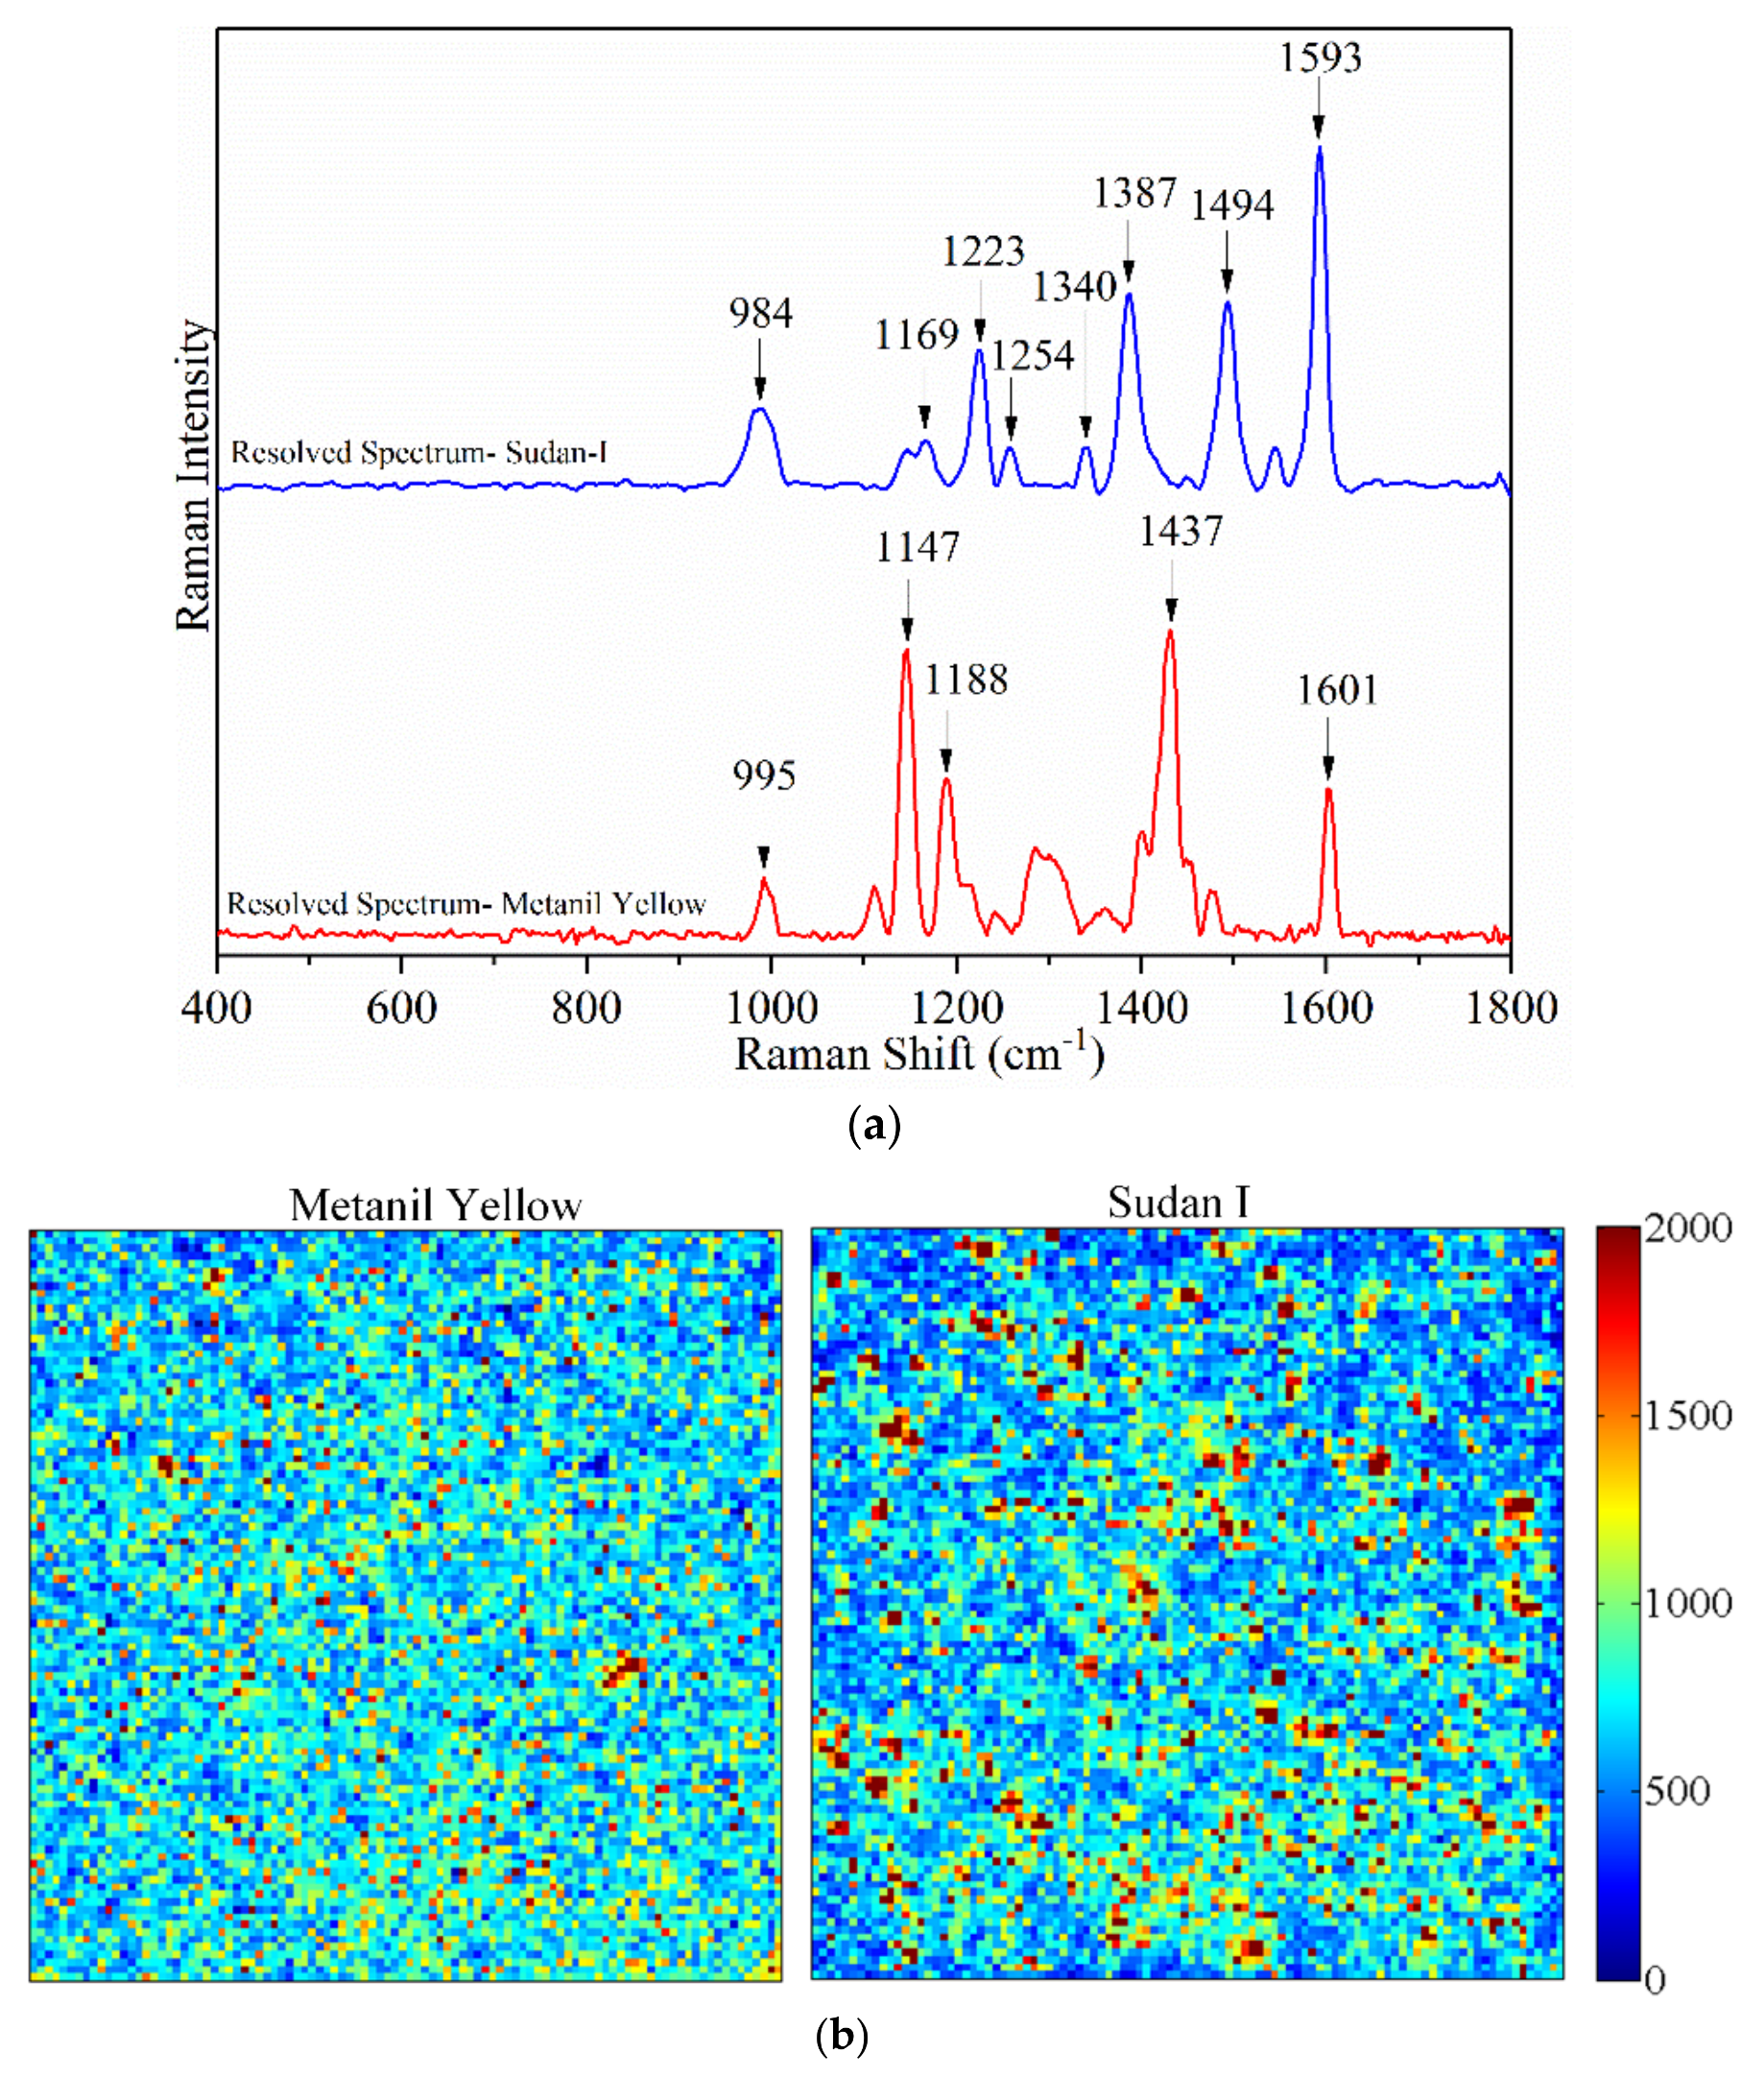
3.1. Spectral Characteristics of Samples

The chemical structures of synthetic and natural yellow compounds are dissimilar and thus the vibrational modes resulting from their chemical structures will be different. Figure 2 shows the Raman spectra of metanil yellow, Sudan-I, and curry powder in the range of 400 cm−1 to 1800 cm−1 and Table 1 shows the assignment of Raman spectral bands. Figure 3 shows the chemical structure of metanil yellow, and Sudan-I. Metanil yellow (Figure 3a) has three unidentical aromatic rings with three nitrogen atoms (N=N and -NH) and one sulphate group (SO3). No methylene (CH2), methyl (CH3) sites, and no organic acid (-COOH), ketone (O=C), or hydroxyl (-OH) moieties are present in the molecule. Ring I is monosubstituted, Ring II is di (1,4-)-substituted, and Ring III is di(1,3-)-substituted.
Both metanil yellow (Figure 3a) and Sudan-I (Figure 3b) contain the same N=N molecular moiety and include seven conjugated C=C bonds in series which explains their similar yellow color. The three aromatic C=C double bonds in ring I in metanil yellow are conjugated only with each other and thus do not shift its visible spectrum from yellow. The two additional double bonds in the naphthene group in Sudan-I are essentially in parallel with the three conjugated ring sites and therefore also do not shift its wavelength from yellow. Curry containing turmeric has a chemical structure that includes only five conjugated double bonds and a keto-enol moiety; its color is also yellow due the added conjugation from phenolic and methoxy sites on its ring sites. Thus, the overlapping spectral bands in the visible wavelength range cannot be used to differentiate between the natural color in spices and synthetic dyes, nor even to differentiate between the synthetic dye structures. Although different natural and synthetic dyes each have a different individual absorptivity coefficient and an individual visible spectral fingerprint, in practice deconstructing the mixture into constituent components accurately is not possible without a priori knowing precisely which chemicals and which structural analogs in the mixtures will contribute to the visible yellow spectral signal. Finally, since the visible spectra of many natural and synthetic dyes are routinely pH dependent, unless each and every reference spectra of all the compounds in a mixture and the sample are collected at the same pH, any calculations based upon the reference standard data will be uncertain and/or invalid.
The spectrum range of 400 cm−1 to 1800 cm−1 contains vibrational modes that discern the structural components of the dyes of interest. The Raman spectra in this region is a fingerprint of the dye coded with discrete structural information about the dye structure. Interpretation of the spectral “code” is essential to minimize false positive results which are possible due to spectral lines close to but not identical to marker frequencies. Interpretation also is critical in assigning marker frequencies which can detect structural analogs, including potential metabolites of the compounds of interest.
Metanil yellow and Sudan-I are structural analogs of each other. Each has three aromatic rings and an azo group (-N=N-) between the two of them. Rings III and II plus the azo group between the two at the molecular level are co-planar, which causes the yellow color chromophore in both compounds. Three vibrational modes in Sudan-I and metanil yellow relating to the azo group are similar: 1593 cm−1 and 1597 cm−1 (N=N stretching), 1448 cm−1 and 1452 cm−1 (N=N stretching + H-C bending in H-C=C-N=), and 1169 cm−1 and 1147 cm−1 (C-N=stretching + H-C bending in H-C=C-N=) [34,35]. The H-C=C-N= bending components in vibrational modes near 1450 cm−1 corresponds to H-C=C-N= sites on Ring III and are similar for both dyes. The H-C=C-N= bending component in the vibrational mode at 1169 cm−1 in Sudan-I is present in metanil yellow in its IR spectrum (1171 cm−1). Thus 1169 cm−1 and 1147 cm−1 are assignable as sym and asym vibrational modes to the same molecular site on Ring III, that is, H-C6=C1. The absence of a Raman peak near 1169 cm−1 in metanil yellow spectrum could be due to the moiety H-C2=C1- on Ring III being predominantly symmetrical.
The metanil yellow peak at 995 cm−1 due to ring breathing in ring II also confirms the presence of metanil yellow. The Sudan-I peak at 1593 cm−1 due to N=N stretching is most definitive for its identification. The 1340 cm−1 and 1387 cm−1 Sudan-I peaks are due to aromatic ring stretching on the naphthalene ring quite different from metanil yellow and curry vibrational modes. Curry powder formulations can contain a significant amount of the compound Linalool. Linalool has a pleasant smell, and can be a major component in some essential oils. However, sets of vibrational modes corresponding to this compound were not apparent in the Raman sample data.

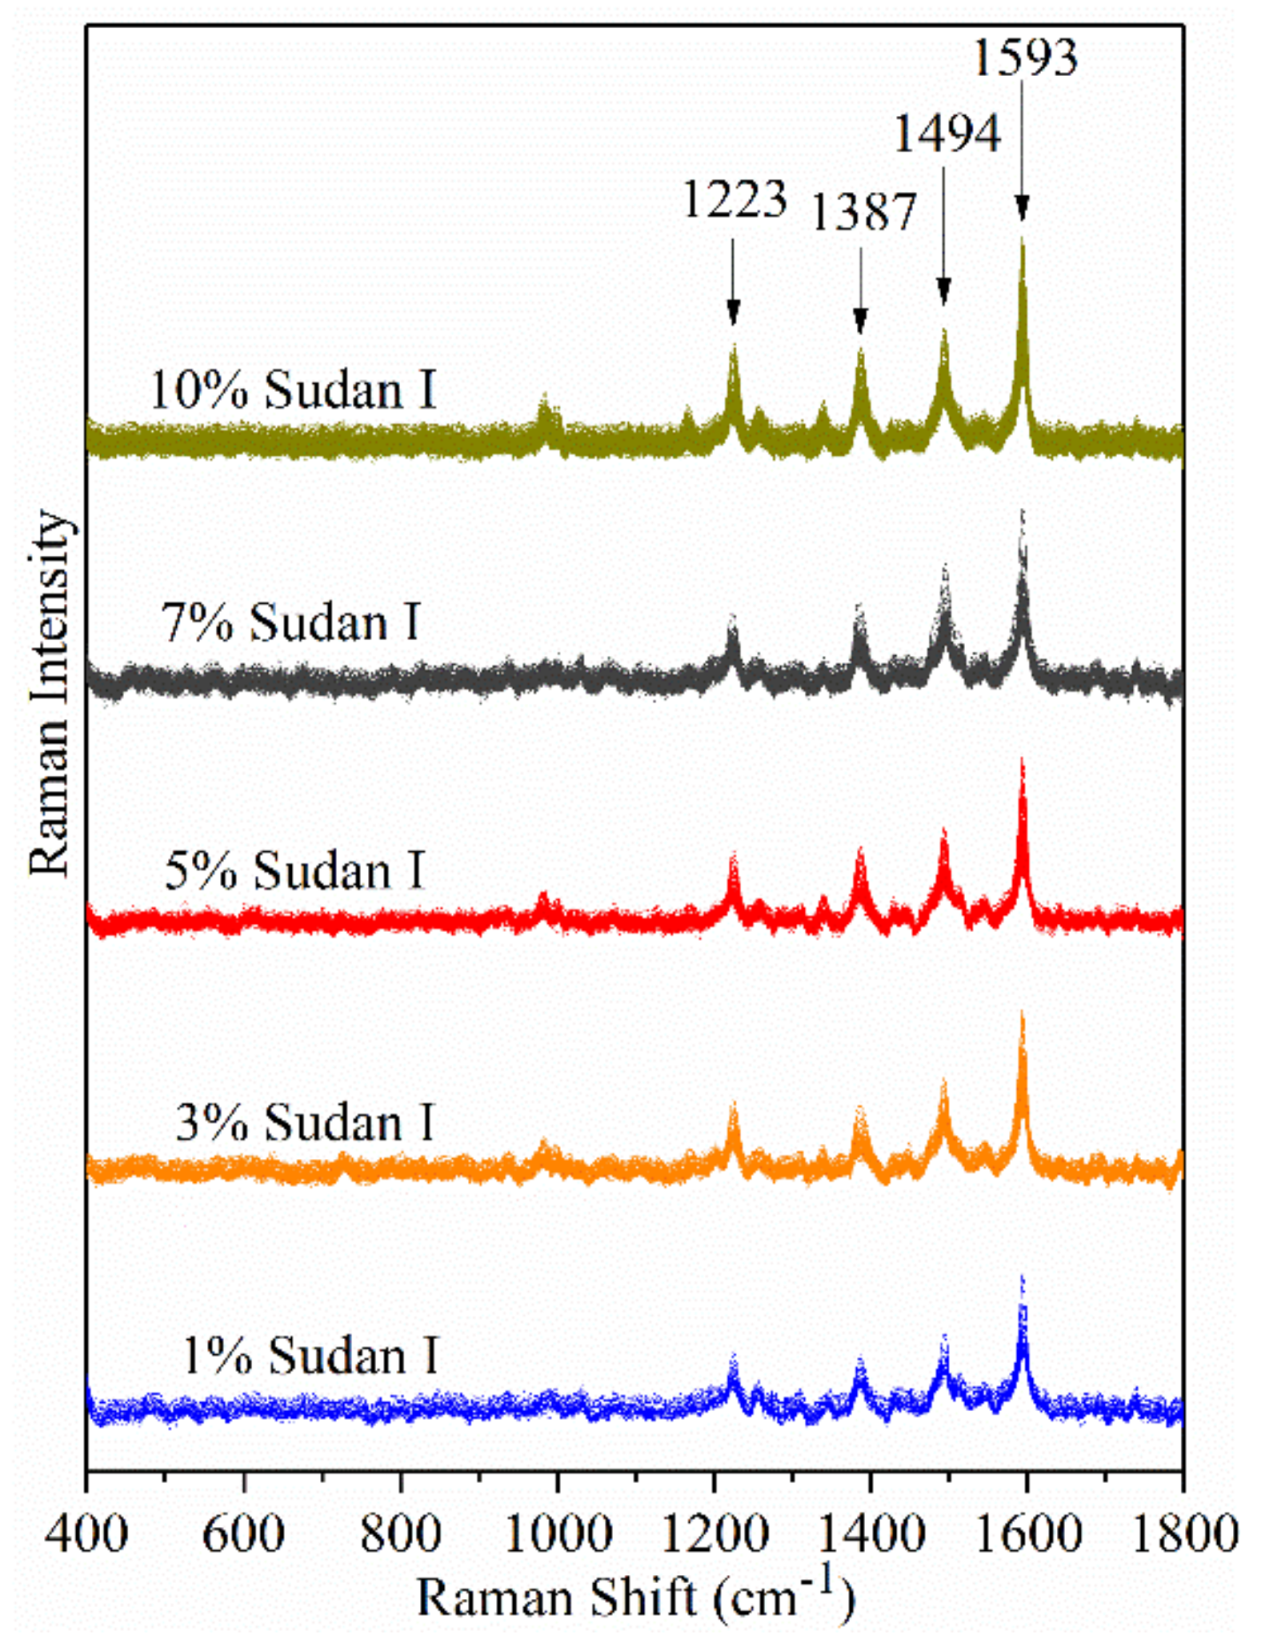
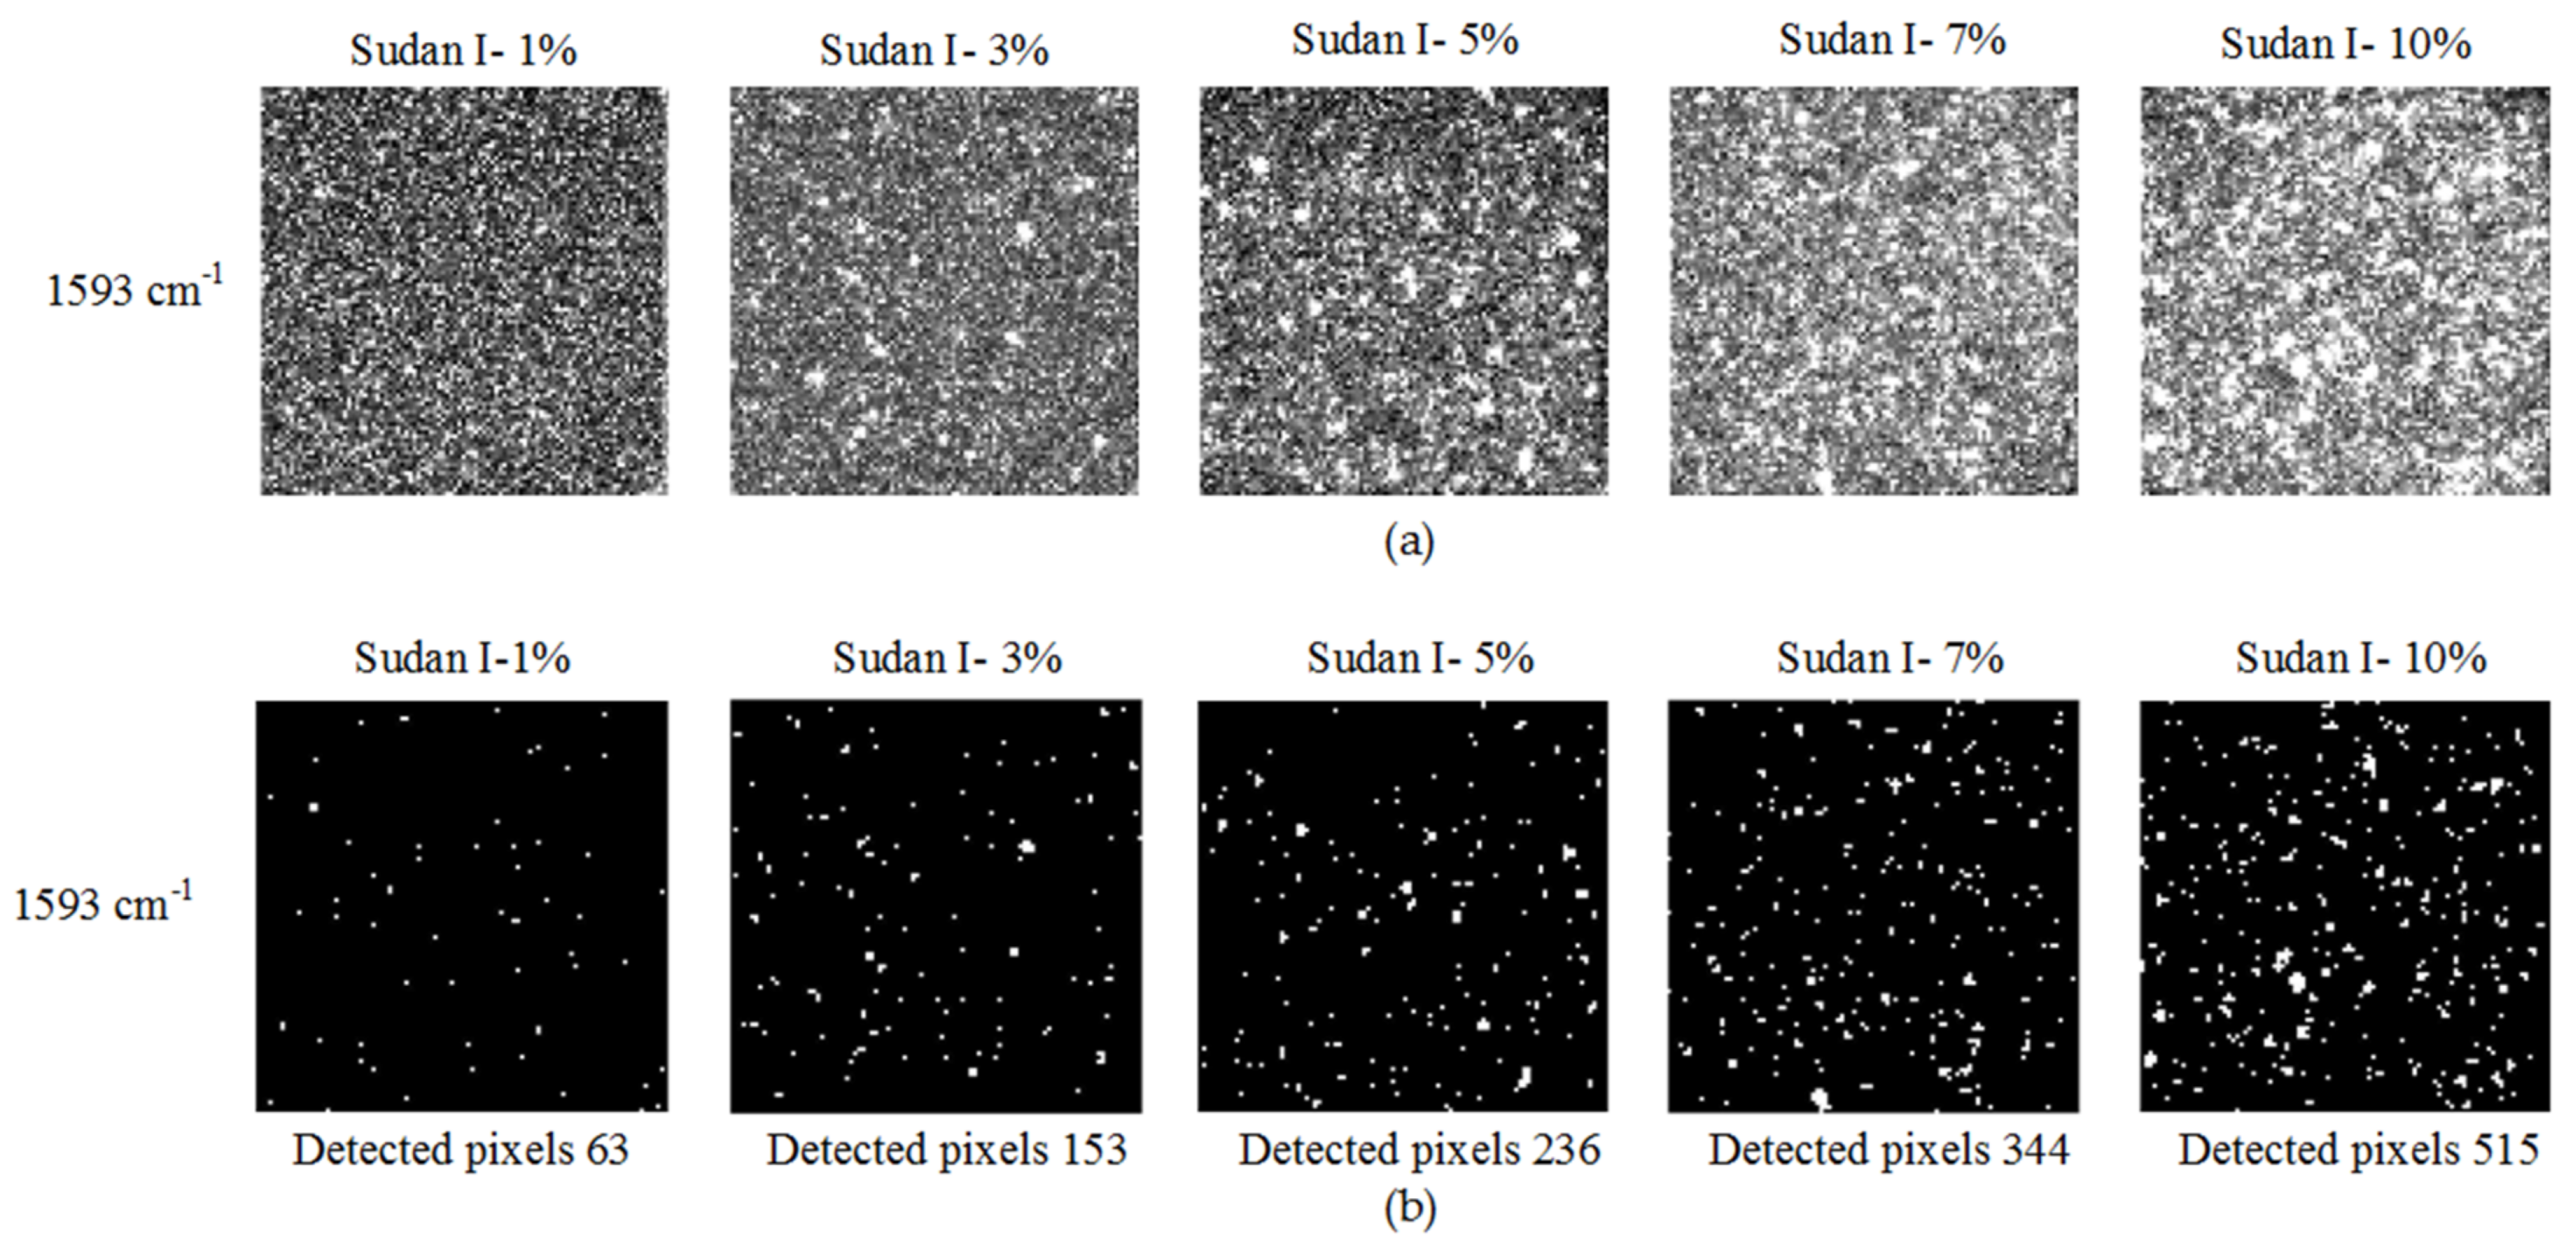
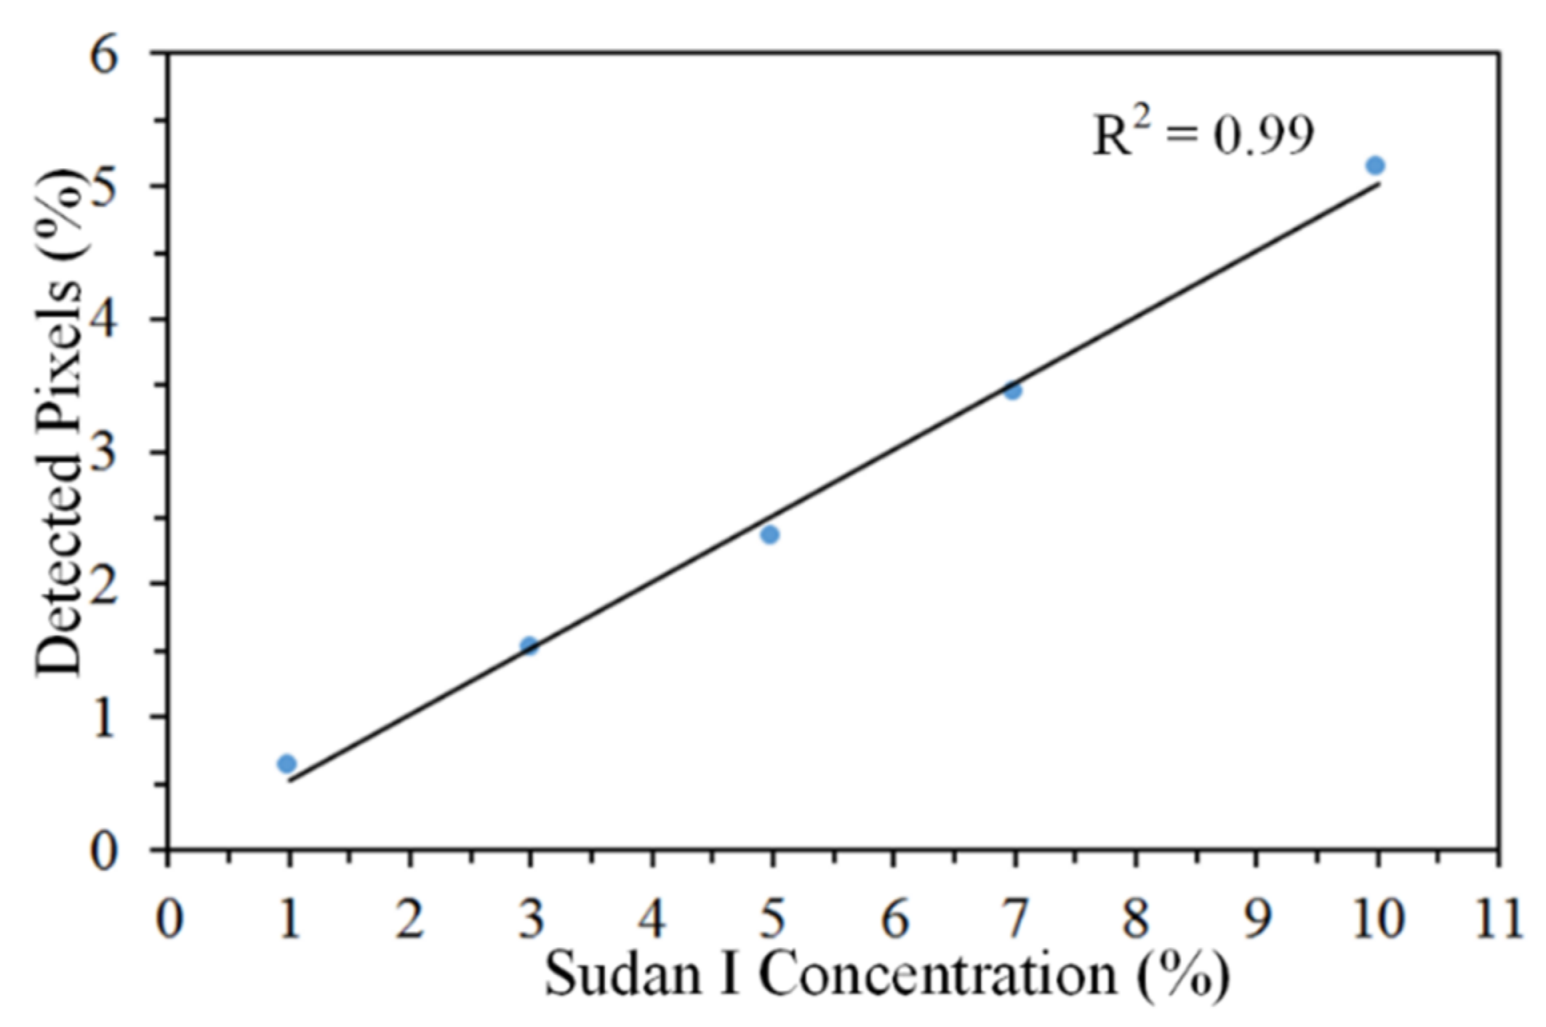
3.2. Detection of Sudan-I in Curry Powder

Figure 4a shows the raw hyperspectral Raman images of curry powder–Sudan I mixed samples across five concentration levels at 1593 cm−1. At 1593 cm−1, peak intensity of Sudan-I is higher than the peak intensity of curry powder. This information was used to create binary detection image for identification of Sudan-I pixels. An initial spectral intensity threshold value was set and all pixels with a spectral intensity below the threshold value were converted to background pixels (curry powder). All the pixels above the set threshold value were converted to white pixels representing Sudan-I. For a higher-intensity threshold value, some of the Sudan-I pixels had a spectral intensity lower than the threshold value. These pixels were also converted into background pixels (false negative). For a significantly lower-intensity threshold value, some of the curry powder pixels were misinterpreted as the Sudan-I pixels (false positive). To avoid the false-positive and false-negative cases, pixel-by-pixel evaluation of spectral pixels was performed. Each pixel was evaluated with its corresponding spectra to select the appropriate intensity threshold value. Based on the pixel-by-pixel evaluation, a final threshold value of 550 was set to obtain a binary detection image. All the pixels with intensities below 550 were converted to background pixels. The remaining pixels represent the Sudan-I pixels. Figure 4b shows the 1593 cm−1 binary detection images of samples at five concentrations. The white pixels are scattered throughout the sample surface. The number of white pixels is low in the 1% Sudan-I image, and progressively increases in the 3%, 5%, 7%, and 10% images. A gradual increase in the white pixels from 1% to 10% indicate more Sudan-I particles were detected at increasing concentration. A total of 63, 153, 236, 344, and 515 Sudan-I pixels were detected in the 1593 cm−1 binary detection images of 1%, 3%, 5%, 7%, and 10% concentration samples.
Several lumped pixels can also be observed in Figure 4b. The lumped pixels increased from a low frequency occurrence at 1% concentration to a higher frequency occurrence at 10% concentration. This increase was because the sample surface area and sample volume were held constant (25 mm × 25 mm × 1 mm) for all samples, while the sample concentration increased from 1% to 10%, resulting in overlapping of Sudan-I particles at different layers within the sample depth. Figure 5 shows the Raman spectra of detected Sudan-I pixels at 1%, 3%, 5%, 7%, and 10% concentration samples. In the figure, the number of spectra of each sample corresponds to the total number of detected Sudan-I pixels in the sample.
The progressive increase in the detected Sudan-I pixels (Figure 4b) indicates that the percentage of detected pixels and sample concentration are correlated. The 515 pixels detected in 10% sample corresponds to 5.15% of total acquired pixels. Similarly, the 63 pixels detected in 1% sample corresponds to 0.63% of total acquired pixels. The percentage of the detected pixels are linearly correlated with the Sudan-I concentration in the samples with a correlation coefficient of 0.99 (Figure 6).

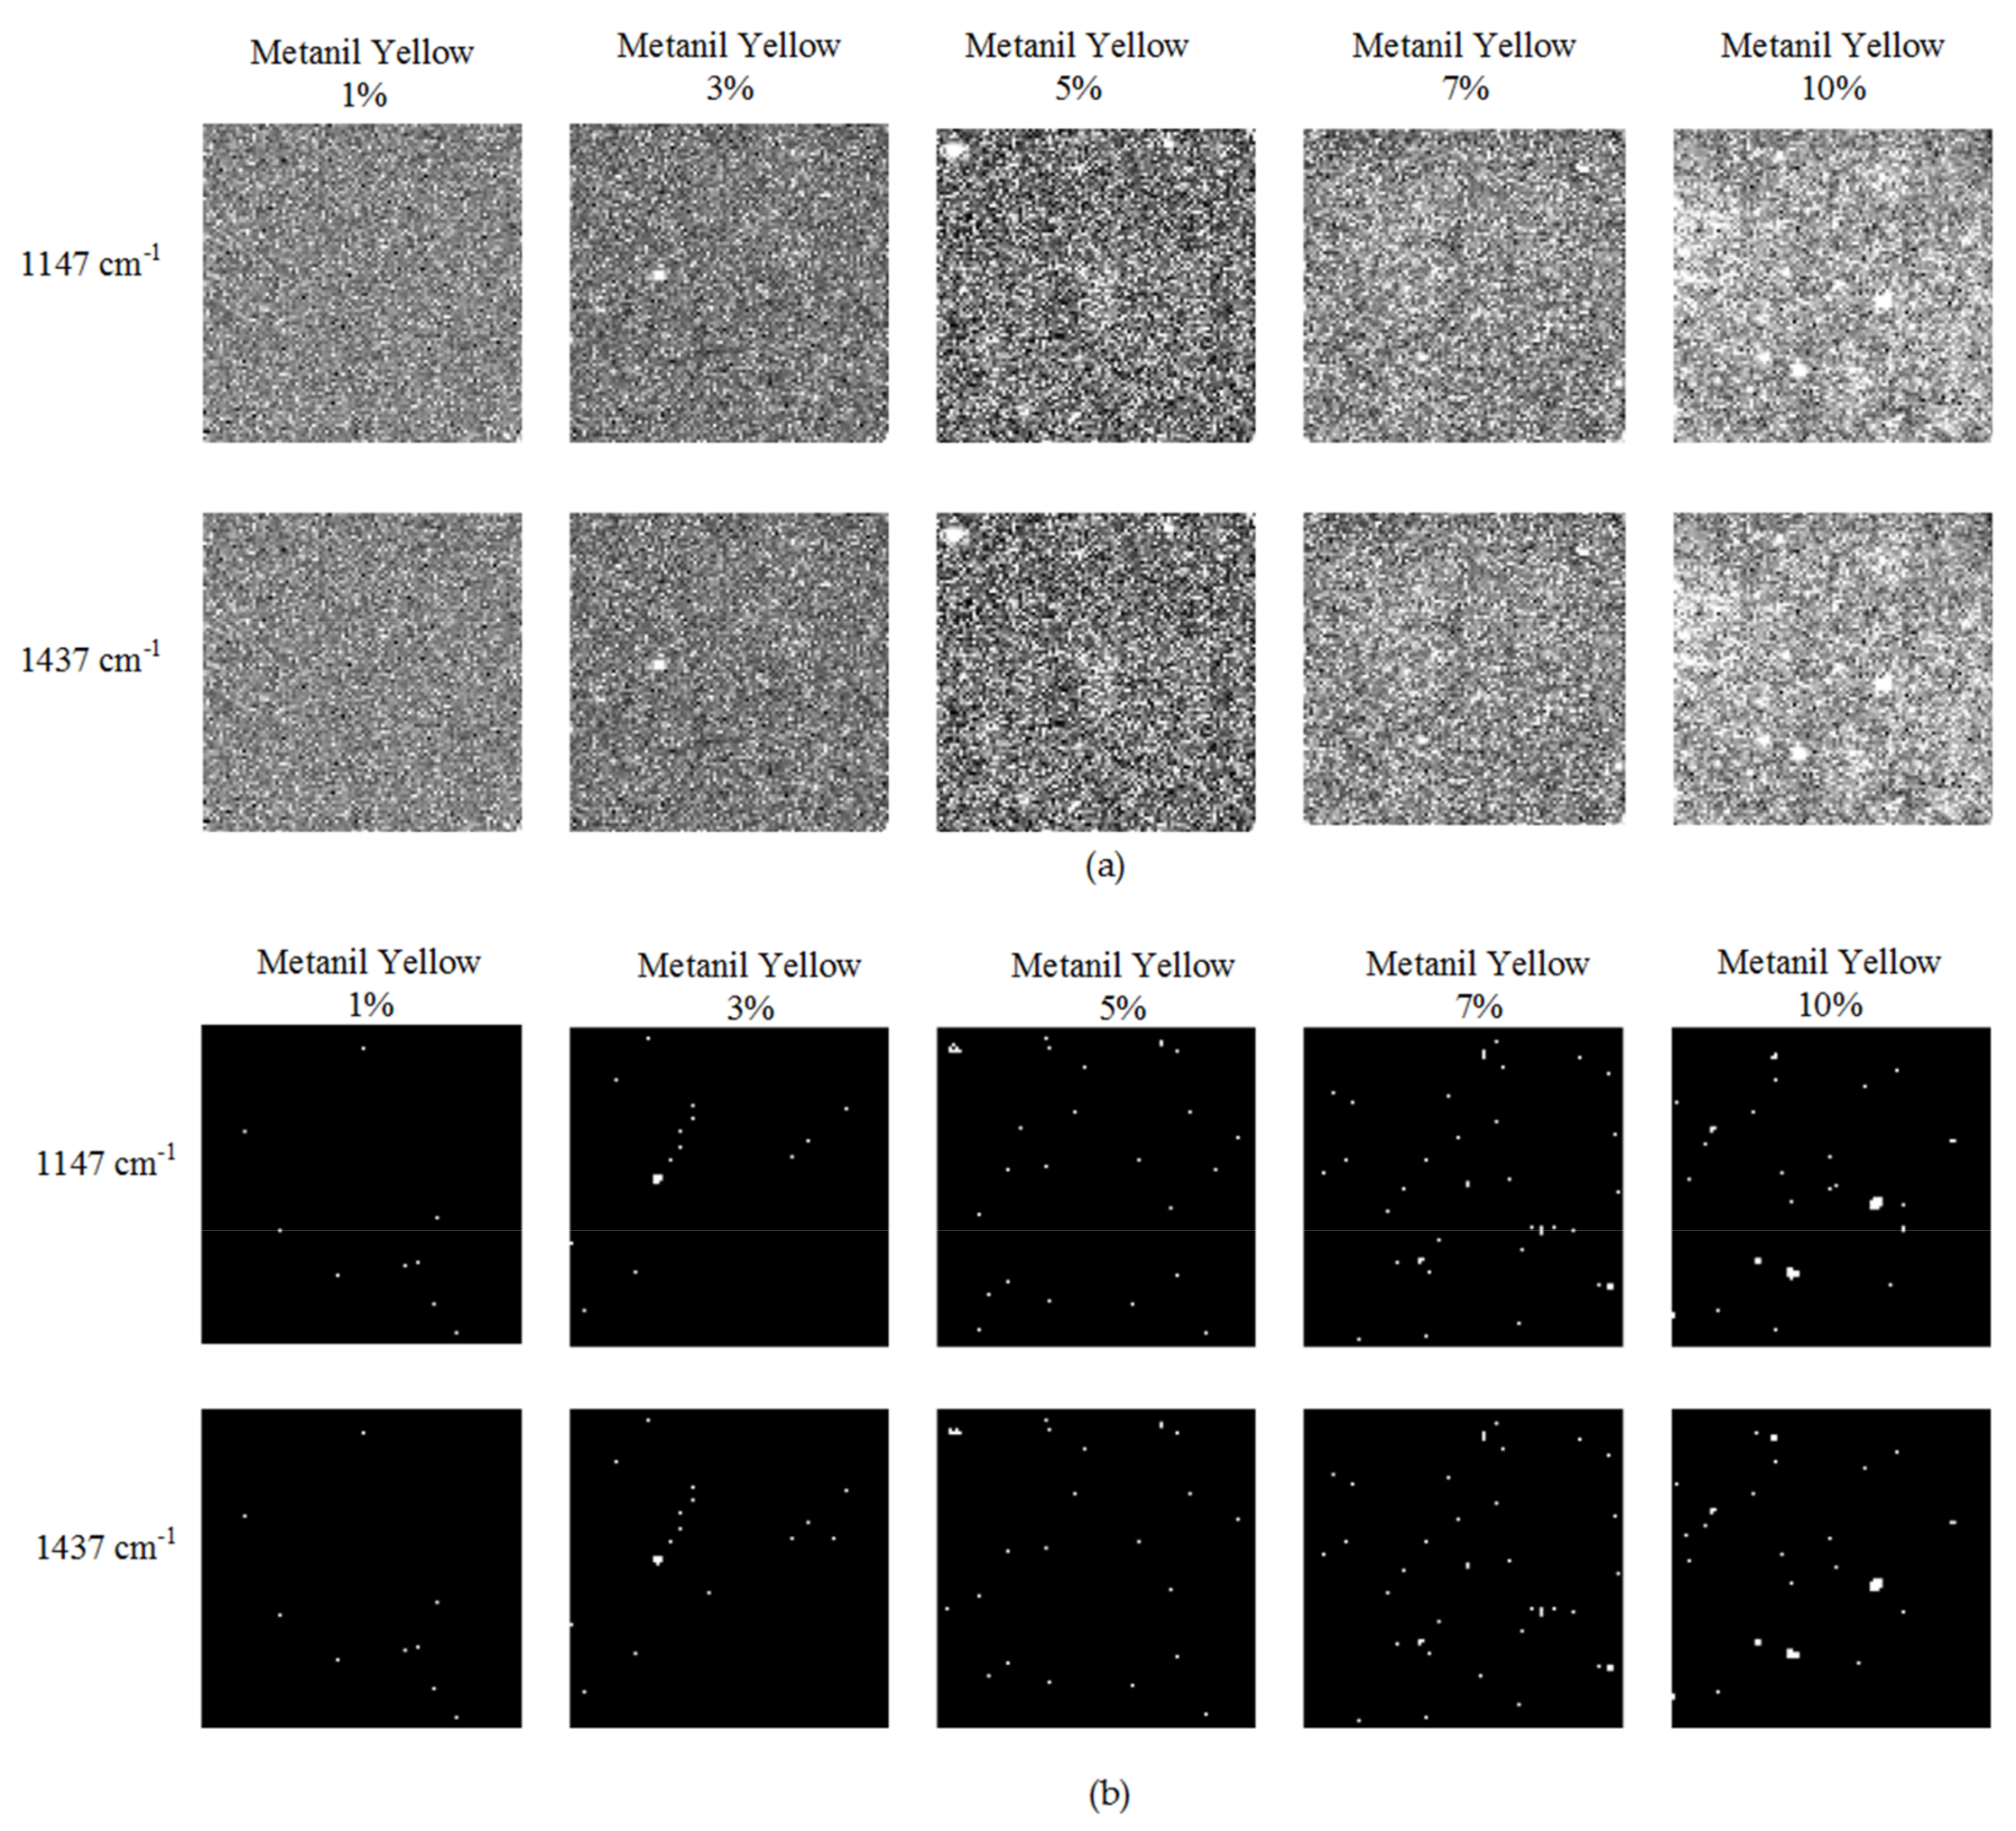
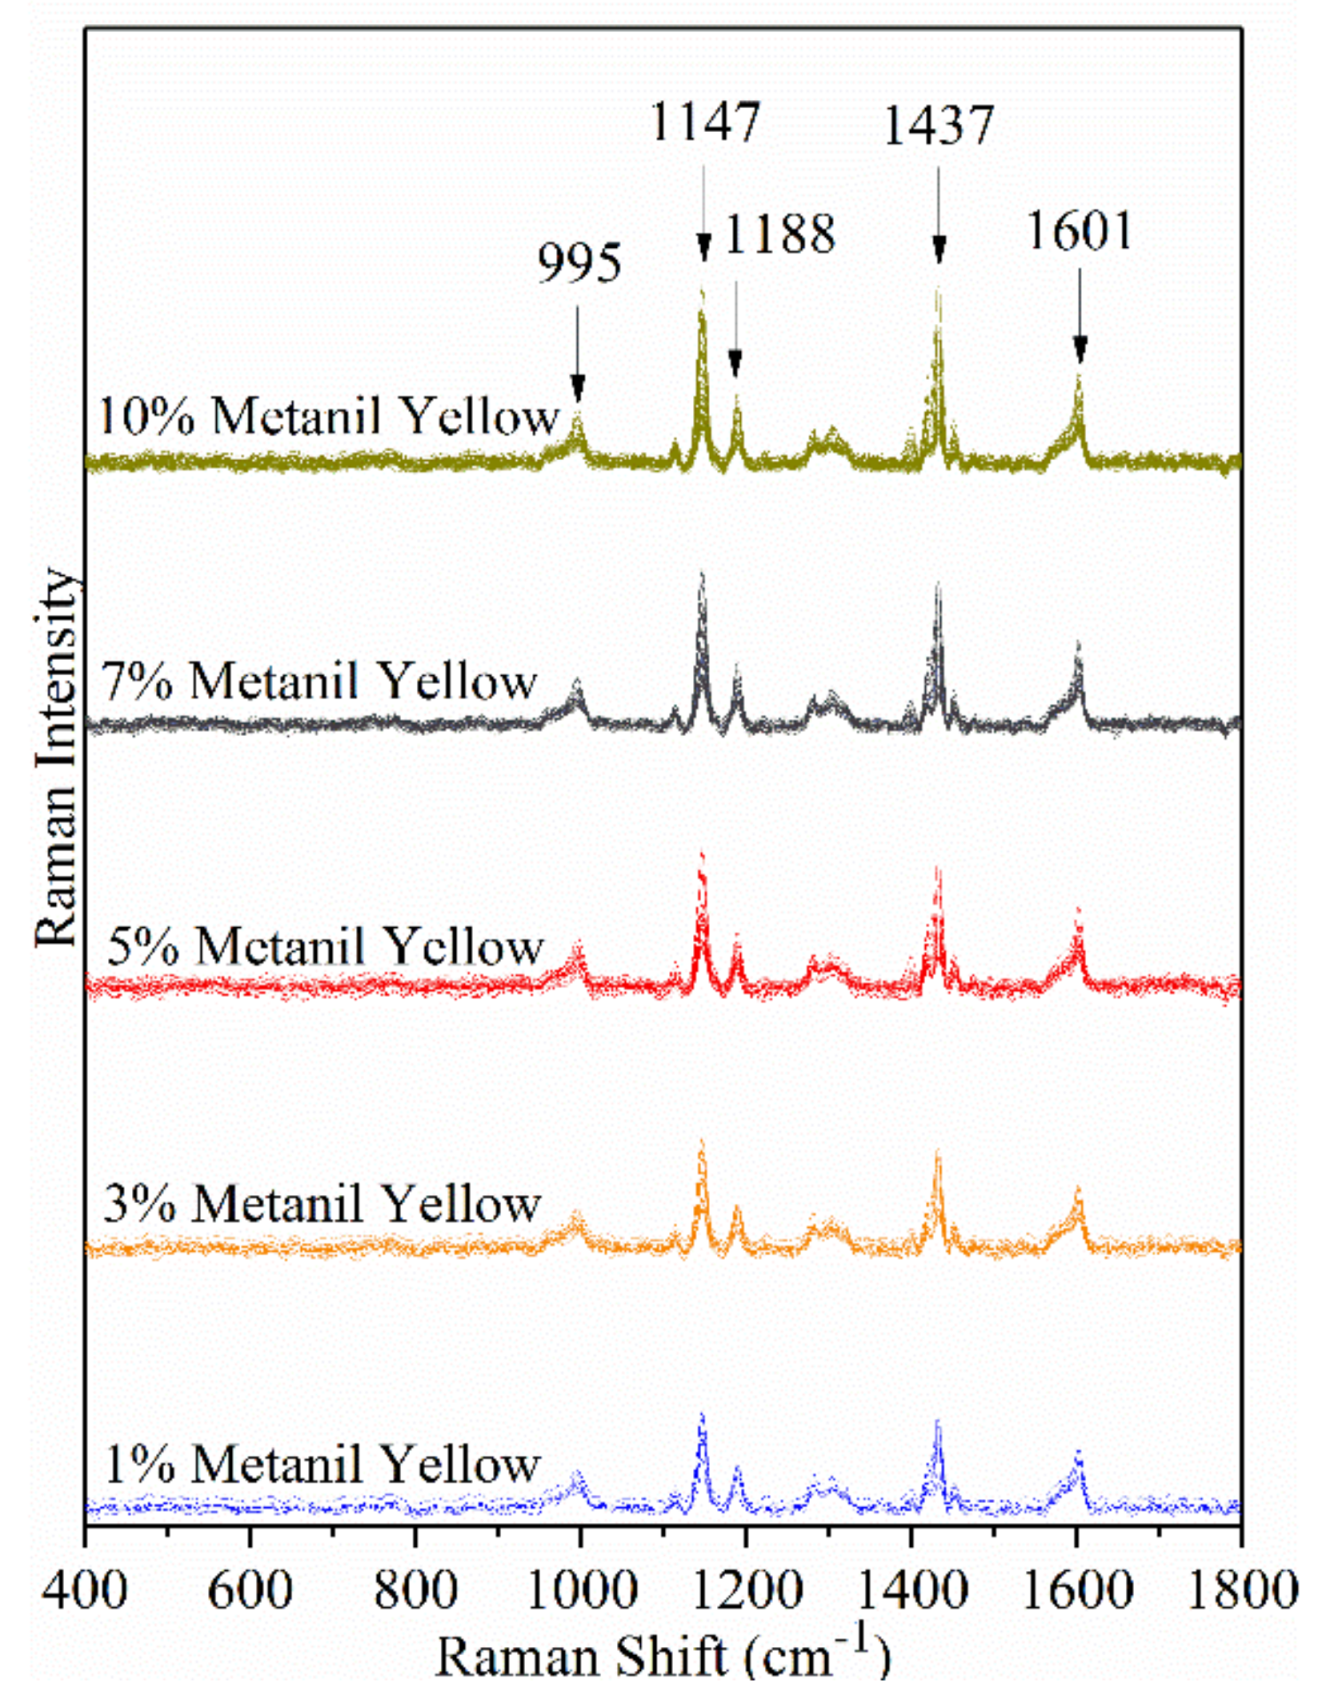
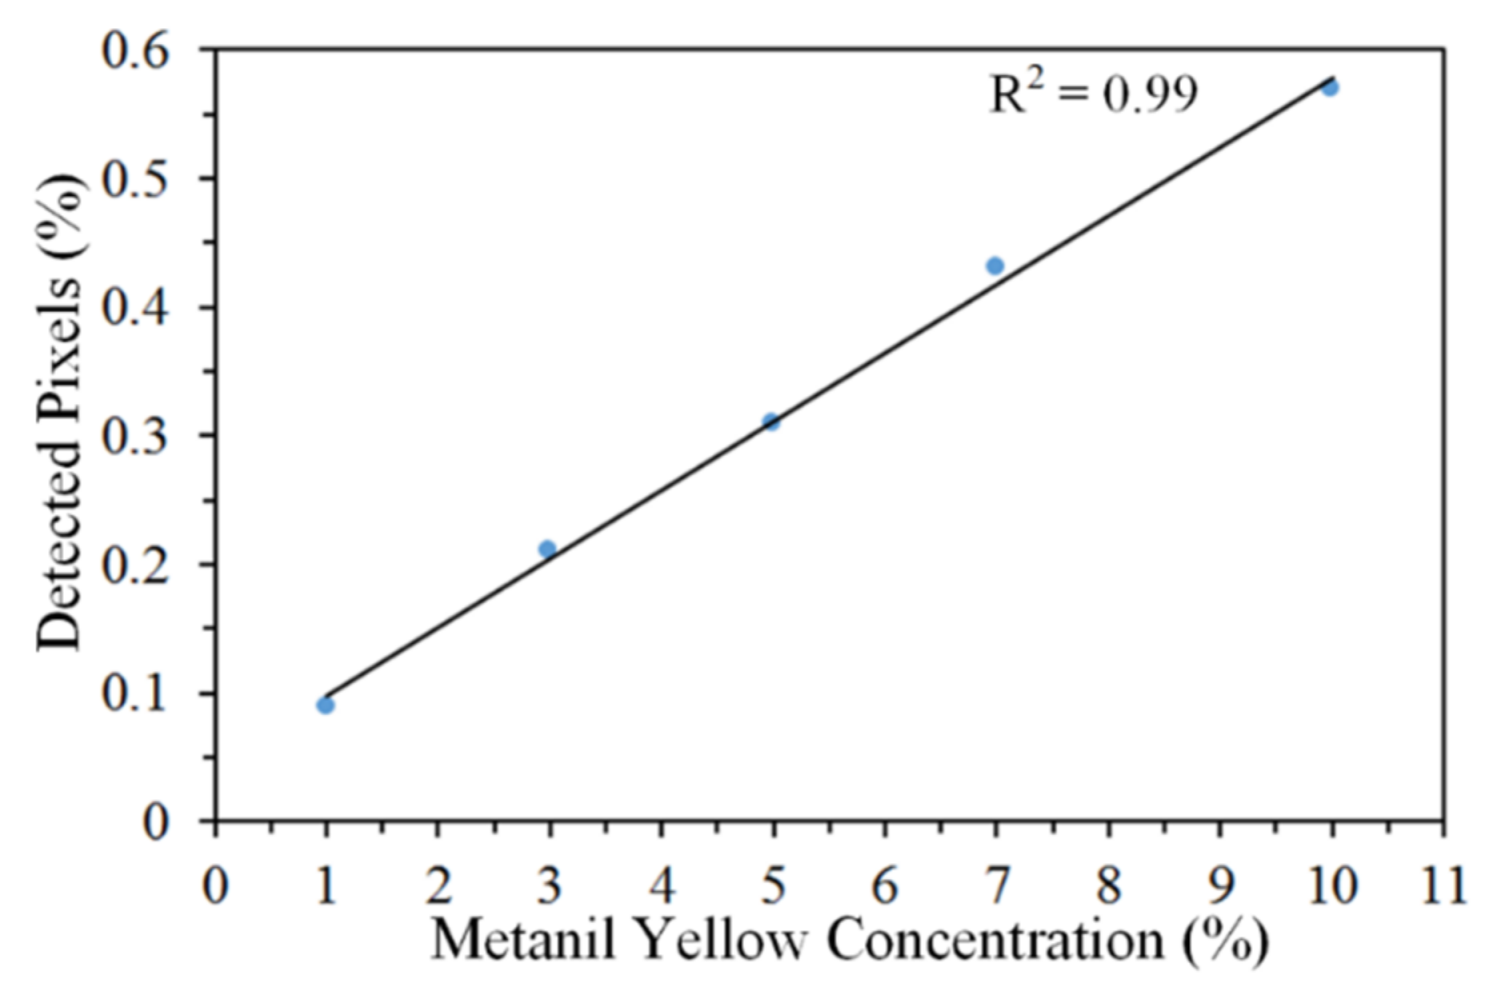
3.3. Detection of Metanil Yellow in Curry Powder

Figure 7a shows the hyperspectral Raman images of curry powder–metanil yellow mixture samples at 1147 cm−1 and 1437 cm−1 across five concentration levels. The 1147 cm−1 and 1437 cm−1 are the highest intensity metanil yellow peaks. The peak intensity of metanil yellow was found to be higher than curry powder peak intensity at 1147 cm−1 and 1437 cm−1. Intensity threshold value of 525 was selected based on pixel-by-pixel analysis of all spectral pixels to obtain binary detection images. All the pixels with intensities below 525 were converted to background pixels. The remaining pixels represent the metanil yellow pixels. Figure 7b shows the 1147 cm−1 and 1437 cm−1 binary detection images of samples at five concentrations. The white pixels are scattered throughout the sample surface. The number of white pixels is low in the 1% metanil yellow image, and progressively increases in the 3%, 5%, 7%, and 10% concentration images. A gradual increase in the white pixels from the 1% to 10% image indicates more metanil yellow particles were detected at increasing concentrations. A total of 9, 21, 30, 43, and 57 metanil yellow pixels were detected in the 1147 cm−1 binary detection images of 1%, 3%, 5%, 7%, and 10% concentration samples. Similarly, 9, 22, 28, 43, and 55 metanil yellow pixels were detected in the 1437 cm−1 binary detection images of 1%, 3%, 5%, 7%, and 10% concentration samples. The metanil yellow pixels have similar spatial distribution in both the binary images. Figure 8 shows the Raman spectra of detected metanil yellow pixels at 1%, 3%, 5%, 7%, and 10% concentration samples. In the figure, the 10% metanil yellow consists of 57 spectra, while the 1% metanil yellow consists of 9 spectra.
The progressive increase in the detected metanil yellow pixels (Figure 7b) indicates that the percentage of detected pixels and sample concentration are correlated. The percentage of the detected metanil yellow pixels are linearly correlated with the metanil yellow concentration in the samples, with a correlation coefficient of 0.99 (Figure 9).
The number of detected metanil yellow pixels (Figure 7b) is less than that of Sudan-I (Figure 4b) for the same concentration. One of the reasons for this discrepancy can be the bulk density of the two chemicals. Sudan-I has a bulk density of 0.18 g/cm3. The bulk density of metanil yellow is 0.33 g/cm3. Due to the higher density of metanil yellow than Sudan-I, there were fewer metanil yellow particles than Sudan-I particles in the 25 mm × 25 mm × 1 mm sample volume.

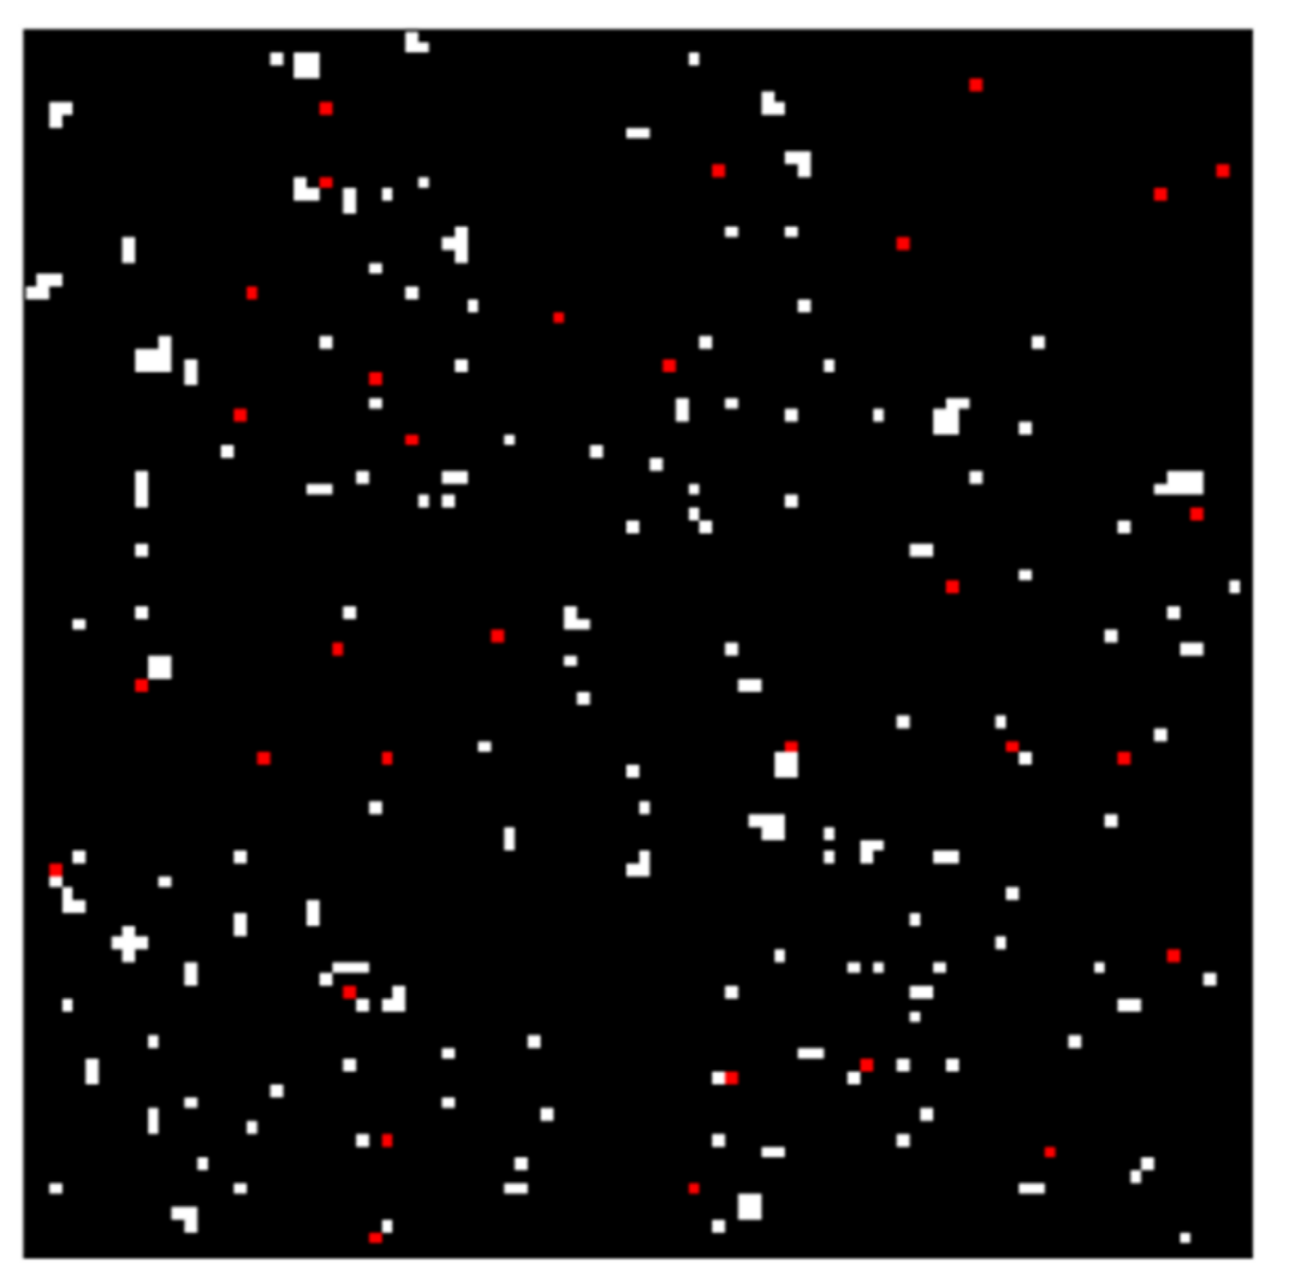
3.4. Simultaneous Detection of Sudan-I and Metanil Yellow in Curry Powder

Sudan-I and metanil yellow (5% each, w/w) were mixed together with curry powder to investigate the methodology for identification of multiple chemical contaminants in a food powder. Raman spectra of the mixture sample consisted of mixed spectra of each component. For identification of Sudan-I and metanil yellow in the mixture, the Raman spectra of individual components must be identified. One of the methods for identification of individual components from the matrix of mixture spectra is to decompose the mixed spectral matrix to extract the spectra of individual components and then identify the components. Self-modeling mixture analysis (SMA) was used to extract pure component spectra and score vectors. The number of pure components is pre-defined for SMA computation. For an unknown number of components in a mixture sample, the number of pure components is overestimated, and the SMA result is visually analyzed to determine the actual number of pure components in the mixture sample. Although three known components, Sudan-I, metanil yellow, and curry powder were mixed together, overestimating the number of components (six components) produced favorable SMA results. The mixed spectra of the mixture sample were decomposed into six component spectra and six corresponding scores, of which two were identified as the pure component spectra of Sudan-I and metanil yellow. Due to the low spectral intensity of curry powder, the pure component spectrum of curry powder was not resolved. The remaining four spectra and scores were residual noise and disregarded from further analysis.
The pure component spectra of Sudan-I and metanil yellow obtained by SMA is shown in Figure 10a. After SMA, the component corresponding to the extracted pure component spectrum and contributions was identified using the spectral information divergence (SID) method. Each pure component spectra extracted by SMA was compared and computed against the reference spectra of Sudan-I and metanil yellow in the spectral library to obtain SID values. The pure component spectra with the smallest SID values were assigned the identification of the component. The pure component spectra identified as Sudan-I and metanil yellow in Figure 10a are well matched with their corresponding reference spectra in Figure 2. Almost all spectral peaks of Sudan-I and metanil yellow are resolved in pure component spectra demonstrating that SMA and SID methods can be used to decompose the mixture spectra and identify the components in the mixture sample.
The corresponding score factors of each component obtained by SMA were unfolded back to obtain a two-dimensional contribution image (100 × 100) of Sudan-I and metanil yellow as shown in Figure 10b. The high intensity pixels represent the component particles in the contribution image.
The contribution images were used to create a Raman chemical image of the corresponding component. The pixel-by-pixel analysis method was performed to select the pixel intensity threshold value for each Raman chemical image. The threshold value of 2150 was selected for the Raman chemical image of Sudan-I and 3800 for metanil yellow. The intensity threshold value was applied to obtain binary detection images of Sudan-I and metanil yellow. All the pixels below the threshold value were converted into background pixels, and remaining pixels represented the component’s pixels. The binary detection images of Sudan-I and metanil yellow were compared with the single band images at 1593 cm−1 and 1437 cm−1, respectively, to ensure none of the pixels were misclassified. The two binary detection images were combined and detected pixels were color coded: white for Sudan-I and red for metanil yellow as shown in Figure 11. The black background represents the curry powder. A total of 240 Sudan-I pixels and 32 metanil yellow pixels were detected, which is similar to the number of detected pixels when each component was detected separately at 5% concentration (Sudan 236 and metanil yellow 30, Figure 4b and Figure 7b). The result shows that the self-modeling mixture analysis coupled with SID can be used as a potential method for identification of multiple chemical contaminants in curry powder.

4. Conclusions

This study used a newly developed 1064 nm dispersive point-scan Raman system for detection of azo color dyes contamination in curry powder. Sudan-I and metanil yellow color dyes mixed separately with curry powder at 1%, 3%, 5%, 7%, and 10% concentration (w/w) were detected. One Raman spectral image of the mixture sample at each concentration was obtained covering the sample surface area of 25 mm × 25 mm, using a step size of 0.25 mm along X and Y directions. The Raman spectral images of curry powder–Sudan I and curry powder–metanil yellow mixture samples were converted into binary detection images to detect Sudan-I and metanil yellow pixels. The number of detected pixels of chemical contaminants linearly correlated with the actual sample concentration (R2 = 0.99). The Raman system was further used for simultaneous detection of Sudan-I and metanil yellow mixed together with curry powder (each contaminant at 5% concentration, w/w). Self-modeling mixture analysis (SMA) was used to decompose the mixed spectral information of the sample mixture, and extract pure component spectra of Sudan-I and metanil yellow. The spectral features of extracted pure component spectra matched with that of the reference spectra of Sudan-I and metanil yellow. Spectral information divergence (SID) was used to identify the corresponding component for each retrieved pure component spectra. The binary detection images obtained from the contribution images could identify Sudan-I and metanil yellow pixels in the mixture sample. The results show that the method can be used to detect multiple chemical contaminants in a complex food matrix.

Disclaimer

Mention of specific products is for identification only and does not imply endorsement by the U.S. Department of Agriculture to the exclusion of other suitable products or suppliers.

Author Contributions

Sagar Dhakal and Kuanglin Chao conceived and designed the experiments; Sagar Dhakal and Kuanglin Chao performed the experiments; Sagar Dhakal and Kuanglin Chao analyzed the data, with other co-authors Walter Schmidt, Jianwei Qin, Moon Kim, and Qing Huang also participating in the discussion of the results; Sagar Dhakal, Kuanglin Chao and Walter Schmidt wrote the paper.

Conflicts of Interest

The authors declare no conflict of interest.

References

  1. Dhakal, S.; Chao, K.; Schmidt, W.; Qin, J.; Kim, M.; Chan, D. Evaluation of turmeric powder adulterated with metanil yellow using FT-Raman and FT-IR spectroscopy. Foods 2016, 5, 36. [Google Scholar] [CrossRef] [PubMed]
  2. Calbiani, F.; Careri, M.; Elviri, L.; Mangia, A.; Pistara, L.; Zagnoni, I. Development of in-house validation of a liquid chromatography-electrospray-tandem mass spectrometry method for the simultaneous determination of Sudan I, Sudan II, Sudan III, and Sudan IV in hot chili products. J. Chromatogr. A 2004, 1042, 123–130. [Google Scholar] [CrossRef] [PubMed]
  3. Anibal, C.; Odena, M.; Ruisanchez, I.; Callao, M.P. Determining the adulteration of spices with Sudan I-II-III-IV dyes by UV-visible spectroscopy and multivariate classification techniques. Talanta 2009, 79, 887–892. [Google Scholar] [CrossRef] [PubMed]
  4. Ahlstrom, L.-H.; Eskilsson, C.S.; Bjorklund, E. Determination of banned azo dyes in consumer goods. Trends Anal. Chem. 2005, 24, 49–56. [Google Scholar] [CrossRef]
  5. Joint FAO/WHO Expert Committee on Food Additives, 8th ed.; WHO Technical Series No. 309; World Health Organisation: Geneva, Switzerland, 1965; p. 23.
  6. Dixit, S.; Purshottam, S.K.; Khanna, S.K.; Das, M. Surveillance of the quality of turmeric powders from city markets of India on the basis of curcumin content and the presence of extraneous colors. Food Addit. Contam. 2009, 26, 1227–1231. [Google Scholar] [CrossRef]
  7. Nagaraja, T.N.; Desiraju, T. Effects of chronic consumption of Metanil yellow by developing and adult rats on brain regional levels of noradrenaline, dopamine and serotonin, on acetylcholine esterase activity and on operant conditioning. Food Chem. Toxicol. 1993, 31, 41–44. [Google Scholar] [CrossRef]
  8. Fernandes, C.; Rao, K.V. Dose related promoter effect of Metanil yellow on the development of hepatic pre-neoplastic lesions induced by N-nitrosodiethylamine in rats. Indian J. Med. Res. 1994, 100, 140–149. [Google Scholar] [PubMed]
  9. Gupta, S.; Sundarrajan, M.; Rao, K.V.K. Tumor promotion by Metanil yellow and Malachite green during rat hepatocarcinogenesis is associated with dysregulated expression of cell cycle regulatory proteins. Teratog. Carcinog. Mutagen. 2003, 1, 301–312. [Google Scholar] [CrossRef] [PubMed]
  10. Raza, H.; Khanna, S.K.; Singh, G.B. Metanil yellow and gastric mucin. Indian J. Exp. Biol. 1978, 16, 383–384. [Google Scholar] [PubMed]
  11. Prasad, O.M.; Rastogi, P.M. Haematological changes induced by feeding a common food color, Metanil yellow, in Albino mice. Toxicol. Lett. 1983, 16, 103–107. [Google Scholar] [CrossRef]
  12. Ming, L.; Xi, X.; Chen, T.; Liu, J. Electrochemical determination of trace Sudan I contamination in chili powder at carbon nanotube modified electrodes. Sensors 2008, 8, 1890–1900. [Google Scholar] [CrossRef] [PubMed]
  13. Stiborova, M.; Martinek, M.; Rydlova, H.; Hodek, P.; Frei, E. Sudan I is a potential carcinogen to humans: Evidence for its metabolic activation and detoxication by human recombinant cytochrome P450 1A1 and liver microsomes. Cancer Res. 2002, 62, 5678–5684. [Google Scholar] [PubMed]
  14. IARC (International Agency for Research on Cancer). Monographs on the Evaluation of the Carcinogenic Risk of Chemical to Man: Some Aromatic Azocompounds; International Agency for Research on Cancer: Lyon, France, 1975; Volume 8. [Google Scholar]
  15. Gao, F.; Hu, Y.; Chen, D.; Li-Chan, E.C.Y.; Grant, E.; Lu, X. Determination of Sudan I in paprika powder by molecularly imprinted polymers-thin layer chromatography-surface enhanced Raman spectroscopic biosensor. Talanta 2015, 143, 344–352. [Google Scholar] [CrossRef] [PubMed]
  16. Haughey, S.A.; Galvin-King, P.; Ho, Y.C.; Bell, S.E.J.; Elliott, C.T. The feasibility of using near infrared and Raman spectroscopic techniques to detect fraudulent adulteration of chili powders with Sudan dye. Food Control 2015, 48, 75–83. [Google Scholar] [CrossRef]
  17. Tateo, F.; Bononi, M. Fast Determination of Sudan I by HPLC/APCI-MS in hot chili, spices, and oven-baked foods. J. Agric. Food Chem. 2004, 52, 655–658. [Google Scholar] [CrossRef] [PubMed]
  18. Shen, Y.; Zhang, X.; Prinyawiwatkul, W.; Xu, Z. Simultaneous determination of red and yellow artificial food colourants and carotenoid pigments in food products. Food Chem. 2014, 157, 553–558. [Google Scholar] [CrossRef] [PubMed]
  19. Sasikumar, B.; Syamkumar, S.; Remya, R.; Zachariah, T.J. PCR based detection of adulteration in the market sample of turmeric powder. Food Biotechnol. 2004, 18, 299–306. [Google Scholar] [CrossRef]
  20. Chen, L.; Hu, J.; Zhang, W.; Zhang, J.; Guo, P.; Sun, C. Simultaneous determination of nine banned azo dyes in foodstuffs and beverages by high-performance capillary electrophoresis. Food Anal. Methods 2015, 8, 1903–1910. [Google Scholar] [CrossRef]
  21. Zhao, S.; Yin, J.; Zhang, J.; Ding, X.; Wu, Y.; Shao, B. Determination of 23 dyes in chili powder and paste by high-performance liquid chromatography-electrospray ionization tandem mass spectrometry. Food Anal. Methods 2012, 5, 1018–1026. [Google Scholar] [CrossRef]
  22. Dixit, S.; Khanna, S.; Das, M. A simple 2-directional high-performance thin-layer chromatographic method for simultaneous determination of curcumin, metanil yellow, and Sudan dyes in turmeric, chili, and curry powders. J. Aoac. Int. 2008, 91, 1387–1396. [Google Scholar] [PubMed]
  23. Anibal, C.; Marsal, L.F.; Callao, M.P.; Ruisanchez, I. Surface enhanced Raman spectroscopy (SERS) and multivariate analysis is a screening tool for detecting Sudan I dye in culinary spices. Spectrochim. Acta A 2012, 87, 135–141. [Google Scholar] [CrossRef] [PubMed]
  24. Cheung, W.; Shadi, I.T.; Xu, Y.; Goodacre, R. Quantitative analysis of the banned food dye Sudan-1 using surface enhanced Raman scattering with multivariate chemometrics. J. Phys. Chem. C 2010, 114, 7285–7290. [Google Scholar] [CrossRef]
  25. Qin, J.; Chao, K.; Cho, B.K.; Peng, Y.K.; Kim, M. High throughput Raman chemical imaging for rapid evaluation of food safety and quality. Trans. ASABE 2014, 57, 1783–1792. [Google Scholar]
  26. Qin, J.; Chao, K.; Kim, M.; Cho, B.K. Line-scan macro-scale Raman chemical imaging for authentication of powdered foods and ingredients. Food Bioproc. Technol. 2016, 9, 113–123. [Google Scholar] [CrossRef]
  27. Qin, J.; Kim, M.; Chao, K.; Dhakal, S.; Lee, H.; Cho, B.K.; Mo, C. Detection and quantification of adulterants in milk powder using a high-throughput Raman chemical imaging technique. Food Addit. Contam. Part A 2017, 34, 152–161. [Google Scholar] [CrossRef] [PubMed]
  28. Chao, K.; Dhakal, S.; Qin, J.; Kim, M.; Peng, Y. A 1064 nm dispersive Raman spectral imaging system for food safety and quality evaluation. Appl. Sci. 2018, 7, 431. [Google Scholar] [CrossRef]
  29. Winding, W.; Guilment, J. Interactive self- modeling mixture analysis. Anal. Chem. 1991, 63, 1425–1432. [Google Scholar] [CrossRef]
  30. Winding, W.; Gallagher, N.B.; Shaver, J.M.; Wise, B.M. A new approach for interactive self-modeling mixture analysis. Chemom. Intell. Lab. Syst. 2005, 77, 85–96. [Google Scholar] [CrossRef]
  31. Chao, K.; Dhakal, S.; Qin, J.; Peng, Y.; Schmidt, W.; Kim, S.; Chan, D. A spatially offset Raman spectroscopy method for non-destructive detection of gelatin-encapsulated powders. Sensors 2017, 17, 618. [Google Scholar] [CrossRef] [PubMed]
  32. Batonneau, Y.; Laureyns, J.; Merlin, J.-C.; Bremard, C. Self-modeling mixture analysis of Raman microspectrometric investigations of dust emitted by lead and zinc smelters. Anal. Chim. Acta 2001, 446, 23–37. [Google Scholar] [CrossRef]
  33. Chang, C.I. An information theoretic-based approach to spectral variability, similarity and discriminability for hyperspectral image analysis. IEEE Trans. Inf. Theory 2000, 46, 1927–1932. [Google Scholar] [CrossRef]
  34. Dhakal, S.; Chao, K.; Qin, J.; Kim, M.; Peng, Y.; Chan, D. Identification and evaluation of composition in food powder using point-scan Raman spectral imaging. Appl. Sci. 2017, 7, 1. [Google Scholar] [CrossRef]
  35. Zheng, Y.B.; Payton, J.L.; Chung, C.H.; Liu, R.; Cheunkar, S.; Pathem, B.K.; Yang, Y.; Jensen, L.; Weiss, P.S. Surface-enhanced Raman spectroscopy to probe reversible photoswitchable azobenzene in controlled nanoscale environments. Nano Lett. 2011, 11, 3447–3452. [Google Scholar] [CrossRef] [PubMed]
  36. Sett, P.; De, A.K.; Chattopadhyay, S.; Mallick, P.K. Raman excitation profile of diphenylamine. Chem. Phys. 2002, 276, 211–224. [Google Scholar] [CrossRef]
  37. Smulevich, G.; Angeloni, L.; Giovannarde, S.; Marzocchi, M.P. Resonance Raman and polarized light infrared spectra of 1, 4-dihydrozyanthraquinone. Vibrational studies of the ground and excited electronic states. Chem. Phys. 1983, 65, 313–322. [Google Scholar] [CrossRef]
  38. Darvin, M.E.; Gersonde, I.; Ey, S.; Brand, N.N.; Albrecht, H.; Gonchukov, S.A.; Sterry, W.; Lademann, J. Noninvasive detection of beta-carotene and lycopene in human skin using Raman spectroscopy. Laser Phys. 2004, 14, 231–233. [Google Scholar]
  39. Kim, J.; Kim, Y.; Chung, H. Direct on-line Raman measurement of flying solid samples: Determination of polyethylene pellet density. Talanta 2011, 83, 879–884. [Google Scholar] [CrossRef] [PubMed]
  40. Schulz, H.; Baranska, M. Identification and quantification of valuable plant substances by IR and Raman spectroscopy. Vib. Spectrosc. 2007, 43, 13–25. [Google Scholar] [CrossRef]
  41. Kunov-Kruse, A.K.; Kristensen, S.B.; Liu, C.; Berg, R.W. Experimental and ab initio DFT calculated Raman spectrum of Sudan I, a red dye. J. Raman Spectrosc. 2011, 42, 1470–1478. [Google Scholar] [CrossRef]
Figure 1. Acquisition of Raman spectral image by point-scan method.
Applsci 08 00564 g001
Figure 2. Raman spectra of metanil yellow, Sudan-I, and curry powder.
Applsci 08 00564 g002
Figure 3. Chemical structure of: (a) metanil yellow; (b) Sudan-I.
Applsci 08 00564 g003
Figure 4. (a) Hyperspectral Raman images of curry powder-Sudan I mixture samples; (b) binary detection images at 1593 cm−1.
Applsci 08 00564 g004
Figure 5. Raman spectra of detected Sudan-I pixels at five concentrations.
Applsci 08 00564 g005
Figure 6. Relationship between Sudan-I concentration in samples and percentage of detected pixels in 1593 cm−1 binary images.
Applsci 08 00564 g006
Figure 7. (a) Hyperspectral Raman images of curry powder–metanil yellow mixture samples; (b) binary detection images at 1147 cm−1 and 1437 cm−1.
Applsci 08 00564 g007
Figure 8. Raman spectra of detected metanil yellow pixels at five concentrations.
Applsci 08 00564 g008
Figure 9. Relationship between actual metanil yellow concentration in samples and the percentage of detected pixels in 1147 cm−1 binary images.
Applsci 08 00564 g009
Figure 10. Results of self-modeling mixture analysis of components. (a) Resolved spectra of Sudan-I and metanil yellow; (b) corresponding contribution images.
Applsci 08 00564 g010
Figure 11. Color-coded chemical image of Sudan-I and metanil yellow generated by contribution images. White pixels represent Sudan-I and red pixels represent metanil yellow.
Applsci 08 00564 g011
Table 1. Assignment of Raman spectral bands of Sudan-I, metanil yellow, and curry powder [35,36,37,38,39,40,41].
Sudan-IMetanil YellowCurry PowderSpectral Assignments
1630 cm−1ν (C=C) stretching unconjugated
1601 cm−1 ν (N-N) stretching (III)
1599 cm−1ν (C=C)stretching conjugated
1593 cm−1 (s) ν (N=N) stretching
1522 cm−1δ (Ar-O + Ar-O-R) bending
1494 cm−1 ν (C-C) stretching on C=C-N and C-C-N
1441 cm−1δ (H-C) out of plane bending
1437 cm−1 (s) ν (N=N)
1387 cm−1 Aromatic ring stretching
1340 cm−1 Aromatic ring stretching asym
1254 cm−1 ν (C-O) stretching
1223 cm−1 δ (O-H) bending asym
1188 cm−1 δ (C-H)
1169 cm−1 ν (C-Nazo) δ (CH)
1147 cm−1 (s) ν (C-Nazo) δ(CH)
1001 cm−1 Ring breathing
995 cm−1 Ring breathing (II)
984 cm−1 δ (C-N=N) out of plane bending

