Infrared Thermography for Inline Monitoring of Glass/Epoxy under Impact and Quasi-Static Bending


Abstract
Featured Application
Abstract

1. Introduction
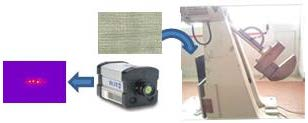
2. Materials and Methods
3. Results
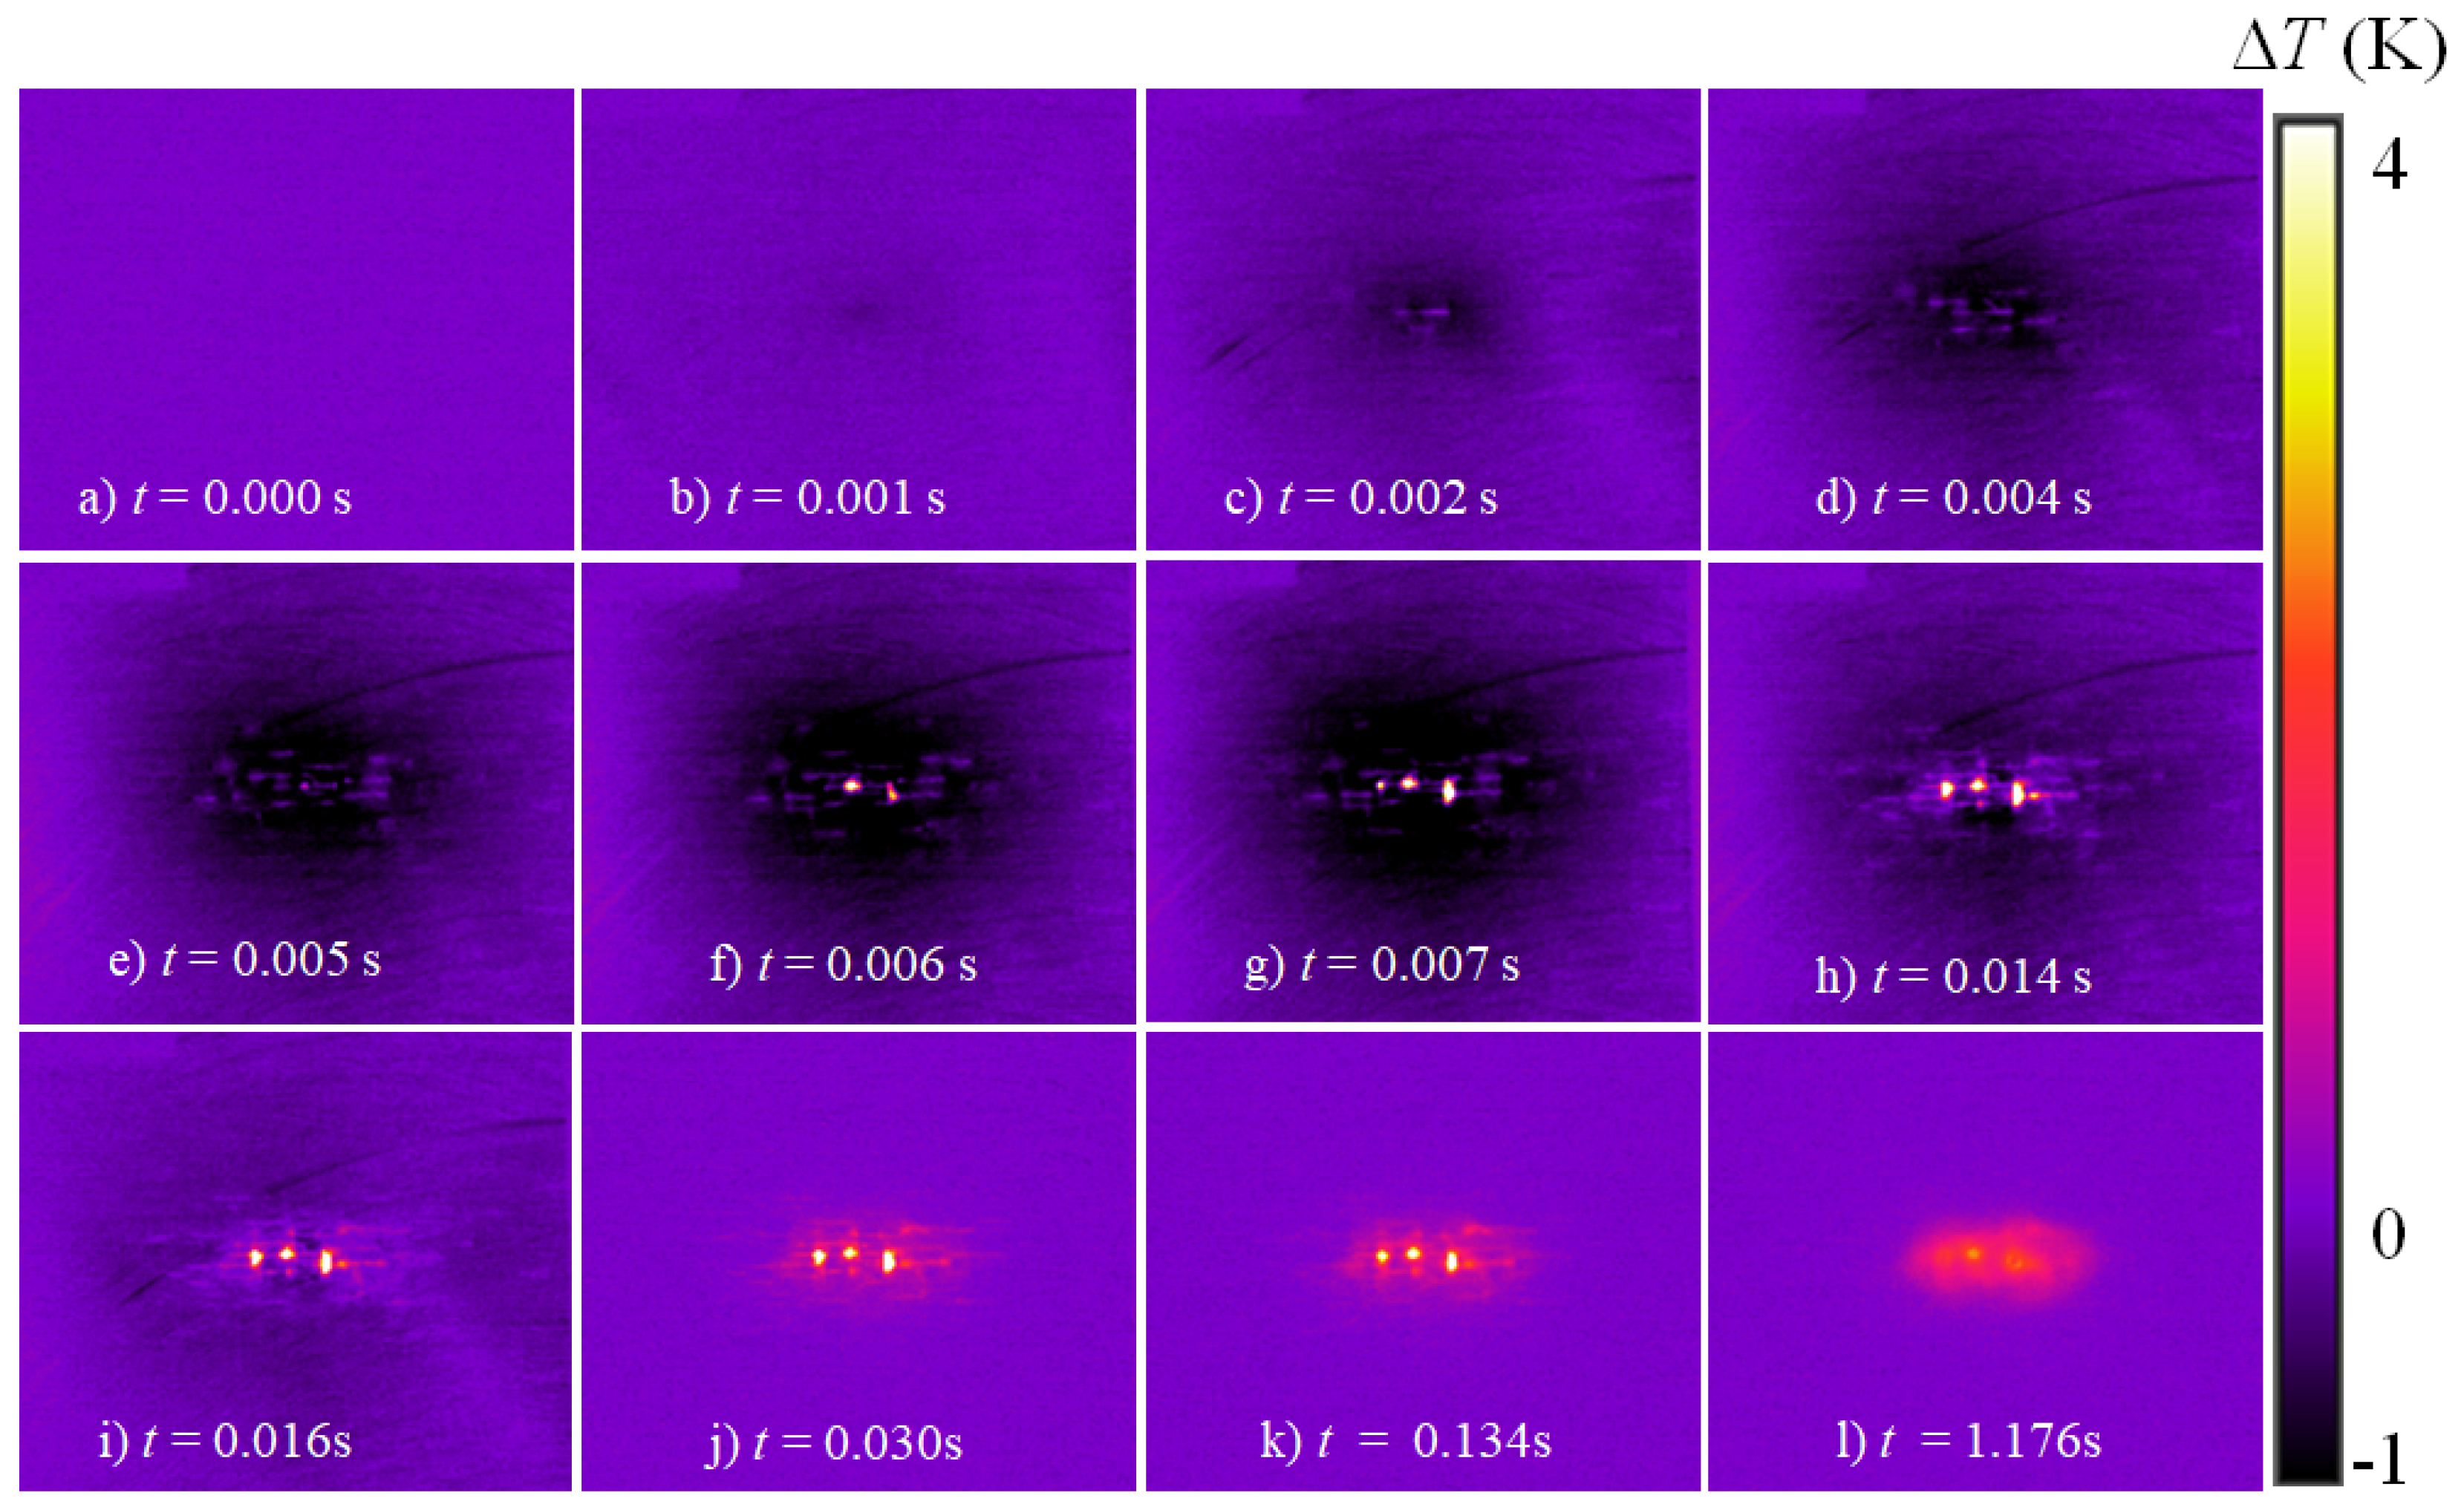
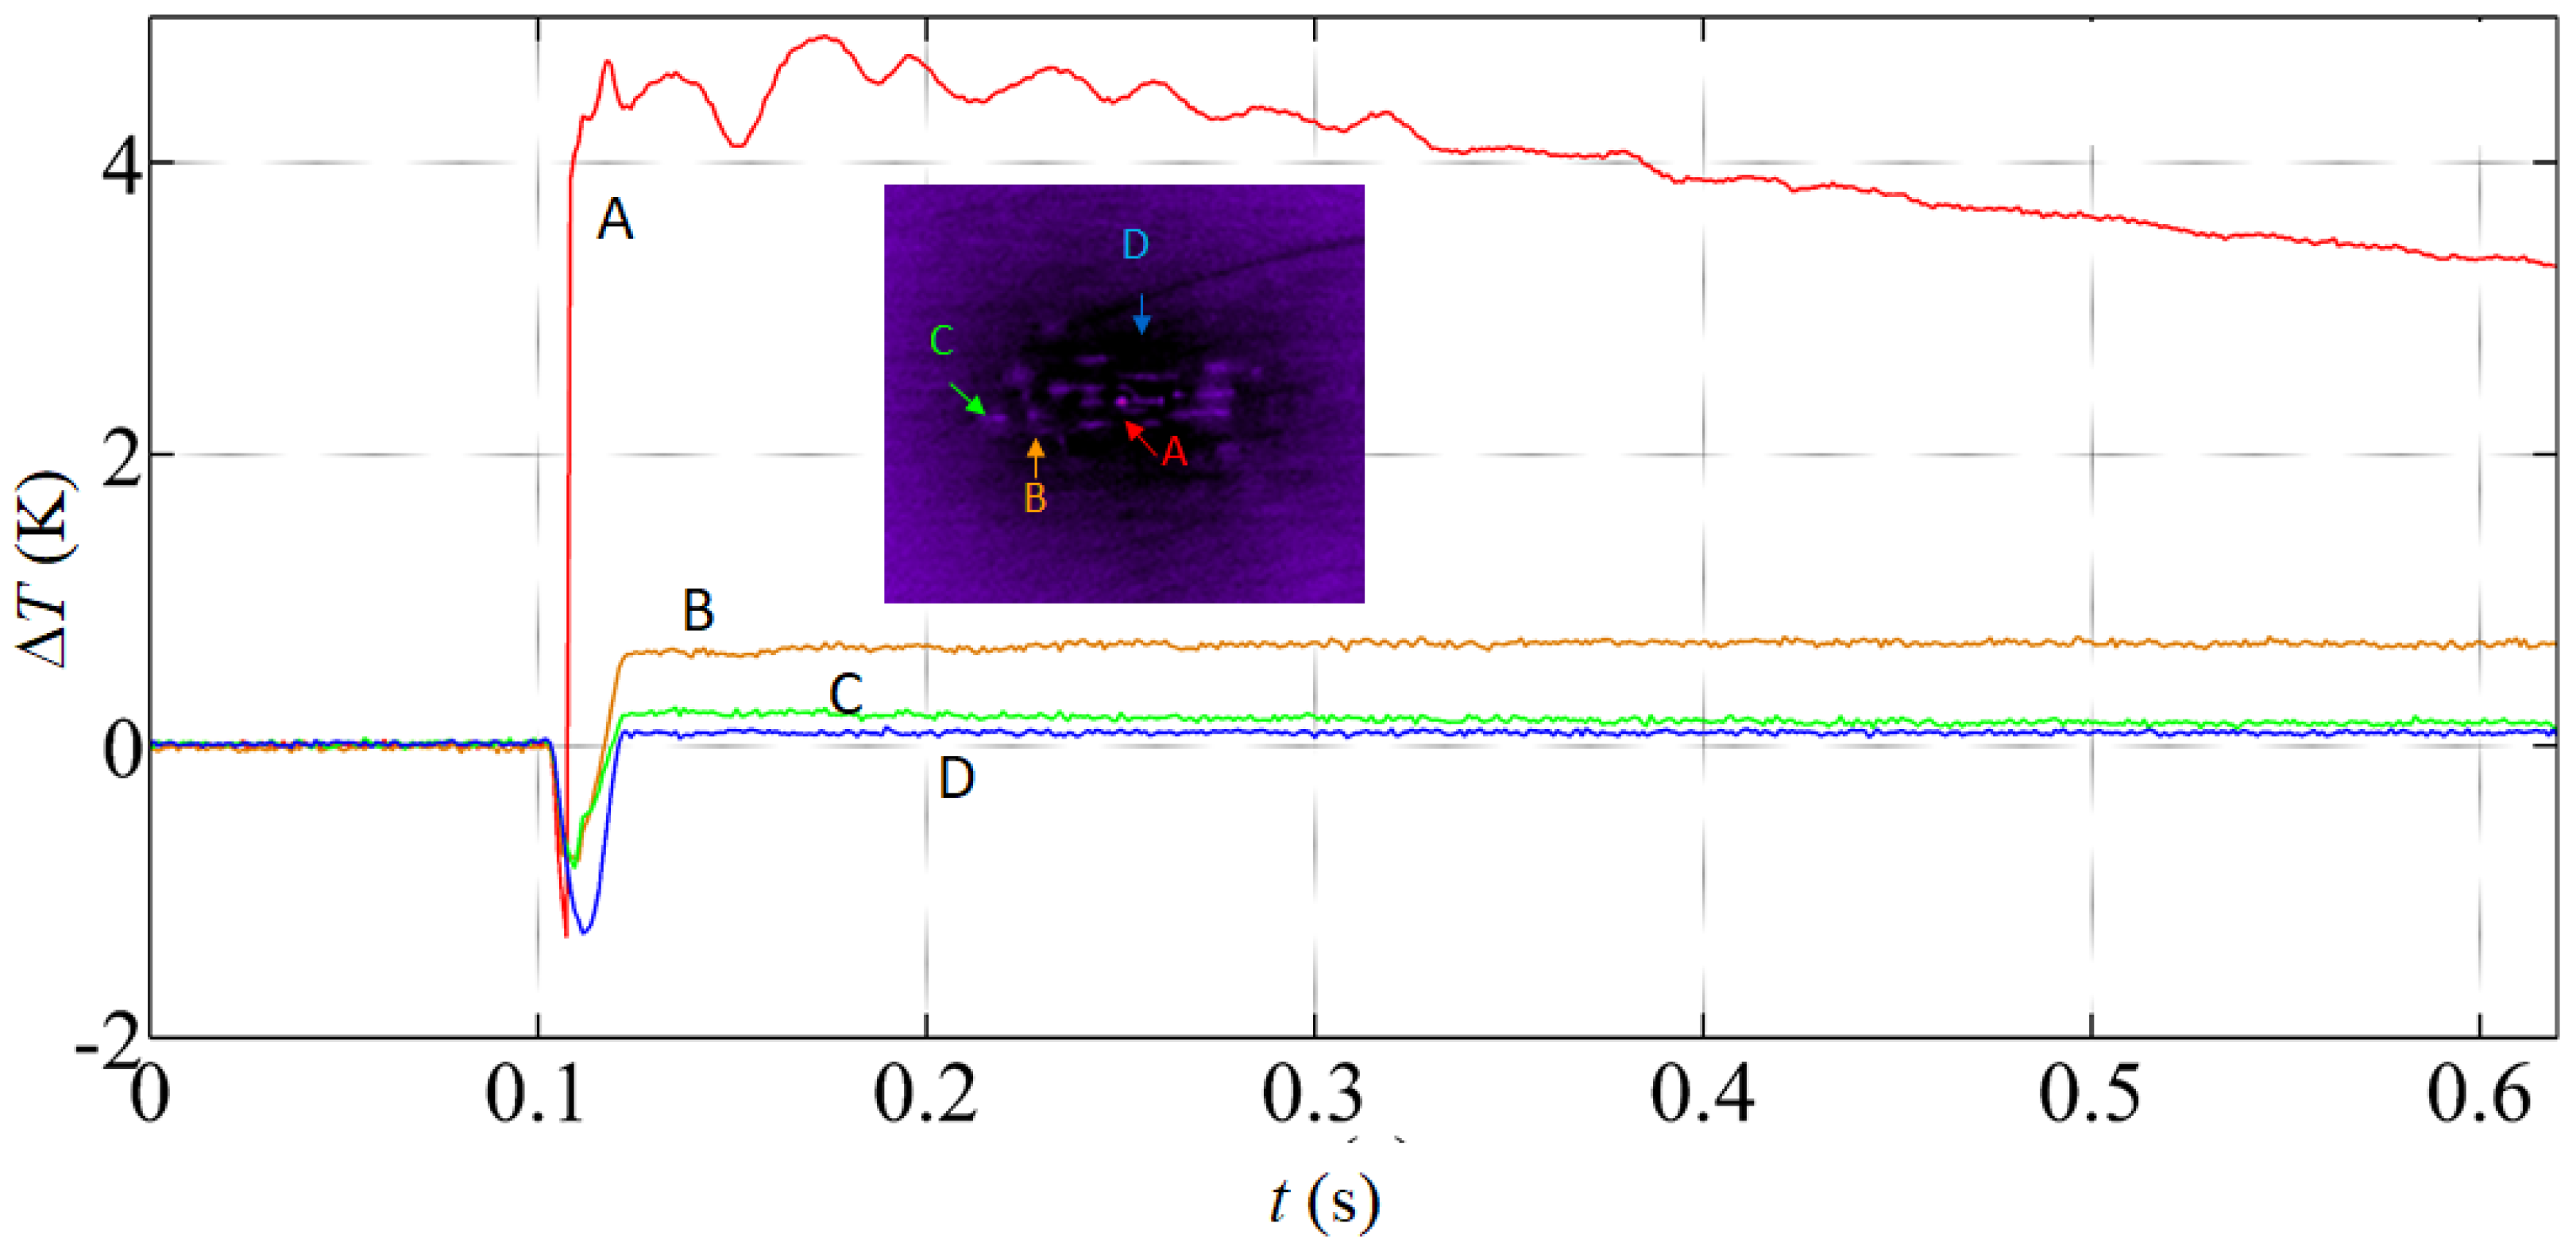
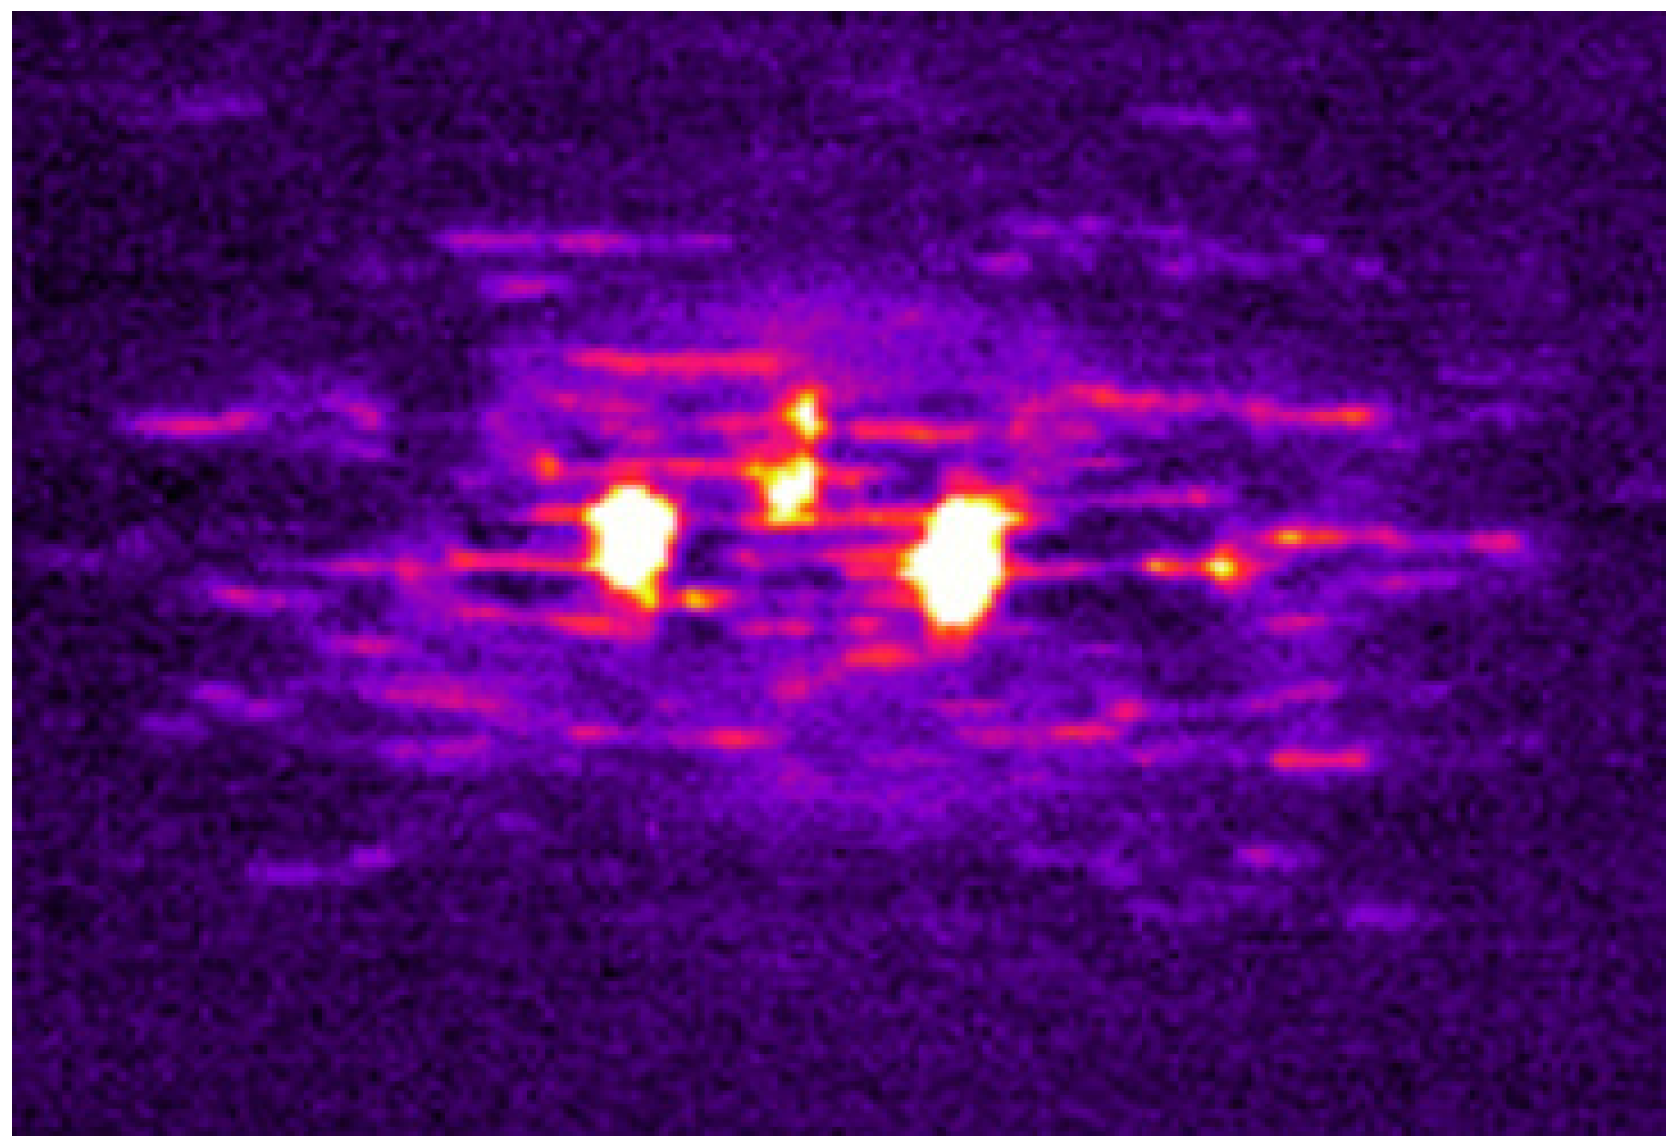
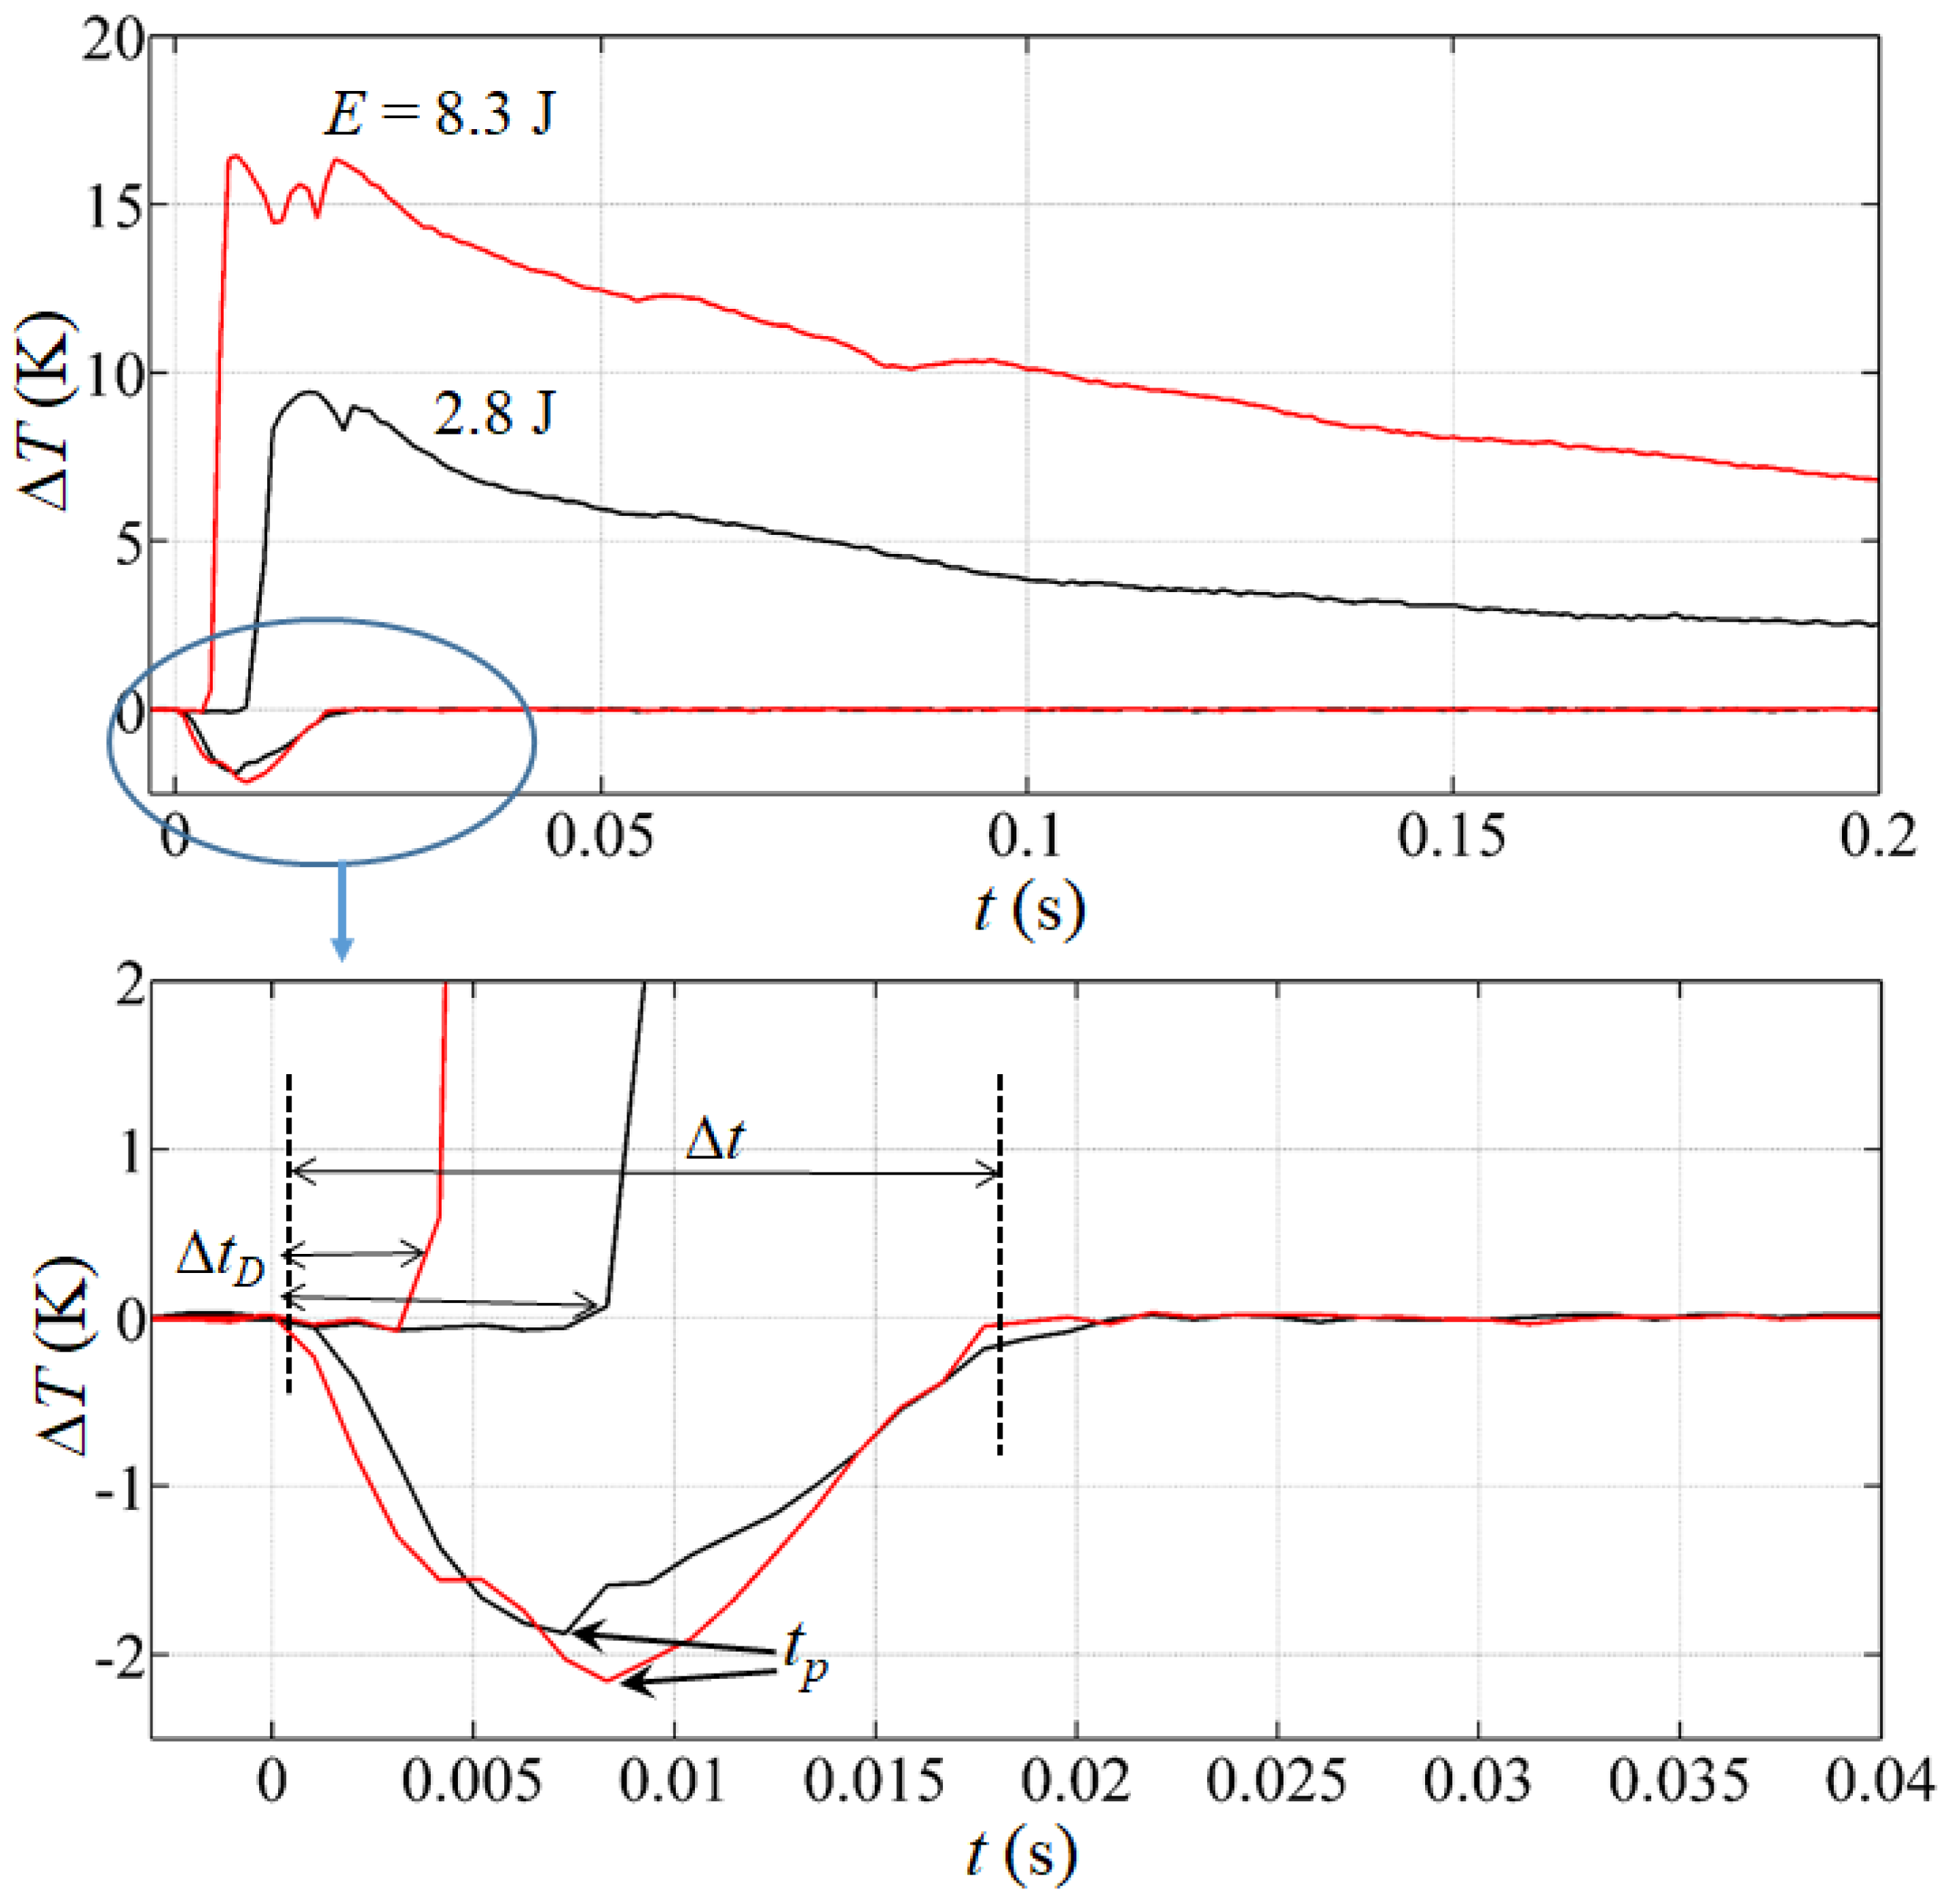
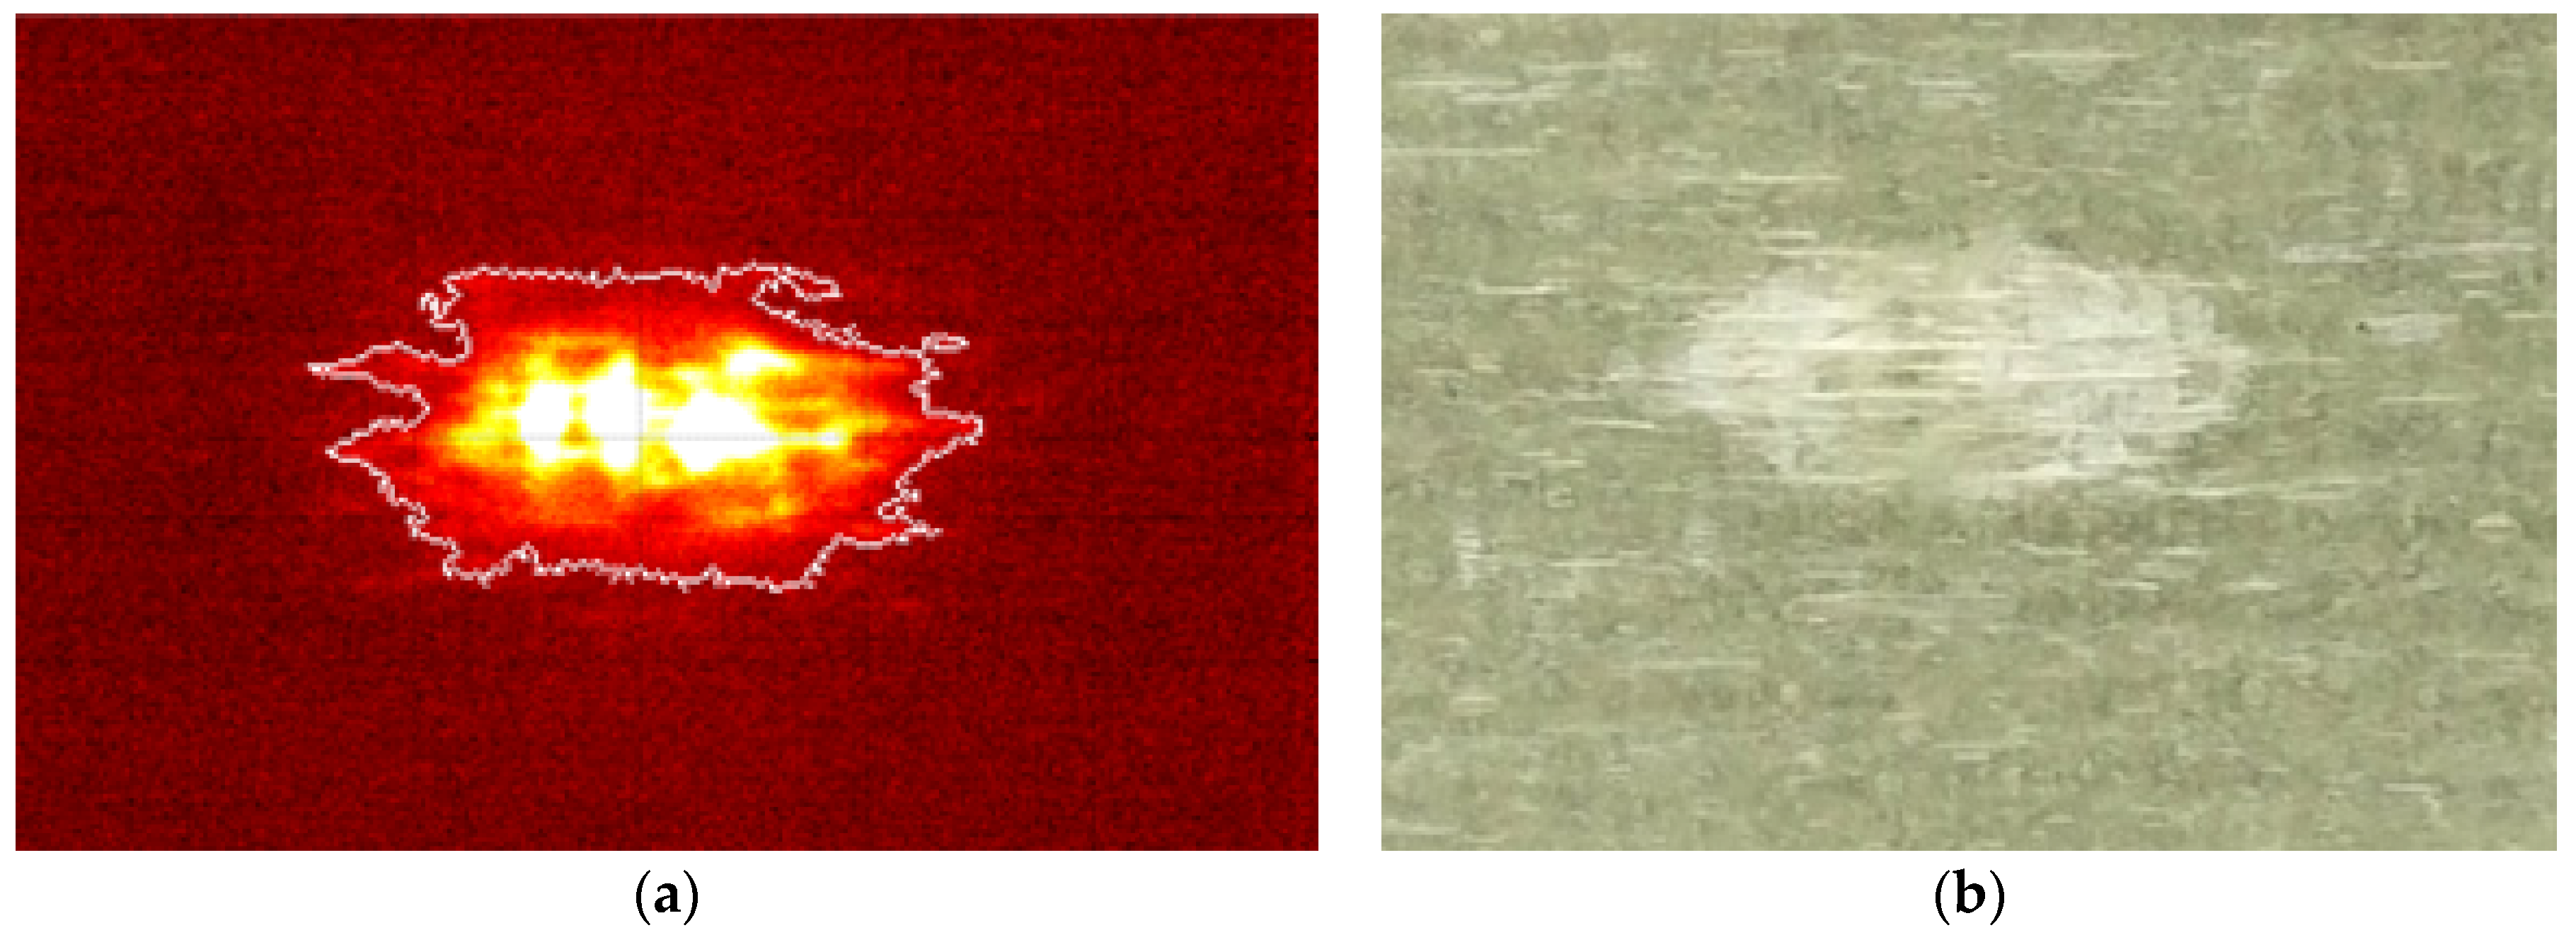
3.1. Impact Tests
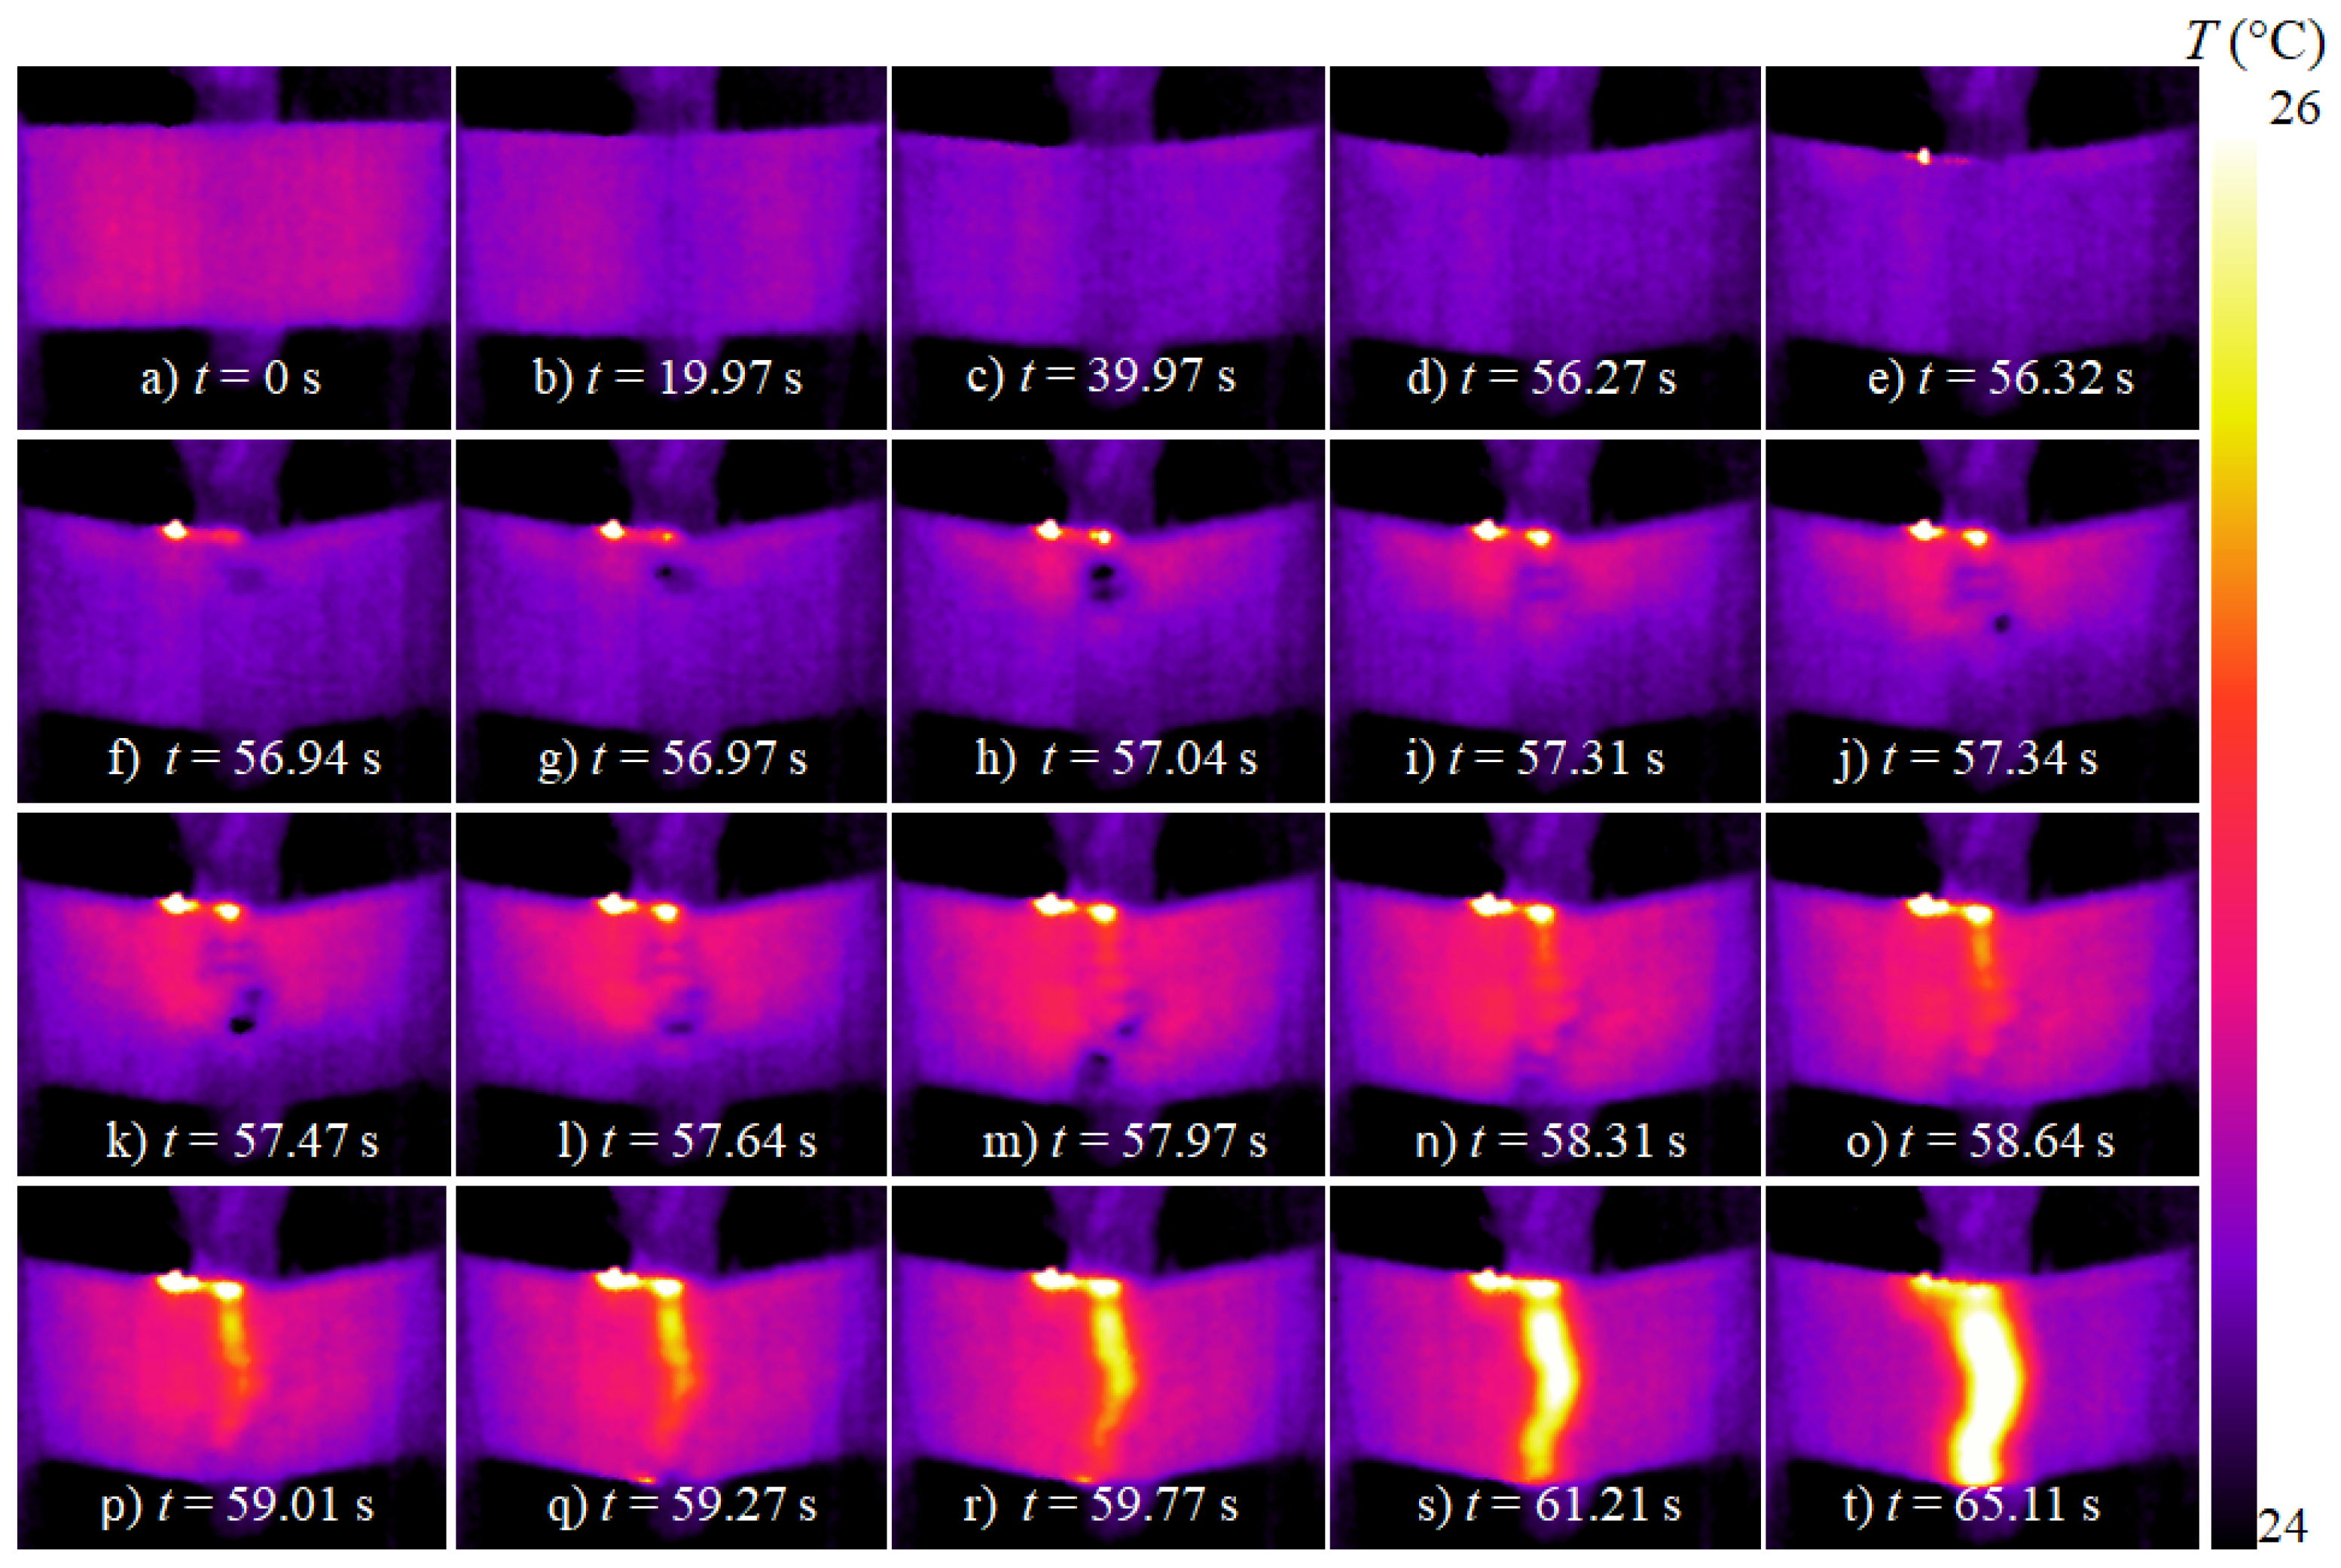
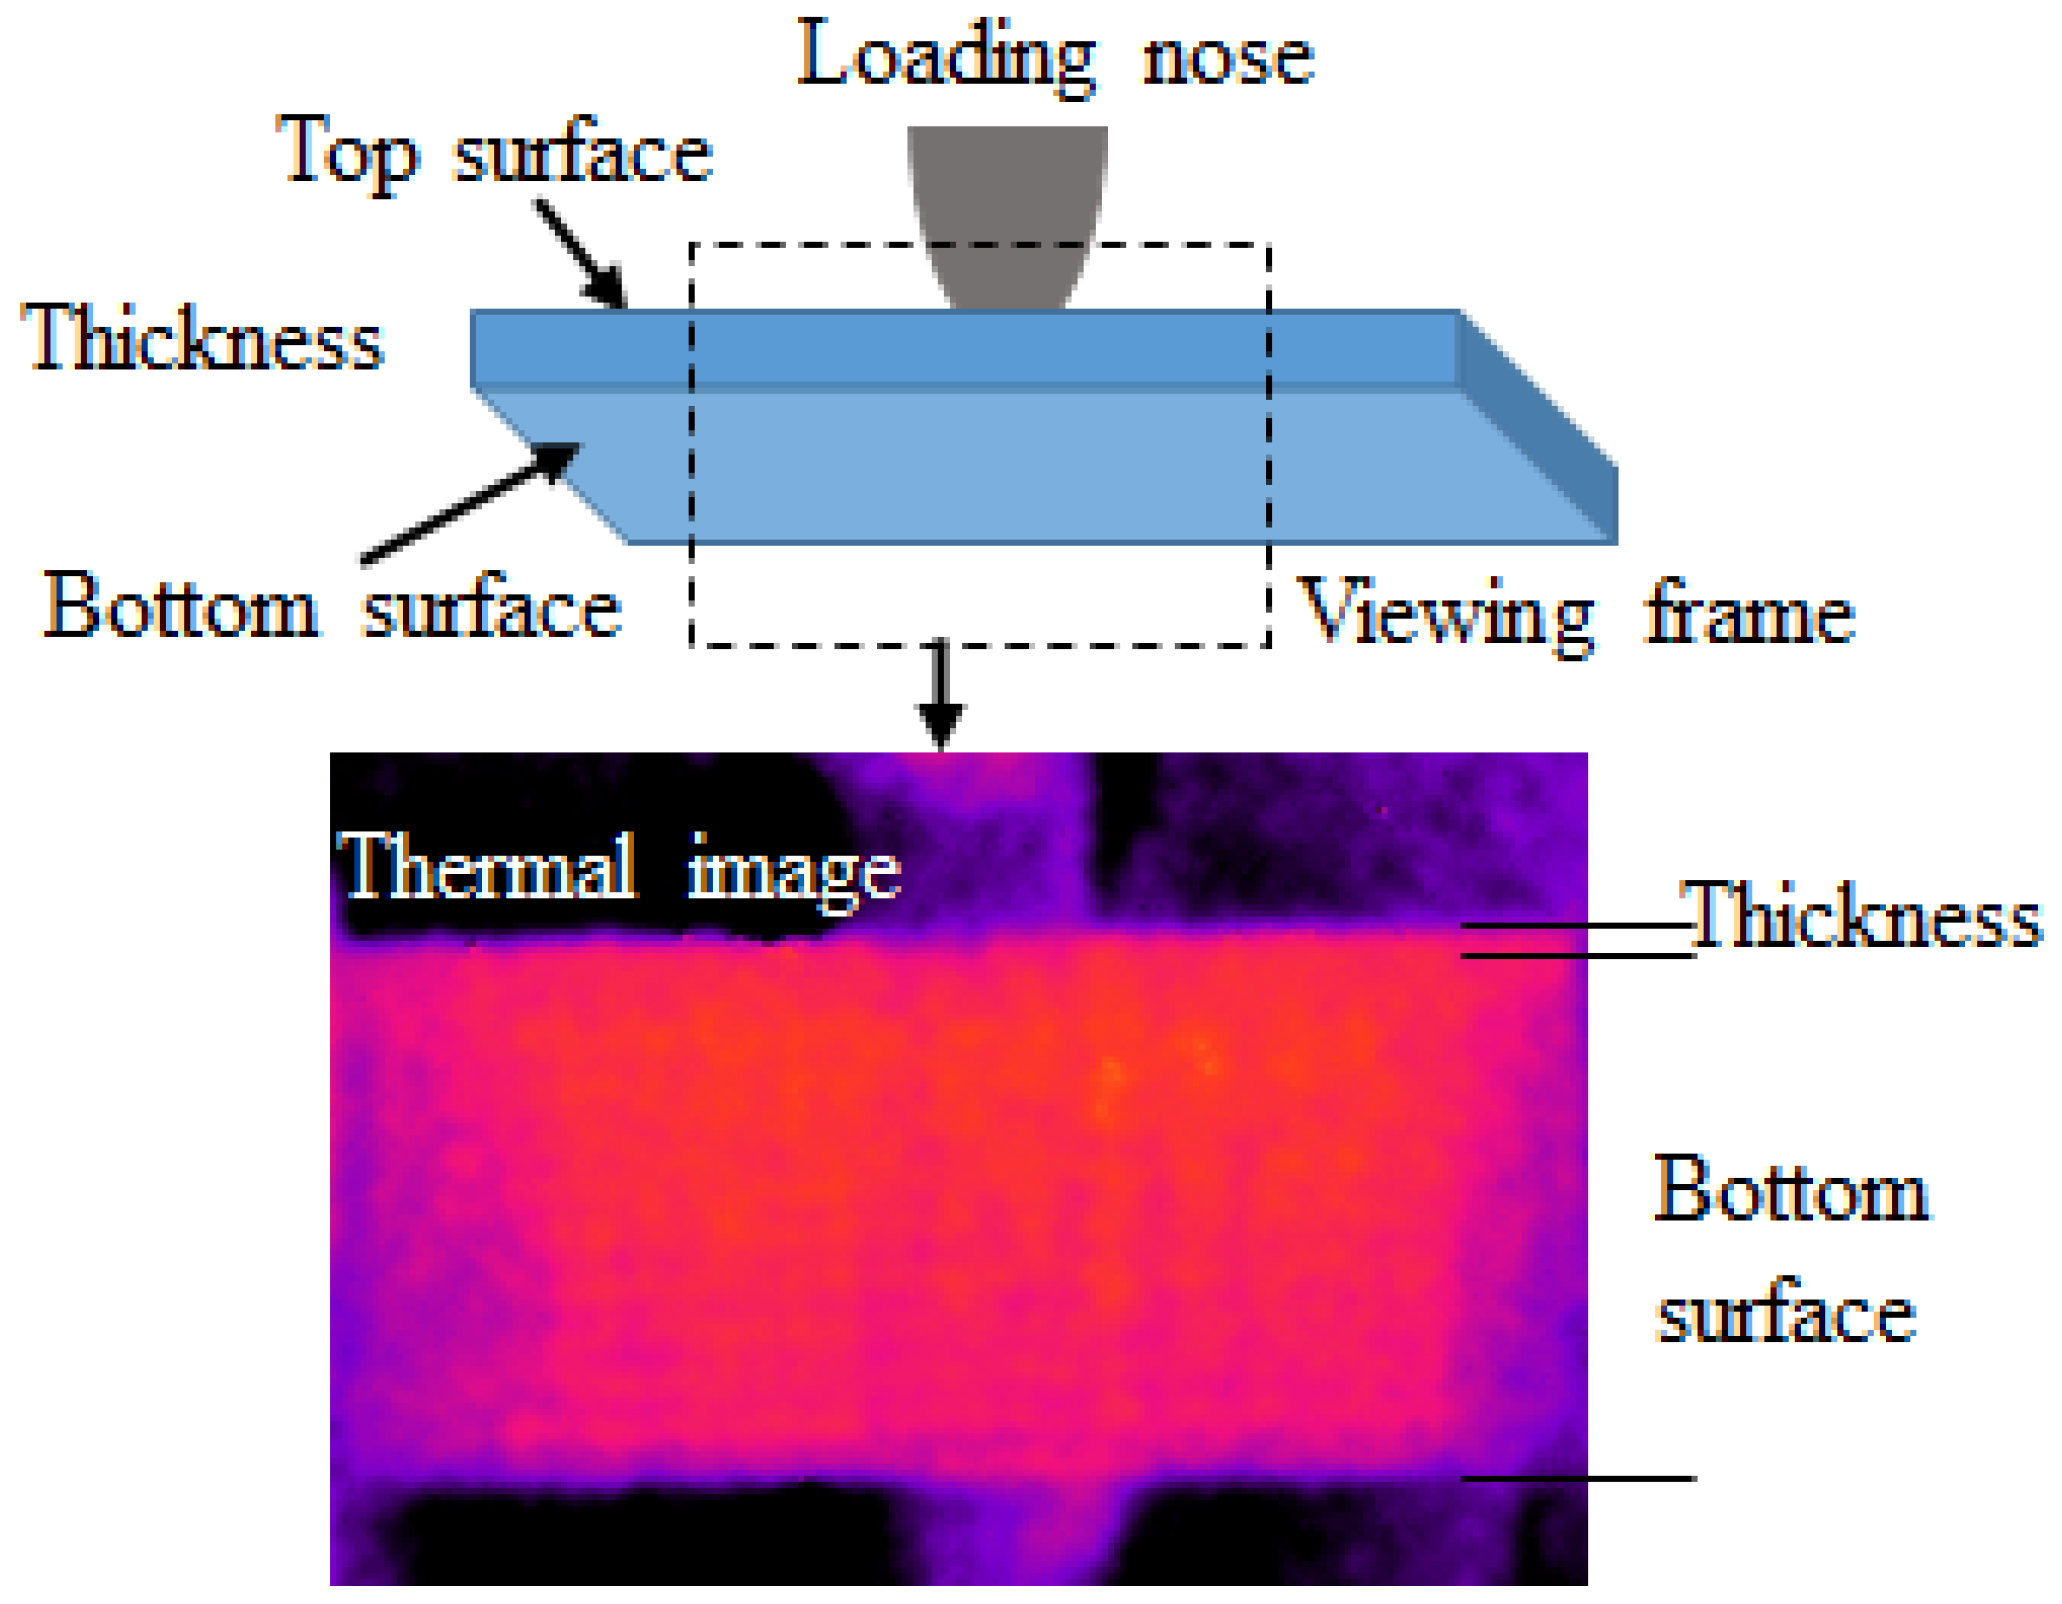
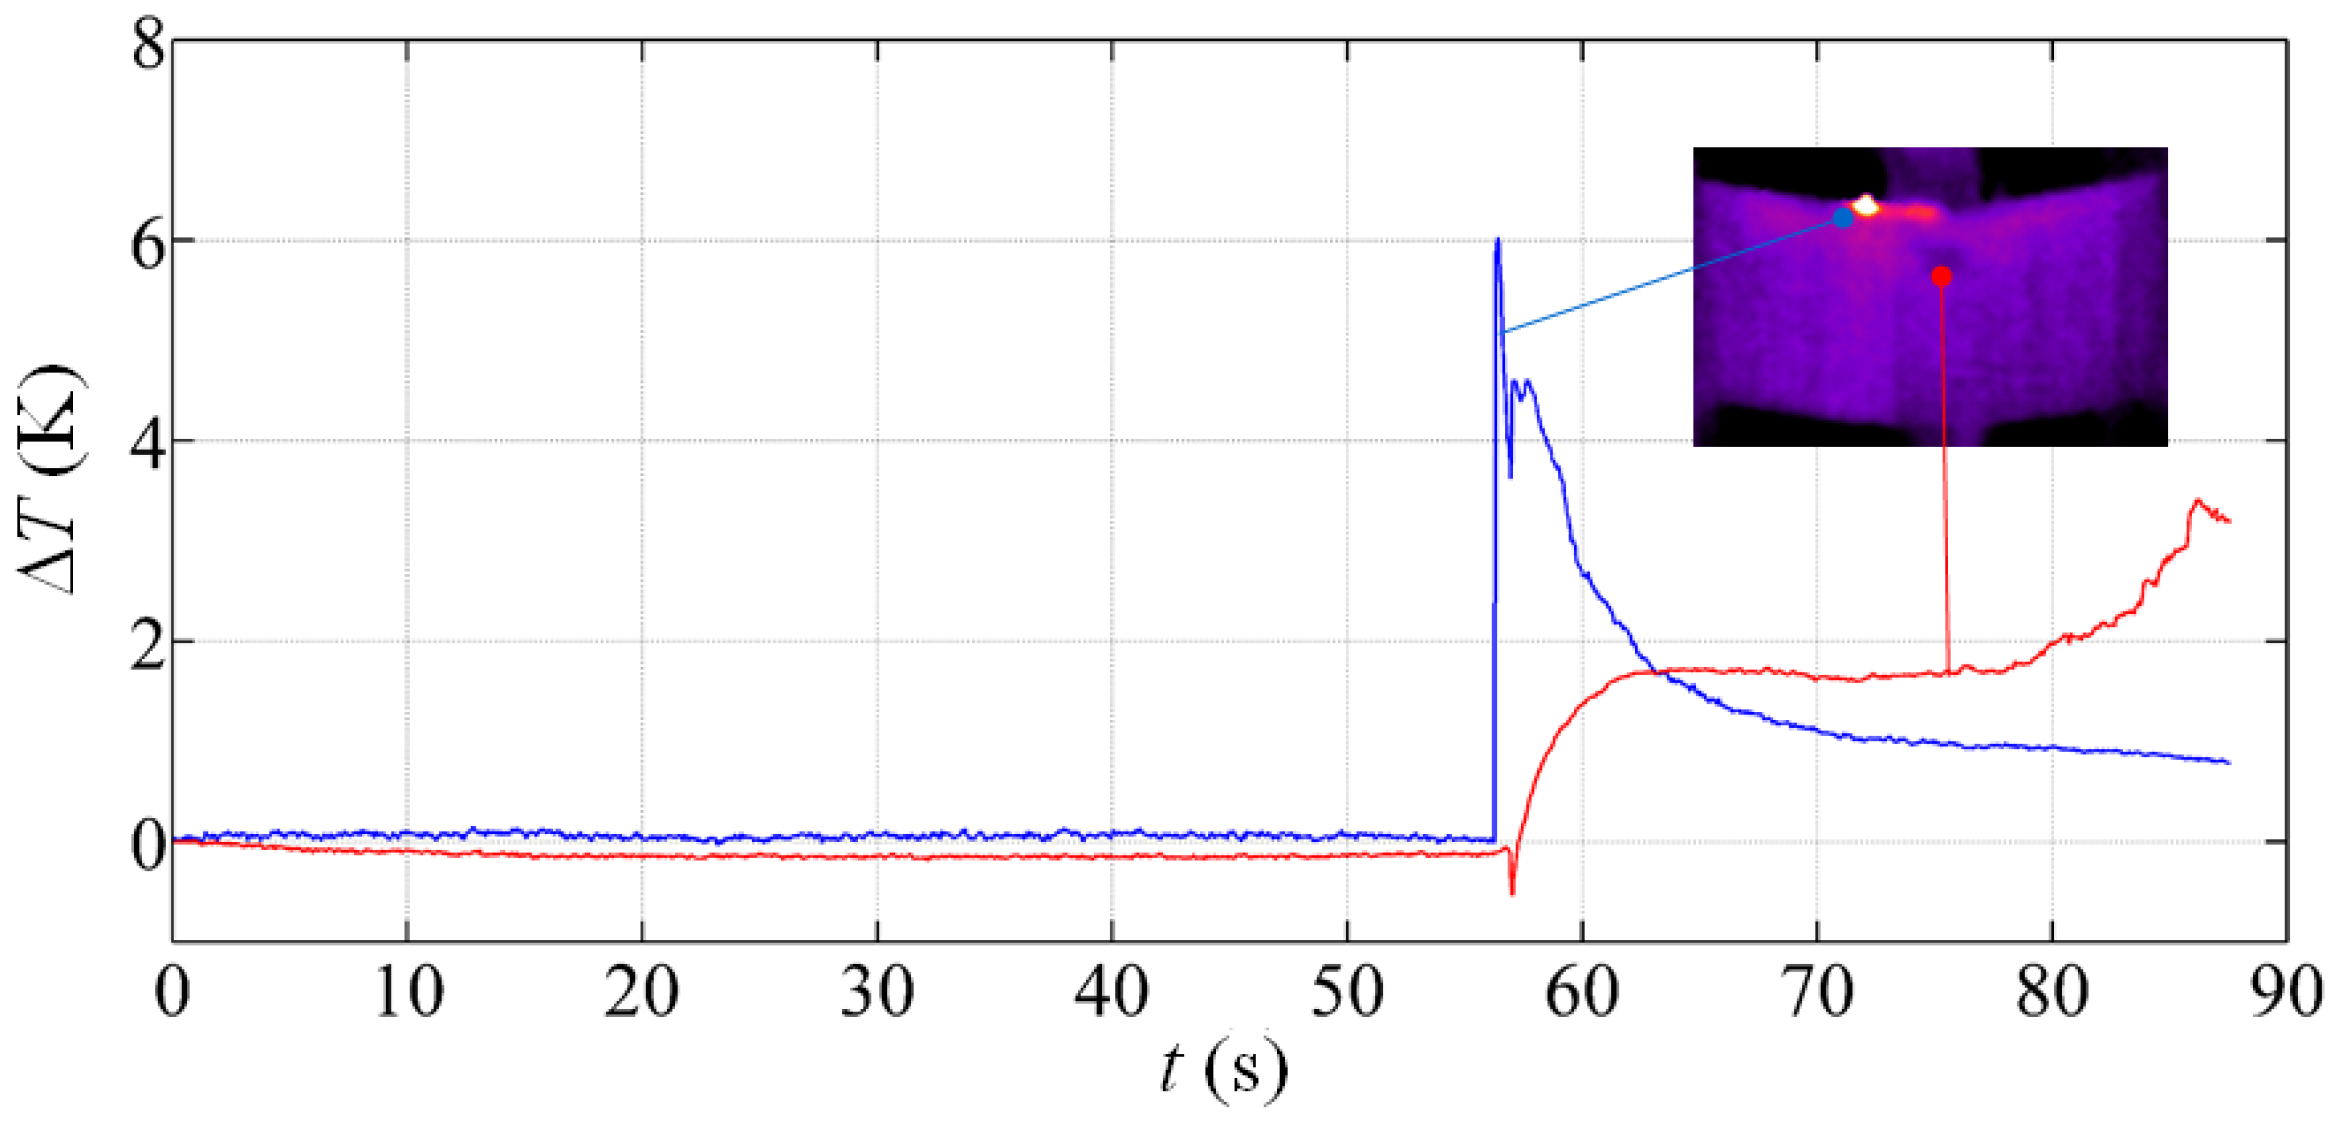
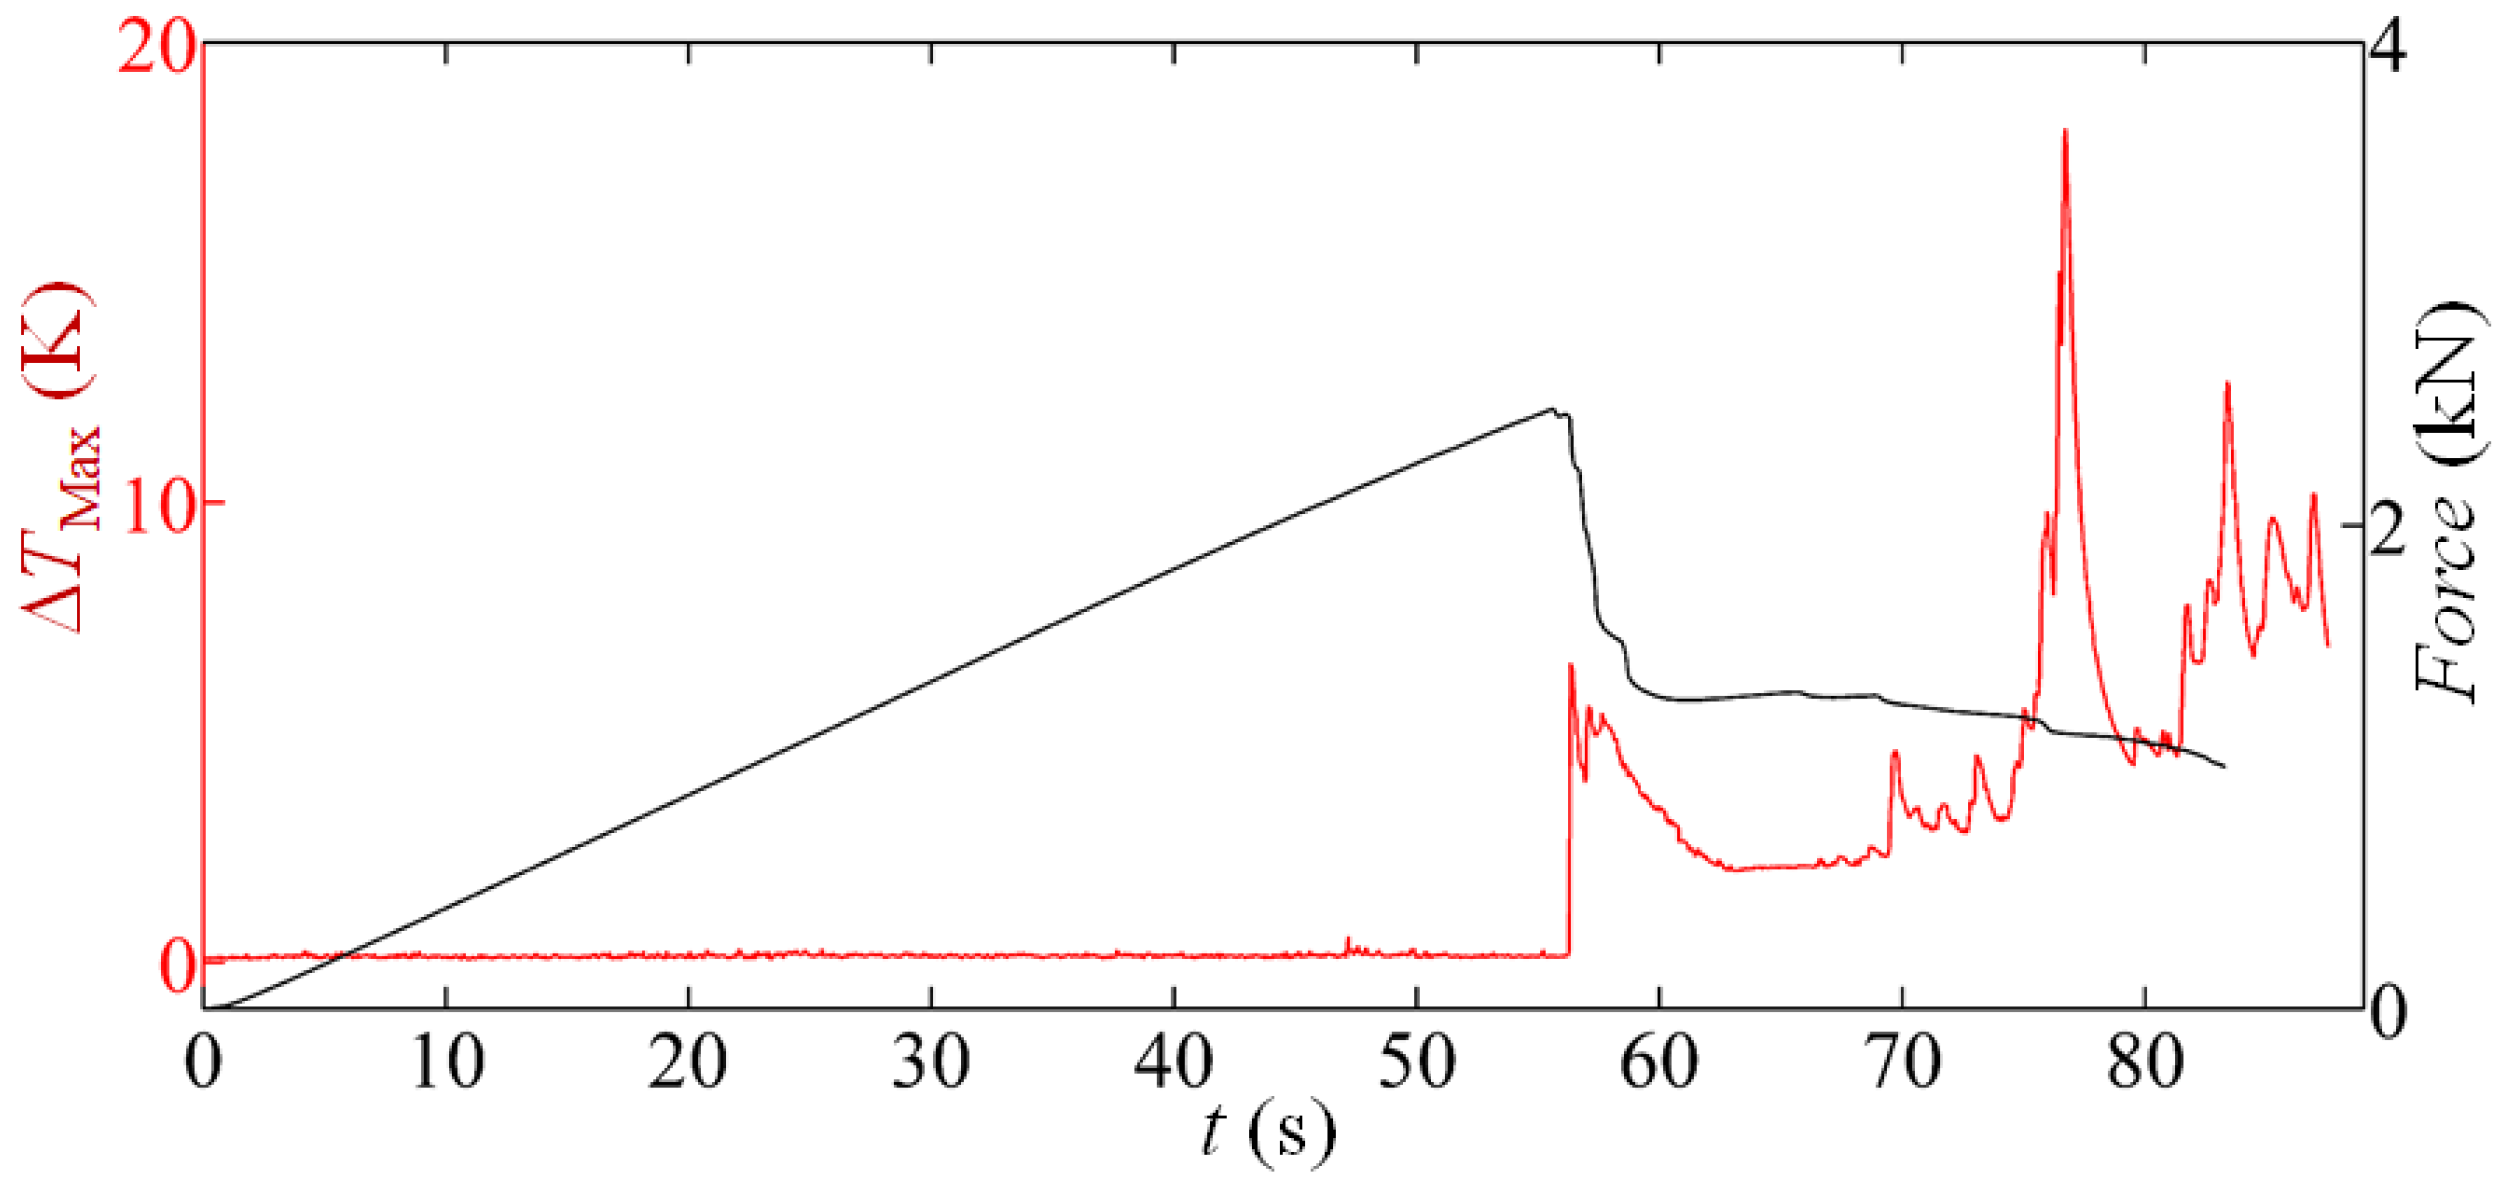
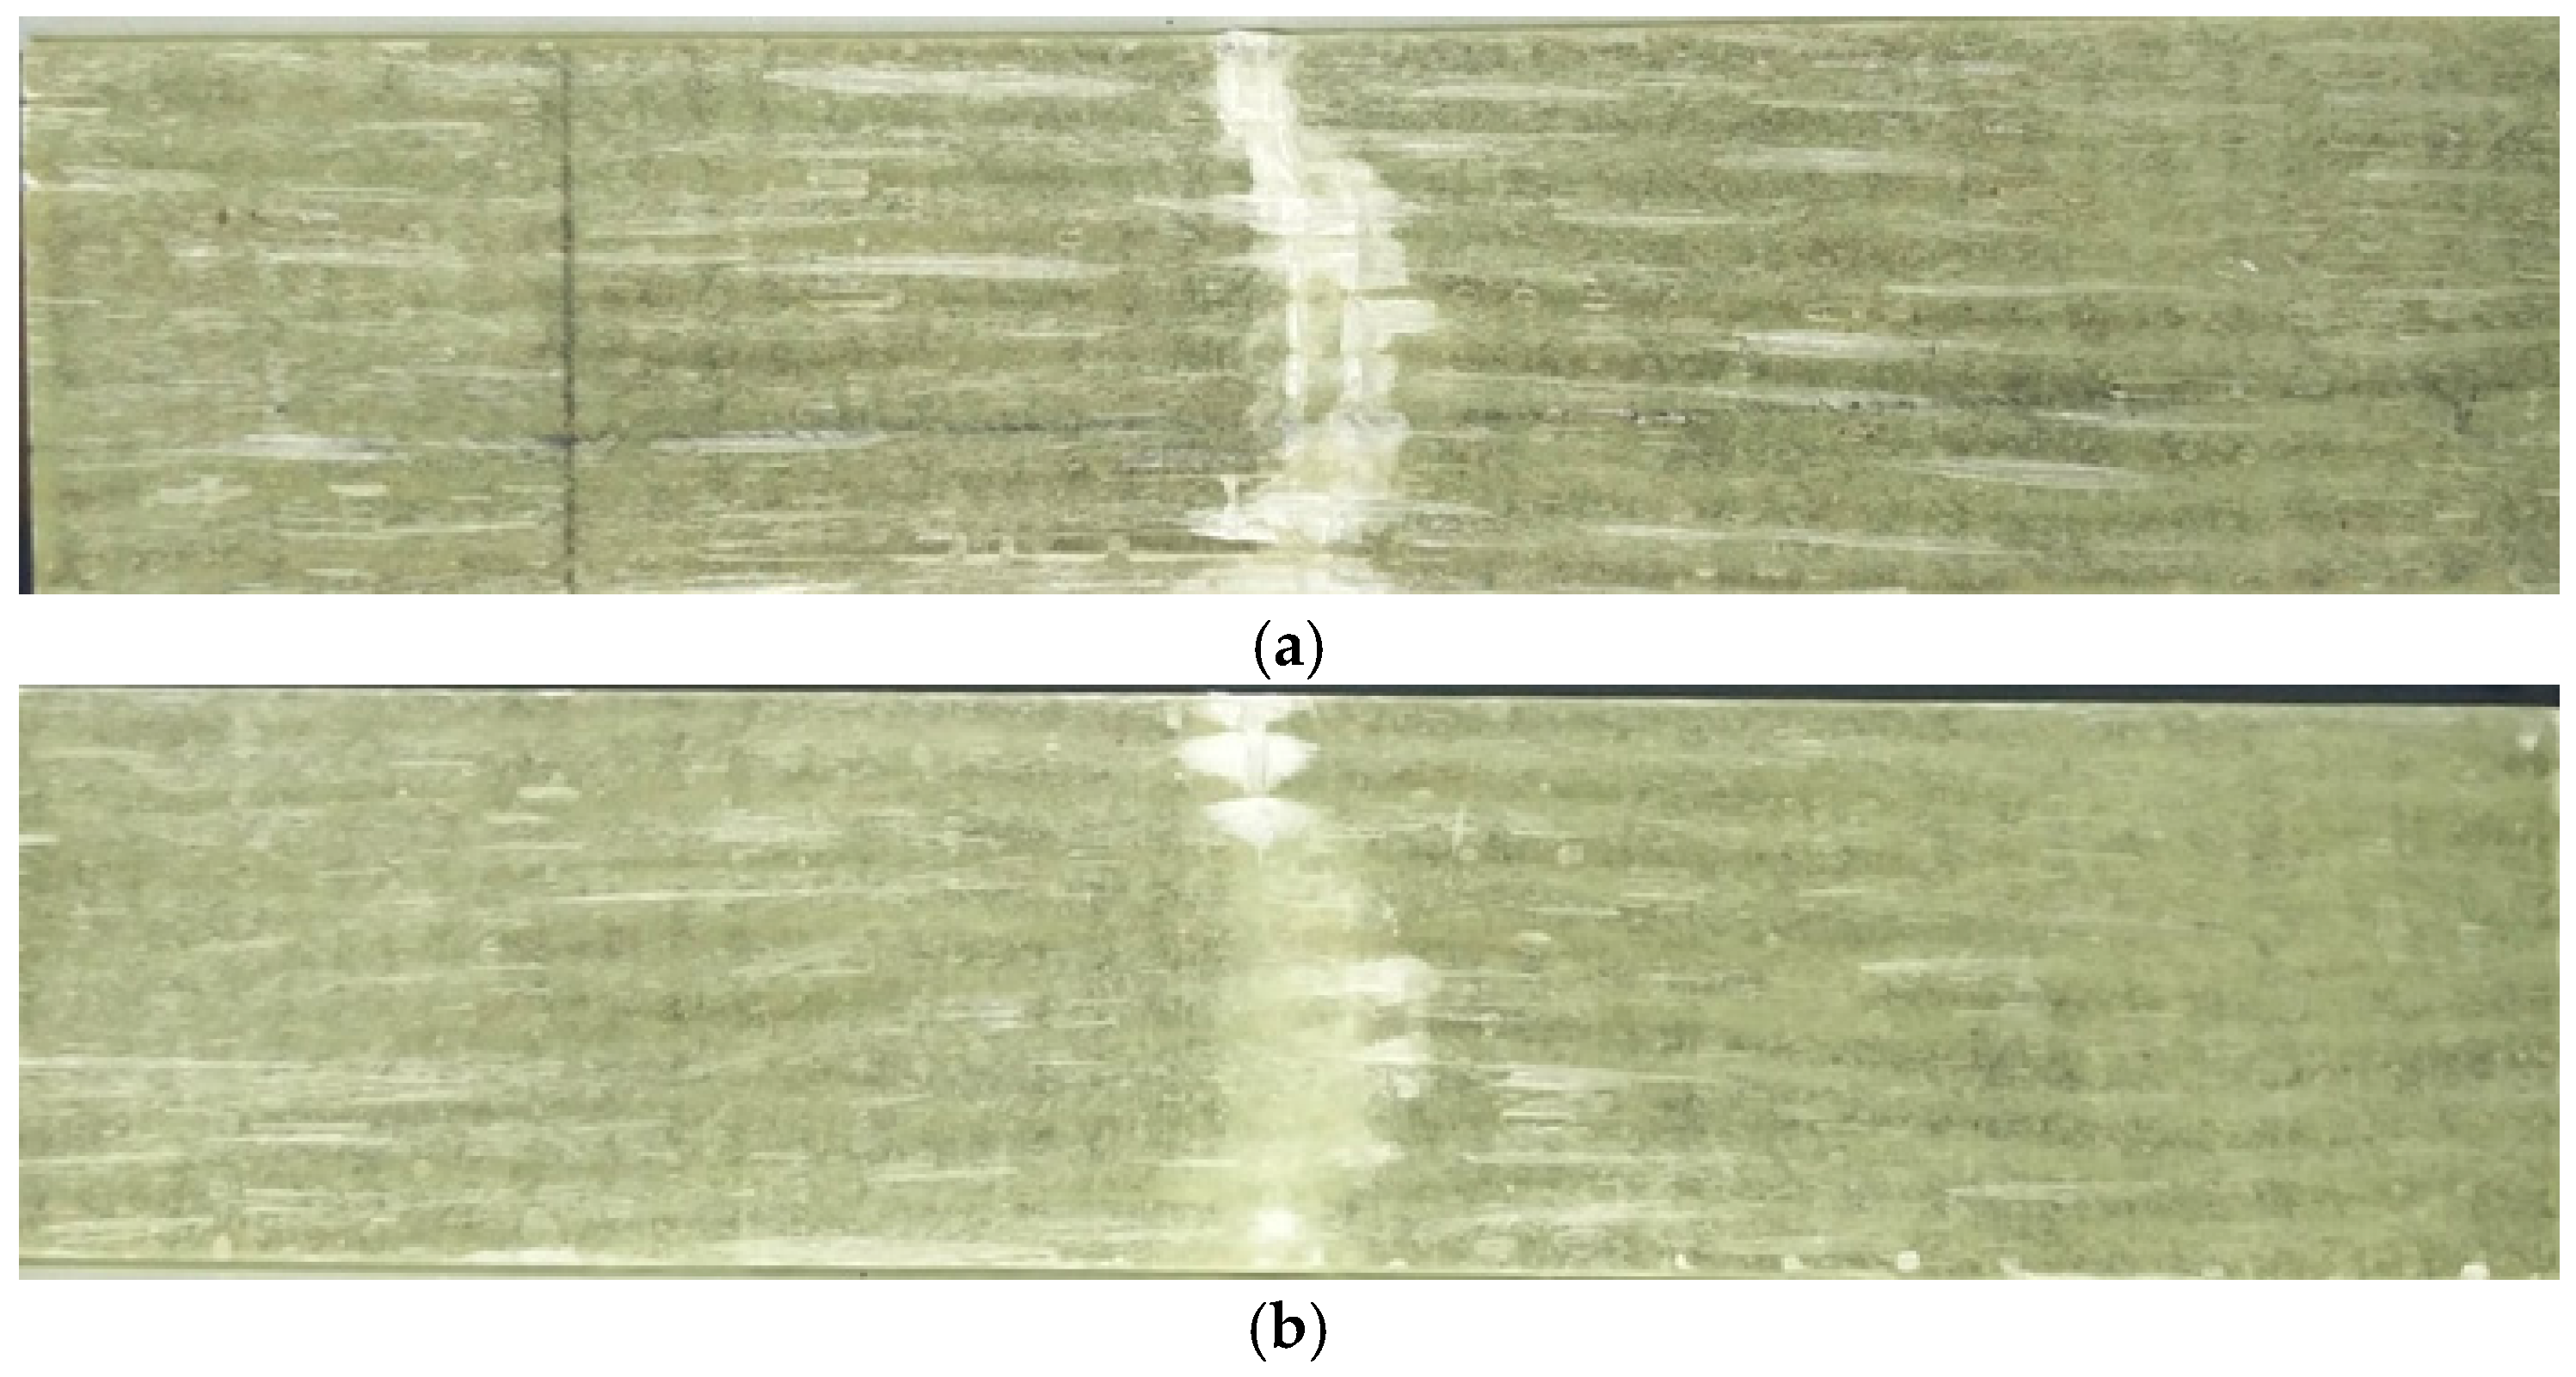
3.2. Quasi-Static Bending Tests
4. Discussion and Concluding Remarks
Supplementary Materials
Author Contributions
Conflicts of Interest
References
- Hull, D.; Clyne, T.W. An Introduction to Composite Materials; Cambridge University Press: Cambridge, UK, 1996. [Google Scholar]
- Soutis, C. Fiber reinforced composite in aircraft construction. Prog. Aerosp. Sci. 2005, 41, 143–151. [Google Scholar] [CrossRef]
- Plackett, D.; Andersen, T.L.; Pedersen, W.B.; Nielsen, L. Biodegradable composites based on l-polylactide and jute fibres. Compos. Sci. Technol. 2003, 63, 1287–1296. [Google Scholar] [CrossRef]
- Lee, S.H.; Wang, S. Biodegradable polymers/bamboo fiber biocomposite with bio-based coupling agent. Compos. A 2006, 37, 80–91. [Google Scholar] [CrossRef]
- Gupta, N.; Jain, A.K.; Asokan, P. Mechanical characterization of fully bio-degradable jute fabric reinforced polylactic acid composites. Int. J. Adv. Eng. Res. Stud. 2014, 111–113. Available online: http://www.technicaljournalsonline.com/ijaers/VOL%20III/IJAERS%20VOL%20III%20ISSUE%20IV%20JULY%20SEPTEMBER%202014/509.pdf (accessed on 19 February 2017).
- Richardson, M.O.W.; Wisheart, M.J. Review of low-velocity impact properties of composite materials. Compos. Part A 1996, 27, 1123–1131. [Google Scholar] [CrossRef]
- Shi, Y.; Soutis, C. Modelling low velocity impact induced damage in composite laminates. Mech. Adv. Mater. Mod. Processes 2017, 3, 14. [Google Scholar] [CrossRef]
- Abrate, S. Impact on Composite Structures; Cambridge University Press: Cambridge, UK, 1998. [Google Scholar]
- Pérez, M.A.; Martínez, X.; Oller, S.; Gil, L.; Rastellini, F.; Flores, F. Impact damage prediction in carbon fiber-reinforced laminated composite using the matrix-reinforced mixing theory. Compos. Struct. 2013, 104, 239–246. [Google Scholar] [CrossRef]
- Abrate, S. Modeling of impacts on composite structures. Compos. Struct. 2001, 51, 129–138. [Google Scholar] [CrossRef]
- Feraboli, P.; Kedward, K.T. A new composite structure impact performance assessment program. Compos. Sci. Technol. 2006, 66, 1336–1347. [Google Scholar] [CrossRef]
- Tita, V.; de Carvalho, J.; Vandepitte, D. Failure analysis of low velocity impact on thin composite laminates: Experimental and numerical approaches. Compos. Struct. 2008, 83, 413–428. [Google Scholar] [CrossRef]
- Gonzalez, E.V.; Maimf, P.; Camanho, P.P.; Turon, A.; Mayugo, J.A. Simulation of drop-weight impact and compression after impact tests on composite laminates. Compos. Struct. 2012, 94, 3364–3378. [Google Scholar] [CrossRef]
- Choi, I.H. Low-velocity impact analysis of composite laminates under initial in-plane load. Compos. Struct. 2008, 86, 251–257. [Google Scholar] [CrossRef]
- Olsson, R. Analytical prediction of large mass impact damage in composite laminates. Compos. Part A 2001, 32, 1207–1215. [Google Scholar] [CrossRef]
- Meola, C.; Carlomagno, G.M. Impact damage in GFRP: New insights with Infrared Thermography. Compos. Part A 2010, 41, 1839–1847. [Google Scholar] [CrossRef]
- Meola, C.; Carlomagno, G.M.; Bonavolontà, C.; Valentino, M. Monitoring composites under bending tests with infrared thermography. Adv. Opt. Technol. 2012, 2012, 720813. [Google Scholar] [CrossRef]
- Boccardi, S.; Carlomagno, G.M.; Meola, C.; Russo, P.; Simeoli, G. Monitoring mechanical loading of polylactic acid matrix jute reinforced composites. In Proceedings of the XXIII Conference of the Italian Association of Theoretical and Applied Mechanics (AIMETA), Salerno, Italy, 4–7 Settembre 2017; Ascione, L., Berardi, V., Feo, L., Fraternali, F., Tralli, A.M., Eds.; pp. 1934–1942, ISBN 978-889-42484-7-0. [Google Scholar]
- Lisle, T.; Bouvet, C.; Pastor, M.L.; Margueres, P.; Corral, R.P. Damage assessment of thin woven composite subjected to quasi-static tensile loading using infrared thermography. In Proceedings of the ECCM15—15th European Conference on Composite Materials, Venice, Italy, 24–28 June 2012. [Google Scholar]
- Meola, C.; Boccardi, S.; Boffa, N.D.; Ricci, F.; Simeoli, G.; Russo, P.; Carlomagno, G.M. New perspectives on impact damaging of thermoset- and thermoplastic-matrix composites from thermographic images. Compos. Struct. 2016, 152, 746–754. [Google Scholar]
- Naik, N.K.; Chandra Sekher, Y. Sailendra Meduri, Damage in woven-fabric composites subjected to low-velocity impact. Compos. Sci. Technol. 2000, 60, 731–744. [Google Scholar] [CrossRef]
- Naik, N.K.; Ramasimha, R.; Arya, H.; Prabhu, S.V.; ShamaRao, N. Impact response and damage tolerance characteristics of glass-carbon/epoxy hybrid composite plates. Compos. Part B Eng. 2001, 32, 565–574. [Google Scholar] [CrossRef]
- Boccardi, S.; Carlomagno, G.M.; Meola, C. Post-processing of time-sequences acquired during impact tests with the aid of a reference area. In Proceedings of the QIRT Conference, QIRT 2016, Gdansk, Poland, 4–8 July 2016. [Google Scholar] [CrossRef]


| E (J) | Ah (mm2) | E/Ah (J/mm2) | ∆TMin (K) | ∆TMax (K) | ∆t (s) | ∆tD (s) | tp (s) |
|---|---|---|---|---|---|---|---|
| 2.8 | 206 | 0.0136 | −1.9 | 9 | 0.021 | 0.007 | 0.007 |
| 8.3 | 467 | 0.0178 | −2.1 | 16 | 0.019 | 0.003 | 0.008 |
| 11.7 | 580 | 0.0207 | −2.2 | 17 | 0.019 | 0.003 | 0.008 |
| 15.0 | 743 | 0.0202 | −1.8 | 11 | 0.019 | 0.003 | 0.008 |
© 2018 by the authors. Licensee MDPI, Basel, Switzerland. This article is an open access article distributed under the terms and conditions of the Creative Commons Attribution (CC BY) license (http://creativecommons.org/licenses/by/4.0/).
Share and Cite
Meola, C.; Boccardi, S.; Carlomagno, G.M. Infrared Thermography for Inline Monitoring of Glass/Epoxy under Impact and Quasi-Static Bending. Appl. Sci. 2018, 8, 301. https://doi.org/10.3390/app8020301
Meola C, Boccardi S, Carlomagno GM. Infrared Thermography for Inline Monitoring of Glass/Epoxy under Impact and Quasi-Static Bending. Applied Sciences. 2018; 8(2):301. https://doi.org/10.3390/app8020301
Chicago/Turabian StyleMeola, Carosena, Simone Boccardi, and Giovanni Maria Carlomagno. 2018. "Infrared Thermography for Inline Monitoring of Glass/Epoxy under Impact and Quasi-Static Bending" Applied Sciences 8, no. 2: 301. https://doi.org/10.3390/app8020301
APA StyleMeola, C., Boccardi, S., & Carlomagno, G. M. (2018). Infrared Thermography for Inline Monitoring of Glass/Epoxy under Impact and Quasi-Static Bending. Applied Sciences, 8(2), 301. https://doi.org/10.3390/app8020301