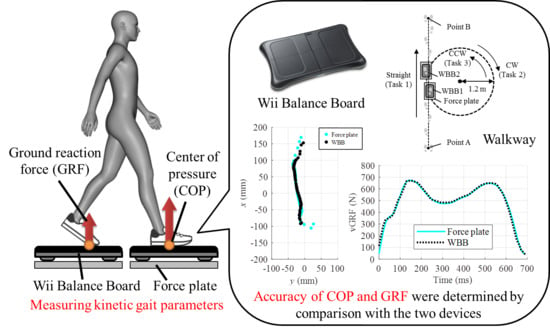
Validity of the Nintendo Wii Balance Board for Kinetic Gait Analysis
Abstract
:1. Introduction
2. Materials and Methods
2.1. Device
2.2. Procedures
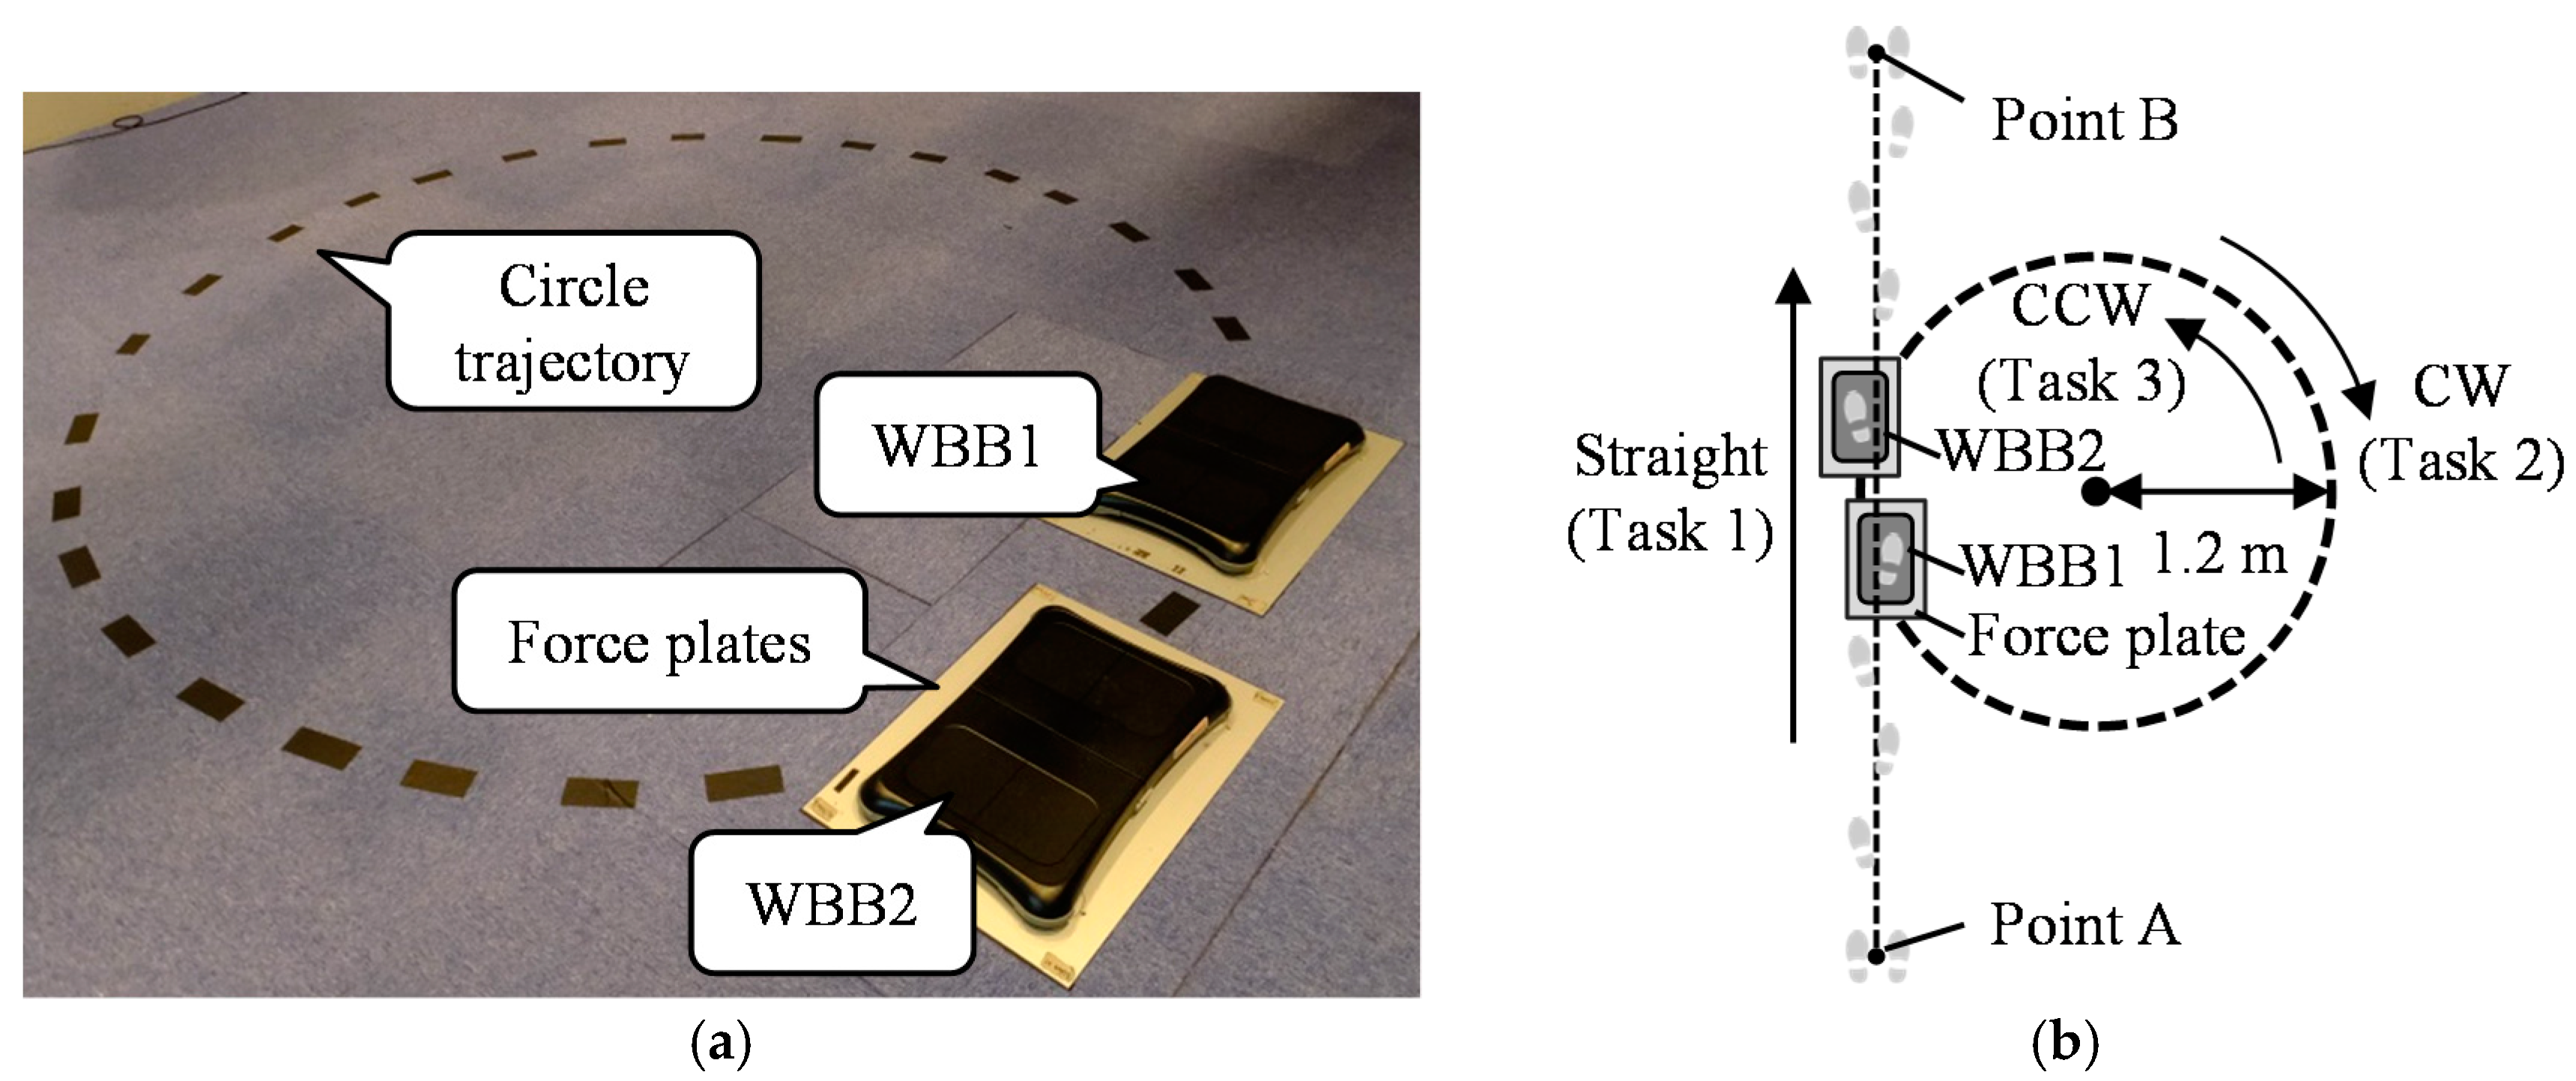
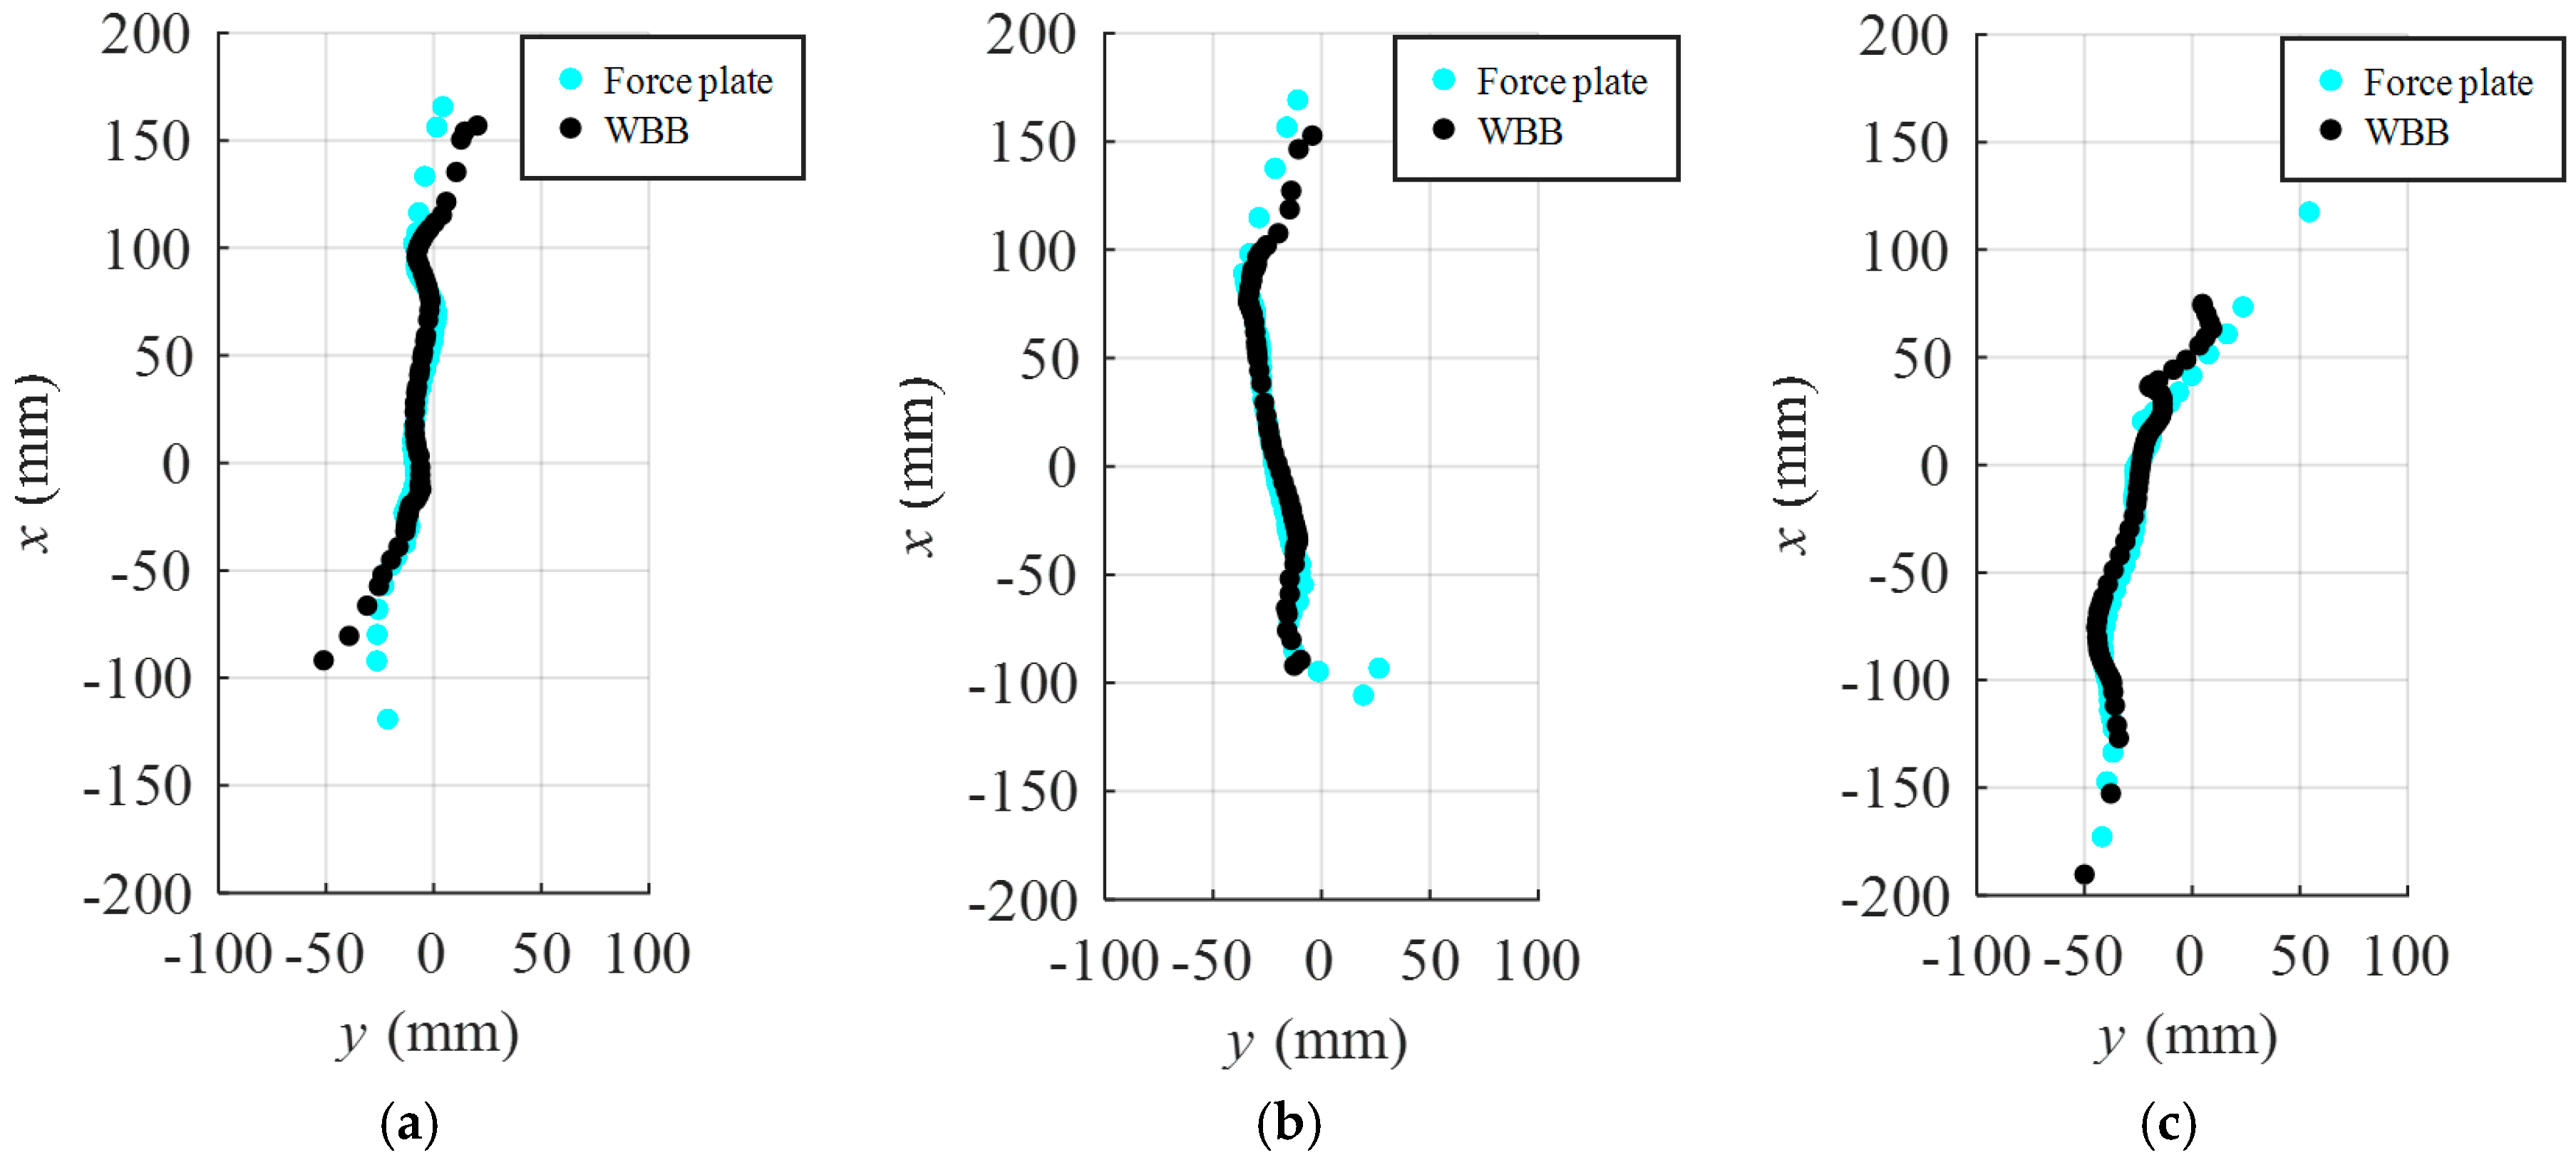
- The participants walked from point A through the two WBBs and the force plates with their fourth and fifth steps making contact with the devices. Then they kept walking forward and stopped at point B. They each repeated this task 10 times.
- The participants walked from point A to the devices, similarly to the first task. However, after their steps contacted with both device sets, they started walking along the circle trajectory. Then, they continued along the circle in a clockwise (CW) direction for 11 rounds, before walking through to point B during the final lap.
- The participants walked from point B to the devices and kept walking on the circle trajectory in a counterclockwise (CCW) direction for 11 rounds, before walking through to point A during the final lap.
2.3. Data Analysis
3. Results
4. Discussions
5. Conclusions
Acknowledgments
Author Contributions
Conflicts of Interest
References
- Leroux, A.; Pinet, H.; Nadeau, S. Task-oriented intervention in chronic stroke—Changes in clinical and laboratory measures of balance and mobility. Am. J. Phys. Med. Rehabil. 2006, 85, 820–830. [Google Scholar] [CrossRef] [PubMed]
- Hass, C.J.; Waddell, D.E.; Fleming, R.P.; Juncos, J.L.; Gregor, R.J. Gait initiation and dynamic balance control in Parkinson’s disease. Arch. Phys. Med. Rehabil. 2005, 86, 2172–2176. [Google Scholar] [CrossRef] [PubMed]
- Van den Noort, J.C.; Van der Esch, M.; Steultjens, M.P.M.; Dekker, J.; Schepers, H.M.; Veltink, P.H.; Harlaar, J. The knee adduction moment measured with an instrumented force shoe in patients with knee osteoarthritis. J. Biomech. 2012, 45, 281–288. [Google Scholar] [CrossRef] [PubMed]
- Clark, R.A.; Bryant, A.L.; Pua, Y.H.; McCrory, P.; Bennell, K.; Hunt, M. Validity and reliability of the Nintendo Wii Balance Board for assessment of standing balance. Gait Posture 2010, 31, 307–310. [Google Scholar] [CrossRef] [PubMed]
- Huurnink, A.; Fransz, D.P.; Kingma, I.; van Dieen, J.H. Comparison of a laboratory grade force platform with a Nintendo Wii Balance Board on measurement of postural control in single-leg stance balance tasks. J. Biomech. 2013, 46, 1392–1395. [Google Scholar] [CrossRef] [PubMed]
- Leach, J.M.; Mancini, M.; Peterka, R.J.; Hayes, T.L.; Horak, F.B. Validating and calibrating the Nintendo Wii balance board to derive reliable center of pressure measures. Sensors 2014, 14, 18244–18267. [Google Scholar] [CrossRef] [PubMed]
- Yamako, G.; Chosa, E.; Totoribe, K.; Fukao, Y.; Deng, G. Quantification of the sit-to-stand movement for monitoring age-related motor deterioration using the Nintendo Wii Balance Board. PLoS ONE 2017, 12, e0188165. [Google Scholar] [CrossRef] [PubMed]
- Abujaber, S.; Gillispie, G.; Marmon, A.; Zeni, J. Validity of the Nintendo Wii Balance Board to assess weight bearing asymmetry during sit-to-stand and return-to-sit task. Gait Posture 2015, 41, 676–682. [Google Scholar] [CrossRef] [PubMed]
- Yamamoto, K.; Matsuzawa, M. Validity of a jump training apparatus using Wii Balance Board. Gait Posture 2013, 38, 132–135. [Google Scholar] [CrossRef] [PubMed]
- Bartlett, H.L.; Ting, L.H.; Bingham, J.T. Accuracy of force and center of pressure measures of the Wii Balance Board. Gait Posture 2014, 39, 224–228. [Google Scholar] [CrossRef] [PubMed]
- Audiffren, J.; Contal, E. Preprocessing the Nintendo Wii board signal to derive more accurate descriptors of statokinesigrams. Sensors 2016, 16, 1208. [Google Scholar] [CrossRef] [PubMed]
- Scaglioni-Solano, P.; Aragon-Vargas, L.F. Validity and reliability of the Nintendo Wii Balance Board to assess standing balance and sensory integration in highly functional older adults. Int. J. Rehabil. Res. 2014, 37, 138–143. [Google Scholar] [CrossRef] [PubMed]
- Clark, R.A.; McGough, R.; Paterson, K. Reliability of an inexpensive and portable dynamic weight bearing asymmetry assessment system incorporating dual Nintendo Wii Balance Boards. Gait Posture 2011, 34, 288–291. [Google Scholar] [CrossRef] [PubMed]
- Koslucher, F.; Wade, M.G.; Nelson, B.; Lim, K.; Chen, F.C.; Stoffregen, T.A. Nintendo Wii Balance Board is sensitive to effects of visual tasks on standing sway in healthy elderly adults. Gait Posture 2012, 36, 605–608. [Google Scholar] [CrossRef] [PubMed]
- Wikstrom, E.A. Validity and reliability of Nintendo Wii Fit balance scores. J. Athl. Train. 2012, 47, 306–313. [Google Scholar] [CrossRef] [PubMed]
- Holmes, J.D.; Jenkins, M.E.; Johnson, A.M.; Hunt, M.A.; Clark, R.A. Validity of the Nintendo Wii® balance board for the assessment of standing balance in Parkinson’s disease. Clin. Rehabil. 2013, 27, 361–366. [Google Scholar] [CrossRef] [PubMed]
- Severini, G.; Straudi, S.; Pavarelli, C.; Da Roit, M.; Martinuzzi, C.; Pizzongolo, L.D.; Basaglia, N. Use of Nintendo Wii Balance Board for posturographic analysis of Multiple Sclerosis patients with minimal balance impairment. J. Neuroeng. Rehabil. 2017, 14, 19. [Google Scholar] [CrossRef] [PubMed]
- Guglielmetti, S.; Nardone, A.; De Nunzio, A.M.; Godi, M.; Schieppati, M. Walking along circular trajectories in Parkinson’s disease. Mov. Disord. 2009, 24, 598–604. [Google Scholar] [CrossRef] [PubMed]
- Godi, M.; Nardone, A.; Schieppati, M. Curved walking in hemiparetic patients. J. Rehabil. Med. 2010, 42, 858–865. [Google Scholar] [CrossRef] [PubMed]
- Godi, M.; Turcato, A.M.; Schieppati, M.; Nardone, A. Test-retest reliability of an insole plantar pressure system to assess gait along linear and curved trajectories. J. Neuroeng. Rehabil. 2014, 11, 95. [Google Scholar] [CrossRef] [PubMed]
- Courtine, G.; Schieppati, M. Human walking along a curved path. I. Body trajectory, segment orientation and the effect of vision. Eur. J. Neurosci. 2003, 18, 177–190. [Google Scholar] [CrossRef] [PubMed]
- Courtine, G.; Schieppati, M. Human walking along a curved path. II. Gait features and EMG patterns. Eur. J. Neurosci. 2003, 18, 191–205. [Google Scholar] [CrossRef] [PubMed]
- Courtine, G.; Schieppati, M. Tuning of a basic coordination pattern constructs straight-ahead and curved walking in humans. J. Neurophysiol. 2004, 91, 1524–1535. [Google Scholar] [CrossRef] [PubMed]
- Bergstrom, P.; Edlund, O. Robust registration of point sets using iteratively reweighted least squares. Comput. Optim. Appl. 2014, 58, 543–561. [Google Scholar] [CrossRef]
- Hausdorff, J.M.; Ladin, Z.; Wei, J.Y. Footswitch system for measurement of the temporal parameters of gait. J. Biomech. 1995, 28, 347–351. [Google Scholar] [CrossRef]
- Hurkmans, H.L.P.; Bussmann, J.B.J.; Selles, R.W.; Horemans, H.L.D.; Benda, E.; Stam, H.J.; Verhaar, J.A.N. Validity of the Pedar Mobile system for vertical force measurement during a seven-hour period. J. Biomech. 2006, 39, 110–118. [Google Scholar] [CrossRef] [PubMed]
- Chesnin, K.J.; Selby-Silverstein, L.; Besser, M.P. Comparison of an in-shoe pressure measurement device to a force plate: Concurrent validity of center of pressure measurements. Gait Posture 2000, 12, 128–133. [Google Scholar] [CrossRef]

| Subject | Straight Walking (ms) | Curved Walking (ms) | ||||
|---|---|---|---|---|---|---|
| CW | CCW | |||||
| LF | RF | LF (OUT) | RF (IN) | LF (IN) | RF (OUT) | |
| A | 4.7 (±8.8) | −4.1 (±7.9) | 4.5 (±6.3) | 0.0 (±8.1) | −7.5 (±6.6) | −9.9 (±8.3) |
| B | 9.6 (±7.3) | 8.8 (±8.2) | −16.0 (±7.9) | −14.2 (±4.4) | −1.9 (±6.9) | 0.0 (±6.2) |
| C | 3.5 (±5.3) | −1.2 (±4.4) | 7.5 (±6.2) | −0.7 (±6.2) | −10.1 (±4.1) | −18.3 (±7.6) |
| Subject | Straight Walking (%) | Curved Walking (%) | ||||
|---|---|---|---|---|---|---|
| CW | CCW | |||||
| LF | RF | LF (OUT) | RF (IN) | LF (IN) | RF (OUT) | |
| A | 2.7 (±0.6) | 2.5 (±0.6) | 3.9 (±1.5) | 2.4 (±0.8) | 3.1 (±1.2) | 4.2 (±1.8) |
| B | 3.5 (±1.7) | 3.2 (±1.5) | 5.2 (±1.6) | 4.1 (±1.5) | 2.6 (±0.8) | 2.6 (±0.5) |
| C | 3.4 (±0.7) | 3.6 (±0.6) | 4.0 (±1.7) | 2.8 (±1.3) | 5.2 (±1.5) | 6.1 (±2.1) |
| Subject | Straight Walking | Curved Walking | ||||
|---|---|---|---|---|---|---|
| CW | CCW | |||||
| LF | RF | LF (OUT) | RF (IN) | LF (IN) | RF (OUT) | |
| A | 0.994 | 0.996 | 0.988 | 0.996 | 0.991 | 0.985 |
| B | 0.988 | 0.992 | 0.976 | 0.987 | 0.994 | 0.996 |
| C | 0.992 | 0.991 | 0.987 | 0.994 | 0.977 | 0.968 |
| Subject | LF | RF | ||
|---|---|---|---|---|
| x (mm) | y (mm) | x (mm) | y (mm) | |
| A | 11.5 (±8.5) | 5.3 (±1.1) | 8.5 (±2.1) | 4.2 (±0.8) |
| B | 9.9 (±2.8) | 7.5 (±0.9) | 8.3 (±3.3) | 6.3 (±1.3) |
| C | 9.8 (±2.6) | 7.7 (±1.7) | 10.1 (±2.9) | 6.3 (±1.4) |
| Subject | LF (OUT) | RF (IN) | ||
|---|---|---|---|---|
| x (mm) | y (mm) | x (mm) | y (mm) | |
| A | 12.3 (±5.0) | 6.5 (±1.1) | 9.2 (±1.9) | 7.2 (±1.9) |
| B | 16.3 (±3.4) | 6.0 (±0.9) | 12.5 (±7.6) | 8.0 (±1.7) |
| C | 13.1 (±5.0) | 8.6 (±2.7) | 12.6 (±11.9) | 7.9 (±3.3) |
| Subject | LF (IN) | RF (OUT) | ||
|---|---|---|---|---|
| x (mm) | y (mm) | x (mm) | y (mm) | |
| A | 17.6 (±4.5) | 7.6 (±1.0) | 6.9 (±1.7) | 7.5 (±1.4) |
| B | 15.1 (±6.4) | 10.1 (±3.5) | 7.3 (±1.5) | 6.0 (±1.1) |
| C | 15.0 (±2.2) | 8.1 (±1.3) | 10.4 (±3.7) | 8.3 (±1.2) |
© 2018 by the authors. Licensee MDPI, Basel, Switzerland. This article is an open access article distributed under the terms and conditions of the Creative Commons Attribution (CC BY) license (http://creativecommons.org/licenses/by/4.0/).
Share and Cite
Eguchi, R.; Takahashi, M. Validity of the Nintendo Wii Balance Board for Kinetic Gait Analysis. Appl. Sci. 2018, 8, 285. https://doi.org/10.3390/app8020285
Eguchi R, Takahashi M. Validity of the Nintendo Wii Balance Board for Kinetic Gait Analysis. Applied Sciences. 2018; 8(2):285. https://doi.org/10.3390/app8020285
Chicago/Turabian StyleEguchi, Ryo, and Masaki Takahashi. 2018. "Validity of the Nintendo Wii Balance Board for Kinetic Gait Analysis" Applied Sciences 8, no. 2: 285. https://doi.org/10.3390/app8020285
APA StyleEguchi, R., & Takahashi, M. (2018). Validity of the Nintendo Wii Balance Board for Kinetic Gait Analysis. Applied Sciences, 8(2), 285. https://doi.org/10.3390/app8020285


