1. Introduction
In recent decades, durability of concrete and reinforced concrete has been an important research issue. Also, modeling of young hardening concrete using finite-element analysis has received a lot of attention. A relatively new field of research is the concept of gradient concrete, which is also the main aspect in this article. These three fields of research (durability, gradient concrete, and finite element analysis of young hardening concrete) are combined in this study to simulate the effect on crack risk in durable concrete structures made of gradient concrete.
Durability in reinforced concrete structures is important, because many structures with a very long lifetime, for example tunnels, bridges, watergates or protective structures, are mainly made of reinforced concrete. Important infrastructure projects are built under assessment principles and constructional design patterns for a working life of up to 200 years [
1]. During the lifetime of a reinforced concrete structure both the concrete and the reinforcement are exposed to environmental influences. The main influences are corrosion induced by carbonation of the concrete, corrosion induced by chloride, freeze-thaw attack, chemical attacks or abrasive wear as already stated in present codes such as [
2]. In recent years, performance-based design concepts for durability of reinforced concrete structures against carbonation of the concrete have been developed (e.g., [
3,
4,
5,
6]).
To achieve long lifetimes of concrete structures the engineer needs to select the right materials and carefully elaborate the construction. The concrete surface, respectively the concrete zone near the surface, is exposed to the environment. Often the core of a concrete part has no requirements related to the resistance against environmental influences. Only the zone near the surface requires a high durable concrete, which leads to high cement content and low w/c ratios. In mass concrete structures thermal stresses during hydration are a known problem [
7,
8,
9,
10,
11,
12,
13,
14,
15,
16]. These thermal stresses can lead to cracks in the concrete. Durable but cracked concrete does not protect the reinforcement properly, therefore cracks have to be reduced or crack width has to be controlled. As a result, one main requirement for the core of a mass concrete part is low hydration energy. Obviously, the core and the surface zone have different requirements to concrete composition. The idea is to use concrete with high durability in the outside zone of the concrete part and concrete with low hydration energy in the central zone. In large-scale dams or watergates, concrete sections with zones of different properties were used for a long time [
17]. As mentioned before, gradient concrete is a relatively young research topic. Ongoing research shows that it is possible to create concrete with different density and strength, so-called “gradient-concrete” [
18,
19,
20]. Gradient concrete is also a main content in this publication. If gradient concrete appears to be a good solution in construction engineering, affordable methods to produce gradient concrete in precast or even in in situ concrete are going to be developed. Currently 3D concrete printers are under development [
18,
21,
22,
23,
24,
25,
26,
27]. Not only can density be varied along the cross-section, but also other concrete properties, for example gradual durability, are possible as well.
To analyze the complex behavior of gradient concrete during hardening, numerical models are required. It is possible to model the complex interactions in hardening concrete using numerical material models and finite element analysis. There are already models which are capable of very detailed simulation of the behavior of the concrete [
28,
29,
30,
31,
32]. These so-called “hygro-thermo-chemo-mechanical-models” consider moisture transport, chemical processes, temperature evolution and mechanical aspects including creep and shrinkage.
This paper presents a numerical study on the application of optimized concrete base materials in a prismatic mass concrete structural element. In this element, durable concrete is necessary near the surface and the requirement of low hydration energy is located in the center of the member. For this purpose, either a zoned distribution or a gradient material distribution in the cross-section could be used to have different materials in the cross-section. Finite element analyses using a simplified material model investigates the effect of a gradient concrete material distribution in a prismatic mass concrete structure showing that gradient concrete can contribute to lower the constraint stresses and therefore crack risk during concrete hardening.
The paper investigates the effect of gradual distributed and zoned concrete with respect to homogeneous concrete properties, highlighting crack reduction. The practical application of the gradient concrete is not covered in this article. There are two main research questions:
In this article, thermal stresses are calculated in young hardening mass concrete. Although there are already models in the literature (e.g., [
28,
29,
30,
31,
32]) that are capable of detailed simulation of the concrete behavior, a simplified approach is used. Thermal and some mechanical (stiffness, Poisson-ratio, strength) aspects were considered in the present calculations, whereas the effect of moisture transport, creep and shrinkage is neglected in this study. These simplifications are made to keep the testing and modeling effort low in the phase of a preliminary study for this type of gradient concrete. Most of the neglected parameters (shrinkage humidity) are constant in a wide range of a mass concrete section. Especially if thin members of high-performance concrete are used, these effects are no longer negligible and should be tested and considered for all relevant mixing states. The concrete used in the calculation is gradient concrete in terms of hydration energy, modulus of elasticity, tensile strength and durability. The results are compared to a calculation with the same geometry but either homogeneous or zoned material properties.
2. Finite Element Model and Material Properties Used in Analysis (Materials and Methods)
2.1. Finite Element Model
The analysis was carried out using the commercial Finite Element Software ABAQUS/Standard. A coupled thermo-mechanical solving procedure was used in which the thermal energy generation and the strain as well as stress development depending on the current material evolution are solved in the same time increment. As mentioned in the introduction there are already models which are capable of very detailed simulation of the behavior of the concrete [
28,
29,
30,
31,
32]. The influence of moisture content, creep, shrinkage and other nonlinear material behavior is of course relevant, but leads to much higher testing and modeling effort especially if different mixing states of gradient concrete are considered. The aim was to show if there is an effect on crack risk by using zoned or gradient mass concrete. In mass concrete some of these properties may be assumed constant in a wide range of the cross-section. For this reason, a simplified approach is used in this publication. If the aim is to calculate cracks, crack width or crack propagation, these simplifications may not be applicable.
The chosen time increment for the calculation was 30 min during the first five days and four hours for the remaining nine days.
2.1.1. Geometry and Elements
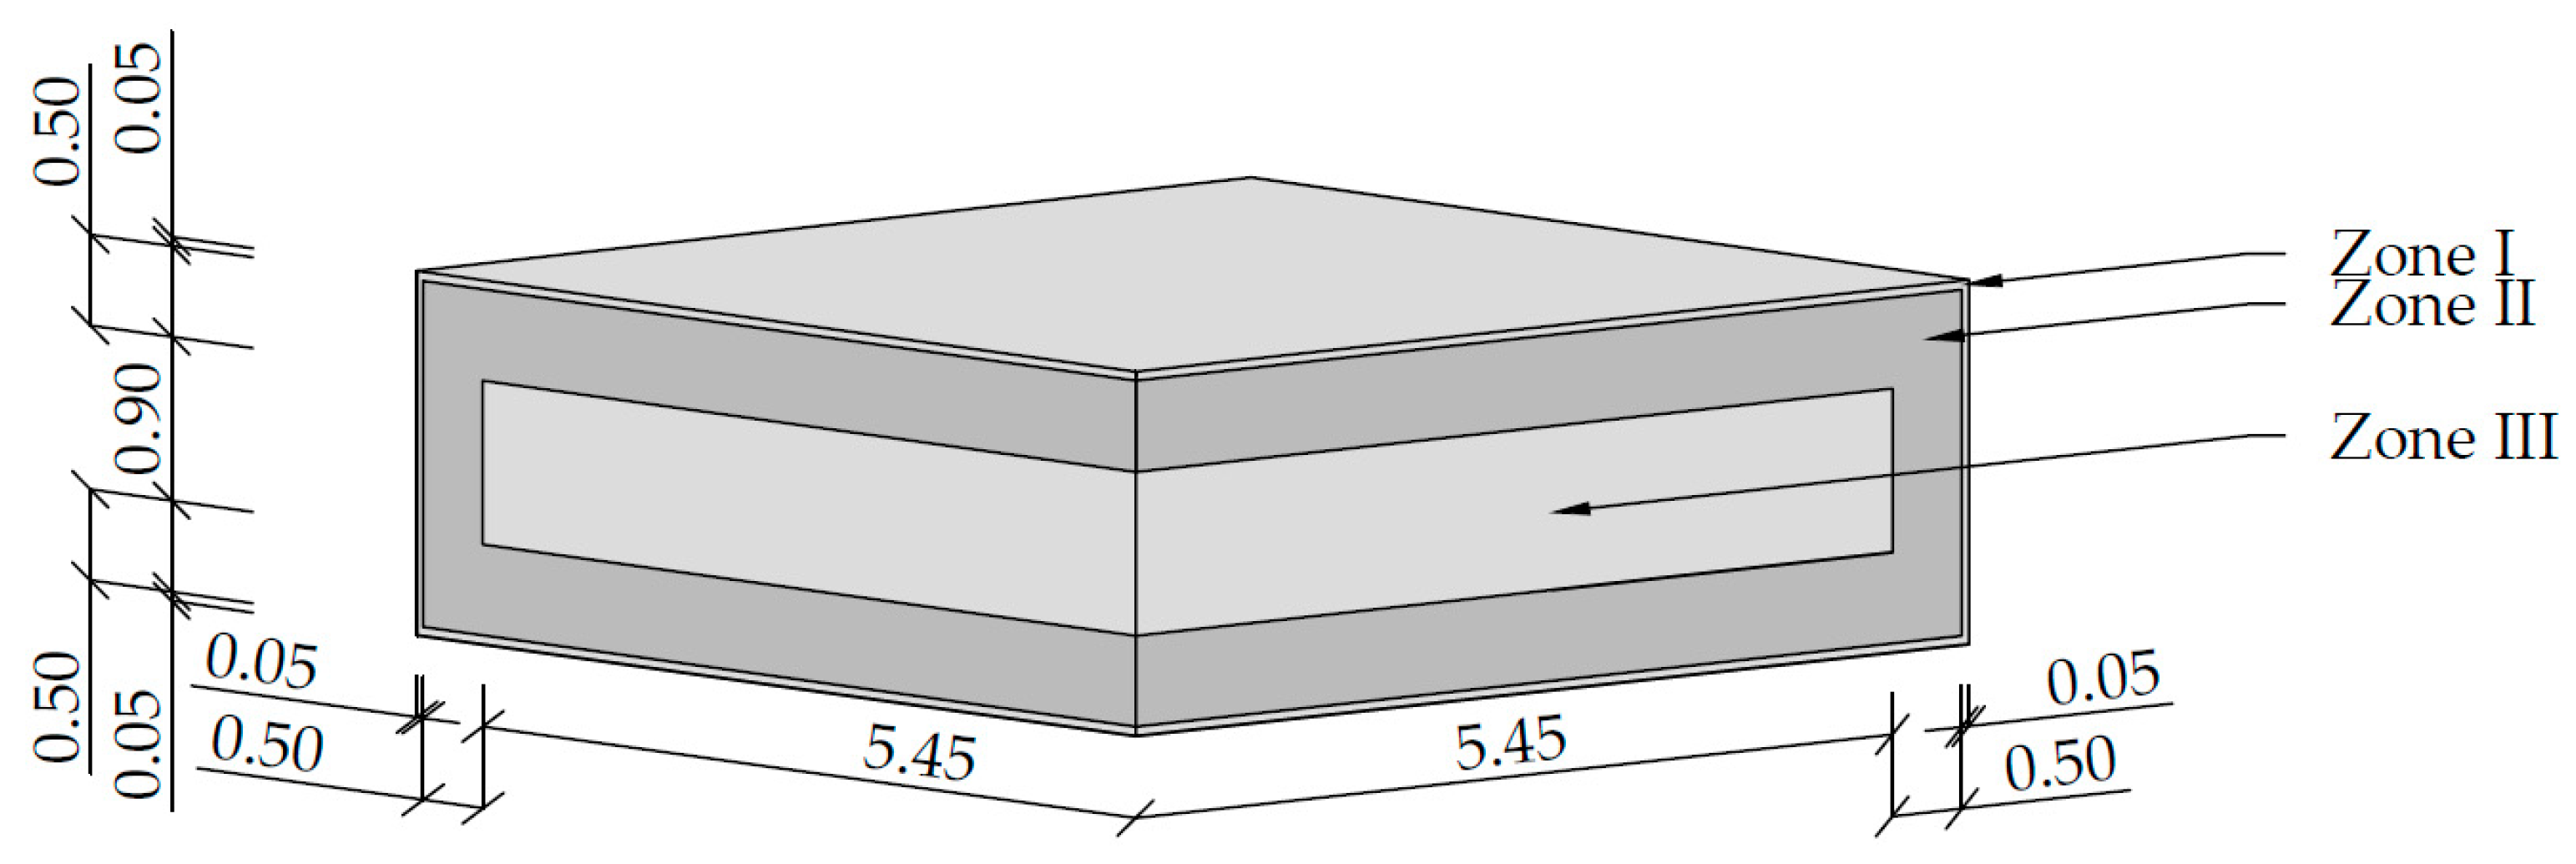
The geometry is a rectangular concrete prism with a side length of 12 m × 12 m and a height of 2 m which hardens inside the formwork (3 cm wood) on a subsoil layer with a geometry of 24 m × 24 m and 2 m thickness. The geometry of this mass concrete block is chosen based on former research questions on foundations of torrent control barriers [
33]. For symmetry reasons one quarter of the prism (geometry: 6 m × 6 m × 2 m) is modeled. The concrete and the soil are modeled with solid continuum elements with 8 nodes, trilinear displacement degrees of freedom and one temperature degree of freedom. For the formwork, shell elements are used. The mesh and the geometry used in the FE-Model can be seen in
Figure 1. Every concrete zone is modeled with at least 3 elements in thickness. The number of elements in the concrete block is 21,888 and the number of nodes in the concrete block is 24,375. The total number of elements in the model including internal generated elements (contact) is 26,551 and the number of nodes including internal generated nodes (contact) is 33,179.
2.1.2. Thermal Boundaries
The heat flux from the concrete to the subsoil and inside the subsoil is modeled. The initial temperature in the soil is also assumed to be 10 °C. To account for the energy loss at the bottom of the modeled soil a thermal boundary (10 °C) is set. This temperature is an estimation of a mean value in 2 m depth. The heat emission of the concrete to the air is modeled as surface behavior. To account for the thermal insulation capability of the formwork, the heat transfer coefficient is set to 5.5 W/m
2/K [
34]. The heat transfer coefficient is changed at the time of removal of the formwork to 25.5 W/m
2/K [
34] to account for the changing in loss of thermal energy. The ambient temperature with day and night fluctuations was simulated using a sinus function. The mean value is assumed to be 20 °C and the amplitude is 10 °C.
2.1.3. Mechanical Boundaries
The dead load of the concrete is considered using the density of the concrete and gravity. This is done to superpose the stress state of dead load and hydration caused constraint stress. The vertical displacement of the bottom of the modeled subsoil is inhibited, therefore only the deformation of the upper ground layer is modeled. The model is a quarter model with two symmetry boundaries to reduce modeling costs. The formwork is used in the model only for mechanical reasons to form the concrete during the time when modulus of elasticity is low but dead load of the concrete is applied. The contact between formwork and concrete is eliminated when the formwork is stripped.
2.1.4. Temperature Evolution (Thermo-Chemical Model)
The thermal energy transfer inside the material is calculated using the Abaqus user subroutine UMATHT [
35], which assumes Fourier’s law for heat transfer. The differential form is given in Equation (1):
q … vector of local heat flux density, J s−1 m−2
λ … thermal conductivity, J s−1 m−1 K−1
∇T … temperature gradient, K m−1
The internal thermal field [
35] is therefore calculated by solving the thermal energy balance Equation (2):
λ … thermal conductivity, J s−1 m−1 K−1
T … temperature, K
Q … thermal energy released in hydration, J m−3
dt … time increment, s
ρ … density, kg m−3
c … specific heat capacity, J kg−1 K−1
The thermal energy release during hydration is calculated using the effective reaction time approach [
36] to account for temperature depending reaction rates. See Equation (3)
teff … effective reaction time, s
A … temperature depended activation energy, J mol−1
R … gas constant, J mol−1 K−1
dt … time increment, s
Where the activation energy is calculated according to Equation (4):
EA: base value of activation energy, J mol−1
The thermal energy release is calculated using an empirical modified approach of [
37] as can be seen in Equation (5):
Q∞ … total hydration energy of the cement, J m−3
c … amount of cement in the mix, kg m−3
τe … fitting parameter, s
α: fitting parameter, -
2.2. Material Properties
2.2.1. Material Distributions
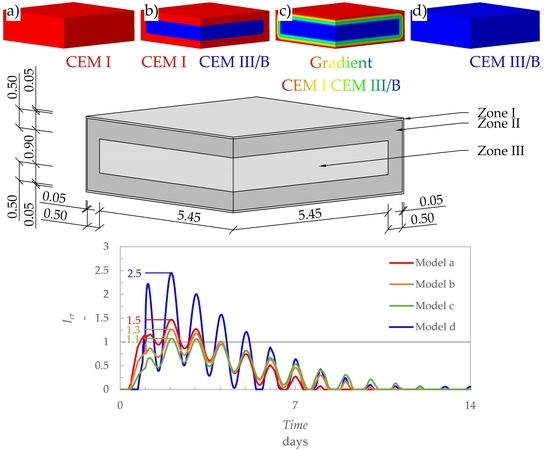
There are four simulations carried out with different material distributions. The first distribution (a) is using homogeneous concrete for the whole cross-section (Zones I, II and III in
Figure 2); that meets all the requirements for durability. The second simulation model (b) uses a distribution with two zones of durable concrete in the surface layer region (Zone I + II in
Figure 2) and a low hydration energy core concrete in the center (Zone III in
Figure 2). In the third model (c) in between of core and surface layer, there is a gradient area (Zone II in
Figure 2) where the surface layer of concrete and the core concrete are merged into each other. The thickness of Zone II was chosen with respect to an estimated relevant depth of freeze-thaw cycles of 0.5 m, which is not examined in detail in this publication. The fourth model is using the low hydration energy core concrete for the whole cross-section (Zones I, II and III in
Figure 2). The material distributions in the models (a, b, c, d) can be seen in
Figure 3.
2.2.2. Time Dependency of the Material Properties
In young hardening concrete the material properties depend on the degree of hydration. The progress of hydration is calculated considering the temperature-dependent reaction rate using the concept of effective time as described in
Section 2.1.4 (or also [
13]). Due to the gradient mixture of the concrete the material properties vary over space even if the temperature is constant. Therefore in this simulation the value of a material property in every point of the structure at a determined time is dependent on the mixture of the concrete and its degree of hydration at this point. In particular, the following material properties are calculated depending on the degree of hydration:
Other material parameters (for example thermal capacity, concrete density) are assumed to be constant during hydration, even if they might vary in reality.
2.2.3. Requirements for Durable Strong Surface Layer Concrete
The surface of the concrete is exposed to freeze and thaw attack as well as carbonation. For high water saturation without de-icing agent exposure class XF3 applies according to EN 206 [
2]. For cyclic wet and dry concrete XC4 applies. EN 206 [
2] distinguishes between designed concrete and prescribed concrete. Although the concept of gradient concrete is better suited to the background of designed concrete, the material properties for the durable surface layer concrete are chosen in accordance to the recommendation for limiting values of concrete in EN 206, Annex F as shown in
Table 1.
To fulfill the requirements for the exposure classes the minimum cement content is 320 kg/m3 and the maximum w/c-ratio is 0.5.
The surface layer requires a high durability. In a performance-based design concept, the aim is to predict the carbonation depth in concrete depending on the concrete age. One concept that is based on experimental observations and theoretically derived by diffusion theory can be found in the literature [
4,
5,
6,
39]. In this theory, carbon dioxide is diffused into concrete and reacts with non-carbonated calcium minerals in the concrete at the “moving carbonation boundary”. That boundary is at a certain distance from the concrete surface. If the carbon dioxide content between the concrete surface and the moving boundary is assumed to be linear the flux can be described using a diffusion law [
39], as shown in Equation (6):
J … flux of CO2 into the concrete, kg m−2 s−1
D … diffusion coefficient (CO2), m2 s−1
Δc … difference in CO2 content between the concrete surface and the moving boundary, kg(CO2) m−3
xca … distance of the moving carbonation boundary from the concrete surface, m
The carbon dioxide flux into concrete is balanced with the rate of mass growth of the bound CO
2, as shown in Equation (7):
J … flux of CO2 into the concrete, kg m−2 s−1
a … CO2 binding capacity of the concrete, g(CO2) m−3
t … time, s
Carbonation depth
xca is assumed zero at time zero. Combining Equations (6) and (7) and integrating over time, the following solution is obtained, see Equation (8):
For constant conditions and constant material properties the depth of carbonation is therefore proportional to the square root of time. The units are changed to millimeters and years to be in a practical range of values, as can be seen in Equation (9):
To account for environmental conditions (humidity, CO
2 concentration, curing, wetting effects) additional factors are applied in [
4,
5,
6].
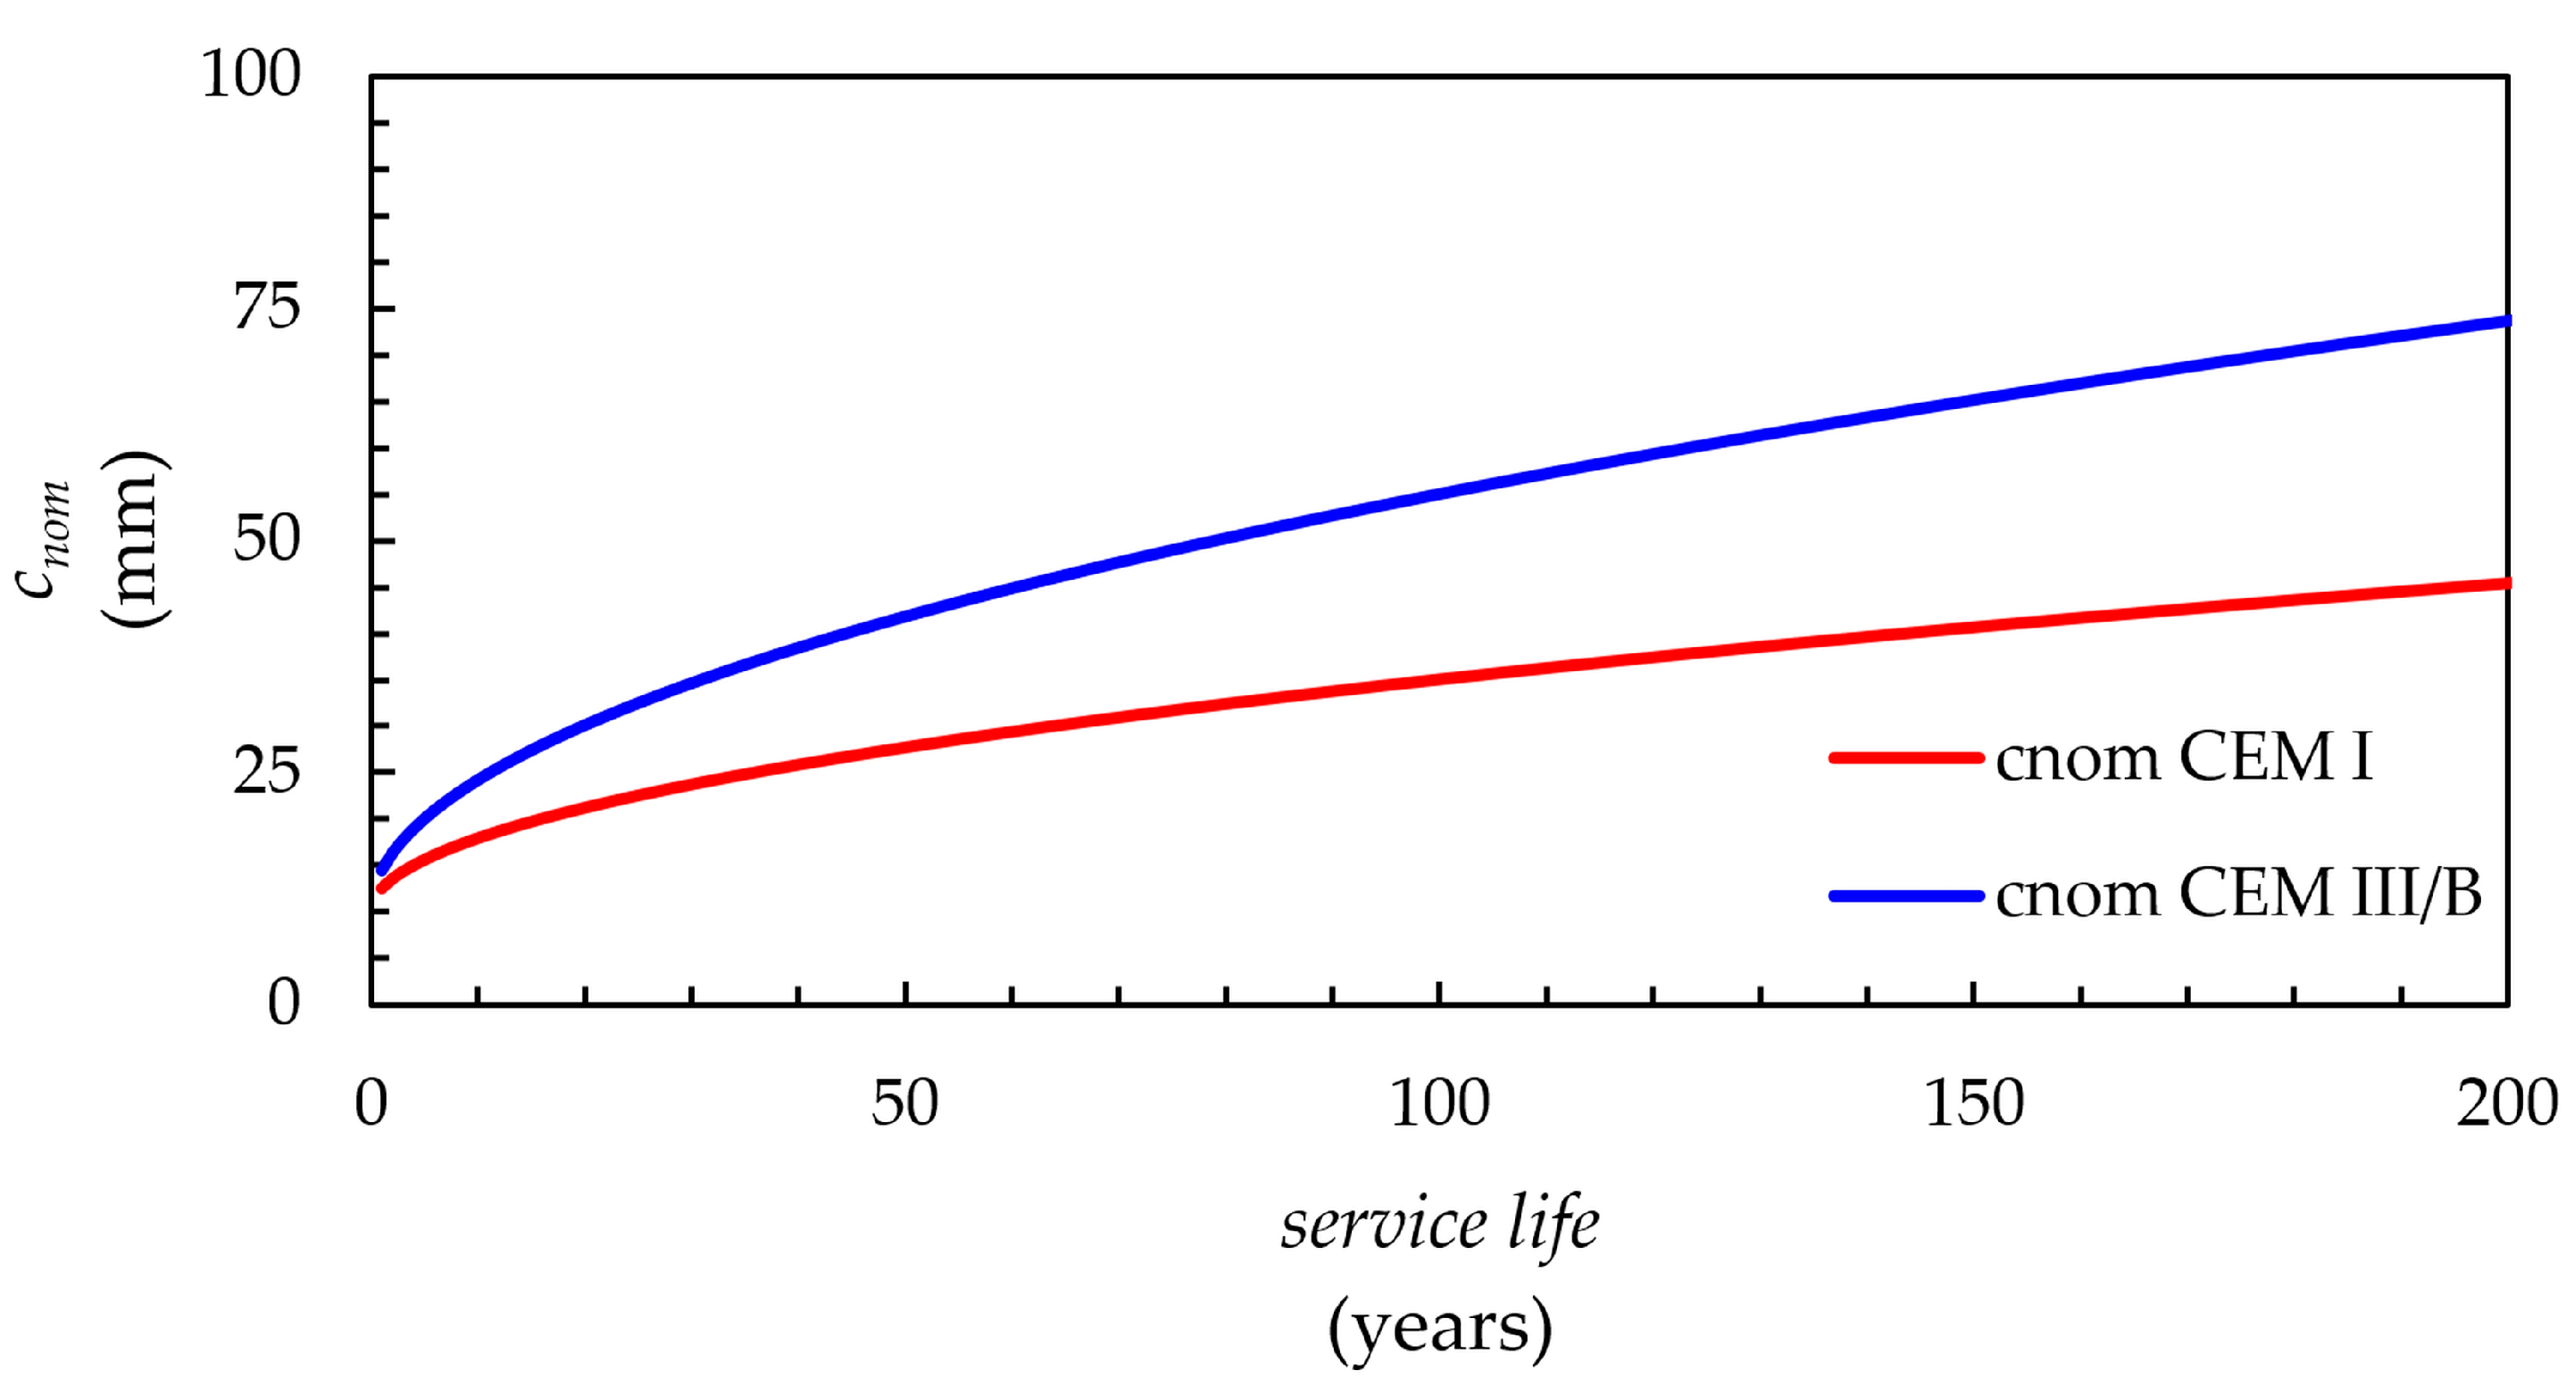
According to [
4,
5,
6] the performance-based resistance to carbonation is highly dependent on the cement type. Cement CEM I (high hydration energy) has good carbonation resistance while CEM III (low hydration energy) has a poor one. The nominal concrete cover of a structure with a service life of 150 years made of concrete with w/c ratio = 0.5 varies from 40 mm if CEM I is used to 65 mm if CEM III/B is used, as can be seen in
Figure 4. The curves are calculated assuming a carbonation rate for CEM I of
kNAC = 2.5 mm/year
0.5 and a carbonation rate for CEM III/B of
kNAC = 4.5 mm/year
0.5. Additionally, an execution tolerance of
Δc = 10 mm, according to [
4,
5,
6] and standard test conditions (
ke =
ka =
kc =
W(
t) = 1) for carbonation rate were assumed. The following equation (10) was used:
cnom … nominal concrete cover, mm
Δc … permitted tolerance, mm
kNAC … carbonation rate under natural conditions (std. test conditions), mm year −0.5
t … service life, a
ke … factor to account for relative humidity
ka … factor to account for CO2 concentration
kc … factor to account for curing/execution
W(t) … factor to account for wetting events
γf … partial safety factor
A thick concrete cover is not desirable if cracking due to thermal constraint is expected because the required reinforcement to control cracks increases with higher concrete cover due to the changing inner lever arm between concrete and reinforcement [
40]. Therefore a high durable concrete with the side effect of high hydration energy containing the cement CEM I is used in the surface layer region.
2.2.4. Requirements for Low Hydration Energy Core Concrete
The concrete in the core has different requirements to the concrete on the surface. The number of freeze-thaw cycles in the concrete decreases from the surface to the center, therefore the necessary freeze-thaw resistance decreases. The prevention of concrete carbonation is relevant to the concrete cover, since carbonation starts on the outer surface and leads to carbonate-induced corrosion of the reinforcement. If the carbonation front reaches the first reinforcement layer, actions must be taken. There is no need for concrete with high resistance to carbonation below the reinforcement. Therefore, the core of the concrete does not need to fulfill the criteria for the exposure classes XF3 and XC4.
The thermal energy released during cement hydration is dependent on the cement content, the type of cement and its grinding fineness. Hence choosing a cement with low heat generation or the use of additions with latent hydraulic activity (type II according to [
2]) are possibilities to reduce the hydration energy [
13,
14,
15]. A cement with low hydration energy (CEM III/B) is chosen for the core concrete. CEM III/B consists of 20–34% clinker and 66–80% blast-furnace slag. The durability requirements in the core do not have as high requirements on cement content and the maximum w/c ratio. In mass concrete, the released thermal energy of the concrete is a major problem causing restraining stresses in the concrete and leading to crack formation. From a durability point of view, the cement content could be lower than in the exposed surface layer. In a mass concrete member the function of the concrete in the core is mainly the mass of the concrete and to a certain degree the concrete stiffness and its compressive strength. If the cement content in the core is reduced and w/c ratio is kept constant the water content might be too low to produce a processable concrete. Because of a decreased requirement of durability in the concrete core, the w/c ratio could be increased. A change of the w/c ratio should consider the relevant consequences (for example on the concrete compressive strength or on shrinkage). The consistence class depends mainly on the cement content and in the admixture of concrete plasticizer, if the w/c ratio is limited. The main defined material properties for the concrete in the core are displayed in
Table 2. The requirements of concrete compressive strength in core zones of mass concrete structures are often rather low (C25/30 to C30/37 according to [
41,
42]) in relation to common required concrete compressive strengths reached by durability criteria (C40/50 and higher).
2.2.5. Used Material Properties
Material properties as well as the time dependency of selected material properties of the surface layer and core concrete are based on test results [
13,
33,
37,
43,
44,
45]. The mixtures used in the simulation are presented in
Table 3. The spatial distribution of the material properties in the gradient zone (Model c) of the concrete are linearly interpolated between the properties of the surface layer and core concrete according to the distribution of the mixture as displayed in
Figure 3c. The gradient material must connect two different materials bridging all different material properties such as thermal heat generation, elastic modulus, tensile and compressive strength, thermal capacity, thermal conductivity and thermal expansion. The linear interpolation between the two materials might not be correct for all properties. This simplification is made to keep the testing effort low. For a more precise prediction, tests with mixed material states should be carried out and also creep, shrinkage and moisture transport in the concrete should be considered.
The thermal energy release during hydration was measured in an adiabatic concrete calorimetry for one cement content and a function was fitted as described in [
13]. For the lower cement content, the maximum thermal energy release is scaled depending on the cement content. To account for the different reaction rate caused by different cement content the Arrhenius equation is applied. The calculated adiabatic temperature rise for the concrete types used in the calculation are displayed in
Figure 5. The reaction rate depends also on the available water content in the concrete composition. To avoid modeling gradual water availability in the gradient area the available water content is assumed to be equal in all concrete mixtures used in the calculation. If concrete types with different water content, cement types or reaction behavior are mixed, this should be considered appropriately in the model.
The hydration-based states of the material properties are calculated in the FE analysis. The time dependencies of stiffness and strength (tensile and compressive) are calculated using a modification of the equation described in [
46], see Equation (11):
E(teff) … elastic modulus depending on effective time, N/mm2
E∞ … elastic modulus at end of hydration, N/mm2
τ … fitting parameter, h
α … fitting parameter, -
tsolidify … time of solidification, h
In literature, the Poisson ratio is often assumed to be constant. In the used model a nonlinear development of the Poisson ratio is considered. The Poisson ratio does not just increase over time. The fresh concrete has a Poisson ratio about 0.5; in the end the Poisson ratio is about 0.2. As described in [
47], the Poisson ratio decreases in the first phase and increases in a second phase and is therefore described with a different model than elastic models as can be seen in Equation (12):
ν(teff) … Poisson ratio depending on effective time, -
Q(teff) … thermal energy release depending on effective time, J
Q∞ … thermal energy release at end of hydration, J
The development of the thermal conductivity is assumed to develop linearly depending on the degree of hydration. Due to the temperature-dependent reaction rate (concept of effective time), the linear evolving material properties also do not develop linear over real time.
Table 4 summarizes material properties for the limiting values of the gradient concrete (surface layer and core concrete).
3. Results
As described in
Section 2.2, four different material distributions were analyzed.
These distributions as depicted in
Figure 2 are:
- (1)
homogeneous durable concrete (a)
- (2)
two zones, durable concrete in the surface layer and low hydration energy concrete in the center (b)
- (3)
three zones; gradient concrete in between the surface layer and the core (c)
- (4)
homogeneous low hydration energy concrete (d)
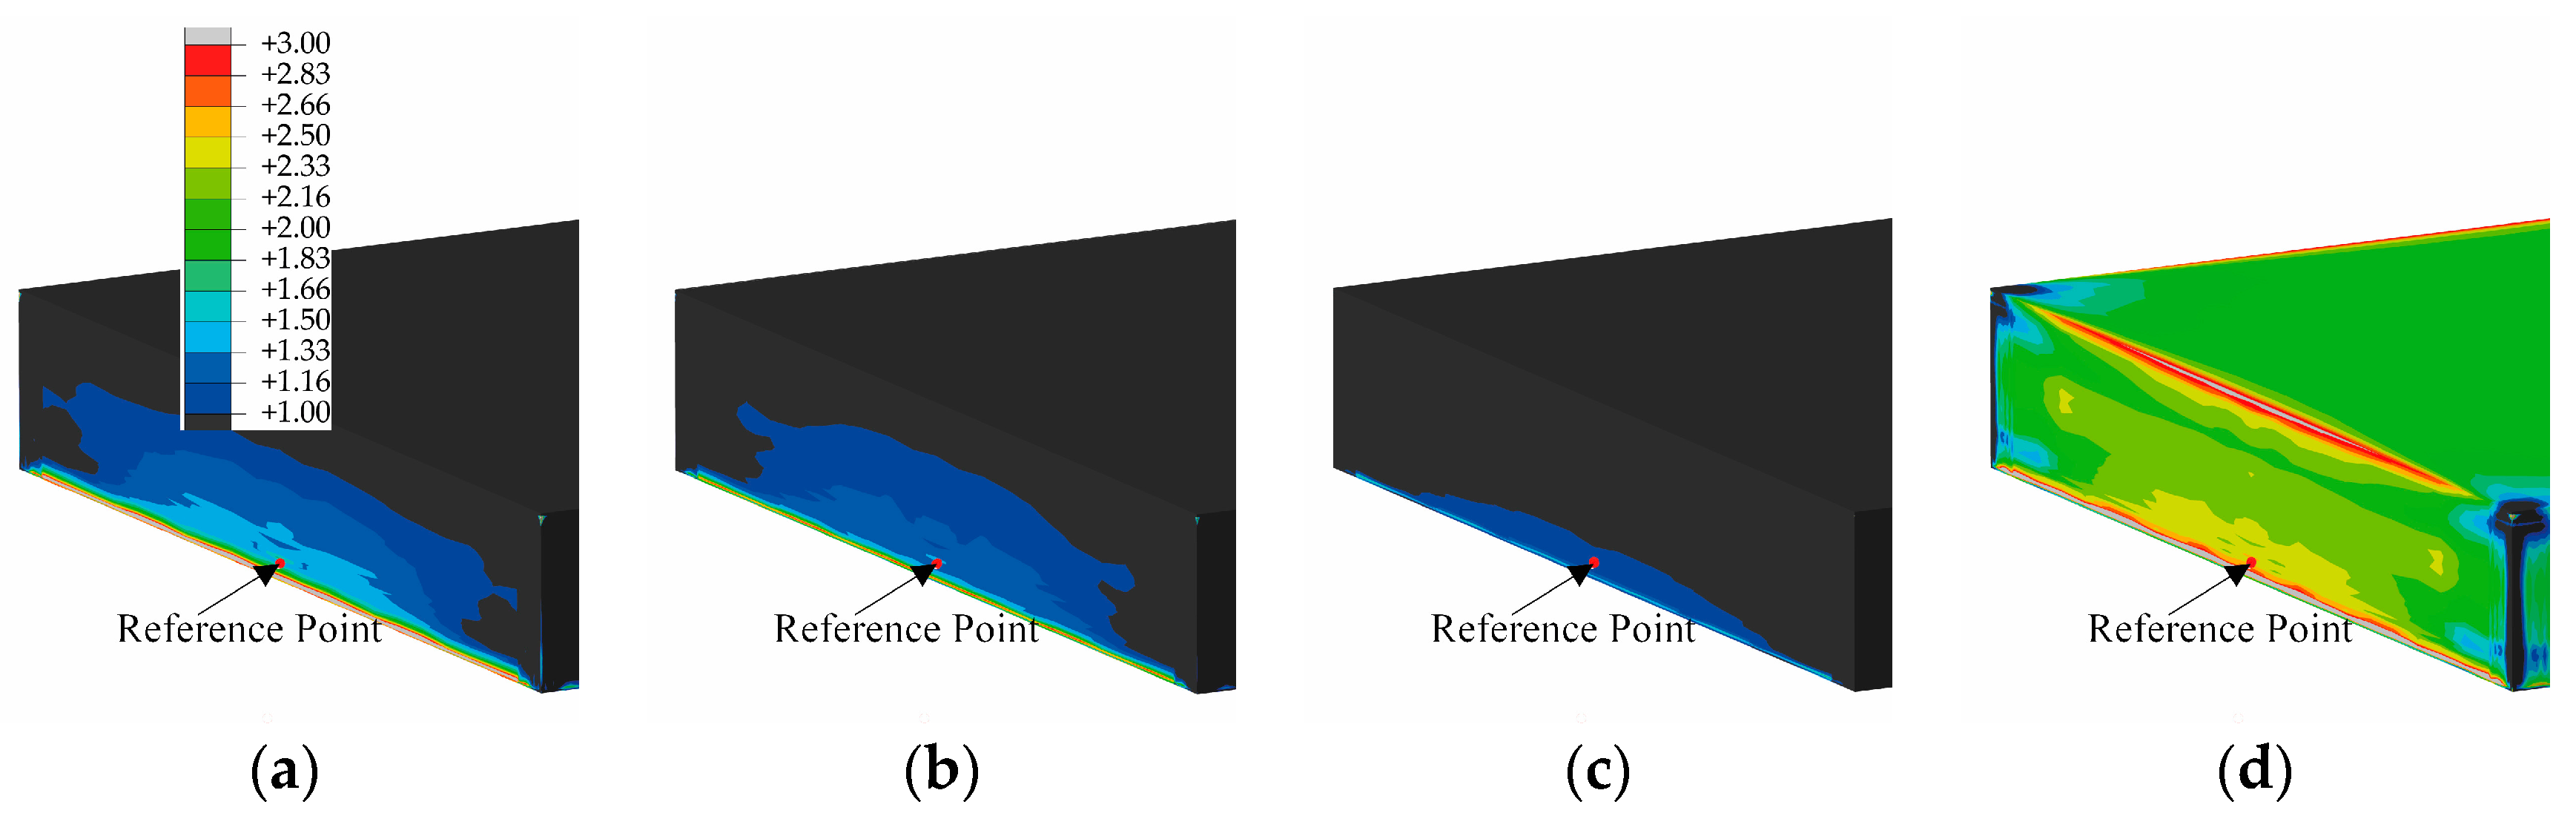
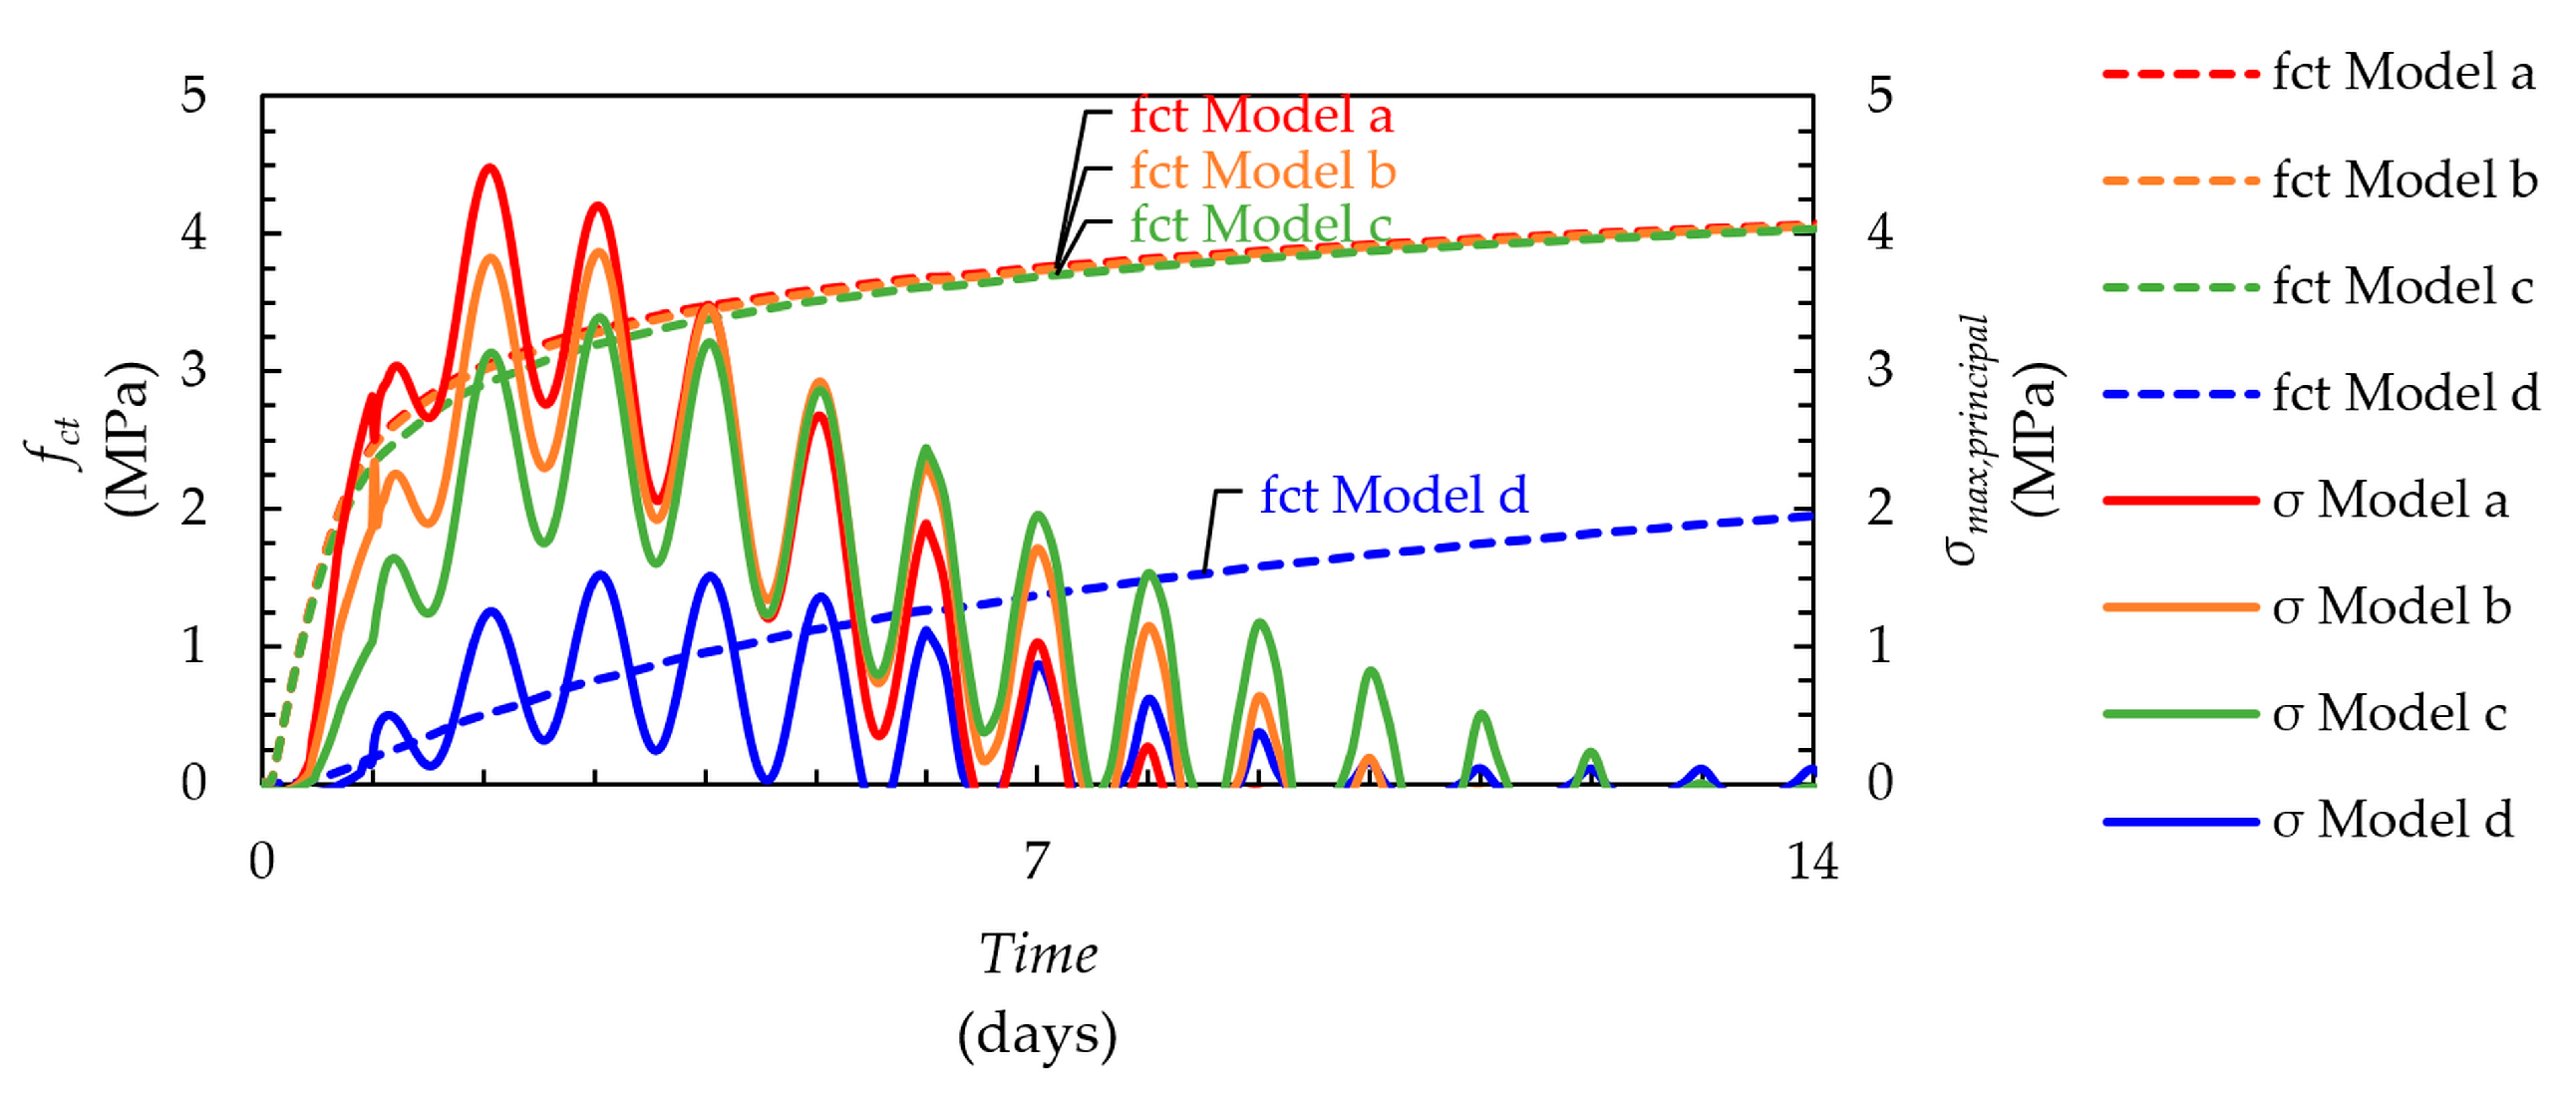
The evolution of the tensile strength and the stresses in the cross-section are calculated in every time step of the calculation. If the tensile strength is lower than the tensile stress cracks are likely. To display the risk of cracking the crack index is calculated, see Equation (13):
The maximum crack index of the different material distributions is displayed in
Figure 6. The calculations show that the critical area for cracking is at the bottom center of the side of the concrete block. For a chosen critical point at the side (Reference Point
Figure 6) of the member, the time development of the tensile strength and tensile stress is printed over time in
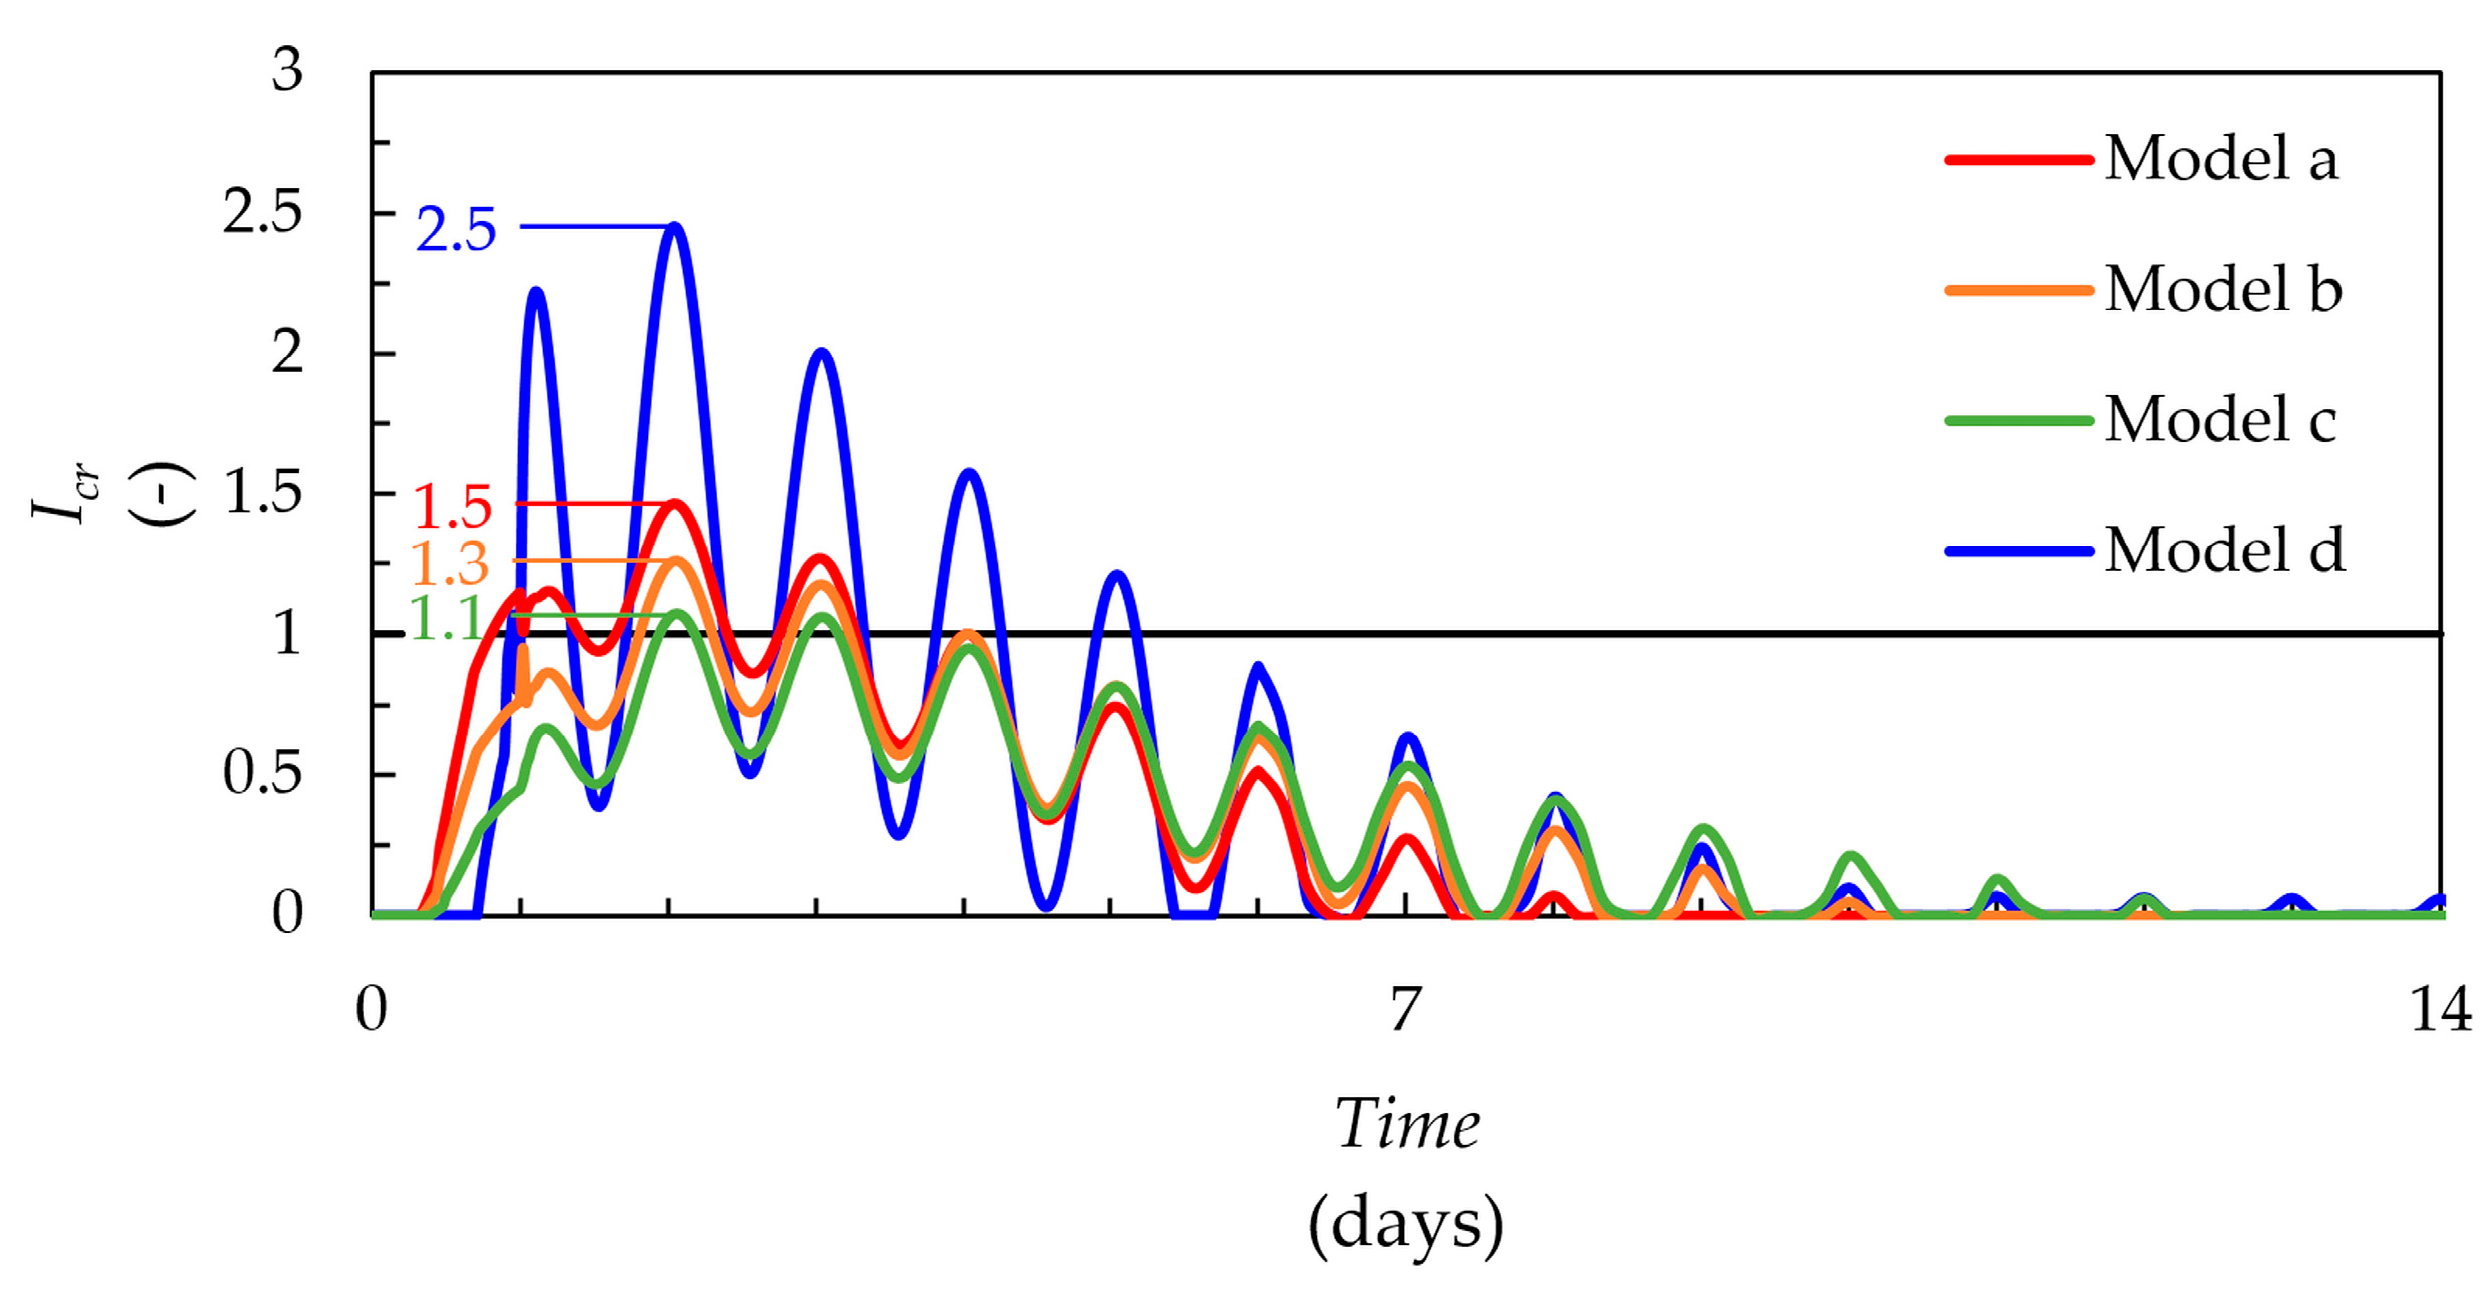
Figure 7. The amplitude of the tensile stress at the concrete surface is caused by temperature change between day and night. To compare the crack tendency of the different mixtures the crack index is shown in
Figure 8. The discontinuity in the development at day 1 is caused by the removal of the formwork.
As can be seen from the resulting curves, the risk of cracking is highest in model (
d). In this model the whole part consists of hydration energy optimized concrete. The high crack risk is caused by the slow evolution of the tensile strength in this concrete. Tensile stresses in the first five days exceed the tensile strength of the concrete. The slow evolution of tensile strength might be an interesting aspect if crack width should be controlled because a reduced value for the tensile strength
fct,eff can be used, which leads to lower crack controlling reinforcement (see also [
48,
49]). The good characteristics to control cracks are abolished if a performance-based approach for concrete cover is applied, since the increasing thickness of the concrete cover leads to higher crack-controlling reinforcement.
The second-highest risk to obtain cracks appears if homogeneous durability optimized concrete (a) is used.
The zoned material property distribution (b) achieves results with lower crack risk than the homogeneous durable concrete. This is caused by the lower thermal-induced constraint stresses in the member. For concrete members exposed to carbonation the area where durable concrete is needed starts at the concrete surface and ends at the reinforcement. For concrete exposed to freeze-thaw attacks the durable concrete is needed also below the reinforcement. Since the number of freeze-thaw cycles decreases from the surface to the center in a certain distance from the surface the hydration-optimized concrete has a high enough resistance against freeze-thaw. The border of the two zones can be determined with the expected number of freeze-thaw cycles. Zoned concrete seems to be a good solution for concrete exposed to carbonation. High carbonation-resistant concrete could be used for the concrete cover and the outer reinforcement layers, whereas other material properties can be optimized in the layers below the reinforcement.
The member with the gradient material (c), which is most difficult to manufacture, achieves the lowest crack risk whereas the durability of the surface layer region of the member is prepared to withstand carbonation and freeze-thaw attack better than the homogeneous low hydration energy concrete member. If the concrete is exposed to freeze-thaw attacks the durability requirements decrease from the surface to the center of the member. The gradient in proposed freeze-thaw cycles can be taken as the basis for the material gradient. In the model, the applied gradient was defined as diverging from the expected freeze-thaw cycles and also at the bottom next to the soil a gradient was applied even if there is no increase in freeze-thaw cycles. Gradient concrete seems to be a solution for members exposed to freeze-thaw cycles.
Due to the lower crack risk in models (b,c) a lower reinforcement content is needed in these models than in the homogeneous models (a,d). For optimized material distributions and boundary conditions, it is for example conceivable to construct without crack width controlling reinforcement.
4. Summary
This preliminary study presented the effect of zoned and gradual distributed concrete properties in contrast to homogeneous concrete properties on the basis of a simplified non-linear FE calculations.
First, the requirements for inhomogeneous concrete properties inside a mass concrete structure to create durable and low hydration energy concrete parts are pointed out.
Second, the used FE model (mesh, thermal and mechanical boundaries as well as the used material model) is characterized. The material distributions used in the model are presented and the chosen material parameters, which fulfill the requirements for the intended zone, are shown.
Third, the results from the different models are shown. The calculations show that a smart spatial combination of different concrete mixture distributions has a positive effect on the crack risk of the concrete. The internal constraint caused by hydration can be minimized while the durability of the part can be maximized. Concrete consisting of durable concrete cover with low crack risk and therefore durable reinforcement is possible. The material distribution can be adjusted to the requirements of every part of a concrete member.
The present calculations show a tendency that zoned or gradient material in concrete construction could be an opportunity to optimize concrete constructions. This preliminary study is intended as a contribution for a competitive and sustainable future in concrete building engineering.
Acknowledgments
This research was a private pleasure that was induced after working on a research project and carried out without any financial support. Thanks to Luca Paterno, Beton Lana GmbH (Rohrdorfer Gruppe) for the aggregates, to Reinhard Oberlohr, Schretter and CIE GmbH and Co. KG for the cement and BASF Performance Products GmbH for providing admixture. Thanks to Christoph Aigner, Norbert Hemetsberger, Theresa Reimoser, Matthias Rigler, Lisa Rösler and Josef Schorn for helping to analyze additional material data in the laboratory. Special thanks to the head of the laboratory of the institute Oliver Zeman.
Author Contributions
Emanuel Strieder, Raimund Hilber and Elisabeth Stierschneider conceived the designed calculations, Emanuel Strieder analyzed the data and wrote the paper; Raimund Hilber, Elisabeth Stierschneider Konrad Bergmeister edited and audited the content.
Conflicts of Interest
The founding sponsors had no role in the design of the study; in the collection, analysis, or interpretation of data; in the writing of the manuscript and in the decision to publish the results. The authors declare no conflict of interest.
References
- Bergmeister, K. Brenner Basistunnel im Bau. Tunnel. 2012, 1, 18–30. [Google Scholar]
- EN 206:2017, Beton—Festlegung, Eigenschaften, Herstellung und Konformität; Beuth: Berlin, Germany, 2017.
- Braasch, T.; Buschmeyer, W. Verbesserte Dauerhaftigkeit: Kontrolle der frühen Rißbildung. Beton Stahlbetonbau 2006, 101, 858–862. [Google Scholar] [CrossRef]
- Von Greve-Dierfeld, S.; Gehlen, C. Performance based durability design, carbonation part 1—Benchmarking of European present design rules. Struct. Concr. 2016, 17, 309–328. [Google Scholar] [CrossRef]
- Von Greve-Dierfeld, S.; Gehlen, C. Performance-based durability design, carbonation part 2—Classification of concrete. Struct. Concr. 2016, 17, 523–532. [Google Scholar] [CrossRef]
- Von Greve-Dierfeld, S.; Gehlen, C. Performance-based durability design, carbonation, part 3: PSF approach and a proposal for the revision of deemed-to-satisfy rules. Struct. Concr. 2016, 17, 718–728. [Google Scholar] [CrossRef]
- Bödefeld, J.; Ehmann, R.; Schlicke, D.; Tue, N.V. Mindestbewehrung zur Begrenzung der Rissbreiten in Stahlbetonbauteilen infolge des Hydratationsprozesses. Beton Stahlbetonbau 2012, 107, 32–37. [Google Scholar] [CrossRef]
- Schlicke, D.; Tue, N.V. Minimum reinforcement for crack width control in restrained concrete members considering the deformation compatibility. Struct. Concr. 2015, 16, 221–232. [Google Scholar] [CrossRef]
- Schlicke, D.; Tue, N.V. Consideration of Viscoelasticity in Time Step FEM-Based Restraint Analyses of Hardening Concrete. J. Mod. Phys. 2013, 4, 9–14. [Google Scholar] [CrossRef]
- BAW. Rissmechanik in dicken Stahlbetonbauteilen bei abfließender Hydratationswärme. Mitteilungsblatt Bundesanst. Wasserbau. Available online: https://izw.baw.de/publikationen/mitteilungsblaetter/0/Mitteilungsblatt_Nr_92_April_2010-1.pdf (accessed on 1 April 2010).
- Rostásy, F.S.; Henning, W. Zwang und Rißbildung in Wänden auf Fundamenten; Deutscher Ausschuß für Stahlbeton 407; Beuth: Berlin, Germany, 1990; ISBN 3-410-65607-3. [Google Scholar]
- Strieder, E.; Hilber, R.; Bergmeister, K. Untersuchung zur Rissentwicklung im Massenbeton. Beton Stahlbetonbau 2017, 3, 178–186. [Google Scholar] [CrossRef]
- Strieder, E.; Hilber, R.; Murr, R.; Bergmeister, K. Entwicklung der Materialeigenschaften im jungen Massenbeton. Beton Stahlbetonbau 2017, 1, 41–49. [Google Scholar] [CrossRef]
- Akkermann, J.; Weiler, S. Risse in Fundamenten von Onshore-Windenergieanlagen. Beton Stahlbetonbau 2017, 112, 2–11. [Google Scholar] [CrossRef]
- Batog, M.; Giergiczny, Z. Influence of mass concrete constituents on its properties. Constr. Build. Mater. 2017, 146, 221–230. [Google Scholar] [CrossRef]
- Rankoth, C.K.; Hosoda, A.; Iwama, K. Modeling and Verification of Early Age Thermal Stress in Second Lining Concrete of NATM Tunnels. J. Adv. Concr. Technol. 2017, 15, 213–226. [Google Scholar] [CrossRef]
- Westendarp, A. Entwicklungen und Tendenzen bei Baustoffen und Bauausführung im Schleusenbau. In Hüttensandhaltiger Zement, Verkehrsbau Wasserbau Kanalisation; Bau + Technik: Düsseldorf, Germany, 2002; pp. 107–112. ISBN 3-7640-0426-6. [Google Scholar]
- Wörner, M.; Schmeer, D.; Schuler, B.; Pfinder, J.; Garrecht, H.; Sawodny, O.; Sobek, W. Gradientenbetontechnologie: Von der Mischungsentwicklung über den Bauteilentwurf bis zur automatisierten Herstellung. Beton Stahlbetonbau 2016, 111, 794–805. [Google Scholar] [CrossRef]
- Herrmann, M.; Sobek, W. Gradientenbeton—Numerische Entwurfsmethoden und experimentelle Untersuchung gewichtsoptimierter Bauteile. Beton Stahlbetonbau 2015, 110, 672–686. [Google Scholar] [CrossRef]
- Herrmann, M.; Sobek, W. Functionally graded concrete: Numerical design methods and experimental tests of mass-optimized structural components. Struct. Concr. 2017, 18, 54–66. [Google Scholar] [CrossRef]
- Schach, R.; Krause, M.; Näther, M.; Nerella, V.N. CONPrint3D: Beton-3D-Druck als Ersatz für den Mauerwerksbau. Bauingenieur 2017, 92, 355–363. [Google Scholar]
- Duballet, R.; Baverel, O.; Dirrenberger, J. Classification of building systems for concrete 3D printing. Autom. Constr. 2017, 83, 247–258. [Google Scholar] [CrossRef]
- Asprone, D.; Auricchio, F.; Menna, C.; Mercuri, V. 3D printing of reinforced concrete elements: Technology and design approach. Constr. Build. Mater. 2018, 165, 218–231. [Google Scholar] [CrossRef]
- Gosselin, C.; Duballet, R.; Roux, P.; Gaudillière, N.; Dirrenberger, J.; Morel, P. Large-scale 3D printing of ultra-high performance concrete—A new processing route for architects and builders. Mater. Des. 2016, 100, 102–109. [Google Scholar] [CrossRef]
- Paul, S.C.; Tay, Y.W.D.; Panda, B.; Tan, M.J. Fresh and hardened properties of 3D printable cementitious materials for building and construction. Arch. Civ. Mech. Eng. 2018, 18, 311–319. [Google Scholar] [CrossRef]
- Kazemian, A.; Yuan, X.; Cochran, E.; Khoshnevis, B. Cementitious materials for construction-scale 3D printing: Laboratory testing of fresh printing mixture. Constr. Build. Mater. 2017, 145, 639–647. [Google Scholar] [CrossRef]
- Sakin, M.; Kiroglu, Y.C. 3D Printing of Buildings: Construction of the Sustainable Houses of the Future by BIM. Energy Procedia 2017, 134, 702–711. [Google Scholar] [CrossRef]
- Di Luzio, G.; Cusatis, G. Hygro-thermo-chemical modeling of high performance concrete. I: Theory. Cem. Concr. Compos. 2009, 5, 301–308. [Google Scholar] [CrossRef]
- Di Luzio, G.; Cusatis, G. Hygro-thermo-chemical modeling of high-performance concrete. II: Numerical implementation, calibration, and validation. Cem. Concr. Compos. 2009, 5, 309–324. [Google Scholar] [CrossRef]
- Gawin, D.; Pesavento, F.; Schrefler, B.A. Hygro-thermo-chemo-mechanical modelling of concrete at early ages and beyond. Part II: Shrinkage and creep of concrete. Int. J. Numer. Methods Eng. 2006, 3, 332–363. [Google Scholar] [CrossRef]
- Gawin, D.; Pesavento, F.; Schrefler, B.A. Hygro-thermo-chemo-mechanical modelling of concrete at early ages and beyond. Part I: Hydration and hygro-thermal phenomena. Int. J. Numer. Methods Eng. 2006, 3, 299–331. [Google Scholar] [CrossRef]
- Wan-Wendner, L.; Wan-Wendner, R.; Cusatis, G. Age-dependent size effect and fracture characteristics of ultra-high performance concrete. Cem. Concr. Compos. 2018, 85, 67–82. [Google Scholar] [CrossRef]
- Bergmeister, K.; Hilber, R.; Strieder, E. Endbericht—Forschungsprojekt Nr. 875-15-012 Verringerung der Kosten von Stahlbeton—Schutzbauwerke im Wasserbau—Mindestbewehrung; University of Natural Resources and Life Sciences (BOKU): Wien, Austria, 2016. [Google Scholar]
- Weisner, A.; Richter, T. Massige Bauteile aus Beton, Zement-Merkblatt B11; InformationsZentrum Beton GmbH: Erkrath, Germany, 2016. [Google Scholar]
- Dassault Systems SIMULIA. Abaqus 2017 Online Documentation; Online Handbuch; SIMULIA: Pawtucket, RI, USA, 2017. [Google Scholar]
- Freisleben, H.; Hansen, P.; Pedersen, E.J. Maleinstrument til Kontrol at Betons Haerding; Nordisk Betong: Stockholm, Sweden, 1977. [Google Scholar]
- Poulsen, R.; Christiansen, M. Numerisk Simulering af Temperatur-og Spændingstilstanden i Hærdnende Betonkonstruktioner. Master’s Thesis, Aalborg Universitet, Aalborg, Denmark, 2009. [Google Scholar]
- DIN EN 12620:2008-07, Gesteinskörnung für Beton; Beuth: Berlin, Germany, 2008.
- Schießl, P. Zur Frage der Zulässigen Rissbreite und der Erforderlichen Betondeckung im Stahlbetonbau unter Besonderer Berücksichtigung der Karbonatisierung des Betons; Deutscher Ausschuss für Stahlbeton: Berlin, Germany, 1976; p. 255. [Google Scholar]
- Bundesanstalt für Wasserbau. Merkblatt: Rissbreitenbegrenzung für Frühen Zwang in Massiven Wasserbauwerken (MFZ); Bundesanstalt für Wasserbau: Karlsruhe, Germany, 2011; ISBN 2192-5380. [Google Scholar]
- DIN 19702:2013-02 Massivbauwerke im Wasserbau—Tragfähigkeit, Gebrauchstauglichkeit und Dauerhaftigkeit; Beuth: Berlin Germany, 2013.
- Schutzbauwerke der Wildbachverbauung—Projektierung, Bemessung und konstruktive Durchbildung; ONR 24802; Austrian Standards Institute: Wien, Austria, 2011.
- Rösler, L.; Schorn, J. Einfluss des Zementgehaltes auf Materialparameter von Beton Teil 1 (unpublished); Bachelorarbeit; Universität für Bodenkultur: Wien, Austria, 2017. [Google Scholar]
- Aigner, C.; Hemetsberger, N. Einfluss des Zementgehaltes auf Materialparameter von Beton Teil 2 (unpublished); Bachelorarbeit; Universität für Bodenkultur: Wien, Austria, 2016. [Google Scholar]
- Reimoser, T.; Rigler, M. Einfluss des Zementgehaltes auf Materialparameter von Beton Teil 3 (unpublished); Bachelorarbeit; Universität für Bodenkultur: Wien, Austria, 2017. [Google Scholar]
- Riis, K.; Spange, H.; Hougard Hansen, J. HETEK-Control of Early Age Cracking of Concrete Phase 6: Early Age Properties of Alternative Concrete; The Danish Road Directorate’s Research Programme HETEK: Vejle, Denmark, 1997; Volume 114, ISBN 87-7491-827-3. [Google Scholar]
- Schutter, G.; Taerwe, L. Degree of hydration-based description of mechanical properties of early age concrete. Mater. Struct. 1996, 29, 335–344. [Google Scholar] [CrossRef]
- Haveresch, K.; Maurer, R.; Tauscher, F. Hinweise für den Ansatz der Betonzugfestigkeit beim Nachweis der Mindestbewehrung für frühen Zwang gemäß Eurocode 2-2 (DIN EN 1992-2/NA). Beton Stahlbetonbau 2016, 111, 749–758. [Google Scholar] [CrossRef]
- DBV-Rundschreiben 242. Was Hat Die Festlegung fct eff ≤ 0,5 Fctm mit Rissen in Betonbauteilen zu tun? DBV-Rundschreiben; Deutscher Beton-und Bautechnik-Verein e.V.: Berlin, Germany, 2014; pp. 1–5. [Google Scholar]
© 2018 by the authors. Licensee MDPI, Basel, Switzerland. This article is an open access article distributed under the terms and conditions of the Creative Commons Attribution (CC BY) license (http://creativecommons.org/licenses/by/4.0/).


