Article

Measuring and Modeling the Polarized Upwelling Radiance Distribution in Clear and Coastal Waters

by
Arthur C. R. Gleason
1,
Kenneth J. Voss
1,*,
Howard R. Gordon
1,
Michael S. Twardowski
2 and
Jean-François Berthon
3
1
Physics Department, University of Miami, Coral Gables, FL 33146, USA
2
Harbor Branch Oceanographic Institute, Fort Pierce, FL 34946, USA
3
Joint Research Centre of the European Commission, 21027 Ispra, Italy
*
Author to whom correspondence should be addressed.
Appl. Sci. 2018, 8(12), 2683; https://doi.org/10.3390/app8122683
Submission received: 15 June 2018 / Revised: 6 September 2018 / Accepted: 8 October 2018 / Published: 19 December 2018
(This article belongs to the Special Issue Outstanding Topics in Ocean Optics)

Abstract

:
The upwelling spectral radiance distribution is polarized, and this polarization varies with the optical properties of the water body. Knowledge of the polarized, upwelling, bidirectional radiance distribution function (BRDF) is important for generating consistent, long-term data records for ocean color because the satellite sensors from which the data are derived are sensitive to polarization. In addition, various studies have indicated that measurement of the polarization of the radiance leaving the ocean can used to determine particle characteristics (Tonizzo et al., 2007; Ibrahim et al., 2016; Chami et al., 2001). Models for the unpolarized BRDF (Morel et al., 2002; Lee et al., 2011) have been validated (Voss et al., 2007; Gleason et al., 2012), but variations in the polarization of the upwelling radiance due to the sun angle, viewing geometry, dissolved material, and suspended particles have not been systematically documented. In this work, we simulated the upwelling radiance distribution using a Monte Carlo-based radiative transfer code and measured it using a set of fish-eye cameras with linear polarizing filters. The results of model-data comparisons from three field experiments in clear and turbid coastal conditions showed that the degree of linear polarization (DOLP) of the upwelling light field could be determined by the model with an absolute error of ±0.05 (or 5% when the DOLP was expressed in %). This agreement was achieved even with a fixed scattering Mueller matrix, but did require in situ measurements of the other inherent optical properties, e.g., scattering coefficient, absorption coefficient, etc. This underscores the difficulty that is likely to be encountered using the particle scattering Mueller matrix (as indicated through the remote measurement of the polarized radiance) to provide a signature relating to the properties of marine particles beyond the attenuation/absorption coefficient.

1. Introduction

The in-water and water-leaving radiance in the ocean is partially polarized and this has implications for both biological activity [1] and for viewing the ocean from a satellite [2]. The biological implications of the polarization are a current topic of research [3] but the implications for ocean color remote sensing are just being exploited [2,4]. Various studies have indicated that measurement of the polarization of the radiance leaving the ocean can be used to determine particle characteristics [5,6,7]. In addition to using the polarization of the water leaving radiance for studies of the water properties, polarization may also be important for processing data from ocean color sensors that have unintended polarization sensitivities [8,9].
Measurements of the scalar (without regard to polarization) spectral upwelling radiance distribution have occurred more frequently since the development of the radiance distribution camera, RADS [10], and then the upwelling radiance distribution camera, NuRADS [11]. These instruments use electro-optic camera systems combined with filter changers and fisheye cameras to image the complete upwelling radiance distribution, for a specific wavelength, in one image. The CCD (charge coupled device) resolution and optics allow measurement of the radiance distribution with a 1° angular resolution. These systems have been used in studies of the in-water light field [12] and studies of the angular radiance distribution variations in ocean color algorithms [13,14]. Recently, two new cameras, polarized radiance camera (PolRADS) [15] and downwelling polarized camera (DPOL) [16], have been used to make measurements of the polarized spectral upwelling radiance distribution, as described below.
Measurements of the upwelling, in situ, polarized radiance have typically been done with variations of a Gershun-tube radiometer, obtaining the angular distribution by changing the viewing direction of the radiometer [17,18]. These instruments have advantages such as the simplicity of calibration and the ability to do hyperspectral measurements. Hyperspectral measurements of the polarized light field have been suggested as a method to measure in situ solar stimulated fluorescence [19]. Unfortunately, to obtain the full radiance distribution requires many measurements during which the illumination conditions can change, and spatially varying angular features resulting from the sea surface may not be captured. By making measurements using fisheye lenses, while limited to multi-spectral measurements rather than hyperspectral measurements, higher angular spatial resolution can be obtained nearly simultaneously (typical exposure times are less than 1 s).
Models for the unpolarized bi-directional reflectance distribution function (BRDF) [20,21] have been validated in Case I [13] and Case II [14] waters, but variations in the polarization of upwelling radiance due to sun angle, viewing geometry, dissolved material, and suspended particles have not been systematically documented.

2. Methods

The light field polarization is easily described by use of the four element Stokes vector, I, as in, for example, Bohren and Huffman [22]. The four components of I are prescribed relative to some reference plane, which here we choose as the plane defined by the viewing direction and the nadir direction. Consider an electromagnetic wave of angular frequency ω. If the unit vector ^ is parallel to, and the unit vector r ^ is perpendicular to, the reference plane (such that ^ × r ^ is in the direction of propagation), the electric field can be written as E = E ^ + E r r ^ , with:
E = E 0 exp [ i ( ω t + δ ) ] ,
E r = E r 0 exp [ i ( ω t + δ r ) ]
where E 0   and   E r 0 are real. The four components of the Stokes vector are then defined as:
I E E * + E r E r * = E l 0 2 + E r 0 2
Q E E * E r E r * = E l 0 2 E r 0 2 ,
U E E r * + E r E * = 2 E l 0 E r 0 c o s δ
V i ( E E r * E r E * ) = 2 E l 0 E r 0 s i n δ
where δ δ r δ . A derived parameter that we will use in our comparison is the degree of linear polarization, DOLP, defined as:
D O L P = Q 2 + U 2 I 2
Another useful parameter is the angle of the plane of polarization, χ , which is defined as:
χ = 1 2 arctan ( U Q )
We measured the Stokes vector over the upwelling hemisphere using the PolRADS and DPOL cameras and simulated it using a Monte Carlo-based radiative transfer (RT) code. Data were available from three field campaigns: Hawaii, USA, in December 2005; the Ligurian Sea in March 2009; and the New York Bight in May 2009.

2.1. Measurements of the Polarized Upwelling Radiance Distribution

In Hawaii, measurements of the polarized upwelling radiance distribution were accomplished using the PolRADS camera system [15]. PolRADS is based on the NuRADS camera system [12], which is a compact (30 cm diameter, 30 cm length), multispectral camera that images the upwelling radiance distribution in six narrow (≈10 nm full-width at half-maximum, FWHM) spectral bands centered at 412, 436, 486, 526, 548, and 615 nm. In the PolRADS instrument, three synchronized NuRADS cameras are used, each with a linear polarizer, to simultaneously acquire images. Combining the images from three NuRADS cameras, when in PolRADS configuration, allows for retrieval of three elements of the Stokes vector (I, Q, and U, but not V), as well as DOLP.
In the Ligurian Sea and New York Bight, measurements of the polarized upwelling radiance distribution were accomplished with the DPOL camera system [16]. DPOL is similar to PolRADS in the sense that simultaneous measurements are made using multiple fisheye lenses with different polarizing filters in the optical path. DPOL differs from PolRADS by using optical-fiber bundles to project images from all lenses through a single spectral filter and onto a single CCD array. Eliminating the redundant filters and cameras makes DPOL much smaller than PolRADS, thereby reducing the instrument shadow. Furthermore, DPOL has four lenses, rather than the three on PolRADS, enabling retrieval of all four Stokes vector elements. The spectral filters used on DPOL were also ≈10 nm FWHM and were centered at 442, 488, 520, 550, 589, and 650 nm. For both PolRADS and DPOL, the channels above 600 nm will not be used because of instrument self-shading. In addition, because of its absence on DPOL, the 412 nm channel on PolRads will also not be discussed.
Data acquisition for both the PolRADS and DPOL systems used filter changers to rotate interference filters and thus sequentially acquire images in each wavelength band. Typical exposure times were less than one second. However, acquiring a set of images from all wavelengths took about two minutes due to the time required to read and store the data from the CCD. With both systems, typical deployments lasted from one to several hours, enabling multiple acquisitions over a range of solar zenith angles.
Reduction of the raw images consisted of applying calibration factors [15,16] and averaging images in both space and time to reduce environmental noise. After calibration, but before averaging, every image was inspected to find the anti-solar point, to correct the geometry of the image, and to check for obstructions in the field of view such as fish, the power/data cable, the side of the ship, or other instruments. Calibrated images of the Stokes vectors were then averaged in 10-min bins, excluding those that had been flagged as unacceptable in the inspection stage. The symmetry of the images about the principal plane was exploited to further average both halves of each image. In addition, spatial binning of 3 × 3-pixel windows was performed to produce final average images at a 1° × 1° resolution. Each pixel in the final, reduced image, therefore, could have been an average of up to 90 raw pixels (5 images × 2 image halves × 9-pixel window). The mean and coefficient of variation (CV = standard deviation divided by the mean) of the Stokes vector components were computed for each pixel in the reduced image using the up-to-90 raw pixels in the original images. The degree of linear polarization DOLP was then computed for each pixel from the mean I, Q, and U Stokes vector components (Equation (3)). Because V was not available from the PolRADS data, DOLP was calculated rather than the degree of polarization (DOP); however, in the upwelling lightfield, they are equivalent because the magnitude of V is negligible [23].
For in situ radiometric measurements, instrument self-shading must be considered [24]. In our case, instrument self-shading may also affect the DOLP measurements due to camera geometry. The physical displacement of the multiple lenses used means that the images through different polarizers will look into the instrument shadow in slightly different directions. When one lens views a portion of the radiance distribution with less shadow, it will appear brighter in that image. In the algorithm from which the polarization information is derived, for the scene to be unpolarized requires that region of the three camera images to be closely matched in intensity. If the region in one camera is less shaded, it will cause the algorithm to assume that the light field is polarized along the direction of the linear polarizer in that camera. Thus shadowing, which is not symmetric in all the images, will appear as an increase in the DOLP, and therefore, a negative model-data DOLP difference. This effect should be greater in turbid water and for the PolRADS instrument (because of its larger size) than in clear water or with the DPOL instrument. In our analysis, the area of direct shadow (the anti-solar point) was excluded from the data set. More subtle shadow areas may exist and could cause the measured DOLP to be larger than the modelled DOLP (as will be seen, this was not generally the case in our data set).

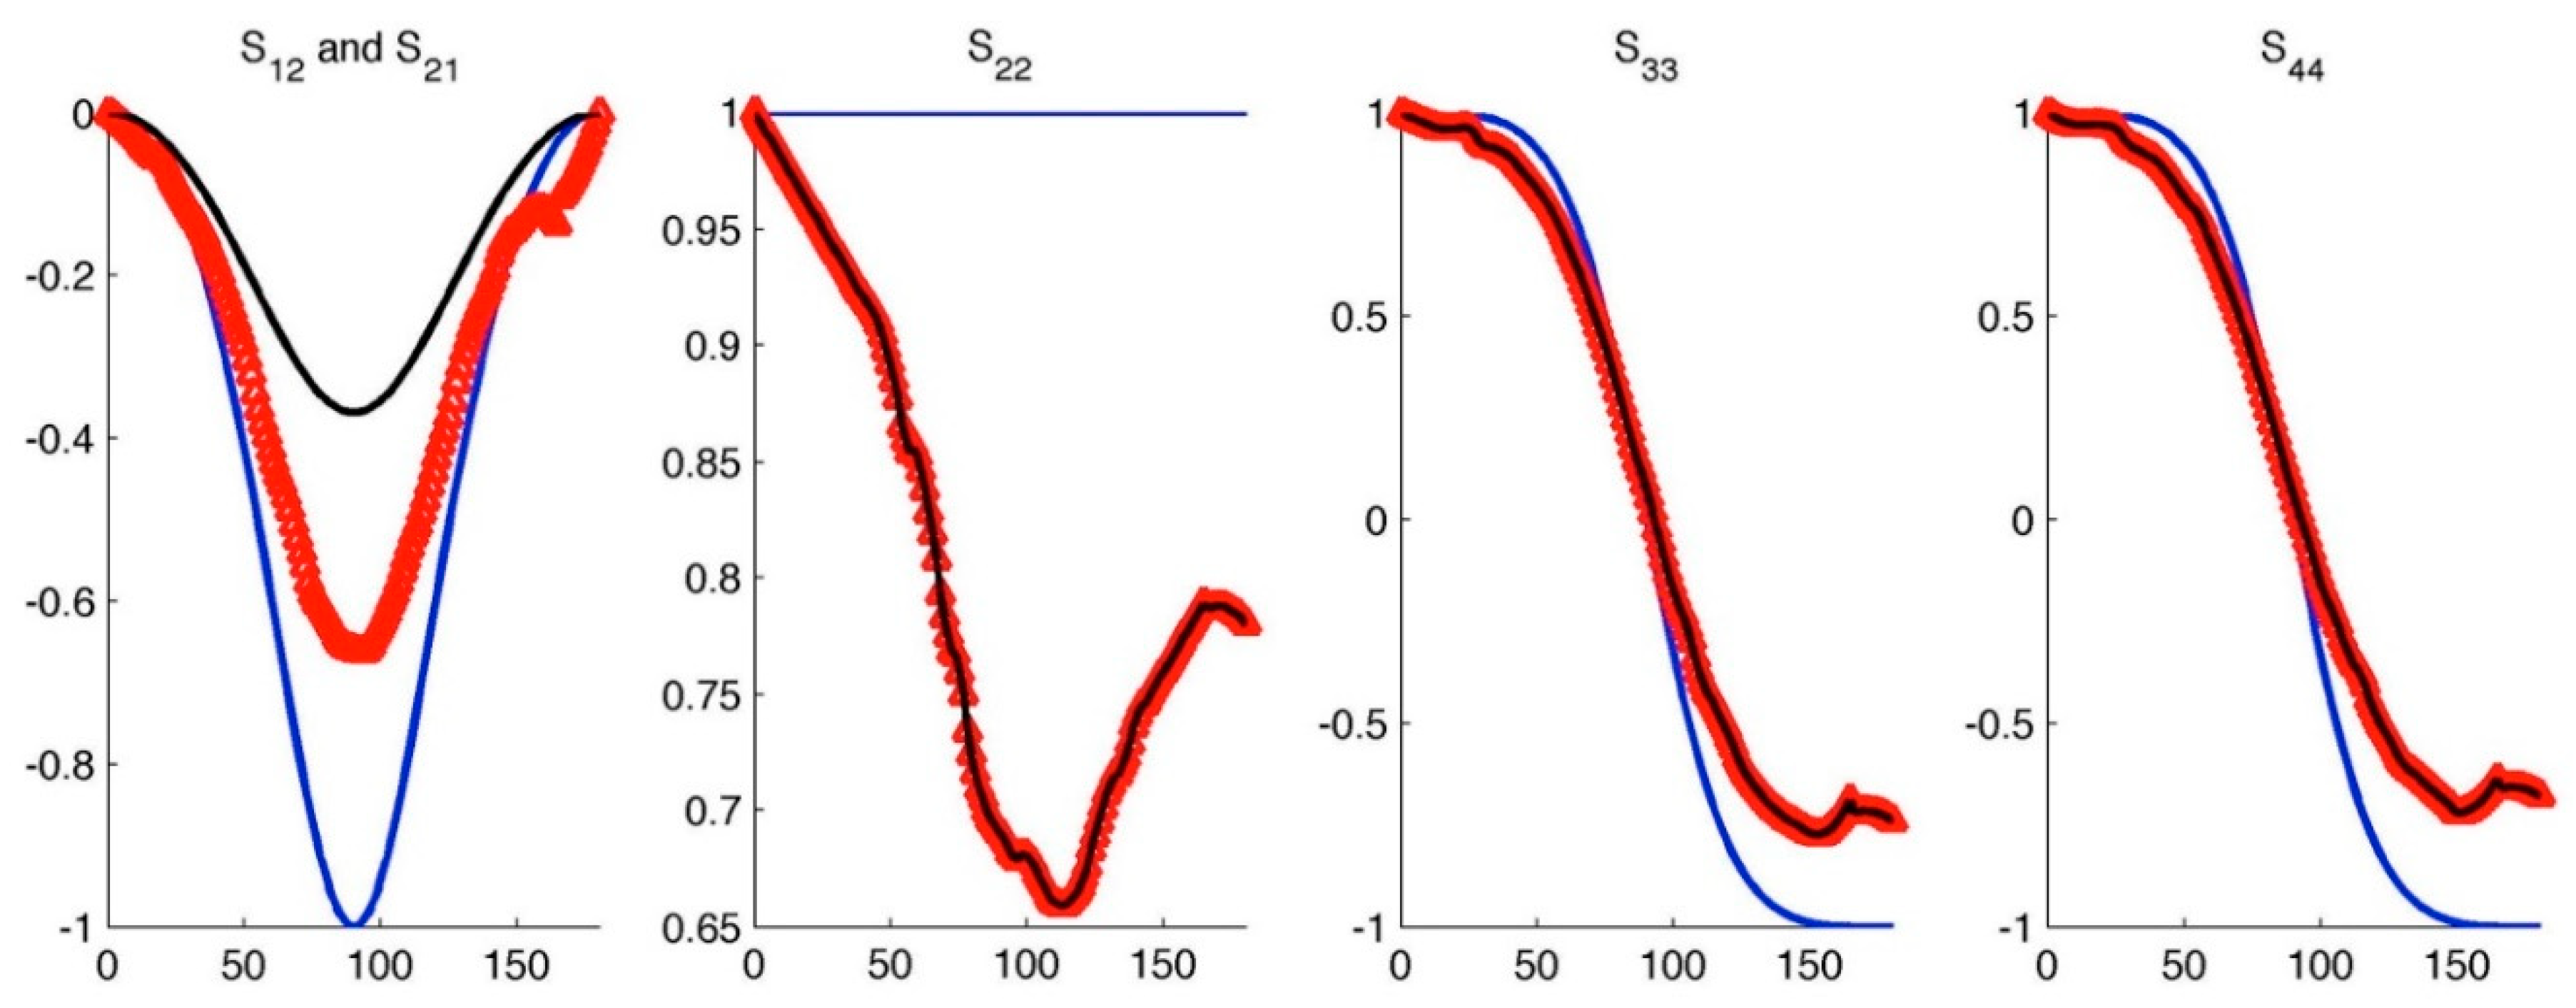
2.2. Modeling the Polarized Upwelling Radiance Distribution

A Monte Carlo model was used to solve the vector radiative transfer equation (Equation (5)) for the propagation of the Stokes vector, I, at wavelength λ ,
c o s ( θ ) d I ( λ , τ , θ , ϕ ) d τ = I ( λ , τ , θ , ϕ ) + ω 0 4 π R ( α ) P ( λ , τ , θ , ϕ θ , ϕ ) R ( α ) I ( λ , τ , θ , ϕ ) d Ω
The four components of the column vector I = [I, Q, U, V]T were defined in Equation (2). The single-scattering albedo, ω 0 , the optical depth of the medium, τ , the scattering phase matrix, P, and the rotation matrix, R, are defined below. The right-handed coordinate system in Equation (5) has its origin at the top of the medium, z-axis pointed downward, and x-axis directed away from the sun. The nadir angle, θ , relative to the z-axis, and the azimuth angle, ϕ , in the x-y plane, define the direction of photon propagation. Photons originate in the solar beam, i.e., with θ = θ 0 , the solar zenith angle, and ϕ 0 = 0 .
The model simulated a horizontally homogenous, two-layer system with a non-absorbing, Rayleigh-scattering atmosphere over an ocean comprised of Rayleigh-scattering water molecules plus scattering and absorbing hydrosols (“particles”). Fresnel reflectance at the air–water interface used the boundary condition defined in Gordon et al. [8]. The single-scattering albedo, ω 0 , and the optical depth of the medium, τ , were defined as per usual (e.g., Mobley [25]):
ω 0 = b t ( λ ) c t ( λ ) ,
and   τ ( λ ) = 0 z c t ( λ ) d z .
where the parameters a t ( λ ) + b t ( λ ) = c t ( λ ) are the total absorption, scattering, and attenuation coefficients (in m−1), respectively. For the atmospheric layer, a t ( λ ) = 0 , therefore ω 0 = 1 , and τ was taken from Teillet [26] assuming standard atmospheric conditions. For the oceanic layer, absorption (aw) and scattering (bw) coefficients of seawater were interpolated to PolRADS and DPOL spectral bands from Table 1.1 in Pegau et al. [27]. In the Ligurian Sea and New York Bight experiments, the absorption coefficient of dissolved and particulate constituents (apg) and the particle scattering (bp) coefficients were measured in situ, depth-weighted, and interpolated as necessary to the PolRADS and DPOL spectral bands as described by Gleason et al. [14]. No in situ measurements were available from Hawaii, therefore for that dataset, apg and bp were derived from Morel and Gentili [28] (Equations (7) and (8) in reference [28]) using an estimated total chlorophyll concentration of 0.1 g/m3, the long-term average value at the measurement site. Summing the water and particle contributions gave the total coefficients required for Equations (6) and (7): a t = a ω ( λ ) + a p g ( λ ) and b t = b ω ( λ ) + b p ( λ ) . For each image data set, the model was run at the corresponding solar zenith angle.
Scattering events in Equation (5) are represented by a 4 × 4 matrix called the Mueller matrix, M. For example, a photon travelling in direction ξ with Stokes vector I’ would be scattered in a new direction ξ with Stokes vector I by the linear transformation I( ξ ) = MI’( ξ ’). Note that M is defined relative to the scattering plane (as is traditional), the plane defined by vectors ξ ’ and ξ , but we have defined I( θ , ϕ ) relative to the viewing direction and the nadir direction. Pre- and post-multiplication by the rotation matrix R( α ) is required to account for changes in reference frames: I( θ , ϕ ) = R( α )MR( α ’)I ( θ , ϕ ), where
R ( α ) = ( 1 0 0 0 0 c o s ( 2 α ) s i n ( 2 α ) 0 0 s i n ( 2 α ) c o s ( 2 α ) 0 0 0 0 1 )
The rotation angle α = c o s 1 ( l l ^ l r ^ ) is measured clockwise from the vector l l ^ in the initial reference frame to the vector l r ^ in the rotated reference frame [8].
The scattering phase matrix, P, is a Mueller matrix normalized to the integral of the M11 element over all solid angles:
P = M/b
where
b = 2 π 0 π M 11 s i n ( θ ) d θ
Mij represents the ith row and jth column of M, and Θ is the scattering angle.
It is advantageous, when investigating the polarization effects of the Muller matrix, to normalize in a different way, specifically to the M11 element at each angle Θ (Equation (11)).
S i j ( Θ ) = M i j ( Θ ) / M 11 ( Θ )
Then,
P = β ˜ S
where β ˜ = M 11 / b is the scattering phase function typically used in scalar radiance transfer models.
For our modeling, P in the atmosphere and Pw, the seawater component of the ocean, were both set to Pr, given by Rayleigh scattering:
P r = 3 16 π ( 1 + c o s 2 ( Θ ) s i n 2 ( Θ ) 0 0 s i n 2 ( Θ ) 1 + c o s 2 ( Θ ) 0 0 0 0 2 c o s ( Θ ) 0 0 0 0 2 c o s ( Θ ) )
(We examined a few cases using a code that included the (small) depolarization of Rayleigh scattering in the atmosphere and water by molecular anisotropy and concluded that its omission would not significantly affect the results.) Particle scattering in the ocean used β ˜ [25,29] and two alternative parameterizations of S. One set of model runs used S from Voss and Fry [30], which was experimentally determined from samples of seawater (referred to here after as V-F). Note that Voss and Fry found all off-diagonal elements of S equal to zero, within experimental error, except for S12 and S21. Furthermore, Voss and Fry found S12S21. Subsequent laboratory measurements of the Mueller matrix elements for phytoplankton [31,32,33] have been similar to V-F. Specifically, the S12( Θ ) element of phytoplankton samples tends to have a minimum value of between −0.6 to −0.8 at an angle between 90° and 100°. In contrast, experiments with solutions of suspended marine sediment have revealed smaller absolute values for S12( Θ ) element near Θ = 90° [32]. Because of this, we decided to carry out a second set of runs with a particle phase matrix having a smaller minimum in S12 near 90° (Figure 1). This was accomplished by replacing the V-F S12( Θ ) with that for Rayleigh scattering with a depolarization factor ρ .   ρ is the ratio of light scattered with polarization parallel to the plane of incidence to that scattered perpendicular to the plane of incidence, when the incident radiation is polarized perpendicular to the plane of incidence. The element S12( Θ ) as a function of ρ is given by Equation (14) [34]. The other elements of S remained unchanged for this Mueller matrix (referred to as Mod-V-F). Setting ρ = 0.3 resulted in a minimum value of S12(90°) = −0.37, which is within the range of −0.38 to −0.25 observed by Volten et al. [32].
S 12 ( Θ ) = S 21 ( Θ ) = ( 1 ρ ) ( c o s ( Θ ) 2 1 ) ( 1 + c o s ( Θ ) 2 ) + ( 3 c o s ( Θ ) 2 ) ρ
Kuik et al. [35] presented four inequalities, originally derived by Fry and Kattawar [36] and Hovenier et al. [37], that must be satisfied by the scattering matrix elements of randomly oriented particles having a plane of symmetry. These inequalities are all satisfied by the modified Mueller matrix.

2.3. Model–Data Comparison

Visual comparisons provided a qualitative check that the Stokes vector components from our RT model were in agreement with the camera data. Quantitative comparisons between the model and data were performed by computing the model–data difference every 10° in nadir from 0° to 80° and every 30° in azimuth from 0° to 180°. Thus, the difference in DOLP, DOLPdiff, between each model output, DOLPmodel, and the corresponding average PolRADS or DPOL image, DOLPdata, was computed at 63 angles using Equation (15).
D O L P d i f f ( θ , ϕ ) = D O L P m o d e l ( θ , ϕ ) D O L P d a t a ( θ , ϕ )
where D O L P m o d e l ( θ , ϕ ) and D O L P d a t a ( θ , ϕ ) are the DOLP predicted by the RT model and measured by the corresponding average PolRADS or DPOL image, respectively, at the same 63 nadir and azimuth angles.

3. Results

In total, approximately 528 individual images were selected and averaged in 10 min intervals to produce 219 data sets, which were compared with RT model runs (Table 1).

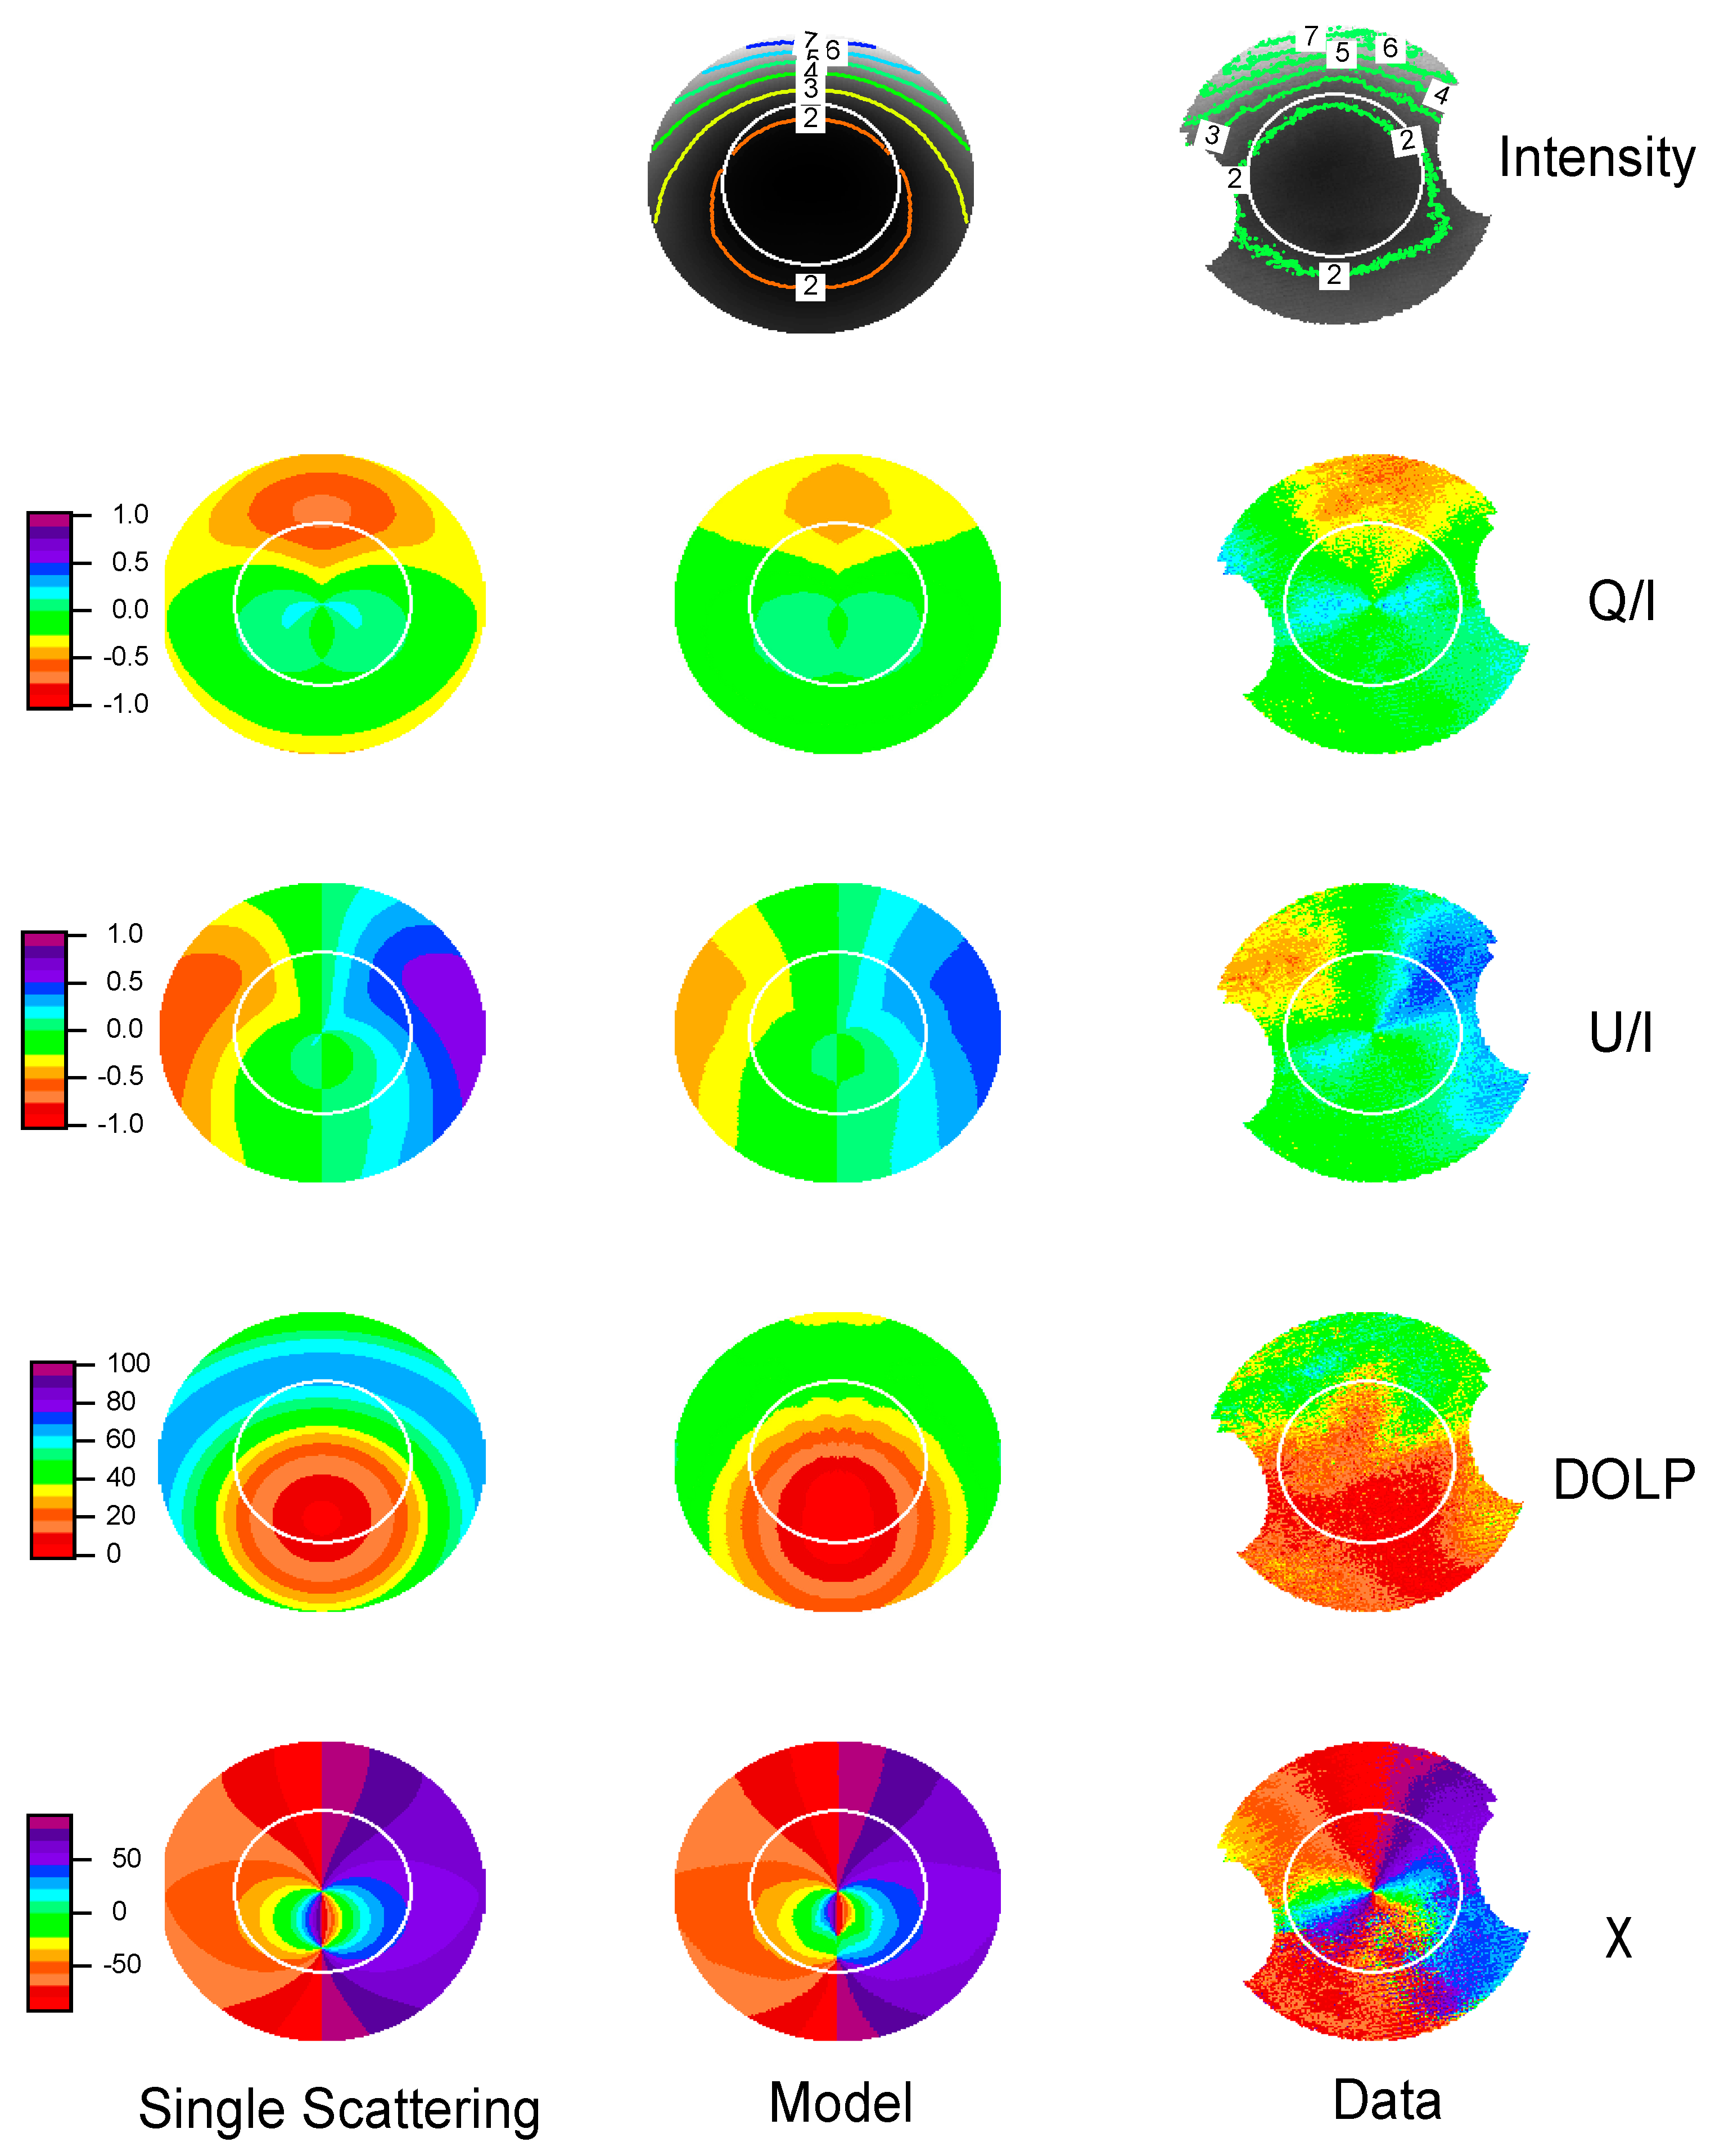
3.1. Overall View of the Upwelling Polarization Signal

Figure 2 shows an example image for clear water. In the right column, the data parameters are shown (I, Q, U, DOLP, and χ ), while in the center column, the results from the RT model are shown, where the model inputs are based on the measured parameters for the data (bp, apg, solar zenith angle). As mentioned earlier, during processing of this data, the symmetry about the principal plane was used to average the left and right side of the data (with proper handling of the sign of U/I). Thus, to make these images, this symmetry was used to generate the left side of the data images. The left column is a single scattering calculation, where the Mueller matrix was assumed to be V-F, and the solar zenith angle was the value appropriate for the data. As can be seen, the same broad patterns were visible in the single scattering model, the RT model and data. The I component of the Stokes vector was largest near the horizon in the direction towards the sun. The Q/I and U/I patterns were very similar in all three cases. For the DOLP, the single scattering model was significantly different than the data and the RT model. With single scattering, the maximum DOLP was both larger than in the RT model and the data, and occurred for all nadir angles at the scattering angle matching the minimum in the S12 and S21 elements (90–100°). Interestingly, while it was a subtle effect in the clear water case, the maximum DOLP in the model and data occurred at the same scattering angle, but at an azimuth of 90° relative to the principal plane (the plane containing the anti-solar position and nadir). This can be contrasted with the case of the downwelling sky radiance distribution, where the maximum DOLP occurred in the principal plane, with a decrease in DOLP towards the horizon (for example, Liu and Voss [38]). The same cause was in effect in both cases: for downwelling radiance, the horizon had more multiple scattering than the principal plane at the 90° scattering angle, while for the upwelling radiance, in the water, there was more multiple scattering for the principal plane at a 90° scattering angle than for nadir angles closer to the horizon. The other feature in the data for this clear water case was the separation of the neutral points, areas of zero DOLP, on either side of the principal plane, as has been discussed previously [39,40]. Finally, the angle of the polarization plane, χ , was very similar in all three cases, perhaps less well-defined for the data in the area of the low polarization, around the anti-solar position.
An example with more turbid water is shown in Figure 3. Once again, the patterns were generally the same, however in this case the data are noisier. Note that the data shown in this case has not been averaged using the left/right symmetry across the principle plane, thus appears less symmetric than the example in Figure 2. As has been pointed out before [41], the most stable parameter was χ , with the exception of the area with very low DOLP, in which case the plane of polarization was not well defined. In general, the images appeared much noisier in the data from the two more turbid sites (New York Bight and Ligurian Sea) than in the clear water off Hawaii. The pattern of Q/I and U/I tended to shift more between each image that goes into these data averages. In the scale of Q/I and U/I ranging from −1 to 1, the standard deviation obtained during averaging the data was approximately 0.05 for the New York Bight and Ligurian Sea data, while it was 0.012 for the clearer Hawaii data. One can also see that in this more turbid case, the single scattering was a poor approximation of all parameters, with the exception of χ .

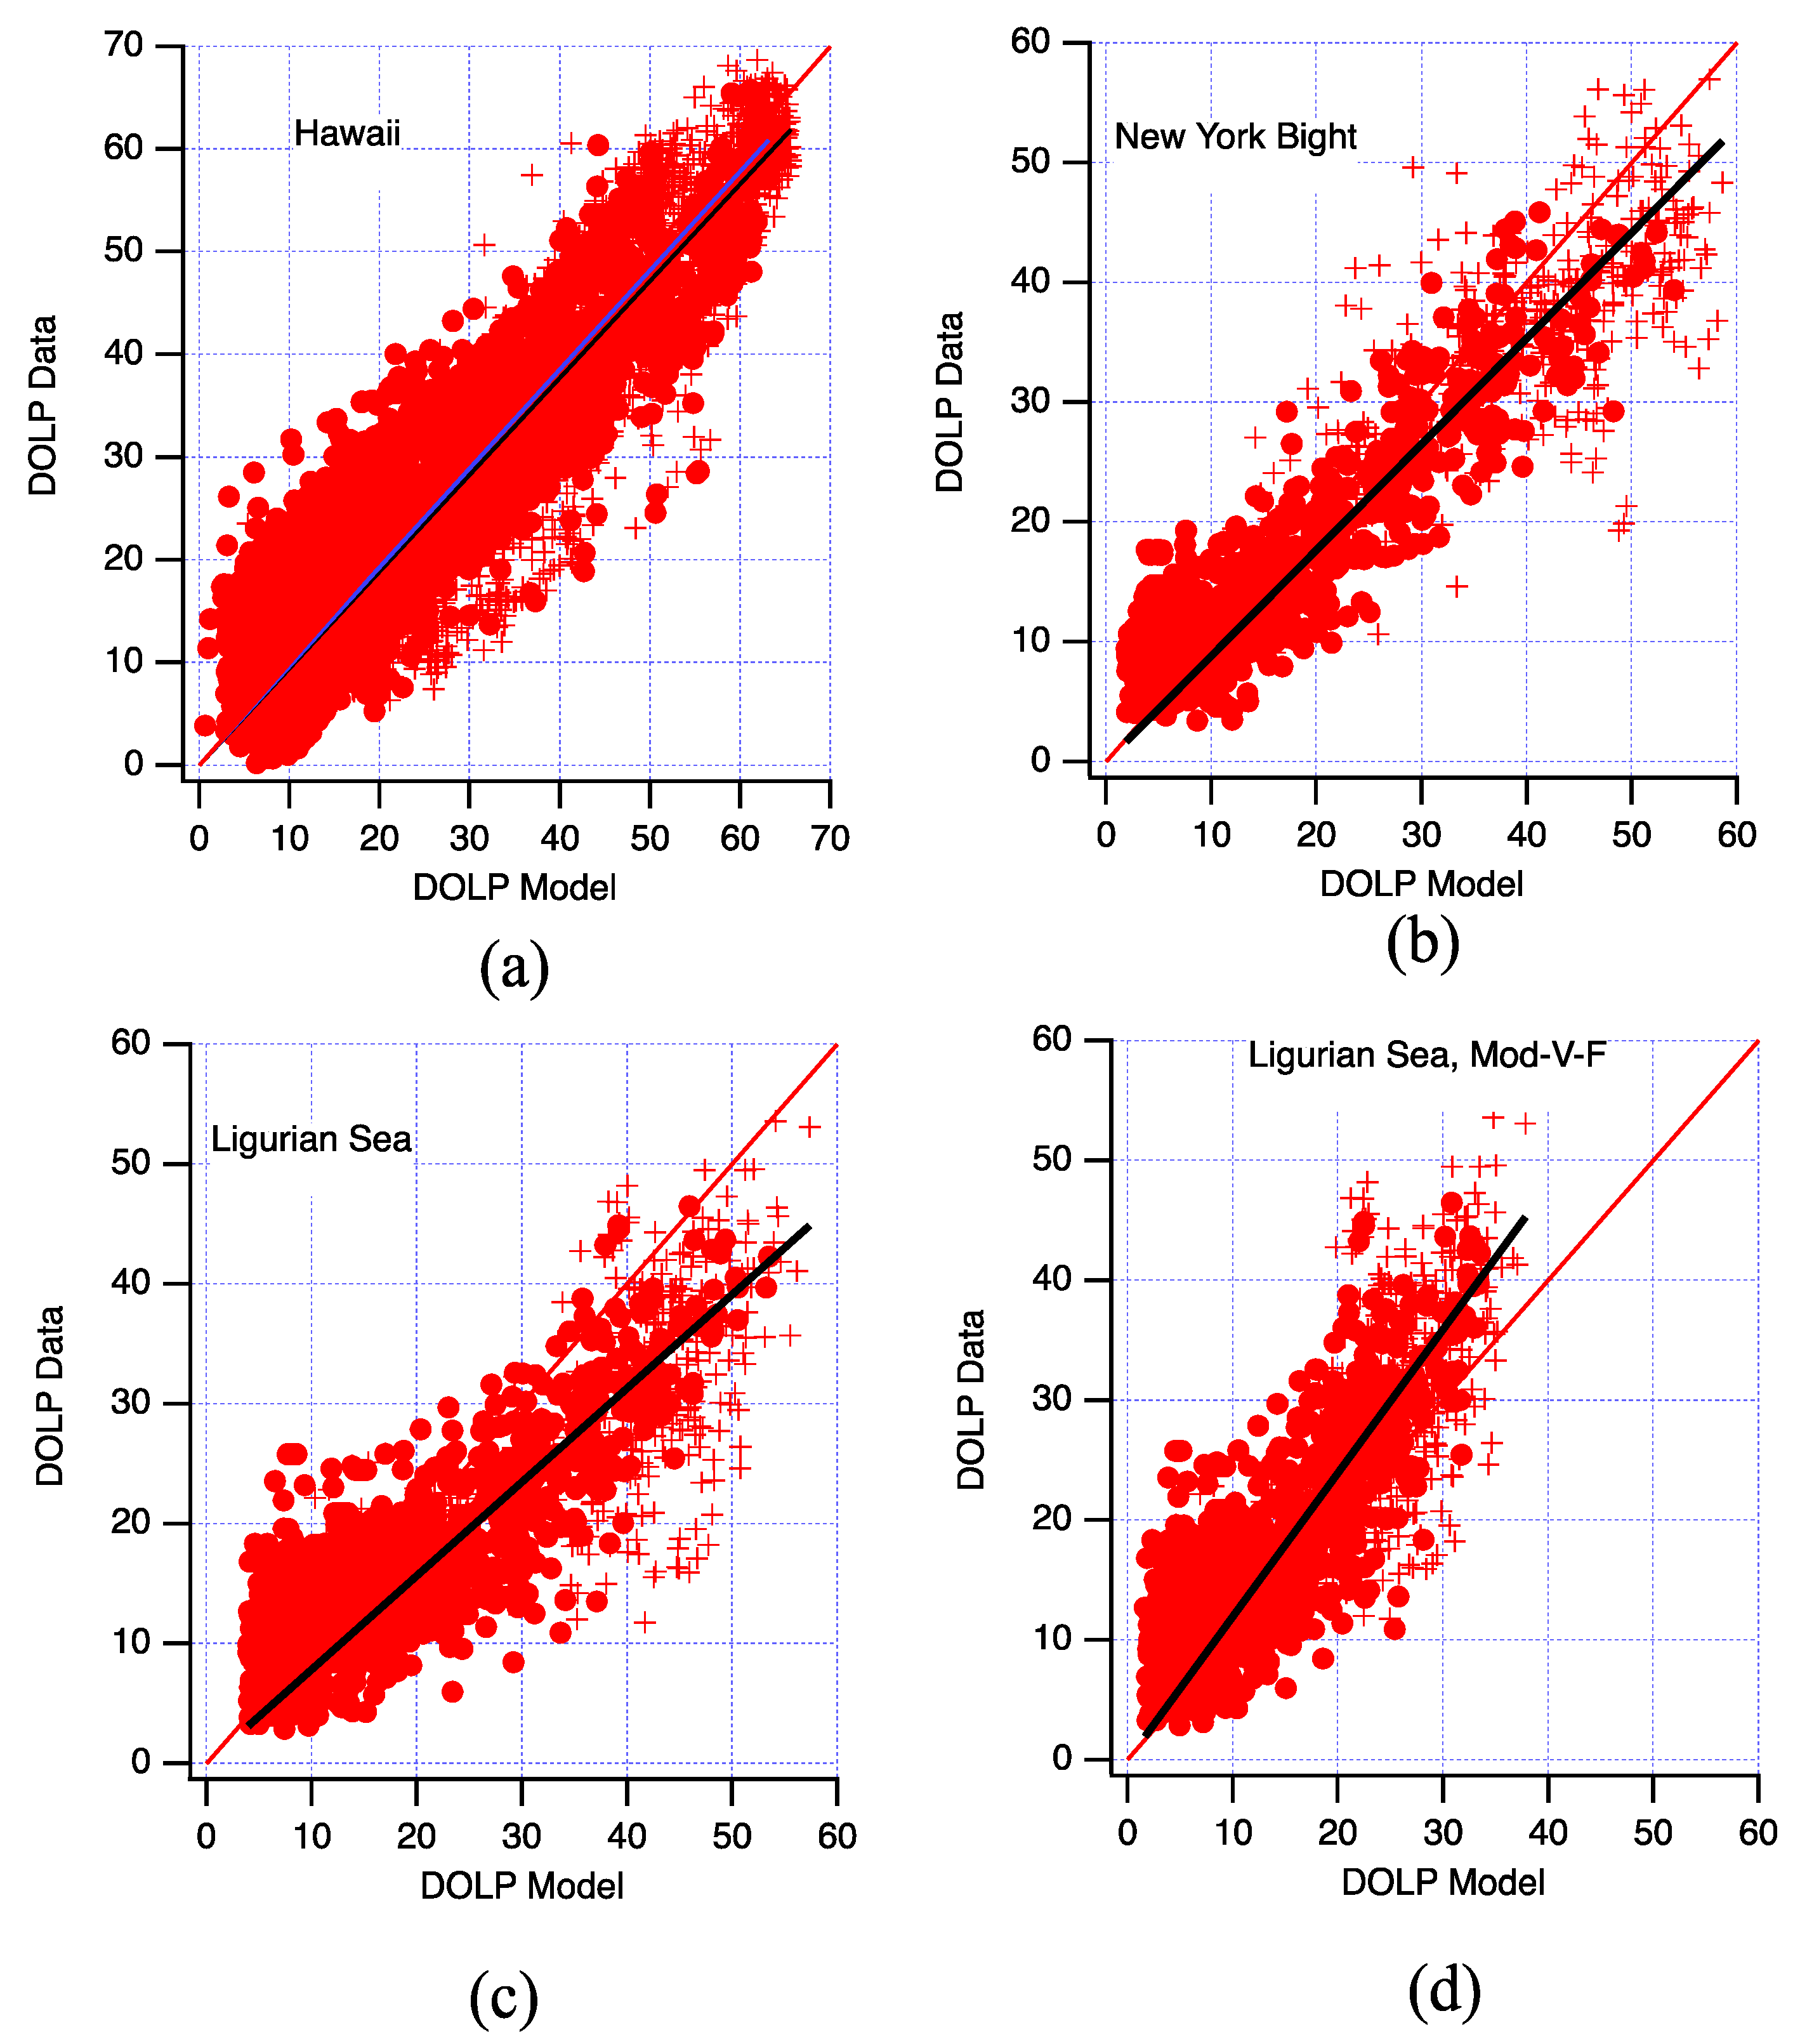
3.2. Maximum DOLP and Nadir DOLP

How large can the maximum DOLP be in the upwelling radiance? Figure 4 shows this as a function of ct/at and ct. We used the variation of the optical properties (ct, bt, bbt, and at) with the wavelength to fill in the data, thus this figure includes all wavelengths with their appropriate optical properties. The quantity ct/at can be shown to equal the mean number of scattering events in the medium taken as a whole [28]. As the water gets more turbid, there is more multiple scattering, which will decrease the DOLP [7,42]. The maximum DOLP is often outside the Snell’s cone, thus not retrievable from above the surface, so we also show the maximum value of the DOLP inside the Snell’s cone in Figure 4. As can be seen, this was less, sometimes significantly less, than the maximum DOLP in the total upwelling field. Another point was that the maximum DOLP in the total upwelling field occurred at an azimuth nearly perpendicular to the principal plane, as this position was always at a 90° scattering angle to the sun, and had the largest component of single scattered light due to a combination of light attenuation with depth and the relative smoothness of the scattering function in the backward direction. For the maximum DOLP inside the Snell’s circle, as can be seen in Figure 2 and Figure 3, this azimuthal angle will move towards the principal plane, and hence got closer to the position where, above the surface, it will be in the region of the solar glitter pattern.
Another interesting parameter is the DOLP at the nadir angle, as this was the direction that many in situ radiometers make their measurement (Figure 5). Here the RT model results are presented rather than the data, as in our definition of the reference frame, the nadir direction is a point of singularity, and the data become excessively noisy at that point.
Note that the nadir light field could be significantly polarized and the DOLP could be greater than 20%. Also, as can be seen, the largest values (22%) occurred at large solar zenith angles (when the scattering angle decreased to values closer to 90°), but there was also a trend of decreasing DOLP as ct/at increased at a constant solar zenith angle due to increasing multiple scattering. The plane of polarization in all cases was perpendicular to the principal plane.

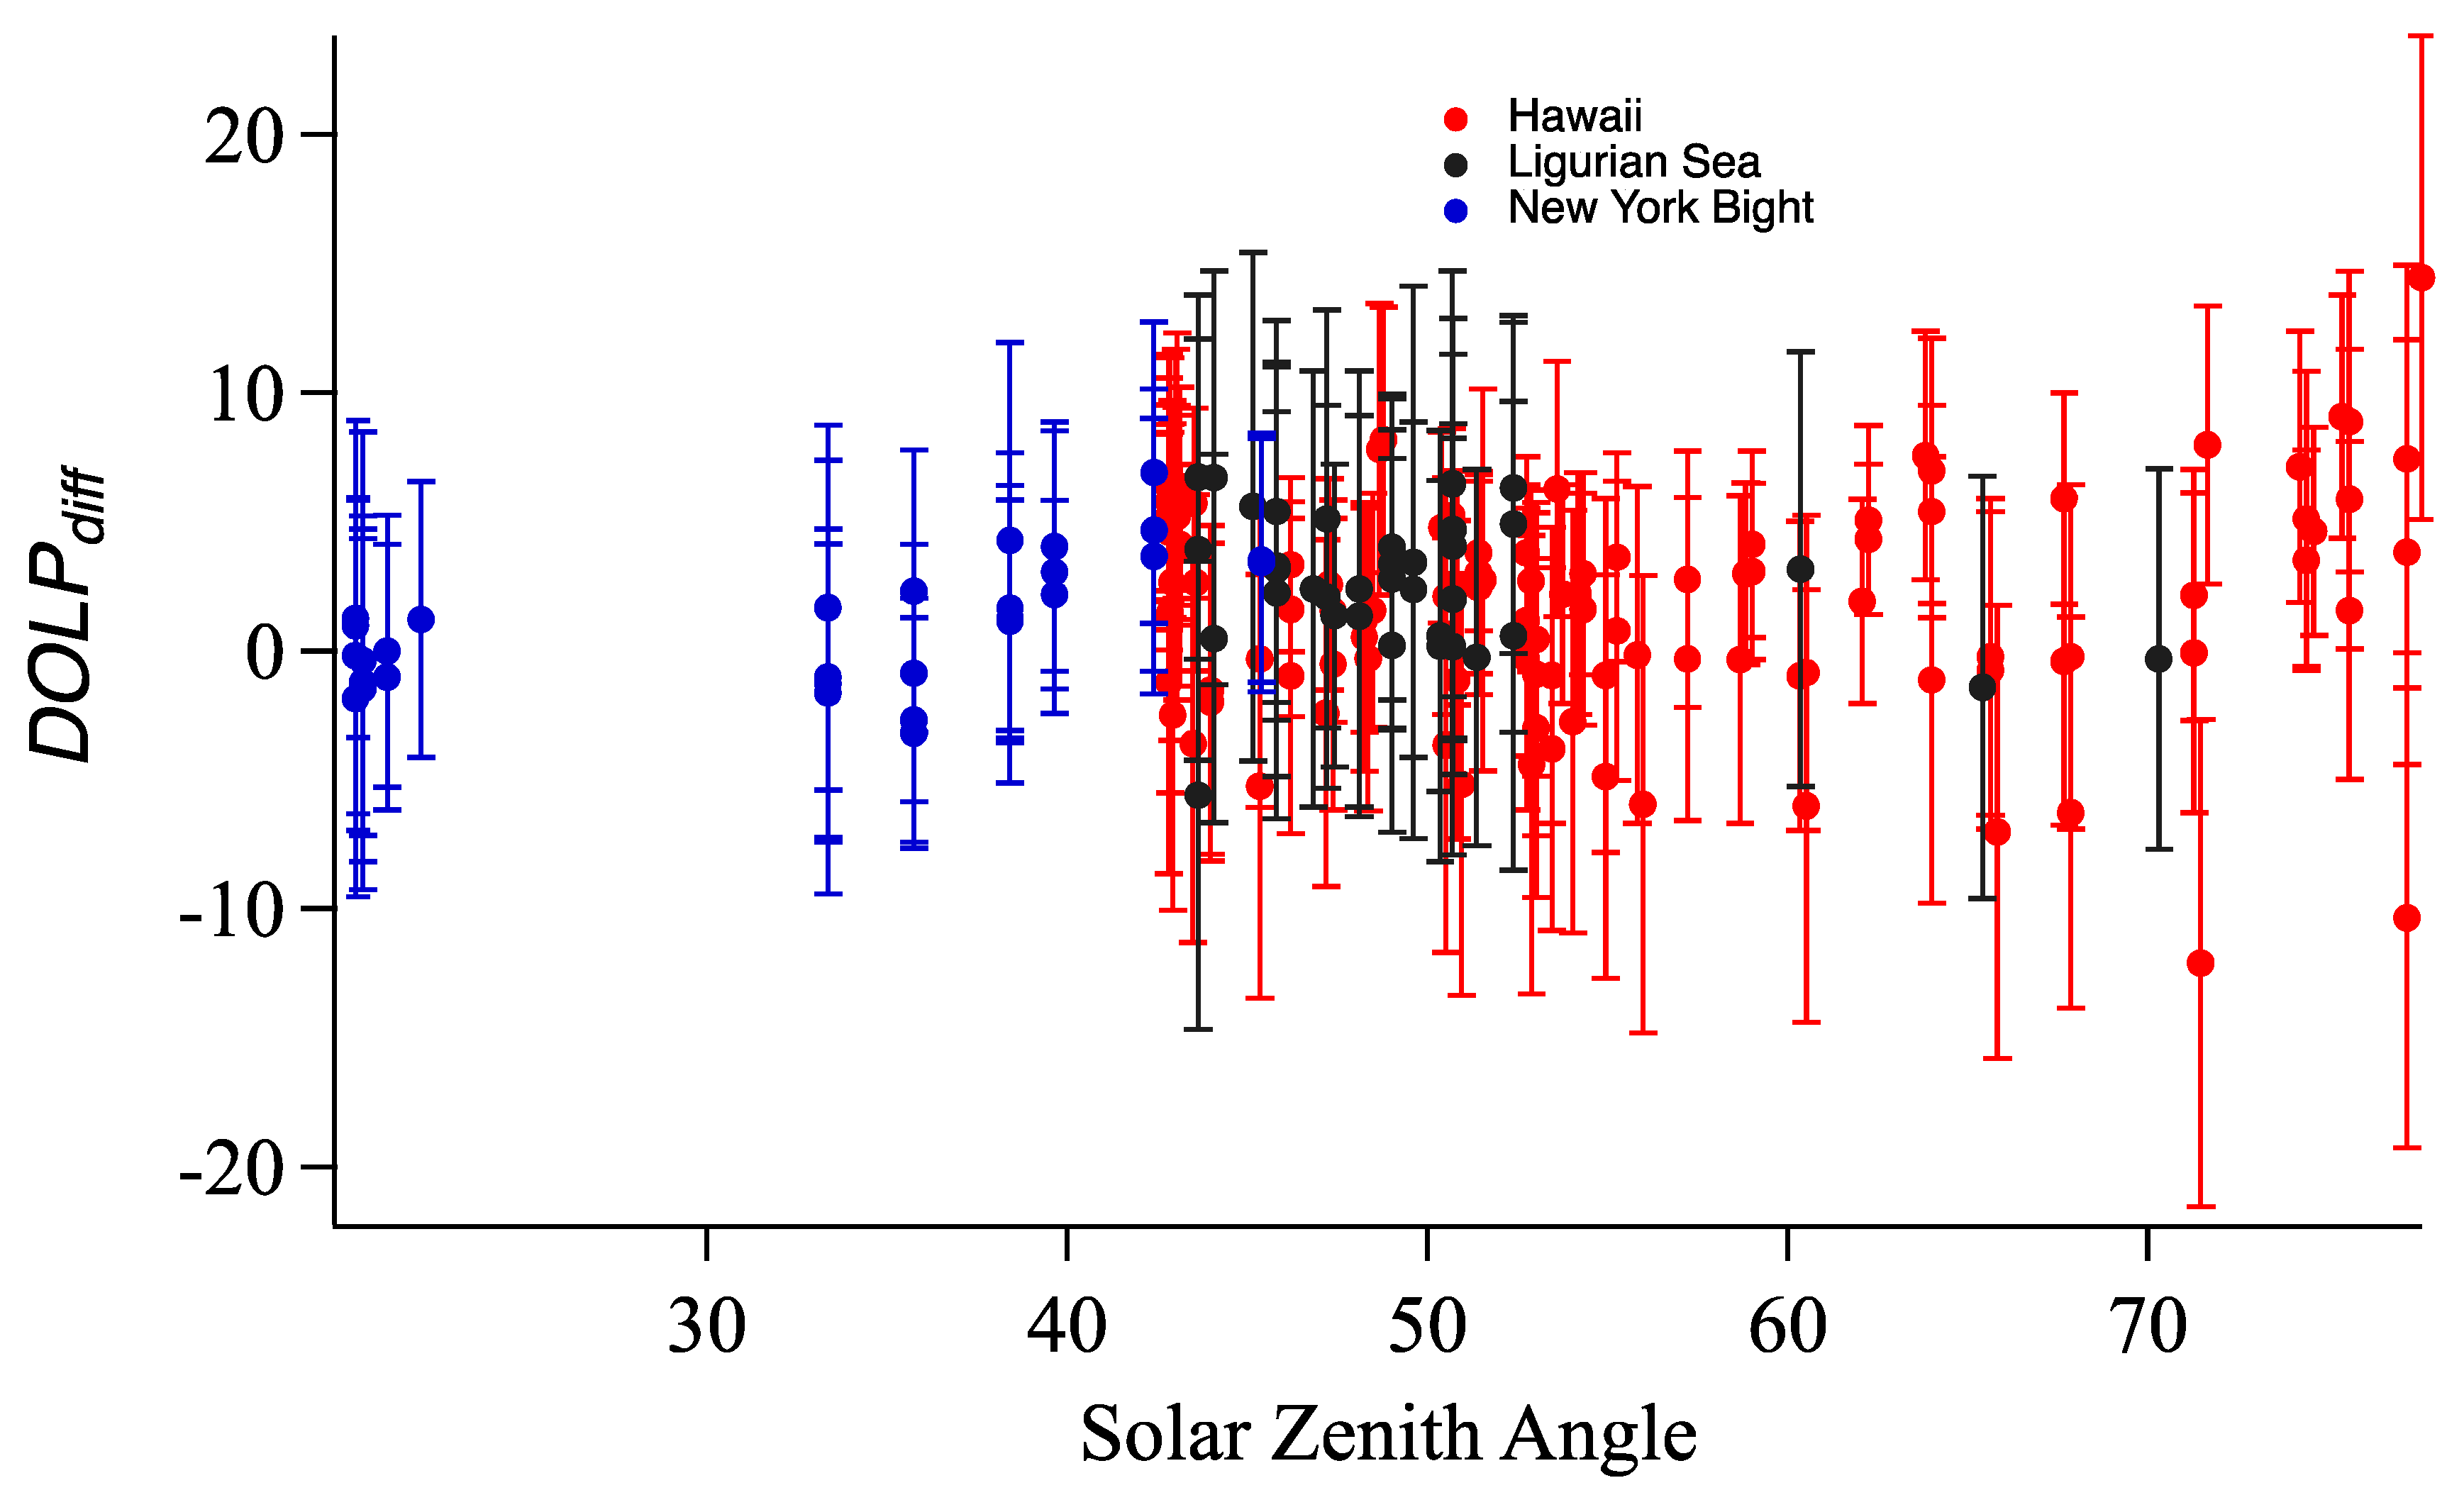
3.3. Comparison of DOLP Differences

For the first quantitative comparison of the RT model and the data, we looked at scatter plots comparing the measured and modeled DOLP (Figure 6). For each cruise, a best linear fit line was calculated, with the y-intercept = 0. The fit was calculated for all of the data, as well as the data inside the Snell’s circle; however, the calculated slopes were not significantly different, so we will discuss only the fit for the total image. The slopes were 0.94 (±0.002, r2 = 0.81), 0.88 (±0.006, r2 = 0.84), and 0.82 (±0.008, r2 = 0.76) for Hawaii, New York Bight, and Ligurian Sea, respectively.
Because the DOLP was significantly overestimated in the Ligurian Sea data, the alternative normalized Mueller matrix Mod-V-F (ρ = 0.30) was tried, with all other parameters the same, resulting in a slope of 1.20 (± 0.009, r2 = 0.656); we concluded that the depolarization of 0.3 was too strong. The true average Mueller matrix for this location could be somewhere between the two we used.
The correlation between DOLPdiff and several environmental parameters was investigated. In Figure 7, we show the DOLPdiff variation with solar zenith angle. In this figure, the mean DOLPdiff was calculated for each data image, along with the standard deviation (shown as error bars). There was no trend in the data; however, there does appear to have been a slight increase in the magnitude of the deviation at solar zenith angles greater than 70°. In general though, in almost all cases, the mean DOLPdiff was within one standard deviation of zero.
In Figure 8, we look at the DOLPdiff dependence on ct and ct/at. While there was no clear trend in DOLPdiff with ct, a slight trend occurred as a function of ct/at. Low values of ct/at (more absorption, less multiple scattering) had a slightly larger value of DOLPdiff, while DOLPdiff tended towards 0 with larger values of ct/at (more multiple scattering). However, the mean DOLPdiff was less than 5% for almost all cases, and this was within the measurement uncertainty of these instruments in the field.
Finally, in Figure 9, we look at the DOLPdiff as a function of bbt/bt (bbt/bt is the fraction of total scattering which was in the backwards direction, i.e., scattering angles from 90° to 180°). As bbt/bt increased, DOLPdiff appeared slightly higher, indicating less agreement at higher values of bbt/bt. Low values of bbt/bt were indicative of a low refractive index, phytoplankton-dominated environment, while higher values of bbt/bt indicated an environment with other higher refractive index particles, perhaps sediment. V-F was based on measurements in a variety of environments (clear ocean water to more turbid coastal water); however, measurements of the Mueller matrix of phytoplankton cultures also agreed with V-F. It has often been stated that the polarization resulting from higher index particles is less than V-F (i.e., larger depolarization at a 90° scattering angle) [32]. It is probably the case in our data set, that as the bbt/bt ratio increases, the S12 and S21 elements of the Mueller matrix should also decrease in an absolute value sense, but not as much of a decrease as used in Mod-V-F, where the decrease in this matrix would have caused a significant negative DOLPdiff.

3.4. Comparison of Q/I and U/I Differences

Rather than calculating DOLP, we could also show the difference between the model result for Q/I and U/I versus the data, shown in Figure 10 for the Ligurian Sea case. This case is shown because it was neither the best result, which was for Hawaii, nor the worse, which was New York Bight. The advantage of DOLP, and the reason most of the results are presented for this parameter, is that it is independent of the frame of reference, thus small errors in locating the solar plane in each image cause smaller differences in the comparison. Q/I and U/I comparisons are with respect to the frame of reference and depend on correctly locating the solar plane in the image, hence the comparison is not quite as good between the model and data result as with the DOLP. The line fits had a slope of 0.66 (±0.010, r2 = 0.70) for Q/I and 0.71 (±0.013, r2 = 0.67) for U/I. The fact that the scatter is qualitatively the same in these graphs as in the DOLP figure can be simply understood since Q/I and U/I can be derived from a combination of the DOLP and the plane of polarization, χ . As mentioned earlier, χ is a very stable parameter in the upwelling light field. The spread in the data is slightly larger for U/I versus Q/I because U/I has stronger spatial gradients, and small rotations affect this parameter more than Q/I.

4. Conclusions

We have compared measurements of the polarization properties of the upwelling light field in the marine environment to radiative transfer models based on the measured inherent optical properties (IOPs) and an average normalized Mueller matrix for the scattering. For the Ligurian Sea and New York Bight data sets, the base RT model used the same volume scattering phase function (Petzold) and Mueller matrix (V-F) for the standard model, with the scattering and absorption coefficients as measured coincidently on location. For Hawaii, the IOPs were not measured, but were estimated based on an average Chl value of 0.1 mg/m3 at the measurement location. Even with the fixed scattering matrix parameters, on average, the DOLPdiff was less than 5%, and in almost every case was within one standard deviation of zero. Thus, to get more information, or discrimination, from the DOLP measurements, the uncertainty of the measured DOLP must be smaller than 5%, and the other parameters (scattering phase function, Mueller matrix, and absorption coefficient) need to be known well enough to constrain the DOLP model to this accuracy.
Some of the variability in our data was due to instrument noise (on the order of 2%); however, other noise was due to the variability in the environment resulting from the incident light field interacting with the wavy air–sea interface. This was more of a problem for the downwelling light field but was still evident in the upwelling light field. For remote sensing, this radiance (Stokes vector) would have been propagated through the (wavy) air–sea interface, which would introduce more noise.
The 5% agreement of the model with the data shows that the model will provide sufficient accuracy for correcting residual polarization effects in ocean color instruments. However, more work must be done at improving the measurement accuracy of the instrumentation if the goal is to be able to use polarization effects to characterize (and differentiate with respect to) the physical properties of the suspended particles other than c/a.

Author Contributions

Data curation, K.J.V., M.S.T., and J.-F.B.; Formal analysis, A.C.R.G. and H.R.G.; Funding acquisition, K.J.V.; Methodology, A.C.R.G., K.J.V., and H.R.G.; Software, A.C.R.G. and H.R.G.; Supervision, K.J.V.; Writing—original draft, A.C.R.G., K.J.V., and H.R.G.; Writing—review and editing, A.C.R.G., K.J.V., H.R.G., and M.S.T.

Funding

This work was supported by NASA under grants NNX08AH93A and NNX14AP63G (Voss), and the NASA PACE Science Team (Twardowski), and by NOAA under grant NA150AR4320064. The BP’09 cruise (Ligurian Sea) was funded by the NATO Undersea Research Centre.

Acknowledgments

Scott Freeman, Luke Logan, Puru Bhandari, and Nordia Souaidia are thanked for their technical assistance in the field and with the instrumentation and data reduction.

Conflicts of Interest

The authors declare no conflict of interest. The founding sponsors had no role in the design of the study; in the collection, analyses, or interpretation of data; in the writing of the manuscript, or in the decision to publish the results.

References

  1. Waterman, T.H. Underwater light and orientation of animals. In Optical Aspects of Oceanography; Jerlov, N.G., Nielsen, E.S., Eds.; Academic Press: New York, NY, USA, 1974; pp. 415–443. ISBN 0123849500. [Google Scholar]
  2. Loisel, H.; Duforet, L.; Dessailly, D.; Chami, M.; Dubuisson, P. Investigation of the variations in the water leaving polarized reflectance from the polder satellite data over two biogeochemical contrasted oceanic areas. Opt. Express 2008, 16, 12905–12918. [Google Scholar] [CrossRef] [PubMed]
  3. Cronin, T.W.; Shashar, N.; Caldwell, R.L.; Marshall, N.; Cheroske, A.G.; Chiou, T.H. Polarization vision and its role in biological signaling. Int. Comp. Biol. 2003, 43, 549–558. [Google Scholar] [CrossRef] [PubMed]
  4. Mishchenko, M.I.; Cairns, B.; Kopp, G.; Schueler, C.F.; Fafaul, B.A.; Hansen, J.E.; Hooker, R.J.; Itchkawich, T.; Maring, H.B.; Travis, L.D. Accurate monitoring of terrestrial aerosols and total solar irradiance: Introducing the glory mission. Bull. Am. Meteorol. Soc. 2007, 88, 677–691. [Google Scholar] [CrossRef]
  5. Tonnizio, A.; Gilerson, A.; Harmel, T.; Ibrahhim, A.; Chowdhary, J.; Gross, B.; Moshary, F.; Ahmed, S.; Chami, M. Importance of the polarization in the retrieval of oceanic constituents from the remote sensing reflectance. J. Geophys. Res. 2007, 112, C05026. [Google Scholar] [CrossRef]
  6. Ibrahim, A.; Gilerson, A.; Chowdhary, J.; Ahmed, S. Retrieval of macro- and micro-physical properties of oceanic hydrosols from polarimetric observations. Remote Sens. Environ. 2016, 186, 548–566. [Google Scholar] [CrossRef] [Green Version]
  7. Chami, M.; Santer, R.; Dilligeard, E. Radiative transfer model for the computation of radiance and polarization in an ocean-atmosphere system: Polarization properties of suspended matter for remote sensing. Appl. Opt. 2001, 40, 2398–2416. [Google Scholar] [CrossRef] [PubMed]
  8. Gordon, H.R.; Du, T.; Zhang, T. Atmospheric correction of ocean color sensors: Analysis of the effects of residual instrument polarization sensitivity. Appl. Opt. 1997, 36, 6938–6948. [Google Scholar] [CrossRef] [PubMed]
  9. Meister, G.; Kwiatkowska, E.J.; Franz, B.A.; Patt, F.S.; Feldman, G.C.; McClain, C.R. Moderate-resolution imaging spectroradiometer ocean color polarization correction. Appl. Opt. 2005, 44, 5524–5535. [Google Scholar] [CrossRef] [PubMed]
  10. Voss, K.J. Electro-optic camera system for measurement of the underwater radiance distribution. Opt. Eng. 1989, 28, 241–247. [Google Scholar] [CrossRef]
  11. Voss, K.J.; Chapin, A.L. Upwelling radiance distribution camera system, NURADS. Opt. Express 2005, 13, 4250–4262. [Google Scholar] [CrossRef] [PubMed]
  12. Voss, K.J. Use of the radiance distribution to measure the optical absorption coefficient in the ocean. Limnol. Oceanogr. 1989, 34, 1614–1622. [Google Scholar] [CrossRef] [Green Version]
  13. Voss, K.J.; Morel, A.; Antoine, D. Detailed validation of the bidirectional effect in various case 1 waters for application to ocean color imagery. Biogeosciences 2007, 4, 781–789. [Google Scholar] [CrossRef]
  14. Gleason AC, R.; Voss, K.J.; Gordon, H.R.; Twardowski, M.; Sullivan, J.; Trees, C.; Weidemann, A.; Berthon, J.-F.; Clark, D.; Lee, Z.-P. Detailed validation of the bidirectional effect in various case I and case II waters. Opt. Express 2012, 20, 7630–7645. [Google Scholar] [CrossRef] [PubMed]
  15. Voss, K.J.; Souaidia, N. Polrads: Polarization radiance distribution measurement system. Opt. Express 2010, 18, 19672–19680. [Google Scholar] [CrossRef] [PubMed]
  16. Bhandari, P.; Voss, K.J.; Logan, L. An instrument to measure the downwelling polarized radiance distribution in the ocean. Opt. Express 2011, 19, 17609–17620. [Google Scholar] [CrossRef] [PubMed]
  17. Hoejerslev, N.K.; Aas, E. Spectral irradiance, radiance, and polarization in blue western Mediterranean waters. In Proceedings of the Ocean Optics XIII, Halifax, NS, Canada, 6 February 1997; Volume 2693. [Google Scholar] [CrossRef]
  18. Tonizzo, A.; Zhou, J.; Gilerson, A.; Twardowski, M.S.; Gray, D.J.; Arnone, R.A.; Gross, B.M.; Moshary, F.; Ahmed, S.A. Polarized light in coast waters: Hyperspectral and multiangular analysis. Opt. Express 2009, 17, 5666–5682. [Google Scholar] [CrossRef] [PubMed]
  19. Gilerson, A.; Zhou, J.; Oo, M.; Chowdhary, J.; Gross, B.M.; Moshary, F.; Ahmed, S. Retrieval of chlorophyll fluorescence from reflectance spectra through polarization discrimination: Modeling and experiments. Appl. Opt. 2006, 45, 5568–5581. [Google Scholar] [CrossRef] [PubMed]
  20. Morel, A.; Antoine, D.; Gentili, B. Bidirectional reflectance of oceanic waters: Accounting for raman emission and varying particle scattering phase function. Appl. Opt. 2002, 41, 6289–6306. [Google Scholar] [CrossRef] [PubMed]
  21. Lee, Z.P.; Du, K.; Voss, K.J.; Zibordi, G.; Lubac, B.; Arnone, R.; Weidemann, A. An inherent-optical-property-centered approach to correct the angular effects in water-leaving radiance. Appl. Opt. 2011, 50, 3155–3167. [Google Scholar] [CrossRef] [PubMed]
  22. Bohren, C.F.; Huffman, D.R. Absorption and Scattering of Light by Small Particles; John Wiley and Sons: New York, NY, USA, 1983; ISBN 9783527618156. [Google Scholar]
  23. Ivanoff, A.; Waterman, T.H. Elliptical polarization of submarine illumination. J. Mar. Res. 1958, 16, 255–282. [Google Scholar]
  24. Gordon, H.R.; Ding, K. Self-shading of in-water optical instruments. Limnol. Oceanogr. 1992, 37, 491–500. [Google Scholar] [CrossRef] [Green Version]
  25. Mobley, C.D.; Gentili, B.; Gordon, H.R.; Jin, Z.H.; Kattawar, G.W.; Morel, A.; Reinersman, P.; Stamnes, K.; Stavn, R.H. Comparison of numerical-models for computing underwater light fields. Appl. Opt. 1993, 32, 7484–7504. [Google Scholar] [CrossRef] [PubMed]
  26. Teillet, P.M. Rayleigh optical depth comparisons from various sources. Appl. Opt. 1990, 29, 1897–1900. [Google Scholar] [CrossRef] [PubMed]
  27. Pegau, S.; Zaneveld JR, V.; Mitchell, B.G.; Mueller, J.L.; Kahru, M.; Wieland, J.; Stramska, M. Inherent optical properties: Instruments, characterizations, field measurements, and data analysis protocols. In Ocean Optics Protocols for Satellite Ocean Color Sensor Validation, Revision 4, Volume IV; Mueller, J.L., Fargion, G.S., McClain, C.R., Eds.; NASA/TM-2003-21621/Rev4-Vol IV; Goddard Space Flight Center: Greenbelt, MD, USA, 2002. [Google Scholar]
  28. Morel, A.; Gentili, B. Diffuse reflectance of oceanic waters: Its dependence on sun angle as influenced by the molecular scattering contribution. Appl. Opt. 1991, 30, 4427–4438. [Google Scholar] [CrossRef] [PubMed]
  29. Petzold, T.J. Volume Scattering Functions for Selected Ocean Waters; Scripps Institution of Oceanography Ref. 72–78; University of California: San Diego, CA, USA, 1972; 79p. [Google Scholar]
  30. Voss, K.J.; Fry, E.S. Measurement of the muller matrix for ocean water. Appl. Opt. 1984, 23, 4427–4439. [Google Scholar] [CrossRef] [PubMed]
  31. Fry, E.S.; Voss, K.J. Measurement of the Mueller matrix for phytoplankton. Limnol. Oceanogr. 1985, 30, 1322–1326. [Google Scholar] [CrossRef] [Green Version]
  32. Volten, H.; Haan, J.F.; Hovenier, J.W.; Schreurs, R.; Vassen, W.; Dekker, A.G.; Hoogenboom, H.J.; Charlton, F.; Wouts, R. Laboratory measurements of angular distributions of light scattered by phytoplankton and silt. Limnol. Oceanogr. 1998, 43, 1180–1197. [Google Scholar] [CrossRef] [Green Version]
  33. Svensen, O.; Stamnes, J.J.; Kildemo, M.; Aas LM, S.; Erga, S.R.; Frette, O. Mueller matrix measurements of algae with different shape and size distributions. Appl. Opt. 2011, 50, 5149–5157. [Google Scholar] [CrossRef] [PubMed]
  34. Adams, J.T.; Aas, E.; Hojerslev, N.K.; BLundgren, B. Comparison of radiance and polarization values observed in the mediterranean sea and simulated in a monte carlo model. Appl. Opt. 2002, 41, 2724–2733. [Google Scholar] [CrossRef] [PubMed]
  35. Kuik, F.; Stammes, P.; Hovenier, J.W. Experimental determination of scattering matrices of water droplets and quartz particles. Appl. Opt. 1991, 30, 4872–4881. [Google Scholar] [CrossRef] [PubMed]
  36. Fry, E.S.; Kattawar, G.W. Relationships between elements of the Stokes matrix. Appl. Opt. 1981, 20, 2811–2814. [Google Scholar] [CrossRef] [PubMed]
  37. Hovenier, J.W.; van de Hulst, H.C.; van der Mee, C.V.M. Conditions for the elements of the scattering matrix. Astron. Astrophys. 1986, 157, 301–310. [Google Scholar]
  38. Liu, Y.; Voss, K.J. Polarized radiance distribution measurements of skylight: II. Experiment and data. Appl. Opt. 1997, 36, 8753–8764. [Google Scholar] [CrossRef] [PubMed]
  39. Chowdhary, J.; Cairns, B.; Travis, L.D. Contribution of water-leaving radiances to multiangle, multispectral polarimetric observations over the open ocean: Bio-optical model results for case 1 waters. Appl. Opt. 2006, 45, 5542–5567. [Google Scholar] [CrossRef] [PubMed]
  40. Voss, K.J.; Gleason, A.C.R.; Gordon, H.R.; Kattawar, G.W.; You, Y. Observation of non-principal plane neutral points in the in-water upwelling polarized light field. Opt. Express 2011, 19, 5942–5952. [Google Scholar] [CrossRef] [PubMed]
  41. You, Y.; Tonizzo, A.; Gilerson, A.A.; Cummings, M.E.; Brady, P.; Sullivan, J.M.; Twardowski, M.S.; Dierssen, H.M.; Ahmed, S.A.; Kattawar, G. Measurements and simulations of polarization states of understeer light in clear oceanic waters. Appl. Opt. 2011, 50, 4873–4893. [Google Scholar] [CrossRef]
  42. Timofeyeva, V.A. Degree of polarization of light in turbid media. Isvestiya Akademii Nauk Sssr Fisika Atmosfery I. Okeana 1970, 6, 513–522. [Google Scholar]
Figure 1. Non-zero, normalized Muller matrix, S, elements for Rayleigh scattering (blue), V-F (red), and Mod-V-F (black).
Applsci 08 02683 g001
Figure 2. Comparison of the Stokes vector components I, Q/I, U/I, DOLP, and χ for clear water. Shown are the calculation for single scattering (left column), RT model (center column), and data (right column). The data were taken on 2 December 2005, at 20:46 UTC off of Oahu, Hawaii. The conditions were: SZA = 48°, 442 nm, Chl = 0.1 mg/m3, ct = 0.1 m−1 (calculated from Chl as described in text), ω0 = 0.8, and clear skies. The intensity for the model was adjusted to match the data at nadir. Each image is a fisheye projection. Nadir is in the center of the circle, nadir angle is linearly proportional to radius from center. The angle of the Snell’s circle (48° nadir angle) is shown in as the white circle. The principal plane (plane containing the anti-solar point and the nadir direction) is a vertical line through the center of the image. The anti-solar direction is towards the bottom of the image, and the sun direction is towards the top of the image.
Applsci 08 02683 g002
Figure 3. Similar to Figure 2, but for a case with more turbid water. The data were taken on 22 March 2009, at 9:40 UTC in the Ligurian Sea. The conditions were: SZA = 48°, 550 nm, ct = 0.44 m−1, ω0 = 0.82, and clear skies. The figure geometry is the same as Figure 2.
Applsci 08 02683 g003
Figure 4. Maximum DOLP in upwelling radiance distribution vs ct (a) and ct/at (b). The symbol legend is the same for both graphs. Filled circles represent the maximum DOLP in the total upwelling field, while the open circles represent the maximum DOLP in the portion of the upwelling light field inside the Snell’s circle (nadir angle less than 48°).
Applsci 08 02683 g004
Figure 5. Nadir DOLP as a function of solar zenith angle and ct/at, computed from the RT model. Contours are lines of constant DOLP.
Applsci 08 02683 g005
Figure 6. Scatter plots of DOLP for model versus data, separated by cruise. Also shown is the best fit line (with y-intercept = 0) (black line) and 1:1 line (red line). The crosses correspond to data outside the Snell’s circle (nadir angle larger than 48°), and the dots to points inside the Snell circle. V-F was used in the model for (ac), Mod-V-F was used for (d).
Applsci 08 02683 g006
Figure 7. DOLPdiff vs solar zenith angle for each data image. The error bars are ± the standard deviation of the mean.
Applsci 08 02683 g007
Figure 8. DOLPdiff as a function of ct and ct/at. Color code of data is given in Figure 7. (a) shows DOLPdiff vs ct, while (b) is DOLPdiff vs ct/at.
Applsci 08 02683 g008
Figure 9. DOLPdiff as a function of bbt/bt. There were no bbt measurements during the Hawaii data collection.
Applsci 08 02683 g009
Figure 10. Scatter plots of Q/I (a) and U/I (b) for model versus data for the Ligurian Sea data set. Also shown is the best fit line between the model and data for each parameter (black line). The 1:1 line is shown in red.
Applsci 08 02683 g010
Table 1. Number, N, of reduced images used for model–data comparisons in each of the three datasets in each of four spectral bands. Note, the PolRADS and DPOL cameras used different filters with slightly different band centers; the center of each 10 nm-wide filter is listed in parenthesis.
ExperimentN ( λ nm)N ( λ nm)N ( λ nm)N ( λ nm)
Hawaii27 (436 nm)31 (486 nm)28 (526 nm)24 (548 nm)
Ligurian Sea9 (442 nm)9 (488 nm)13 (520 nm)14 (550 nm)
New York Bight7 (442 nm)8 (488 nm)9 (520 nm)7 (550 nm)

