Article

A Novel Design of Through-Hole Depth On-Machine Optical Measuring Equipment for Automatic Drilling and Riveting

1
School of Manufacturing Science and Engineering, Sichuan University, Chengdu 610065, China
2
Aerospace Research Institute of Materials and Processing Technology, China Academy of Launch Vehicle Technology, Beijing 100076, China
3
Energy Research Center of Lower Saxony (EFZN), 38640 Goslar, Germany
*
Author to whom correspondence should be addressed.
Appl. Sci. 2018, 8(12), 2671; https://doi.org/10.3390/app8122671
Submission received: 25 November 2018 / Revised: 10 December 2018 / Accepted: 13 December 2018 / Published: 18 December 2018
(This article belongs to the Special Issue Precision Dimensional Measurements)

Abstract

:

Featured Application

On-machine optical measuring process of through-hole depth for automatic drilling and riveting system.

Abstract

In the aerospace manufacturing industry, it is impossible to achieve precise and efficient automatic drilling and riveting for largescale composite board parts. The bottleneck is that the depth detection of rivet holes still relies on manual operation, which seriously affects the assembly efficiency and stability of composite board parts. In order to realize accurate and efficient on-machine automatic measurement for through holes in the automatic drilling and riveting process of largescale composite board parts, this paper presents a novel hole depth measuring device. Its mechanical structure is developed based on our newly designed measurement scheme and optical path, the purpose of which is to convert the hole depth data into displacement data of the probe motion. Its electrical hardware consists of three units: a laser transceiver unit to pick up laser spots; a displacement measuring unit to capture the probe movement in real time; and a driving unit to achieve motion control of the probe. Finally, the experimental results indicated that the proposed method and device are capable of performing automatic measurements for through-hole depth. In addition, factors affecting the measuring accuracy and stability of the device are initially analyzed and discussed, which lay a foundation for subsequent research on error compensation and probe calibration.

Graphical Abstract

1. Introduction

The aerospace manufacturing industry belongs to the field of high-end equipment manufacturing and requires a large number of high-tech technologies as technical support [1]. Among them, the precise and efficient assembly of largescale composite board parts is a representative technical difficulty in the aircraft assembly process [2]. Such parts typically exhibit complex curved surface structures, and their assembly requires extensive drilling and riveting operations [3]. It is worth noting that the depth of the rivet hole is different from the original design. This is because preparation processes such as bending, bonding, and solidification of the composite board parts cannot be controlled to perfection, resulting in mismatch in shape and thickness [4]. Therefore, it is especially necessary to adaptively adjust the length of the rivet, according to the actual size of the hole [5]. In other words, the automatic drilling and riveting manipulator first needs to measure the current hole depth, and then select a rivet with appropriate length for riveting operations.
However, there is currently no equipment that can automatically measure the depth of through holes. At present, the riveting of large composite board parts still relies on manual operations, which include hole depth measurement, rivet selection, and riveting [6]. It is worth noting that largescale aerospace composite parts often have thousands of holes that need to be riveted [7]. Manual riveting consumes a lot of manpower, is inefficient, and is prone to human error [8]. Therefore, there is the urgent need for a method or apparatus that will enable on-machine automatic measurement of through-hole depth, offering vital technical support to automatic drilling and riveting of largescale composite board parts.
In-depth research on hole parameter measurement can be roughly divided into the following categories:
(i) Detection and recognition of hole position and hole shape. Shetty et al. [9] proposed a hole detection method based on machine vision to test the cooling holes of fan blades in aero engines. They developed a testing system based on machine vision and laser detection that guarantees the quality of porous components. The system recognizes the appearance of measured parts to detect pore size and distance between adjacent holes on parts. It can recognize the bottom of holes using a laser detection system. The purpose of the system is to detect the distance between holes and the diameter of holes, but not the depth of the holes. Baeg et al. [10] studied the identification and positioning of threaded holes. In order to realize automatic assembly in the field of automotive manufacturing, they designed a set of automatic identification and positioning system for thread holes. This method adopts machine vision, auxiliary light-emitting diode (LED), and auxiliary positioning laser generator to identify the threaded hole and get its three dimensions (3D) coordinates. The purpose is to identify the location of the hole without measuring its specific parameters. Usamentiaga et al. [11] specialized in the study of non-destructive testing of holes in honeycomb sandwich panels. The whole panel was thermally imaged and image analyzed in order to obtain the position and shape information of the hole on the honeycomb sandwich panel. The hole extracted in this study is mainly a position parameter, and the integrity of the hole, but does not involve the extraction of hole depth parameters.
(ii) Hole quality inspection. Gong et al. [12] focused on the field of deep hole measurement. Aimed at holes with a large depth-to-diameter ratio, they proposed an internal structure detection method based on micro vision. Charge-coupled device (CCD) sensors and endoscopes are used to capture images of the hole structure and components, extract the curve from the image, and then detect the quality of the hole structure. This research realizes quality inspection of the inner connector of the micro hole, and provides a method for its detection. However, its main purpose is quality inspection. It does not pay attention to the measurement of the dimension parameters of the hole itself, and its measurement of displacement or distance is inadequate. Bernard, Flaherty and O’Connor [13] conducted studies on the field of quality measurement of holes. The object of this study was a pipe with small boreholes. The boreholes are usually through-holes, but excessive drilling may occasionally lead to damage. Therefore, a detection method was designed, in which a luminescent fiber is inserted into the tube and CCD is used to collect light signals outside the tube, in order to detect the permeability of the hole. The research object is a hose part, which does not involve mechanical parts of other materials such as metal materials, and its characteristics acquired are hole permeability and the integrity of parts. Zavyalov [14] proposed a high curvature optical imaging lens to obtain 3D shapes of pores. The proposed method can generate images and detect the quality of holes quickly. However, limited by the measuring principle and lens curvature, this system makes measuring holes with small aperture and long depth difficult, and it also cannot offer specific hole depth data.
(iii) Measurement of hole depth parameters. In order to achieve laser drilling of bones, Quest, Gayer and Hering [15] proposed a method to measure the hole depth of bone drilling by laser, which is applied to the field of oral implants. With laser triangulation and tomography, the actual position of laser ablation in bone can be calculated. This study provides an indirect method to measure the hole depth parameters of micro holes using optical systems. The measurement object is the skeleton, and the whole process needs to be combined with fault images for comprehensive analysis. Therefore, it cannot be directly applied to the rapid measurement of large mechanical parts, and cannot achieve through-hole depth measurement. Takeda et al. [16] developed a method that can obtain hole depth by using the fringe projection approach. To measure 3-D objects with large height discontinuities, they proposed a coaxial optical sensor system with a common image plane for pattern projection and observation. A grating pattern is constantly illuminated on the measuring object and the whole field of view is imaged back onto the CCD sensor through a specific optical path. The object then moves along the Co-image plane until it passes through. If the measured object has a hole, the fringe amplitude reaches its peak when the bottom and upper surfaces of the hole pass the Co-image. According to this feature, hole depth can be calculated by measuring the displacement of the object between the two peaks. The fringe projection approach can be used to measure not only hole depths, but also shapes of objects [17]. This study provides the possibility of simultaneously measuring of multiple hole depths. Even more, the fringe projection approach can be applied to complex measurement environments by using fiber optics [18]. However, since this method takes some time to perform a large number of calculations to obtain fringe amplitude peaks, it will have a slightly lower measurement efficiency, especially during online measurements. And the premise of this measurement method is that the measured hole needs to have a bottom surface. When it comes to a through hole, the fringe amplitude will only have one peak, which may make measuring through holes a little difficult. Lin, Powell and Jiang [19] carried out research in the field of real-time depth measurement of laser drilling. An optical system based on confocal principle was developed for laser drilling, which is used for real-time measurement of micro hole depth during laser drilling. The idea is to obtain the depth of laser drilling indirectly by obtaining the relevant parameters in the laser beam path. Similarly, Ho, Chiu and Chang [20] studied the relationship between the hole depth parameters of laser drilling and the intensity of plasma luminescence emitted during drilling. The above two methods focus on hole depth measurement during laser drilling, which are not suitable for depth measurement in other processes such as mechanical drilling.
The above methods are mainly aimed at the spatial position identification of holes, quality inspection of hole shape, or hole depth measurement for laser drilling. However, existing research on the depth measurement of through holes is lacking. Existing methods can only measure the depth of blind holes using laser measurements or machine vision, and it is impossible to measure the depth of through holes, especially in the case where the depth/diameter ratio is large. At present, there are no reports on methods and instruments for on-machine measurement of through-hole depth in the field of automatic drilling and riveting. In view of the above problems, this paper carried out research on the on-machine measurement of through-hole depth. A new measurement method is proposed, a corresponding laser light path and novel measuring device with optical sensor and grid-capacitance sensor is designed, and its prototype is fabricated.
The remainder of this paper is organized as follows: In Section 2, the optical path design, device design, and the measuring method design of the hole depth on-machine optical measuring equipment are described in detail. Section 3 shows the experimental testing process and discusses data processing and analysis results. Finally, this paper draws conclusions in Section 4 and looks forward to follow-up research.

2. Approach Description

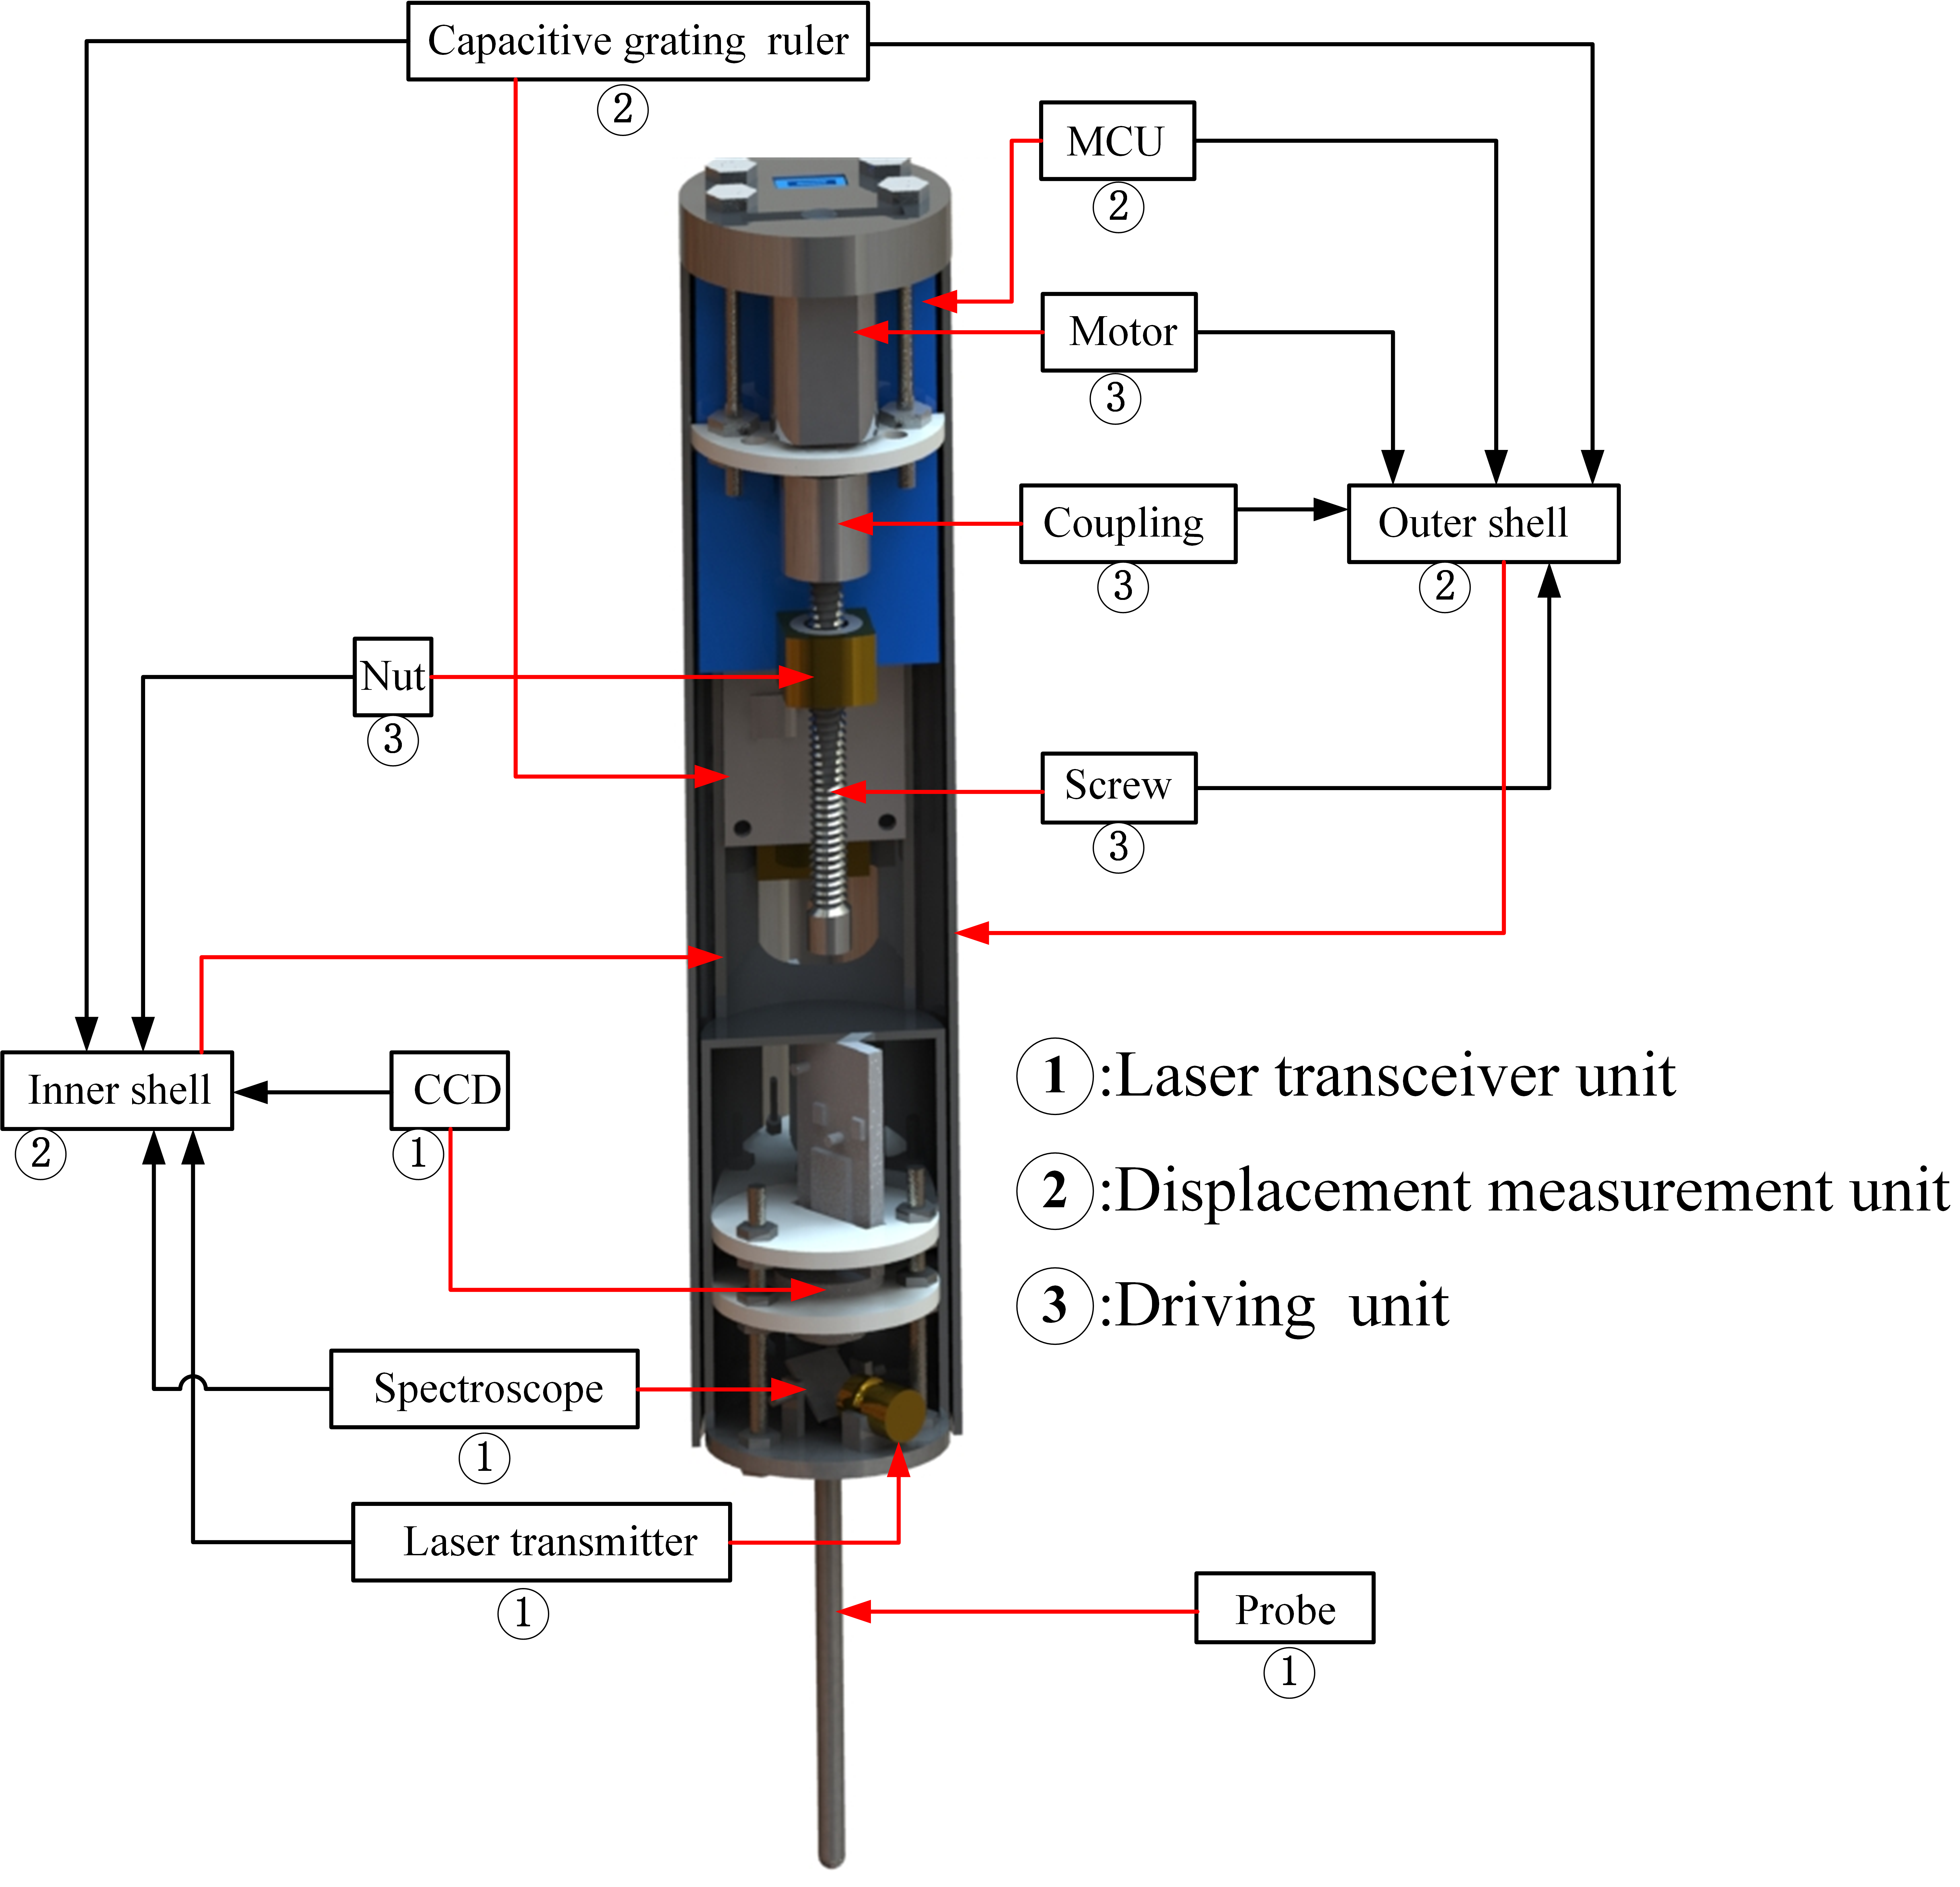
2.1. Measurement Scheme

In order to realize the measurement of through-hole depth, the measurement scheme is first designed and its overall workflow is introduced. As shown in Figure 1, the whole measurement process is divided into five steps:
The probe is in continuous movement during the measuring process. At the beginning of the measuring process, the device is first placed above the hole using mechanical equipment (e.g., mechanical arm, articulated arm-measuring machine); the axis of the device coincides with the axis of the hole. The direction of laser emission from the front of the probe is perpendicular to the axis of the probe. In Step 1, since the emitted laser beam is not projected onto the inner wall of the hole, the probe cannot sense the laser spot on the wall of the hole and continues to move downwards. In Step 2, the laser beam is even with the upper surface of the hole. As the probe continues to move downward, the laser beam is projected onto the wall of the hole and forms a laser spot. At this point, the sensor inside the probe detects the laser spot and immediately records the current position of the probe. In Step 3, the probe enters the hole, and continuously senses the laser spot signal and continue to feed downward [21]. In Step 4, the laser beam is even with the lower surface of the hole, and exits the hole. After that moment, the probe cannot sense the laser spot and immediately records its current position. The depth data of the through hole is obtained by the displacement difference of positions recorded in steps 2 and 4. In Step 5, the probe moves upward and returns to its initial position.

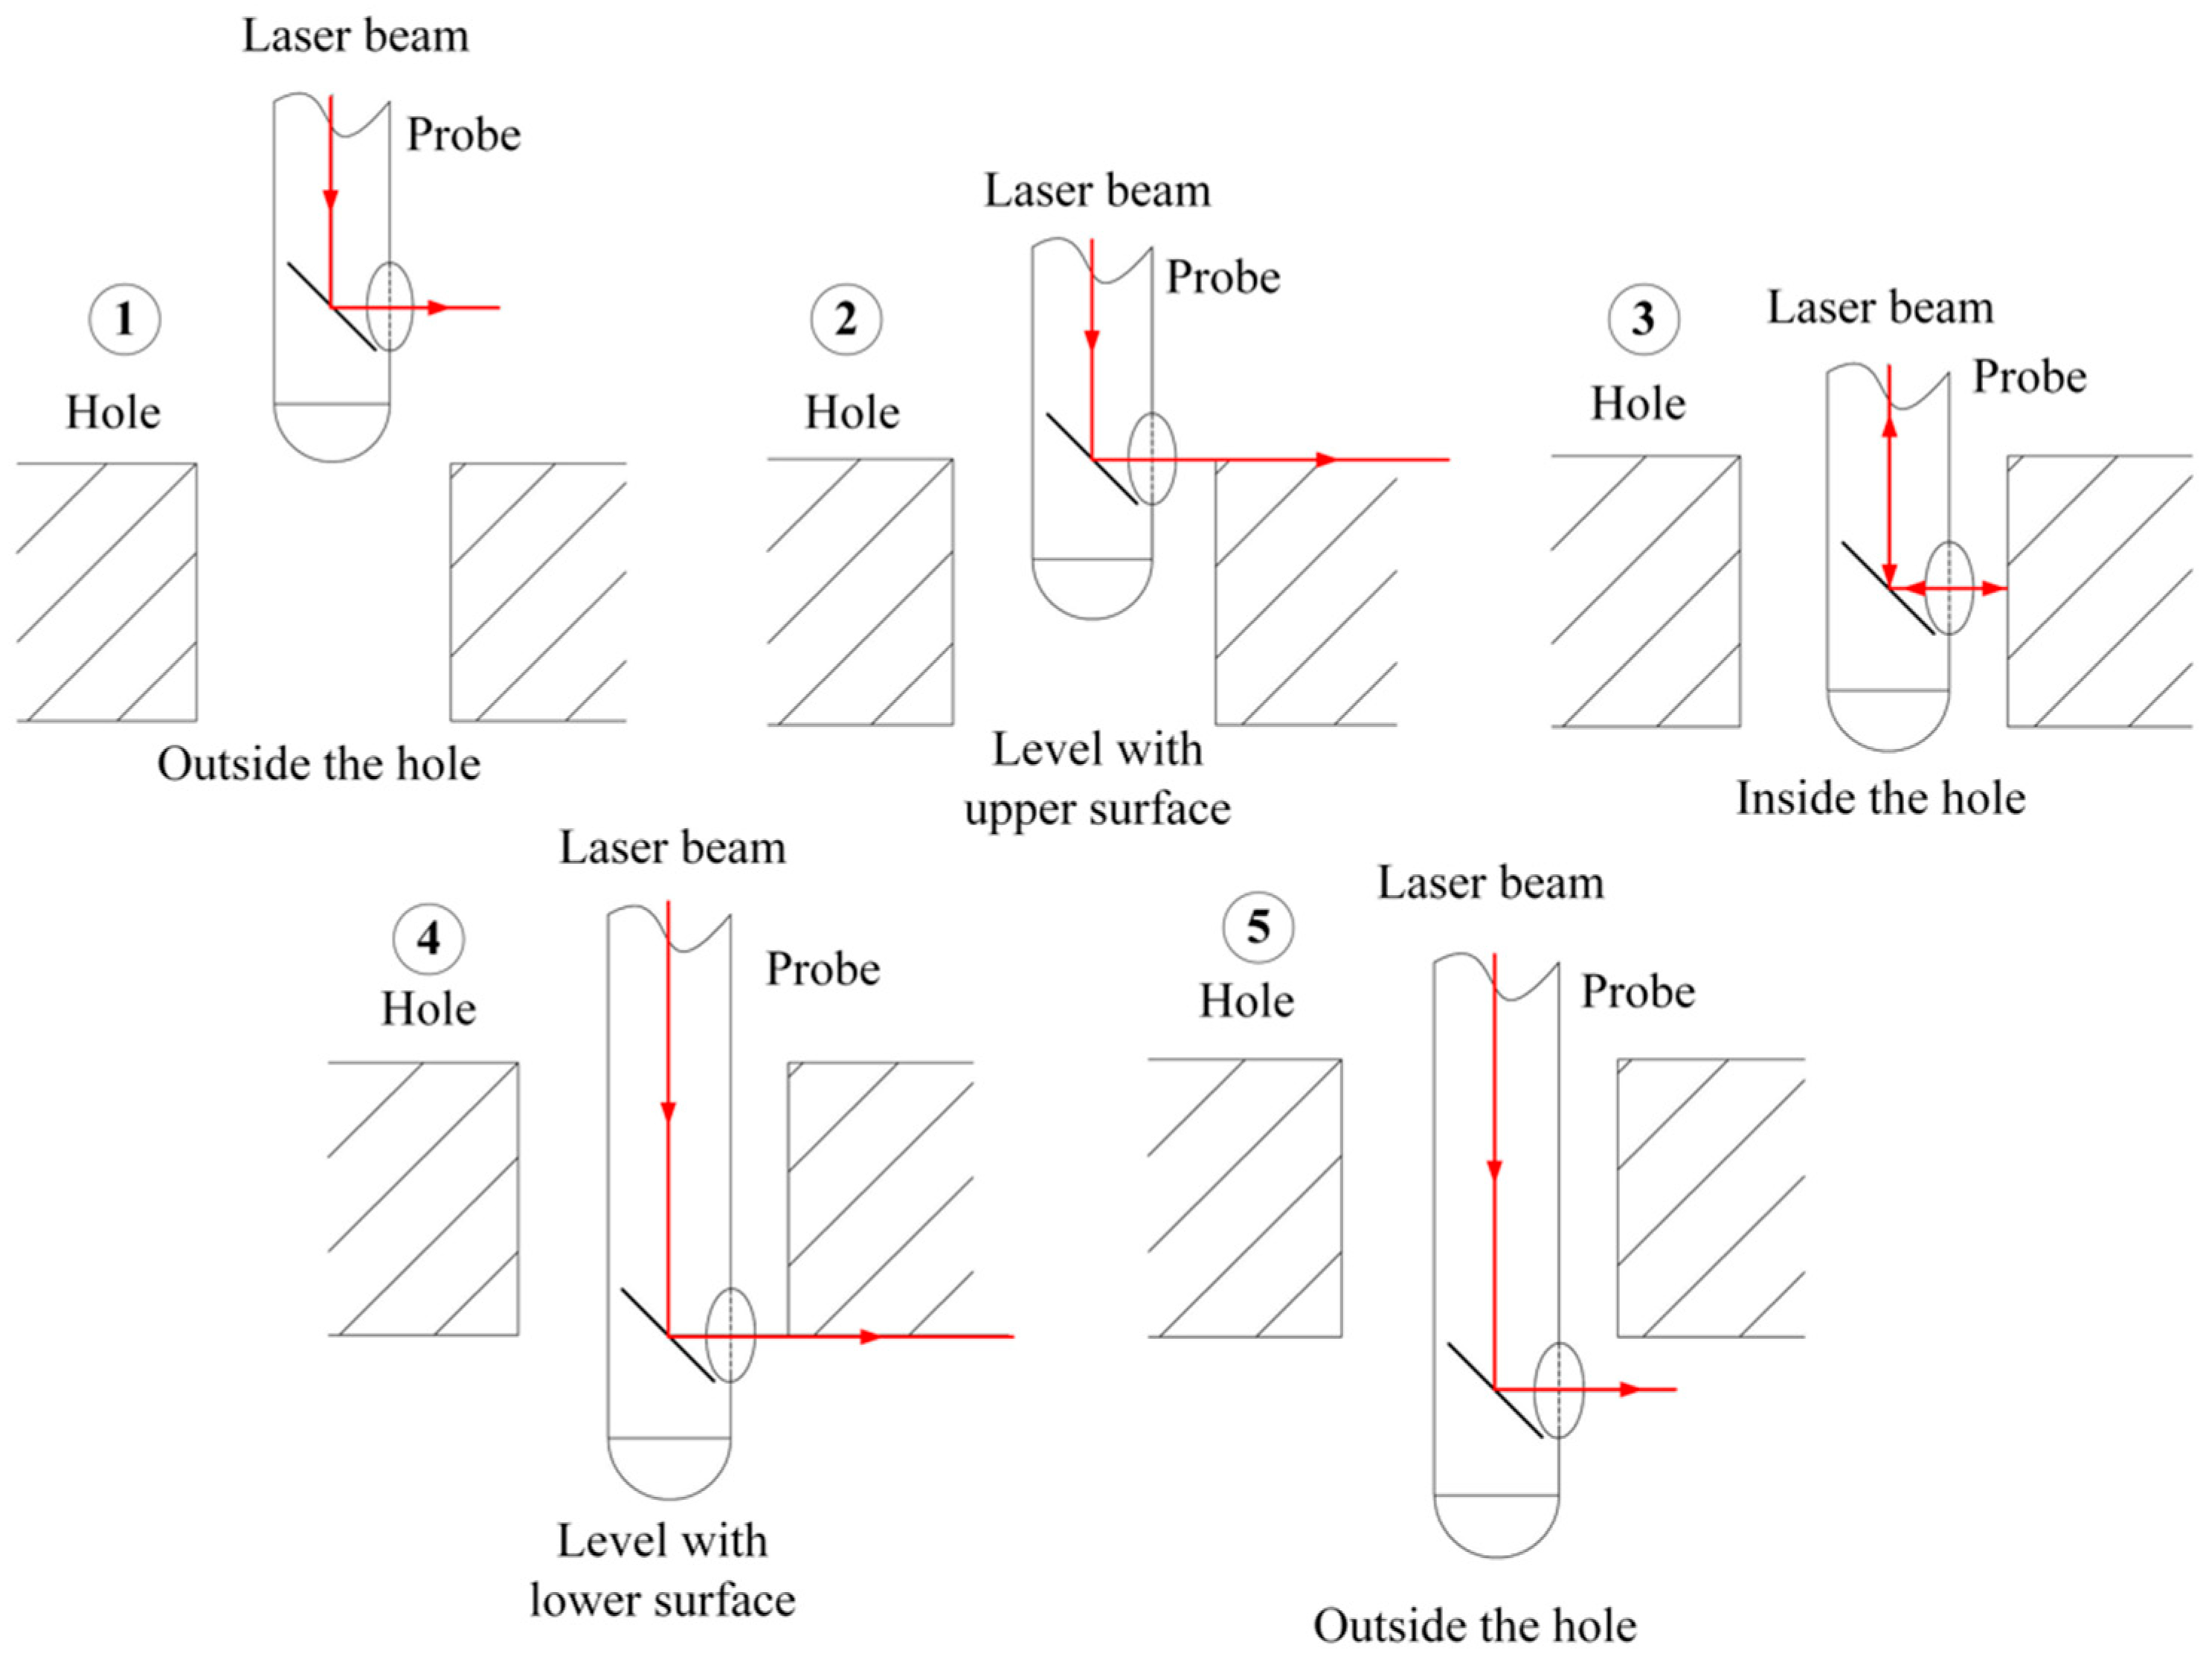
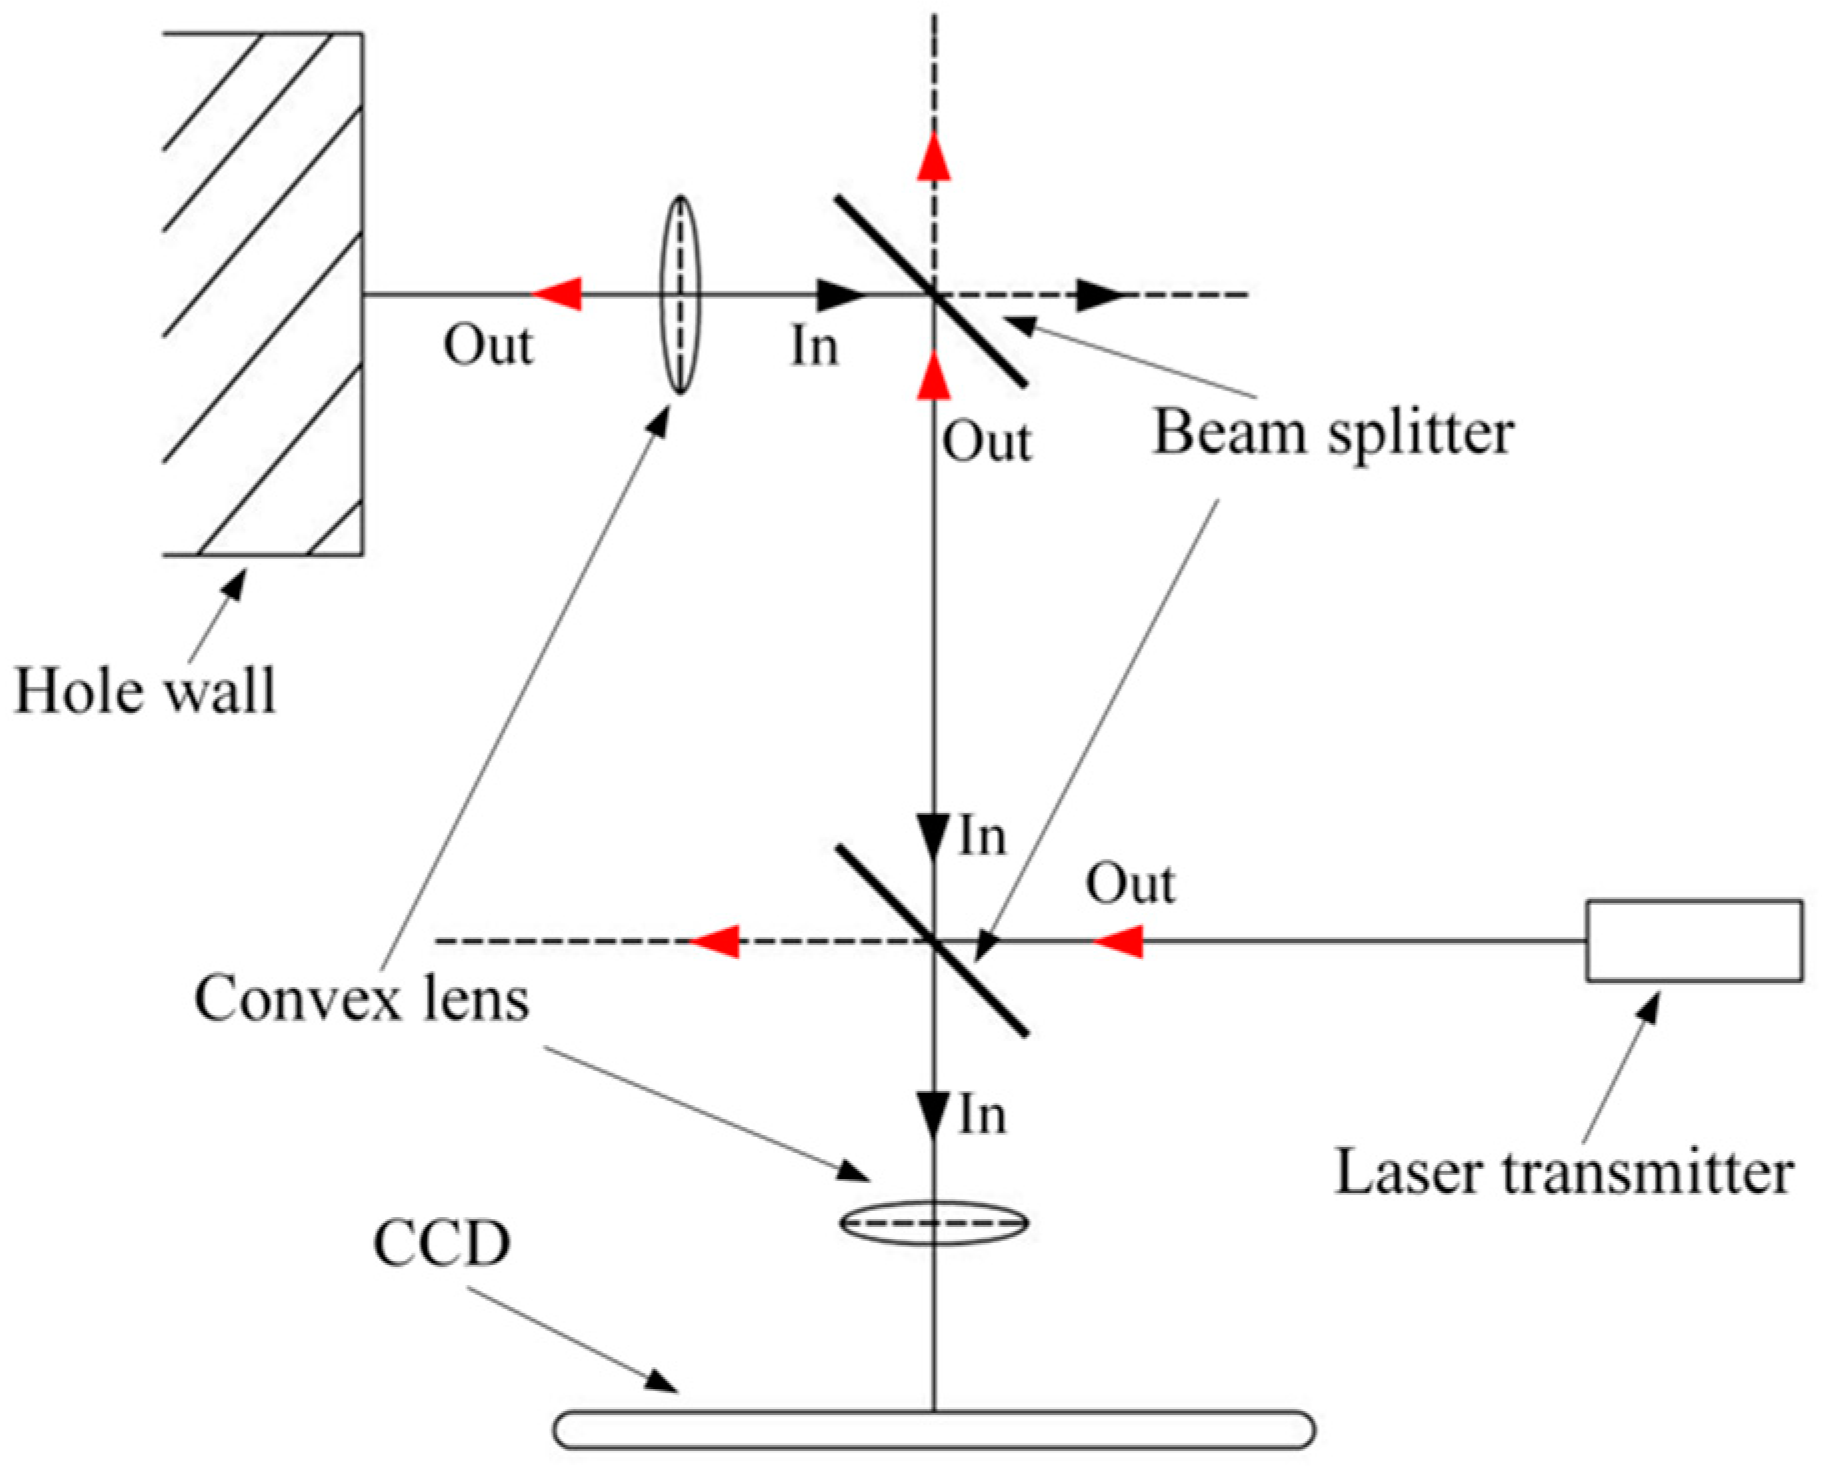
2.2. Optical Path Design

This section details how the laser signal of the device is projected from the laser transmitter onto the wall of the hole and ultimately reflected back to the CCD. Figure 2 shows the optical path designed for our measuring system. The laser emitted by the laser transmitter is at an angle of 45° to the plane of the beam splitter. Due to the working principle of the beam splitter, when the laser is directed at the beam splitter, half of the light is projected in the original direction, and the other half of the light is reflected [22]. Therefore, by using two parallel splitters, the laser beam emitted from the laser transmitter can be projected perpendicular to the wall of the measured hole. At this time, the laser beam reflected by the hole wall can also be projected onto the CCD through these two beam splitters. In order to converge the laser beam, which will gradually diverge in the projection process, a convex lens is placed at the laser exit end, as shown in Figure 2, and another one is placed in front of the CCD to focus the laser beam on it.
A problem in the process is that the diameter of the probe is only 2 mm, which cannot accommodate a laser transmitter with diameter of 6 mm. Therefore, the ultimate goal of the optical path design is to project the laser beam emitted from the laser transmitter onto the hole wall. Beyond that, the light reflected back from the wall of the hole can be collected by the CCD through this optical path and processed in the next step.

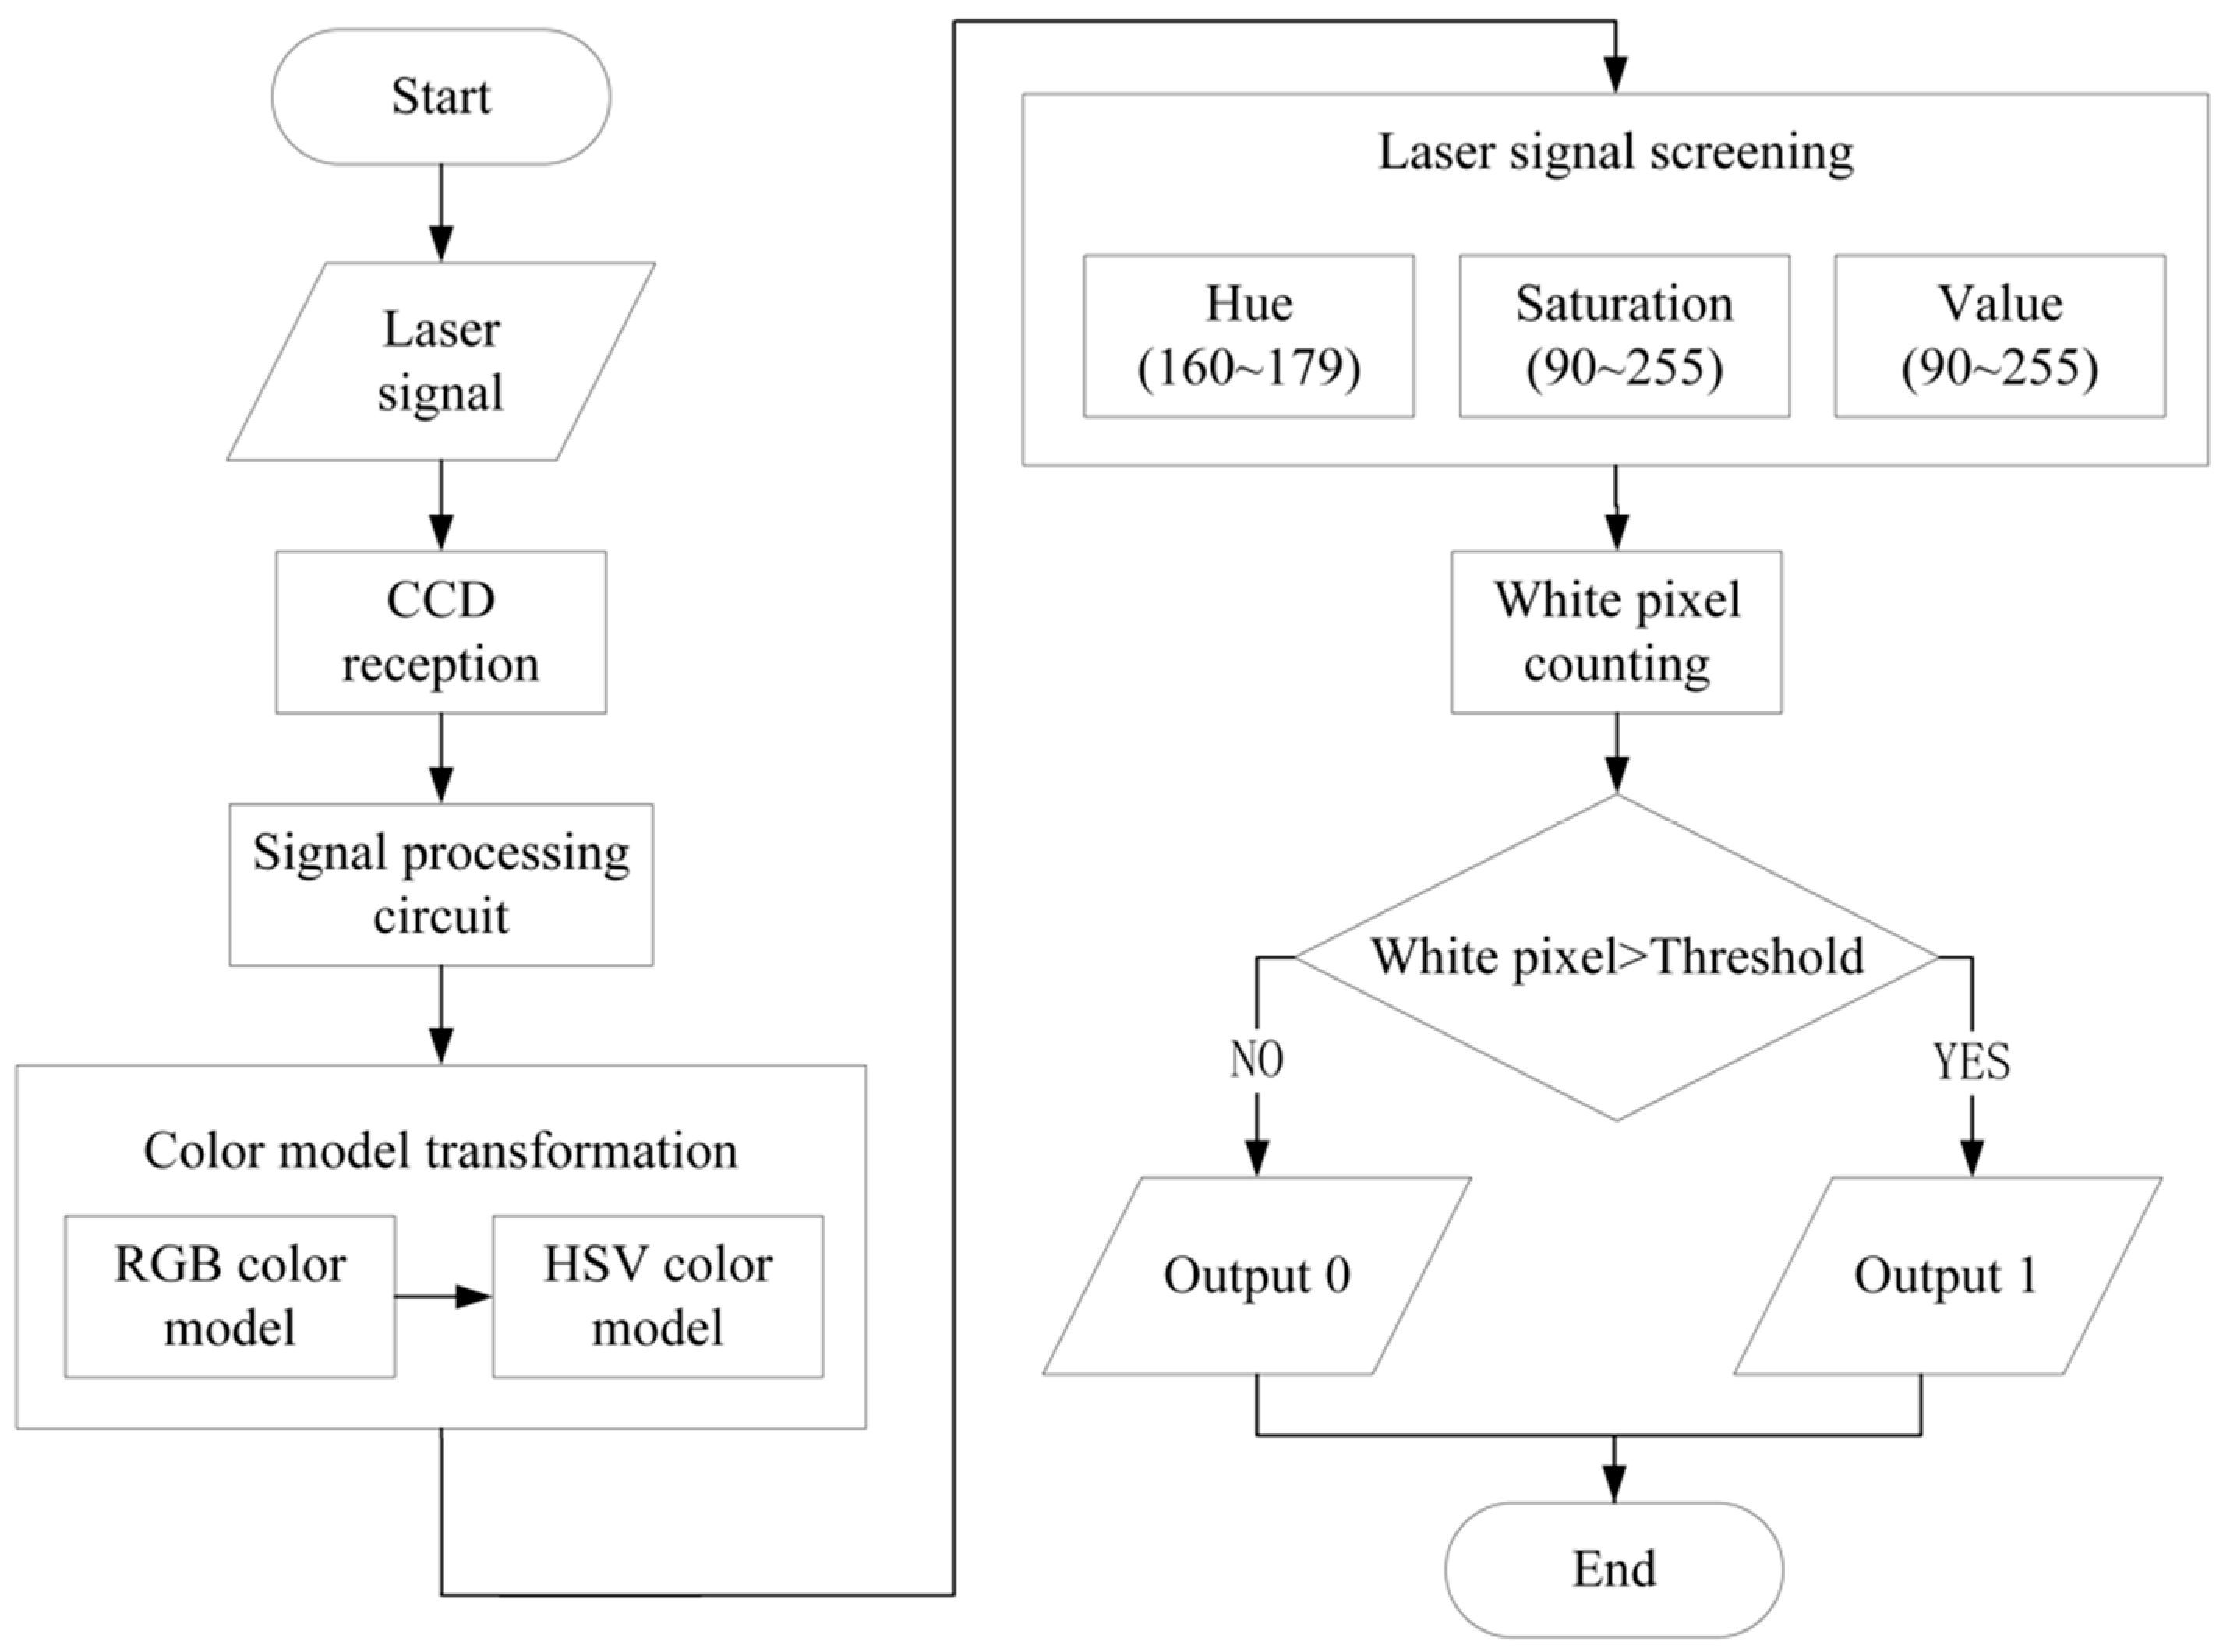
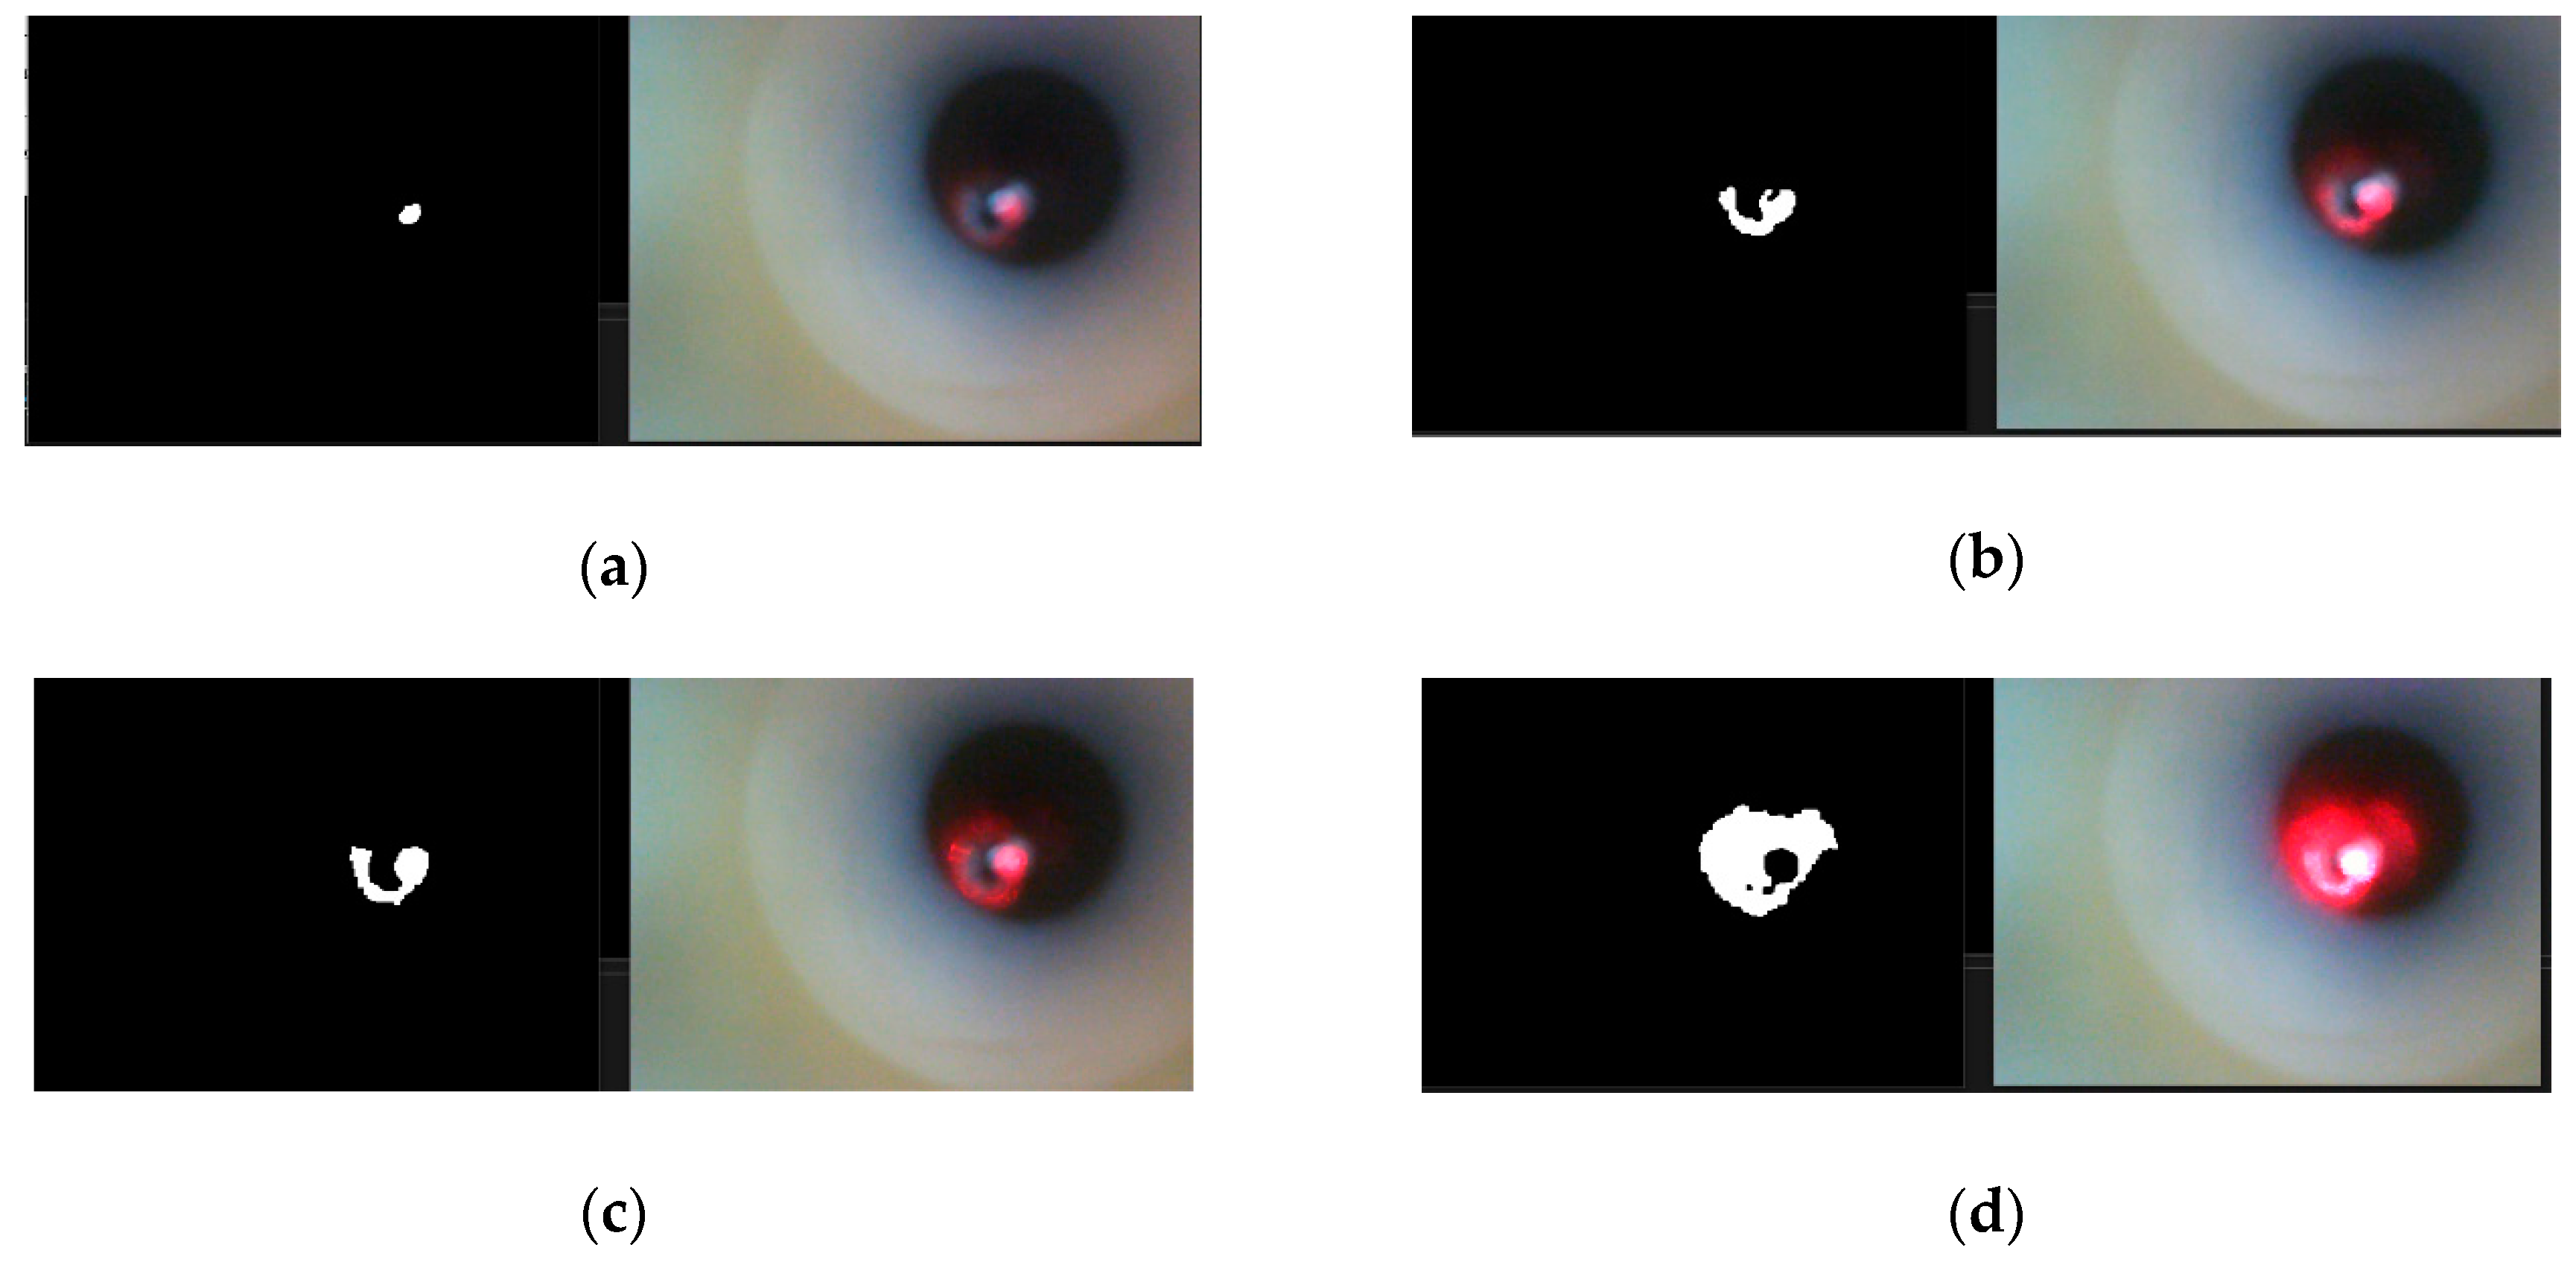
2.3. Image Processing

Based on the optical path designed above, this section will specifically describe how image processing is performed when the CCD receives the laser signal, and how to set the white pixel threshold for adjusting the actual measured value.
The device determines whether the probe enters the hole or protrudes out of the hole by acquiring the laser signal reflected back from the hole wall. After the laser signal is acquired by the CCD, it is imaged as a red spot by red-green-blue (RGB) colour model [23]. Since the CCD acquires optical signals for all external environments, there are laser signals and interference light signals from the external environment in the original image. Therefore, the ultimate goal of image processing is to identify the presence or absence of a red laser signal from the original image. Figure 3 shows the block diagram of imaging identification and screening process.
As shown in Figure 3, when the laser signal is projected onto the hole wall, the CCD receives the reflected laser signal and transmits the single frame image to the host computer for real-time processing [24]. Next, the image colour model needs to be transformed from RGB to hue-saturation-value (HSV). After that, we set the parameters of HSV model image to screen the laser wavelength produced by the laser transmitter. In order to facilitate calculation of the selected laser spot imaging, the image needs to be processed in two values. There are only white and black pixels in the binary image, and the white pixels represent the laser signal reflected by the hole wall. When white pixels are generated, this means that the laser signal is projected onto the wall of the hole to be measured. The host computer outputs a signal to the microcontroller unit (MCU) to show that the front end of the probe has entered the hole. In order to make the whole device have high fault tolerance and adaptability, it is necessary to set a threshold for the number of white pixels, which decides whether to send signals to MCU or not.
A digital image is composed of a number of pixels, and each pixel has its internal display principle, which includes parameters such as brightness and colour. Therefore, the colour composition and expression of the pixel form the colour model. The visible spectrum contains all the visible light subsets, each of which contains colour light for each wavelength of the visible spectral range to which this subset belongs. Different combinations of these visible light subsets form different image colours, and different colour models have different colour expressions.
The RGB colour model contains red, green, and blue colours, and the different ratios of the three colours blend other colours [25]. Since the colour expression method is the same as the colour formation principle of the actual display device, most of the display device and the imaging device adopt the RGB image colour model, and the image colour model directly extracted by the device designed in this paper is the RGB colour model. The HSV colour model is composed of Saturation, Hue, and Value. Compared with the RGB colour model, HSV colour model is more in line with the human eye’s recognition and computer processing of images. The HSV colour model explains the origin of colour and conforms to the physical principle [26]. Therefore, in image processing, the RGB colour model needs to first be transformed into an HSV colour model.
The RGB colour model is expressed using a three-dimensional rectangular coordinate system, and the three parameters of R, G and B correspond to X, Z and Y axes, respectively. The HSV colour model is expressed in a three-dimensional polar coordinate system. Hue, Saturation and Value correspond to Z axis, polar axis and rotation angle, respectively [27]. Therefore, the conversion between the two colour models is calculated as follows:
Hue calculation:
H = { G B max ( R , G , B ) min ( R , G , B ) when R = max ( R , G , B ) B R max ( R , G , B ) min ( R , G , B ) when G = max ( R , G , B ) R G max ( R , G , B ) min ( R , G , B ) when G = max ( R , G , B ) .
Saturation calculation:
S = { 0 when V = 0 1 min ( R , G , B ) max ( R , G , B ) when V 0 .
Value calculation:
V = max ( R , G , B ) .
Because the optical signal captured by CCD includes both laser signals and ambient light signals, it is necessary to screen the laser signal to distinguish it from the ambient light signal after the image is transformed from the RGB color model to the HSV color model. The screening method adopted in this paper enables adjustment of the values of the three parameters of the HSV color model.
In the HSV colour model, the Hue adjustment range is 0 to 179, and as the value increases, the colour tends to turn red. The adjustment range of Saturation and Value are 0 to 255, and as the value of the parameter increases, Saturation decreases. The colour of the laser emitted by the laser transmitter in this device is bright red. Its Saturation is high because of its generation principle [28]. Therefore, the optimum range of the three parameters in image processing is Hue—160 to 179, Saturation—90 to 255, and Value—90 to 255.
After the image is screened, it is necessary to binarize the image to determine whether the laser signal is received or not. Binarization of the image means to turn a picture into a black and white picture [29]. In this image, the pixel has only two colours, black and white, and the value of the pixel is 0 or 255. When the value of the pixel is 0, it is a black pixel, and when the value of the pixel is 255, it is white. Thus, when no laser signal is reflected to the CCD, there will be no white pixel in the image. However, if a laser signal is received, a circular white spot appears in the image, which means that the laser signal is projected to the wall of the hole.

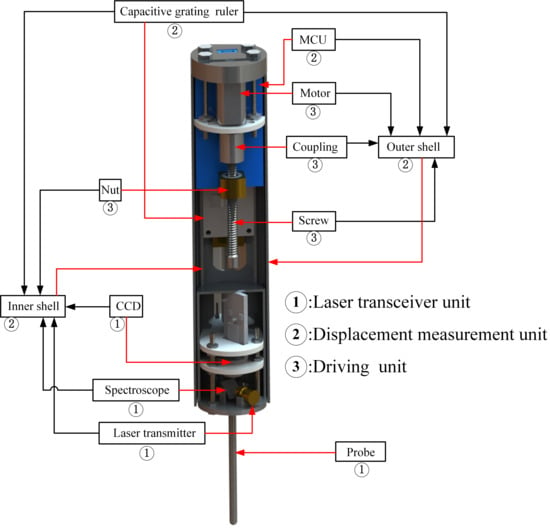
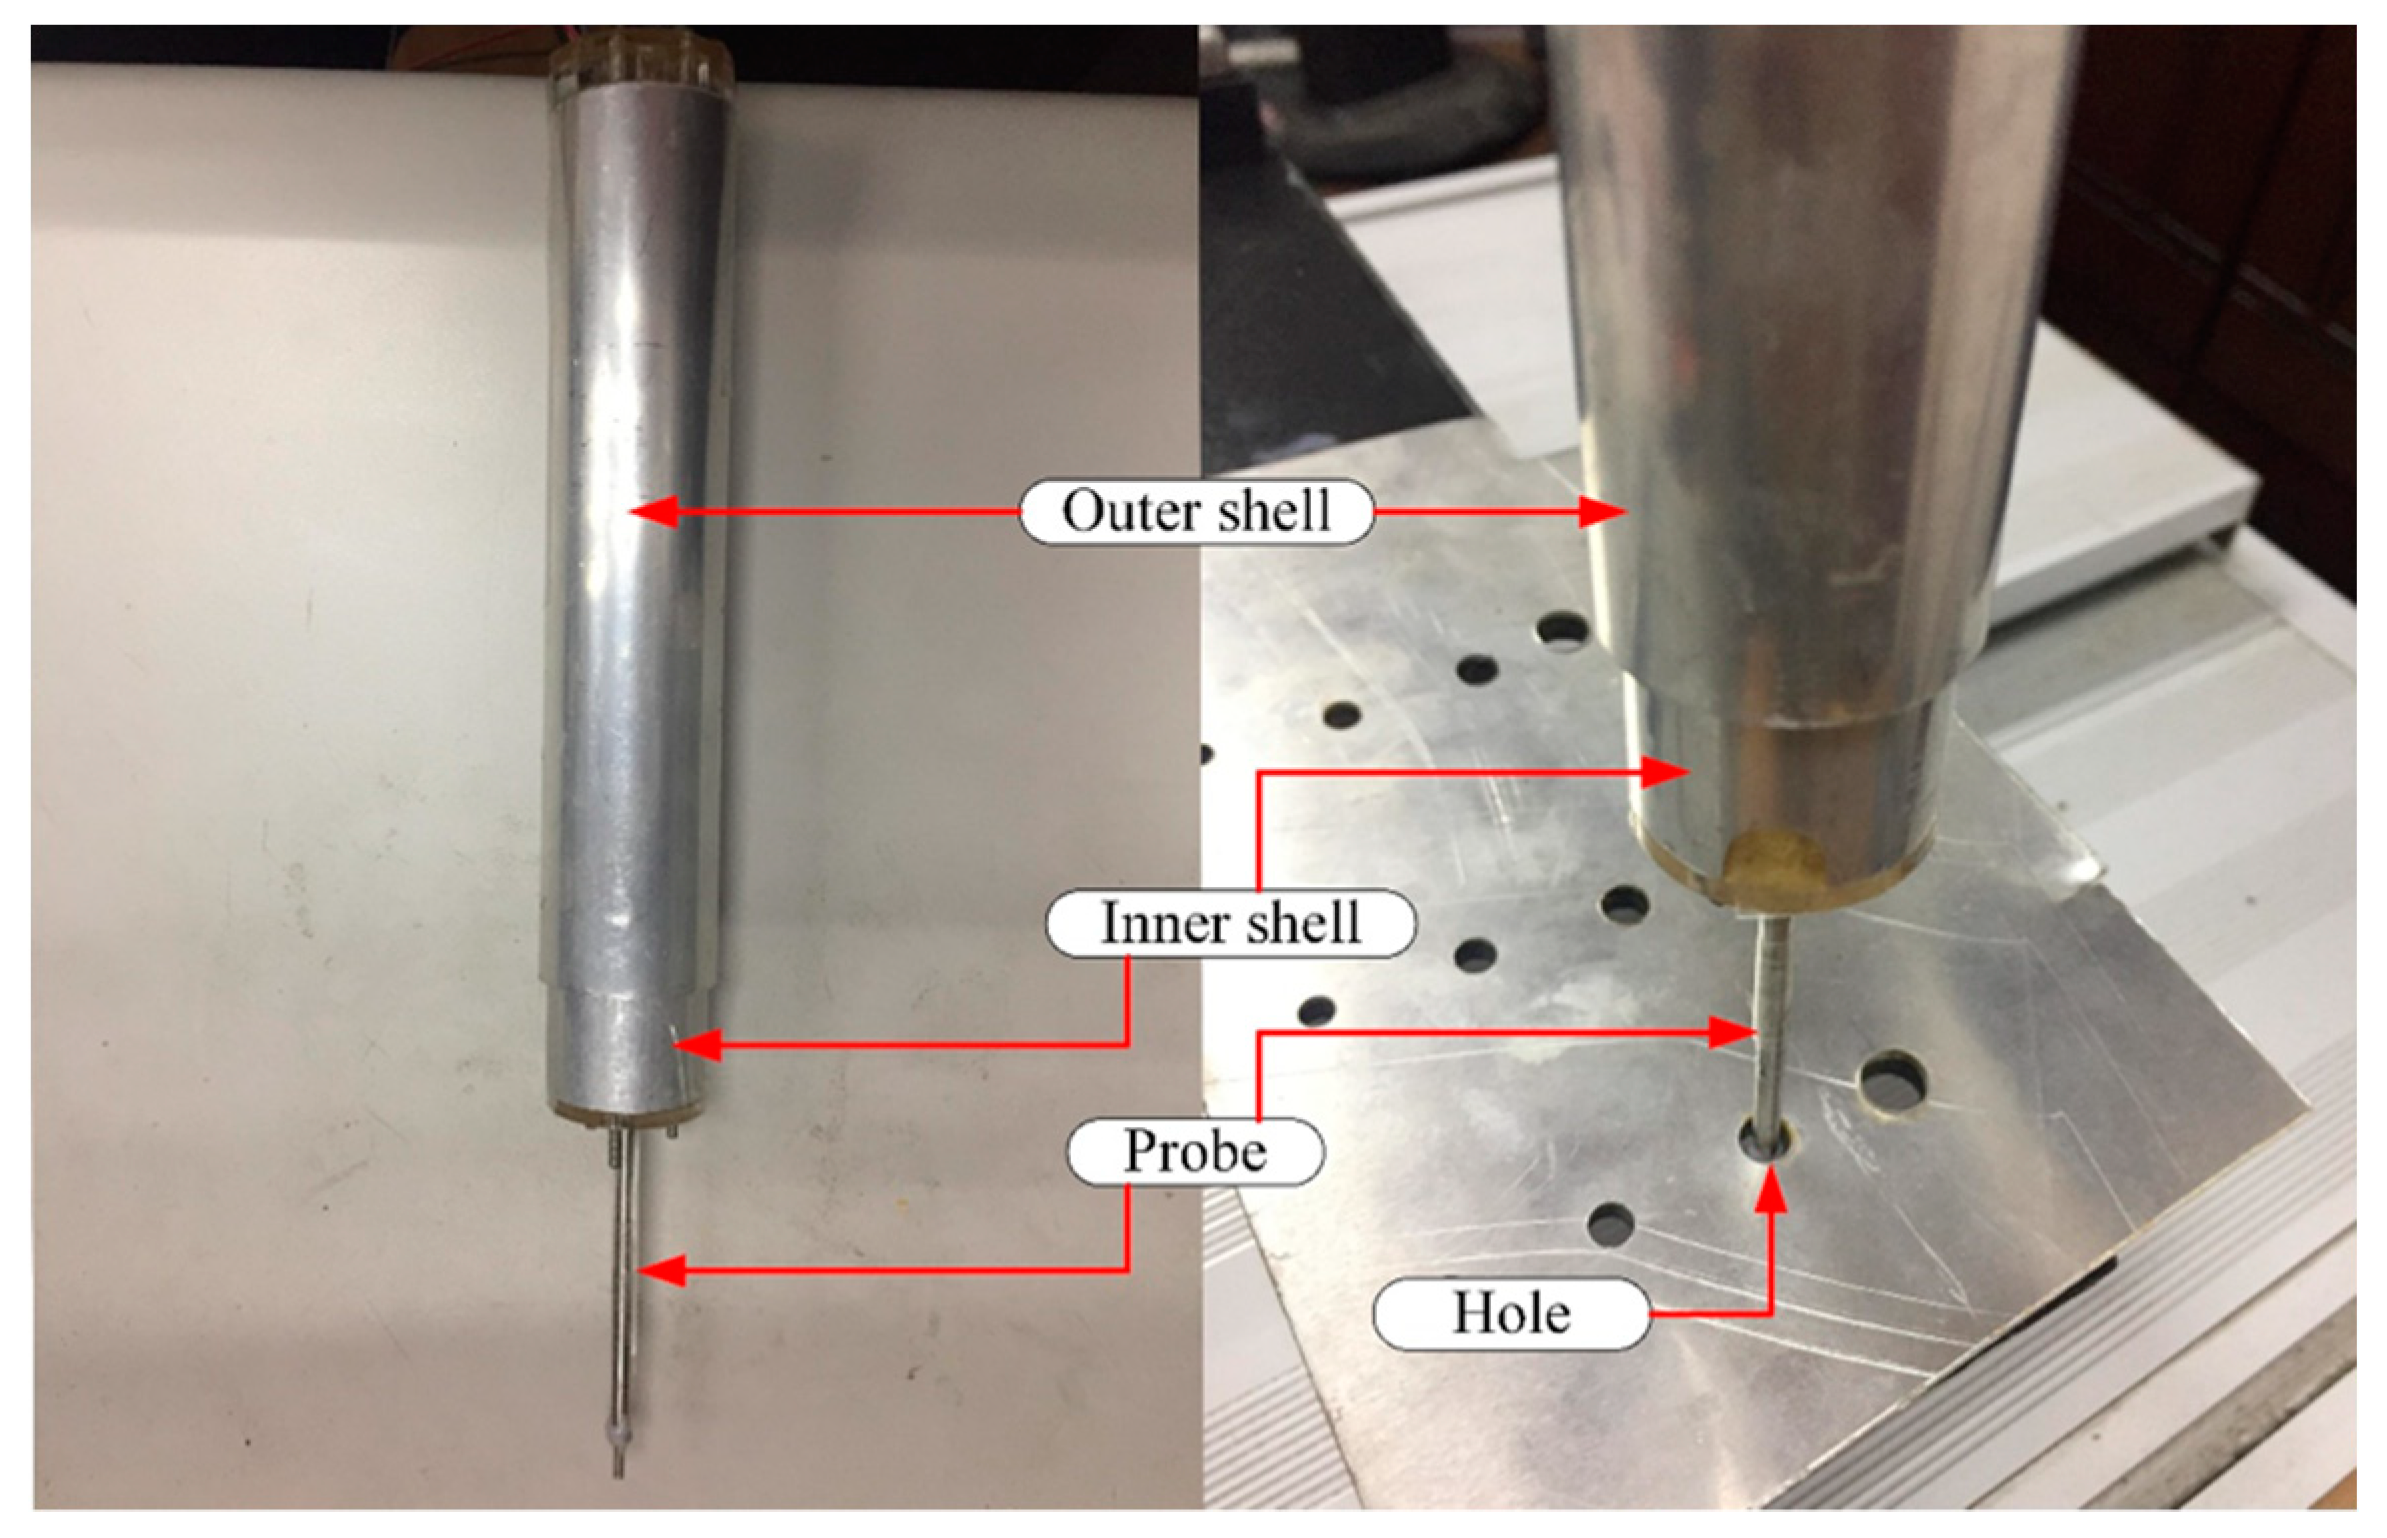
2.4. Hardware Design

In this section, the hardware design of the proposed measuring device is described in detail, and the hardware interrelationship is explained. From a structural point of view, the device is divided into three parts: the outer shell, the inner shell, and the probe, as shown in Figure 4. The laser transmitter, the CCD sensor, the beam splitters, and the nut are in the inner shell. The MCU, the motor, the coupling, and the screw are in the outer shell. The fixed ruler and movable ruler of the capacitive grating displacement sensor are, respectively, installed in the inner shell and the outer shell. The laser transceiver unit comprises of the laser transmitter, the CCD and the beam splitter. The displacement measuring unit comprises of the capacitive grating displacement sensor, the MCU, the outer shell, and the inner shell. The driving unit comprises of an electric, a coupling, a screw, and a nut. The CCD is packaged with a convex lens and forms a miniature camera. The camera is fixed by the two sets of fixing frames above the beam splitter. The outer shell and the inner shell are nested structures, the motor is fixed to the end of the outer shell, and the output shaft of the motor is connected to the screw through the coupling. The nut is fixed on the inner casing and is threaded on the lead screw. The MCU for logic control is also disposed at the end of the outer shell.
From the perspective of electrical hardware, the measurement system is divided into three units: laser transceiver unit, displacement measuring unit and driving unit. In the laser transceiver unit, the laser is projected through the designed optical path to the hole wall and finally returned to the CCD. This unit is used for state determination during probe measurement. The drive unit is used to implement the telescopic movement of the probe, and during this process, the inner shell and the outer shell are relatively displaced. The function of the displacement measuring unit is to measure the relative displacement between the inner shell and the outer shell. The core component of this unit is the capacitive grating displacement sensor, the function of which is to measure the displacement of the probe. Finally, the hole depth parameter is obtained by intercepting the displacement recorded in the process of laser scanning the hole wall.
The structure design of the device is shown in Figure 5. The probe and the inner shell are hollow structures, and the diameter of the probe is only 3 mm, which enables the probe to penetrate into holes with smaller diameters. Even more, the probe can be further miniaturized by using smaller optical lenses. Thus, the device has the ability to measure the depth of holes with a large depth-to-diameter ratio. The designed optical system is placed in the inner shell and the probe. The laser transmitter cannot be placed in the small probe because of its large volume. Therefore, using the designed optical system, the laser emitted from the laser transmitter can be transferred from the inner shell of the device to the probe tip. The laser reflected from the hole wall is received by the CCD located in the inner shell. The outer shell and the inner shell of the device form a retractable structure through the screw and the nut. The inner shell moves forward or backward along the common axis of the outer shell and the inner shell is driven by the rotation of the motor. The capacitive grating scale (fixed ruler) and the capacitance grid ruler (movable ruler) are combined to become a capacitive grating displacement sensor [30], wherein, the movable ruler is arranged in the inner shell, and the fixed ruler is mounted on the outer shell. When the relative displacement between the inner shell and the outer shell occurs under the drive of the motor, the movable ruler slides on the fixed ruler and get the relative displacement data.
Figure 6 shows the hardware connection diagram of the measurement system. A separate direct current (DC) power supply is required for the laser transmitter and the motor. The MCU, the capacitive grating displacement sensor, and the CCD are directly connected to the host computer, and are electrically driven by the host computer. The laser emitted by the laser transmitter is reflected by the wall of the holes and is received by the CCD. After the optical signal received by the CCD is processed into image information, this image signal will be finally output to the host computer. Under the control of the MCU, the motor gradually pushes the probe into the hole to be tested. When the laser beam has completely scanned the entire hole, the motor drives the probe to retract and return to the original position. The capacitive grating displacement sensor transmits the displacement data to the host computer in real time. The port for clearing the displacement data of capacitive grating displacement sensor is connected with the MCU. When this port is at a low level, the displacement data transmitted by the capacitive grating displacement sensor is always zero; when the port is at a high level, the displacement data can be recorded normally.

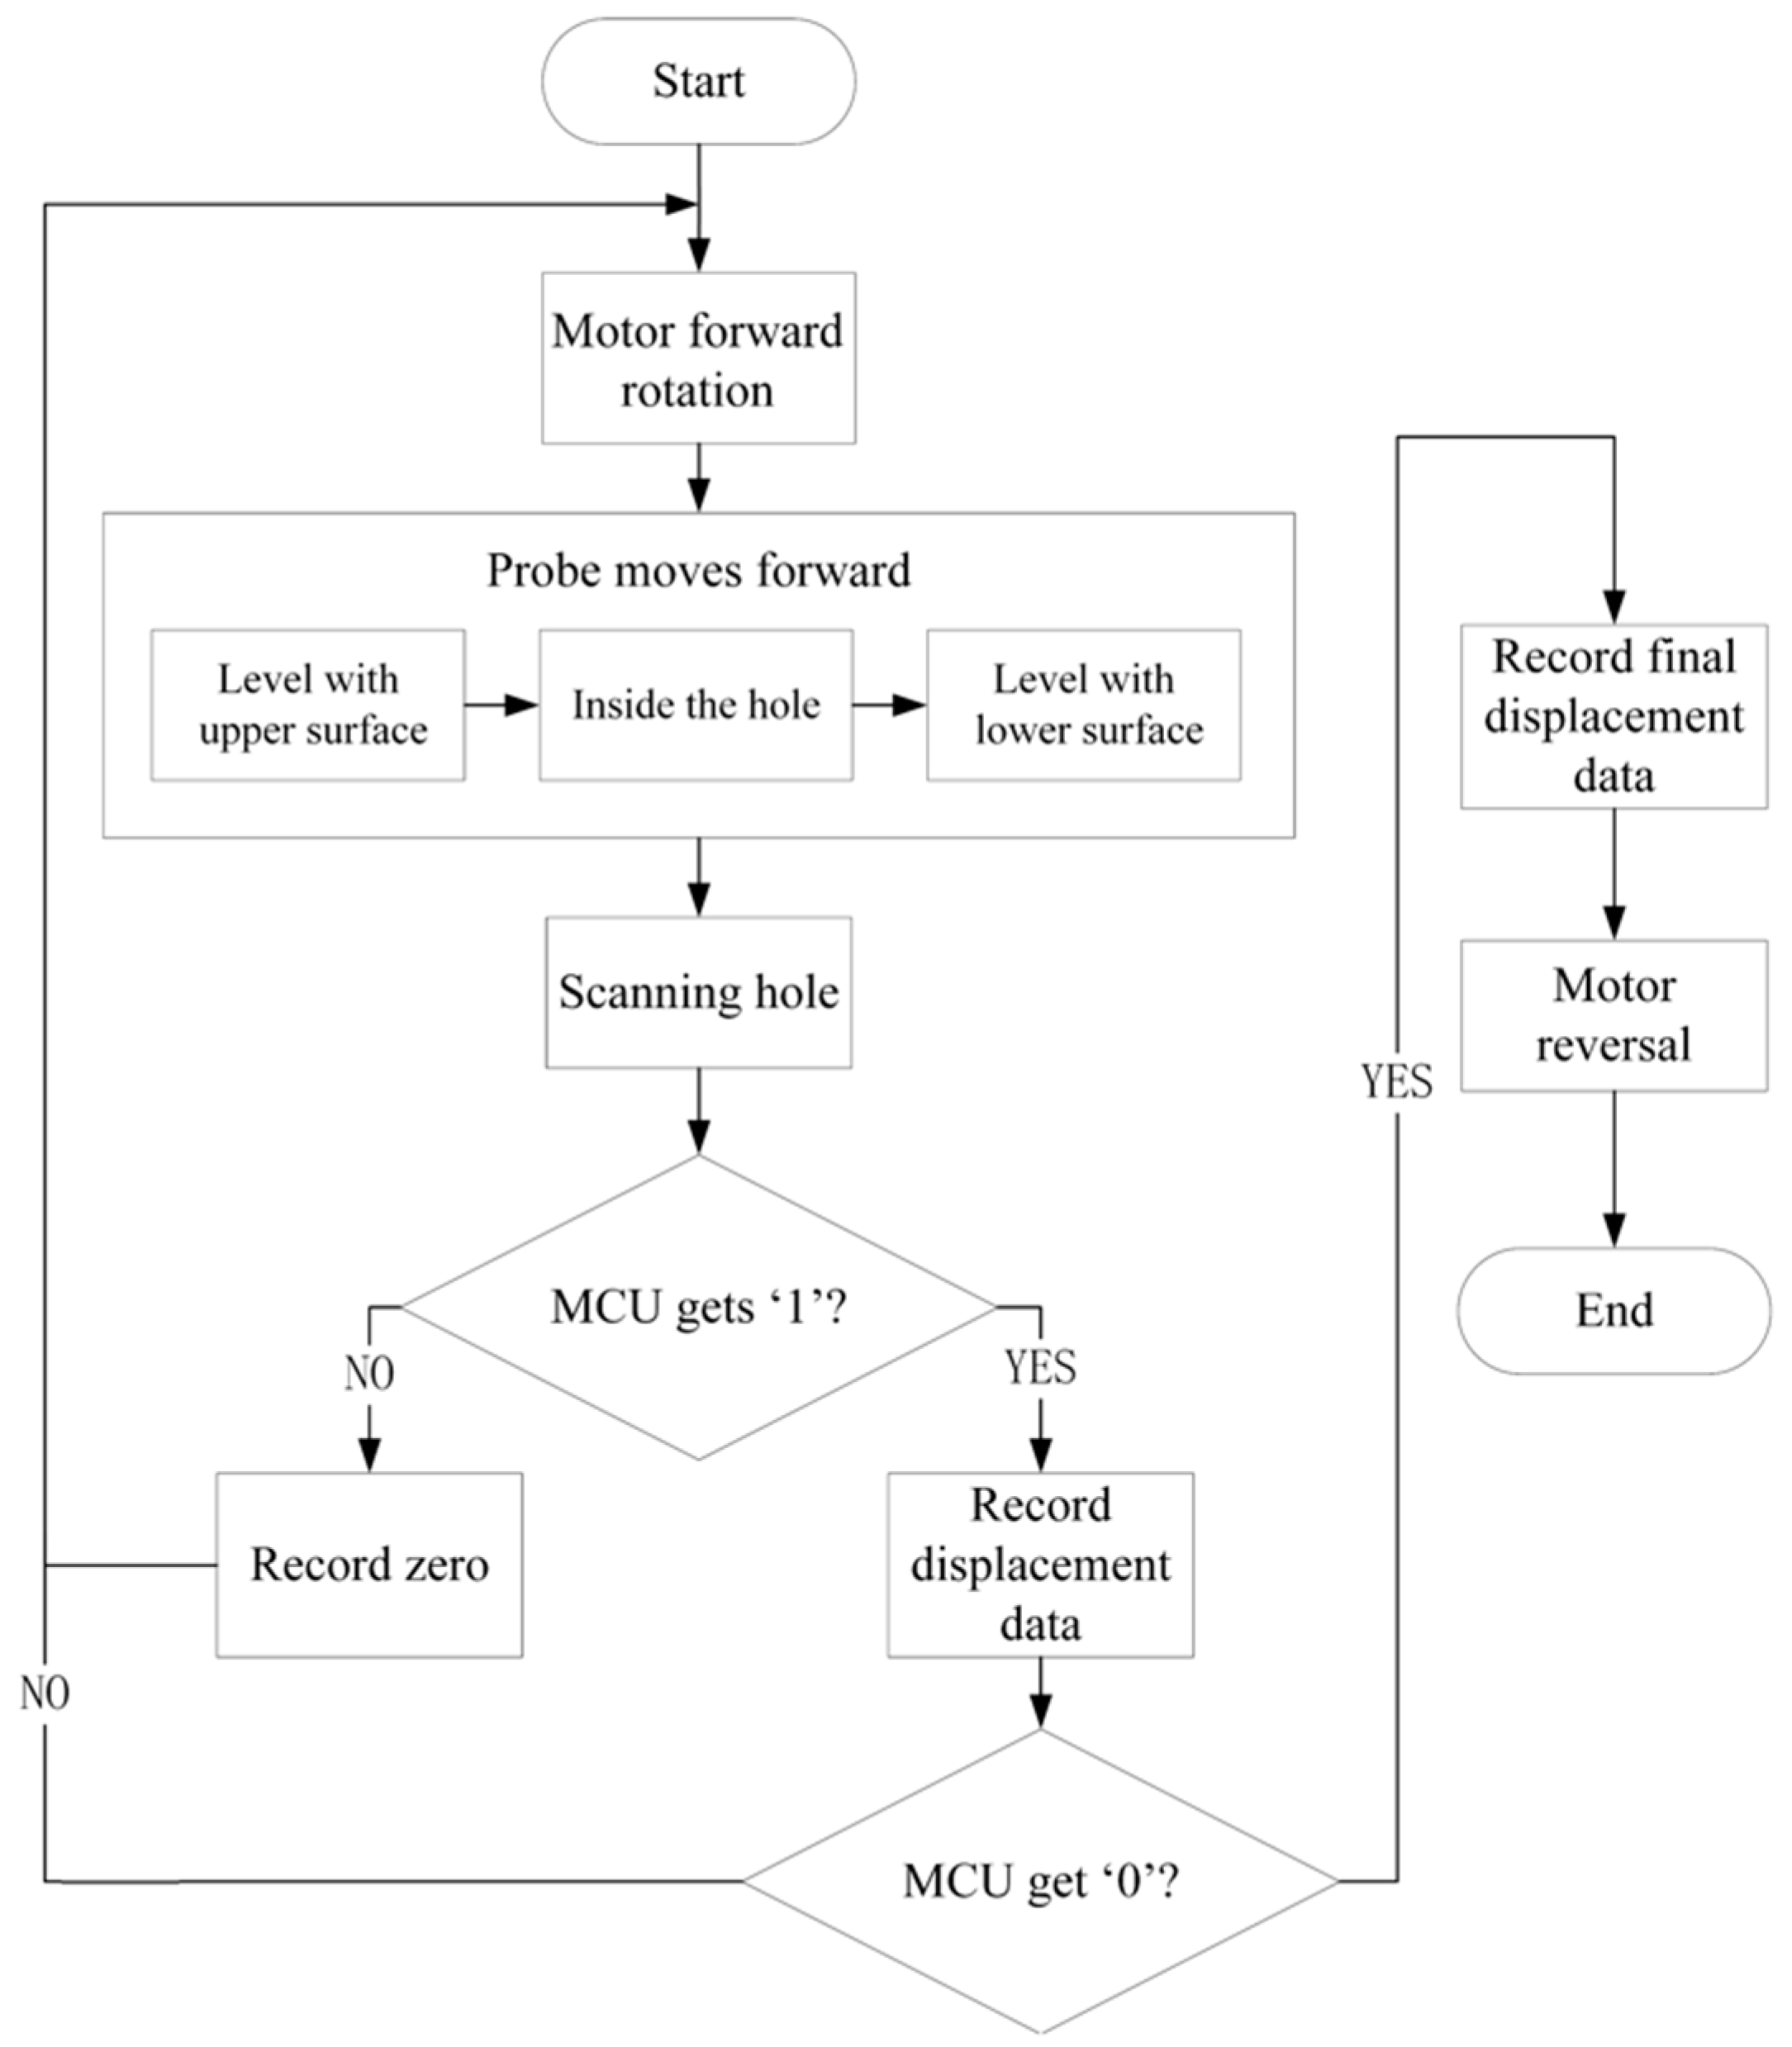
2.5. Software Design

According to the measurement scheme designed in Section 2.1, the entire measurement process can be divided into five steps, as shown in Figure 1. In this section, the software design is implemented based on the proposed measurement scheme. Figure 7 shows a control flow chart of the measurement process. When the measurement starts, the motor rotates forward to drive the probe feeding forward. In this process, the MCU continues to judge the received signal. When the laser does not touch the hole wall, the signal received by the MCU is “0”, and the displacement data recorded by the capacitive grating displacement sensor is always zero, and the probe continues to feeding forward. When the laser touches the hole wall, the signal received by the MCU is “1”, and the capacitive grating displacement sensor will begin to record the displacement data of the probe. When the probe is about to extend the hole, the laser will break away from the hole wall again. In this process, the MCU will continue to judge whether the received signal is “0”. When the signal is not zero, this indicates that the probe has not yet extended the hole and the device is still in the measurement state. So the motor will continue rotating forward to drive the probe feeding forward. When the signal is “0”, it indicates that the probe has extended out of the hole. At this time, the capacitive grating displacement sensor will stop recording displacement data. Then the motor will reverse to drive the probe back to its original position. The program will eventually output the displacement data recorded by the capacitive grating displacement sensor, which is the depth of the hole.

3. Experiment Results

In order to verify the feasibility of the developed methodology and equipment, some experiments were performed in this section. The three experiments that tested the accuracy and stability of the measuring device are: (i) measurement accuracy and repeatability verification; (ii) the effect of feed speed on the accuracy of measurement; and (iii) pixel threshold effect on measurement value.
As shown in Figure 8, the prototype of the measuring device used for the experimental test was fabricated and assembled. The experiments were carried out on a three-coordinate workbench, and the probe device was vertically fixed on the jig. The plate-like parts to be tested was fixed on the test bench below the probe, and the probe axis was parallel to the axis of the holes. The control unit used in this experiment was NXP’s LPC1768 microcontroller, which is based on ARM Cortex-M3 core. The wavelength of the laser diode used in the laser transmitter was 650 nm. The threshold of Value, Hue, and Saturation in the image screening process were both kept fixed. The resolution of the capacitive grating displacement sensor was 0.01 mm. The motor used here is a DC type with a rated voltage of 6V. The frame rate of image uptake is 30 frames per second. It is worth mentioning that in this study we only carry out preliminary experiments to get measurement accuracy and repeatability of the proposed device. The purpose is to verify the feasibility of the measurement method and the corresponding measuring instrument. The device was not compensated and optimized before measurement experiments. In a follow-up study, the accuracy compensation algorithm will be designed to further optimize the measurement accuracy.

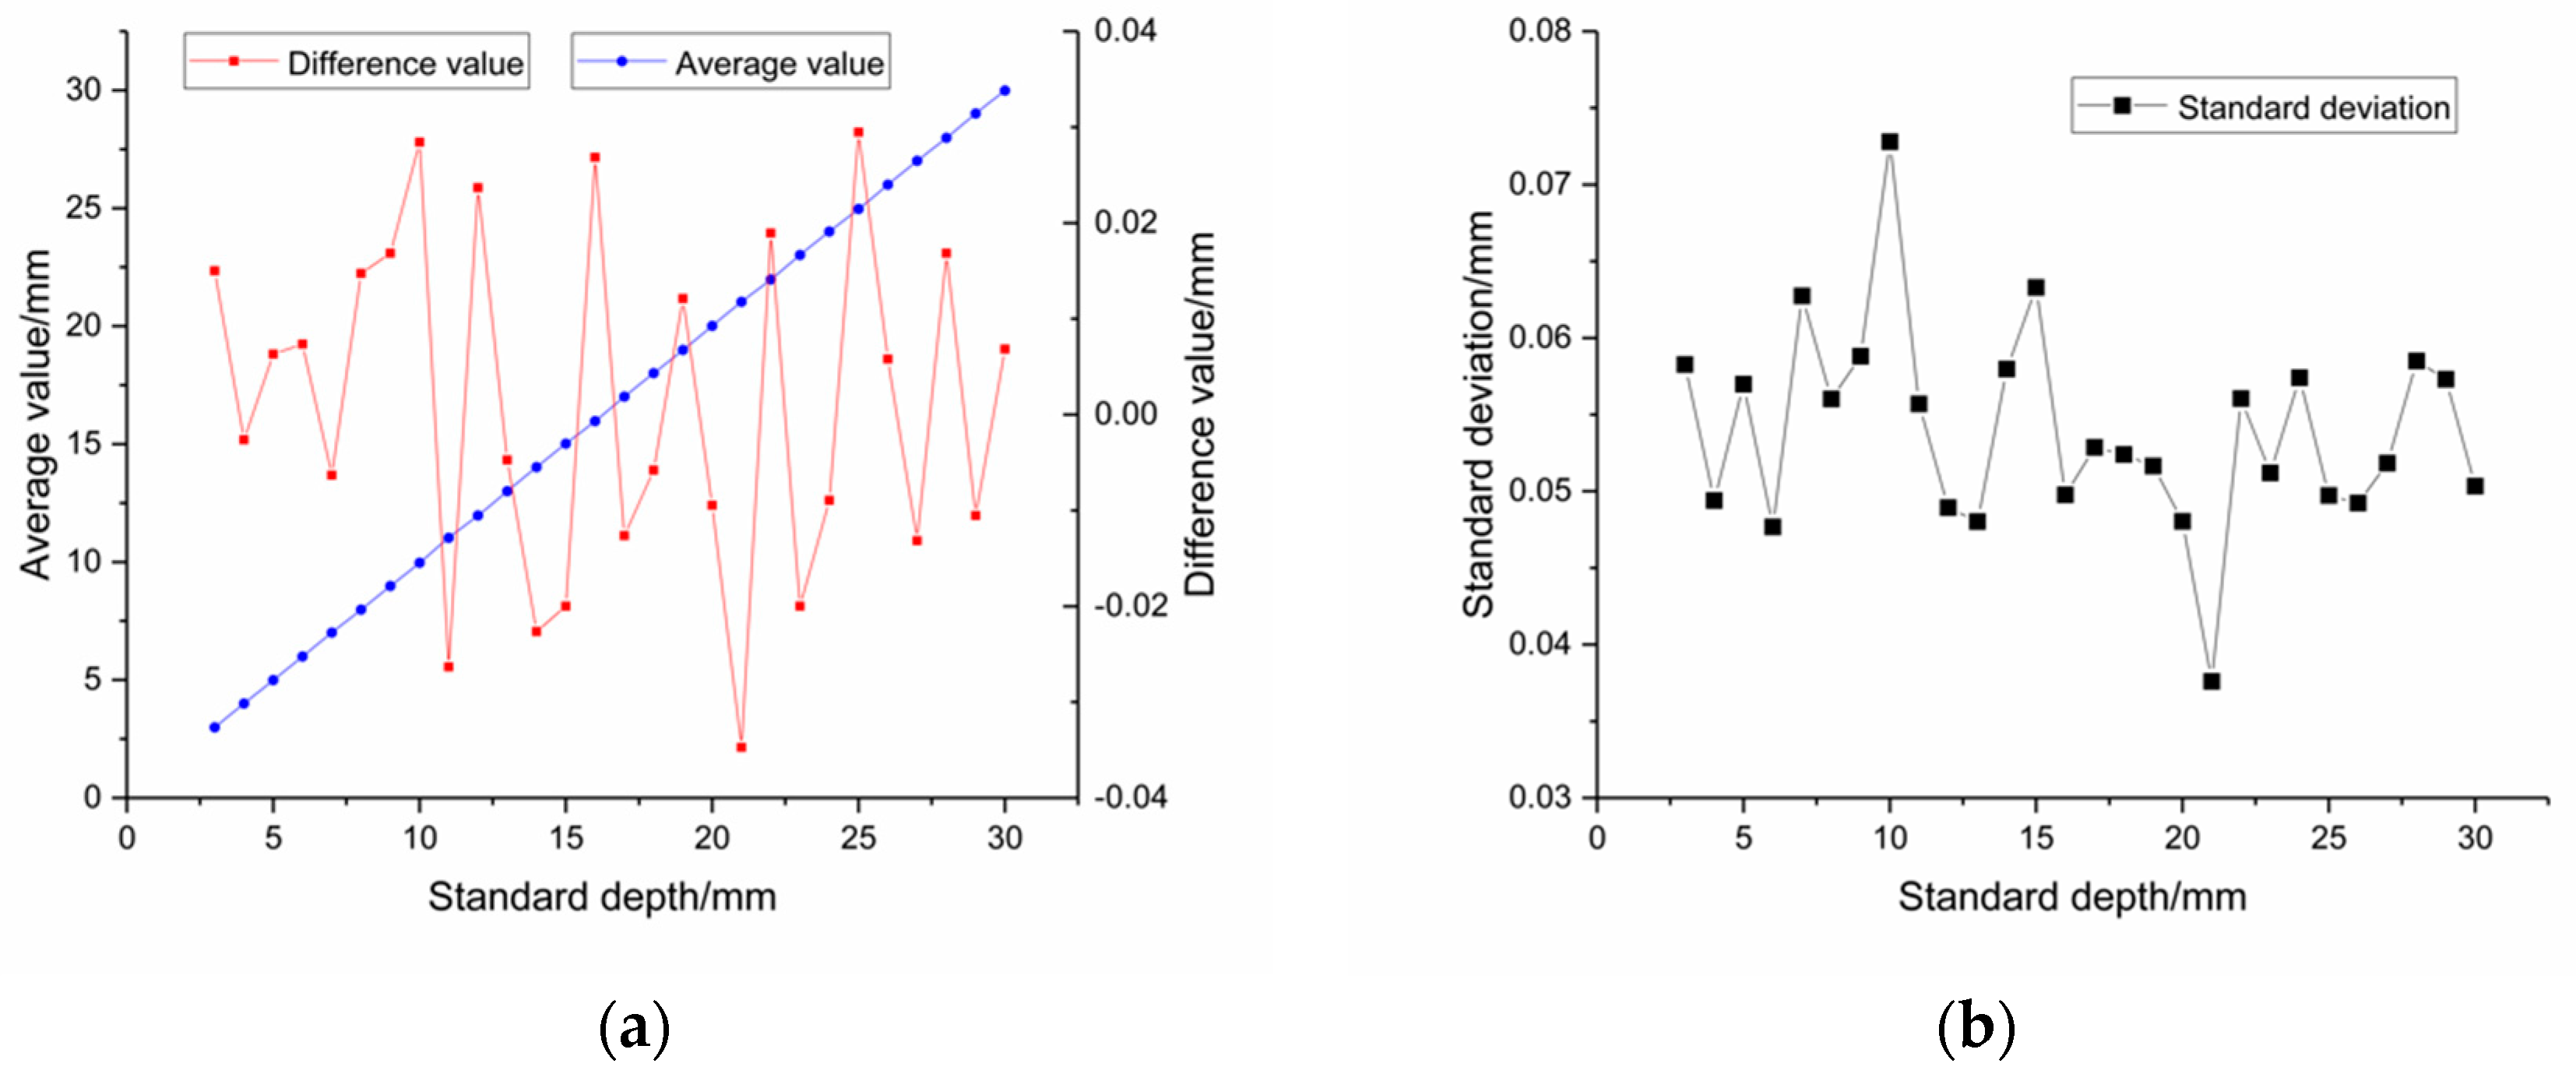
3.1. Measurement Accuracy and Repeatability Verification

The purpose of this experiment was to check the measurement accuracy and stability of the measuring device. The selected depths of holes are from 3 mm to 30 mm with an interval of 1 mm and the diameters of these holes are all 6 mm. We selected 28 holes with different depths as measured objects. The feed speed of the probe was fixed at 4 mm/s, and the white pixel threshold was set to 100. Each hole with a certain standard depth was repeatedly measured 50 times; thus, a total of 50 sets of measurement data were obtained. Table 1 intercepts part of the measurement data in this experiment; five groups of actual measured value were randomly selected for each hole with standard depth.
In order to analyse the measurement accuracy and stability of the device, Figure 9a gives the interpolated curves of average value and difference value under different standard depths, and Figure 9b shows the standard deviation under different standard depths in the repeatability experiment. As shown in Figure 9a, it can be seen from the curve average value that the measured results of this device can better fit the real value of hole depth, and its measuring structure is approximately a straight line. The average value of each node in the average value curve can be calculated by:
μ = n = 1 50 S n 50
The difference value curve in Figure 9a reveals the measurement error between the measured value and the true value under different standard depths. The horizontal axis is the standard depth of real hole, and the vertical axis is the error value. The error value fluctuates with the change of standard depth. The minimum error is 6 microns and the maximum error is 34 microns.
To verify the repeatability of the designed device, Figure 9b shows the standard deviation curve of the repeatability experiment. Its horizontal axis is the standard depth of the measured hole, and its vertical axis is the standard deviation of 50 sets of actual measured data. The standard deviation at each standard depth can be calculated by the following formula:
δ = n = 1 50 ( X n μ ) 2 50
According to Figure 9a, standard deviation fluctuates continuously with the change of the standard hole depth. Its maximum value is 0.073 mm and its minimum value is 0.038 mm. In order to further verify the reliability of the device and determine whether the deviation is systematic, we can calculate the standard error of mean using the following formula:
SE = S N = 0.073 50 = 0.010   mm
where SE is the standard error of mean; S is the standard deviation; N is the number of measurements. The value of S = 0.073 mm is the maximum value of standard deviation, which is more able to explain the reliability of the device.
After the above calculation, the maximum value of standard error of mean was only 0.01 mm, judging by which the new approach and the device have high reliability. We will further explore ways to improve measurement repeatability in subsequent studies.

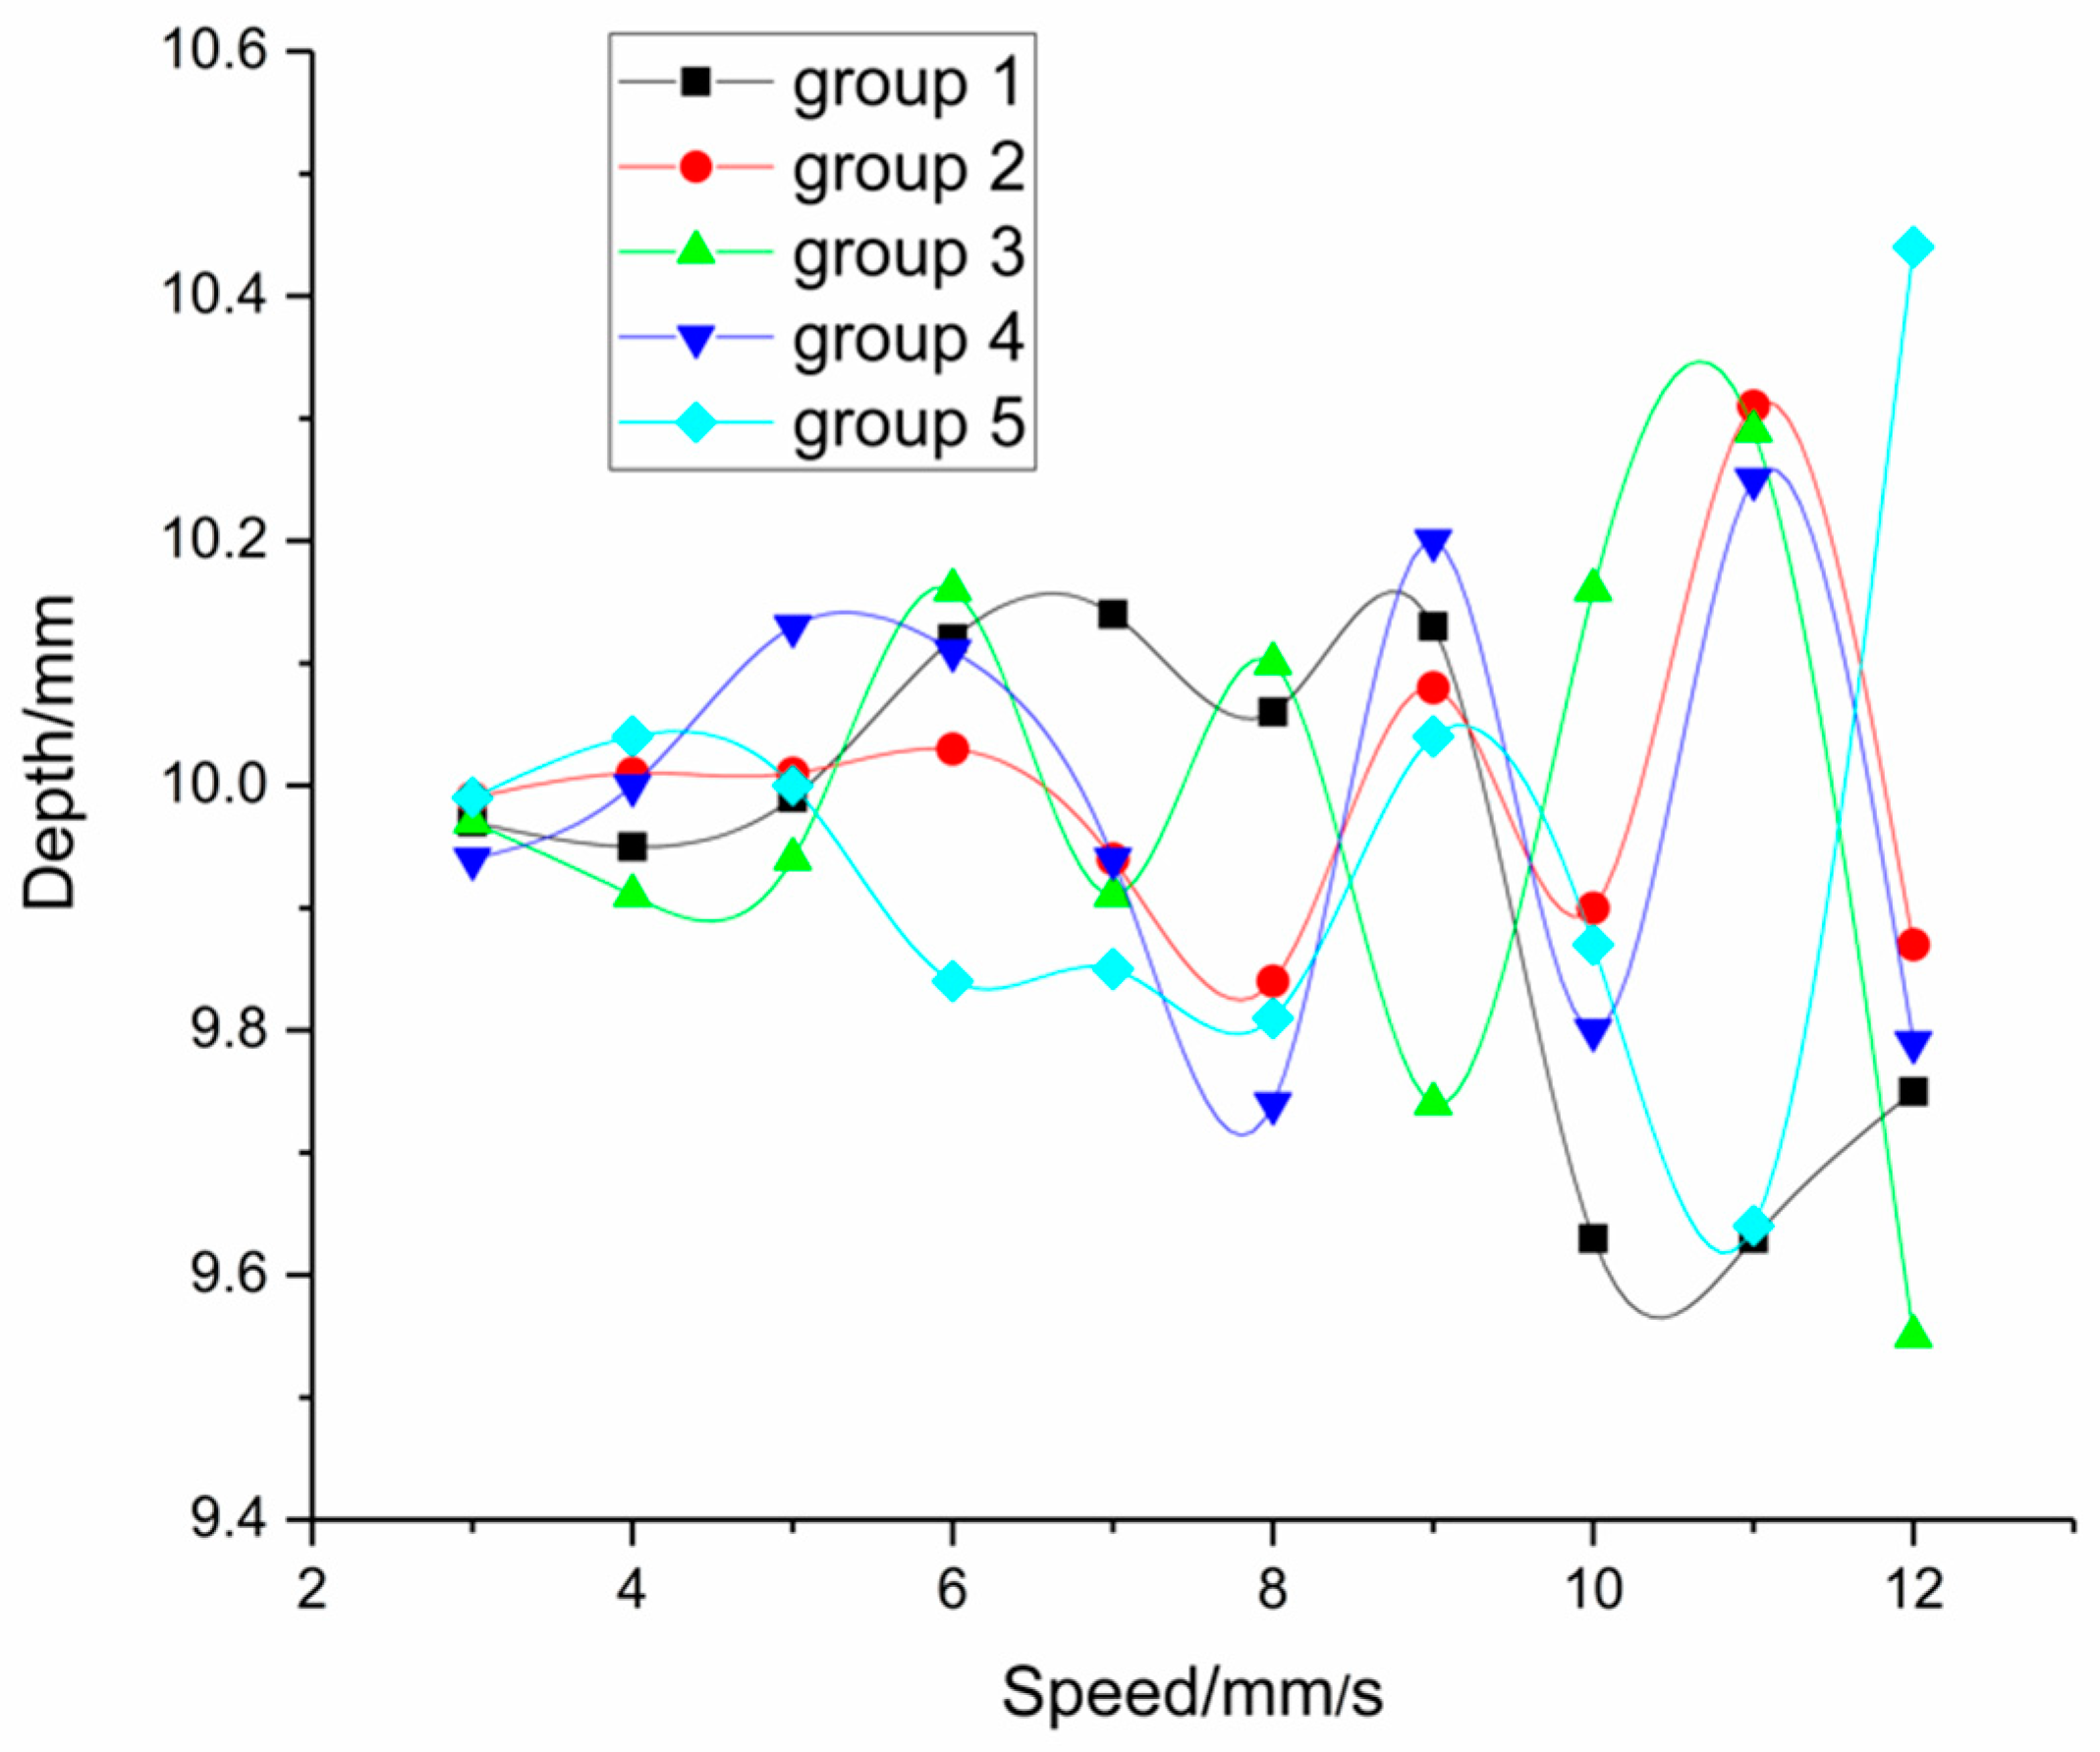
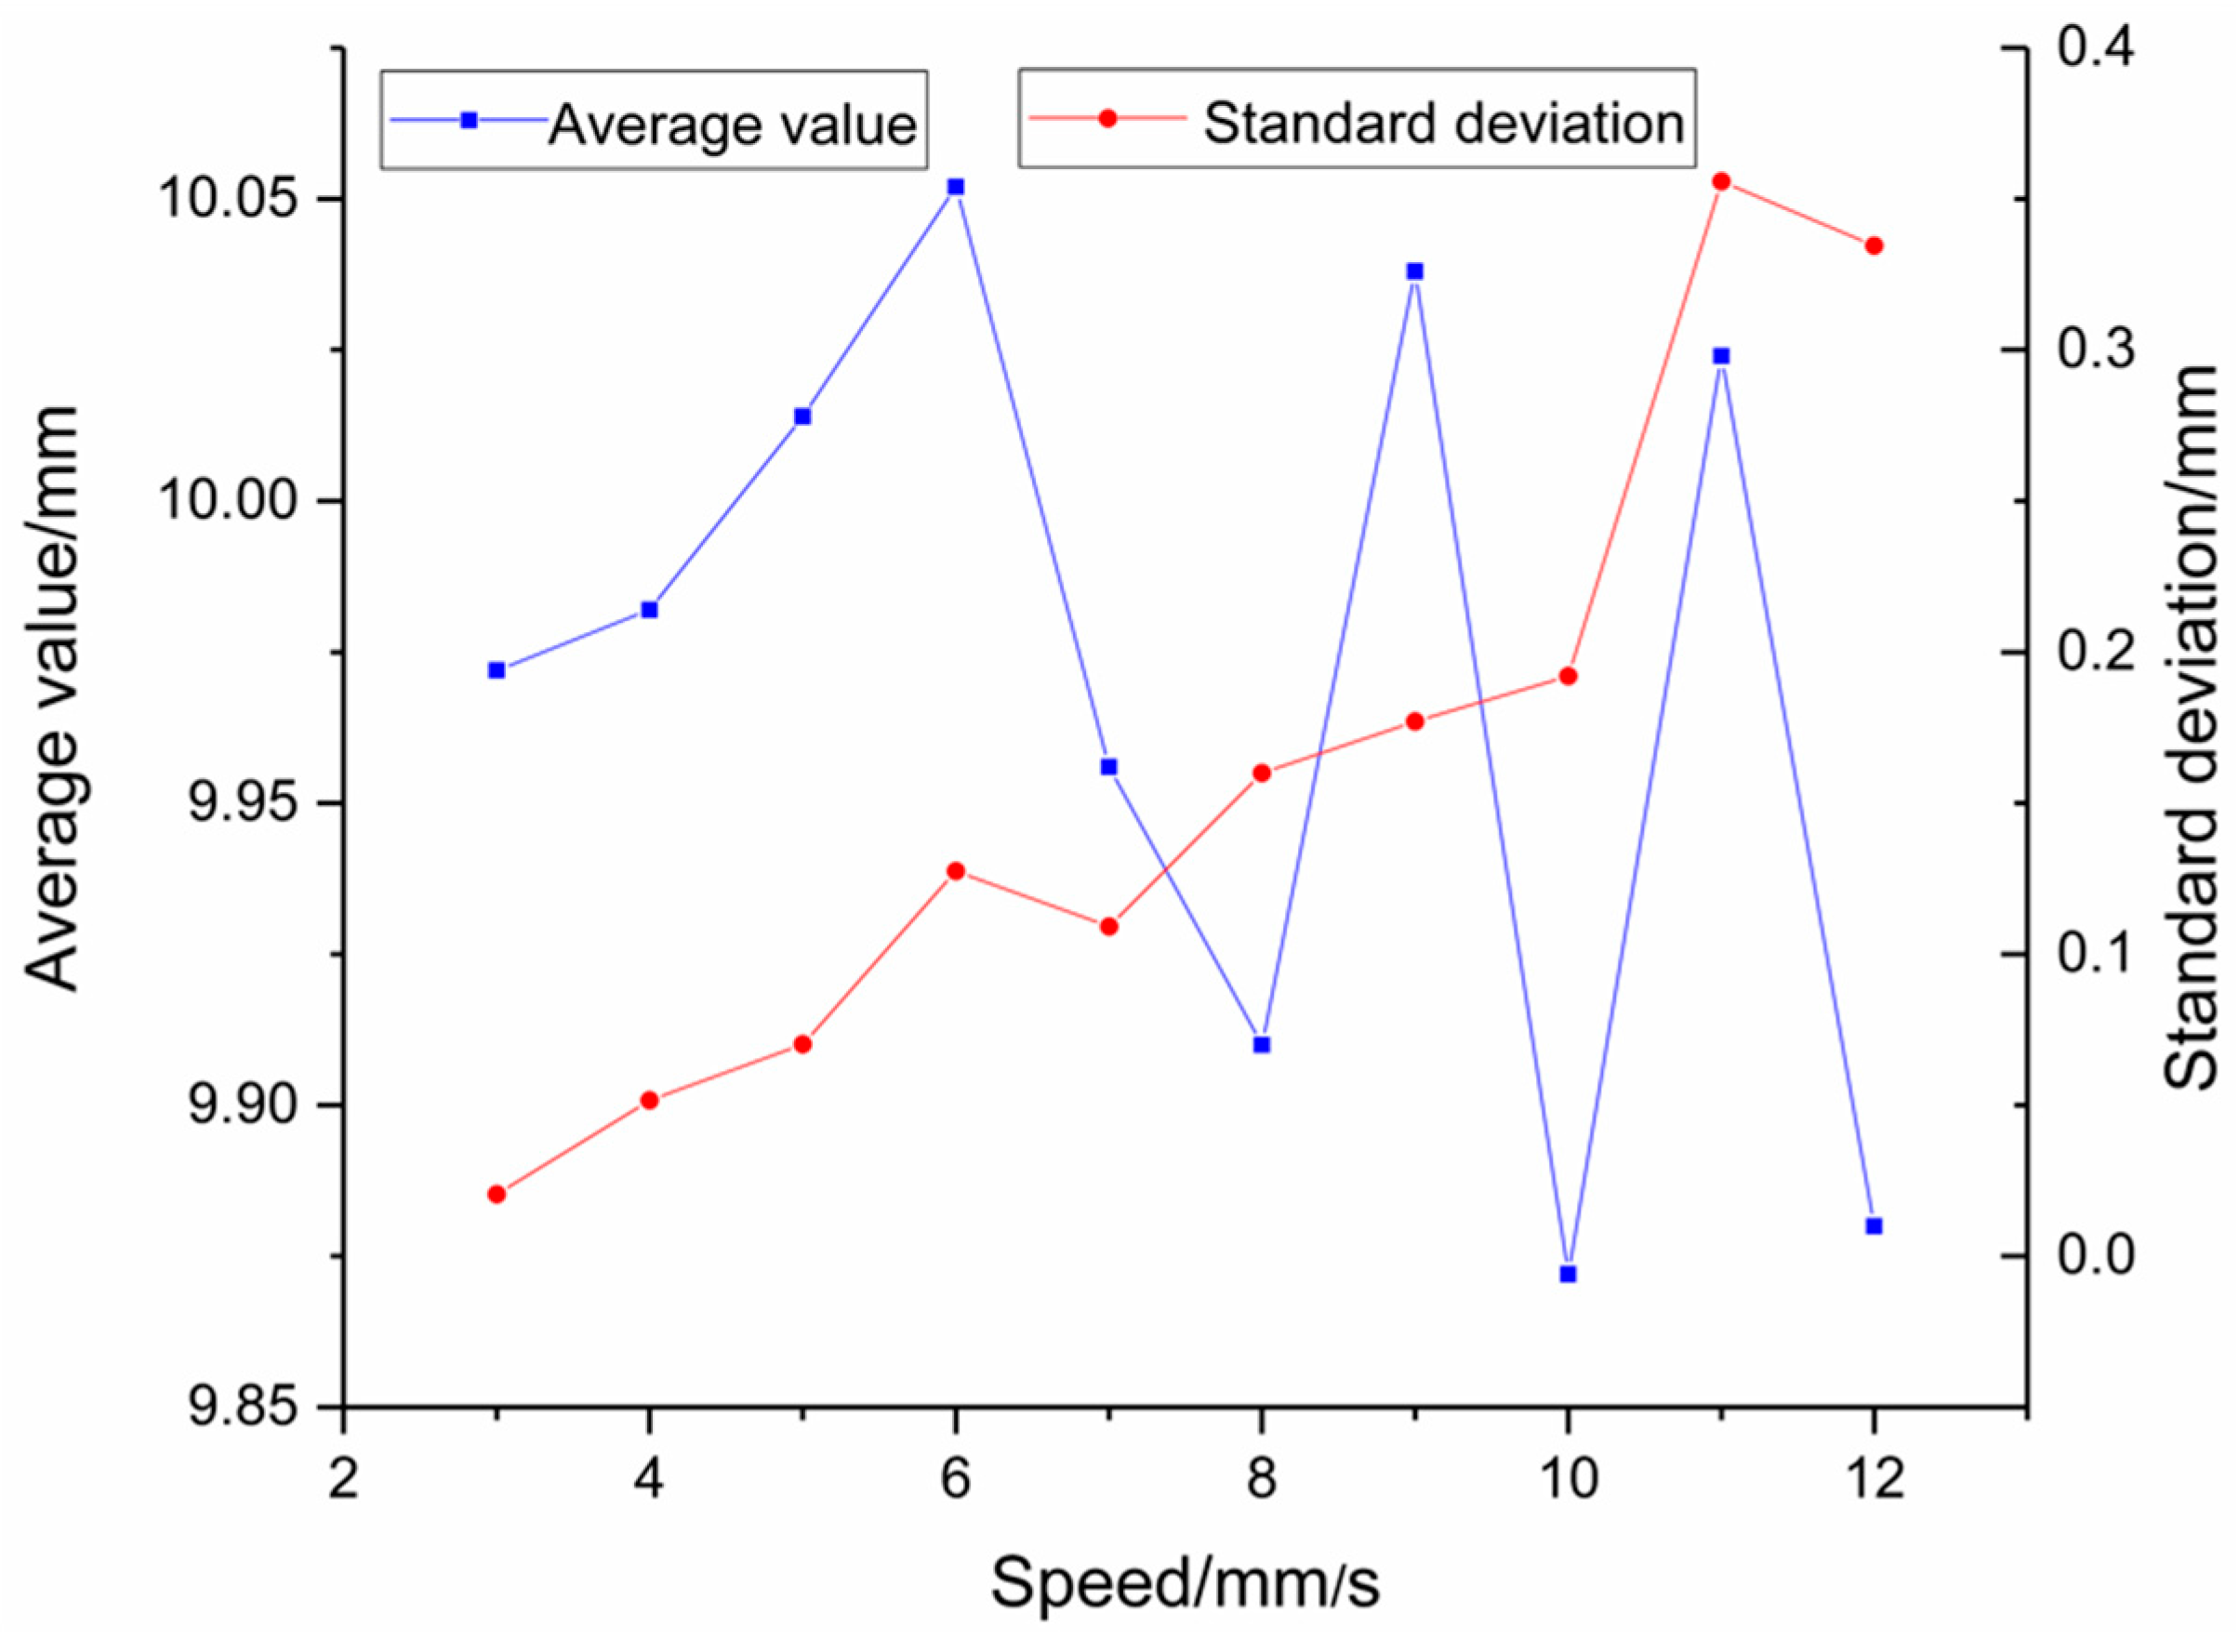
3.2. The Effect of Feed Speed on Measurement Accuracy and Stability

The function of laser signal reception of the device is realized by CCD and its signal processing circuit. The speed of image acquisition is limited by the performance of CCD. Moreover, due to the delay of the image processing program, some errors will appear in the process of measurement. When the laser is projected to the upper or lower surface of the hole (Step 2 and Step 4 as shown in Figure 1), displacement data should be recorded immediately. However, due to the response delay of the circuit and image processing algorithms, the starting point of the recorded data will be delayed, which will undoubtedly lead to measurement errors, and the magnitude of the error depends on the feed speed of probe. Therefore, from the above theoretical analysis, the faster the feed speed of the probe is, the greater the error will be.
This experiment only uses the simplest way to find out the relationship between feed speed and measurement results, that is, to measure the same hole depth at different feed speeds for many points in time. This paper does not delve into the mechanism of the influence of feed speed on measurement stability and accuracy and how to compensate for it. These issues will be addressed in our subsequent studies. Table 2 lists five groups of actual measured values under a certain feed speed and gives their corresponding average value and standard deviation. In this experiment, the white pixel threshold is set to 100, and the hole with standard depth of 10 mm was measured 10 times under each feed speed (i.e., from 3 mm/s to 12 mm/s), and five groups of measurement data were randomly selected for each feed speed.
In order to observe the influence of the feed speed on the measurement accuracy, Figure 10 was drawn, according to the experimental data provided in Table 2. The horizontal axis is the feed speed of the probe, and the vertical axis is the actual measured hole depth. The standard hole depth in this experiment is 10 mm. The speed of the probe is adjusted by controlling the speed of the motor. The feed speed is from 3 mm/s to 12 mm/s. Five groups of measurement data are selected for each speed. Each group of measured data is represented by a curve with certain colour and node shape.
Figure 10 shows that the probe has higher stability when the feed speed is slower. As the feed speed increases, the measured data will gradually diverge, the fluctuation will become larger and the stability will be lower. Therefore, it can be concluded that the stability of the measuring device will decrease with the increase of feed speed of the probe. The specific relationship between the accuracy or stability of the probe and the feed speed will be analysed below.
Figure 11 shows the average value and standard deviation under different feed speeds. The average value of each node is the average of 5 groups of measured data. As can be seen from the figure, the measured value of the probe varies with the increase of feed speed. When the feed speed is less than 5 mm/s, the measured value is close to the actual value. When the feed speed continues to increase, the measured value will fluctuate and deviate from the true value.
The standard deviation of the measuring device increases with the increase of feed speed, and the stability of the probe decreases accordingly. As can be seen in Figure 11, the standard deviation can be located within the range of 0.02 mm to 0.07 mm when the feed speed is less than 5 mm/s. The measurement error will continue to increase as the feed speed of the probe increases.

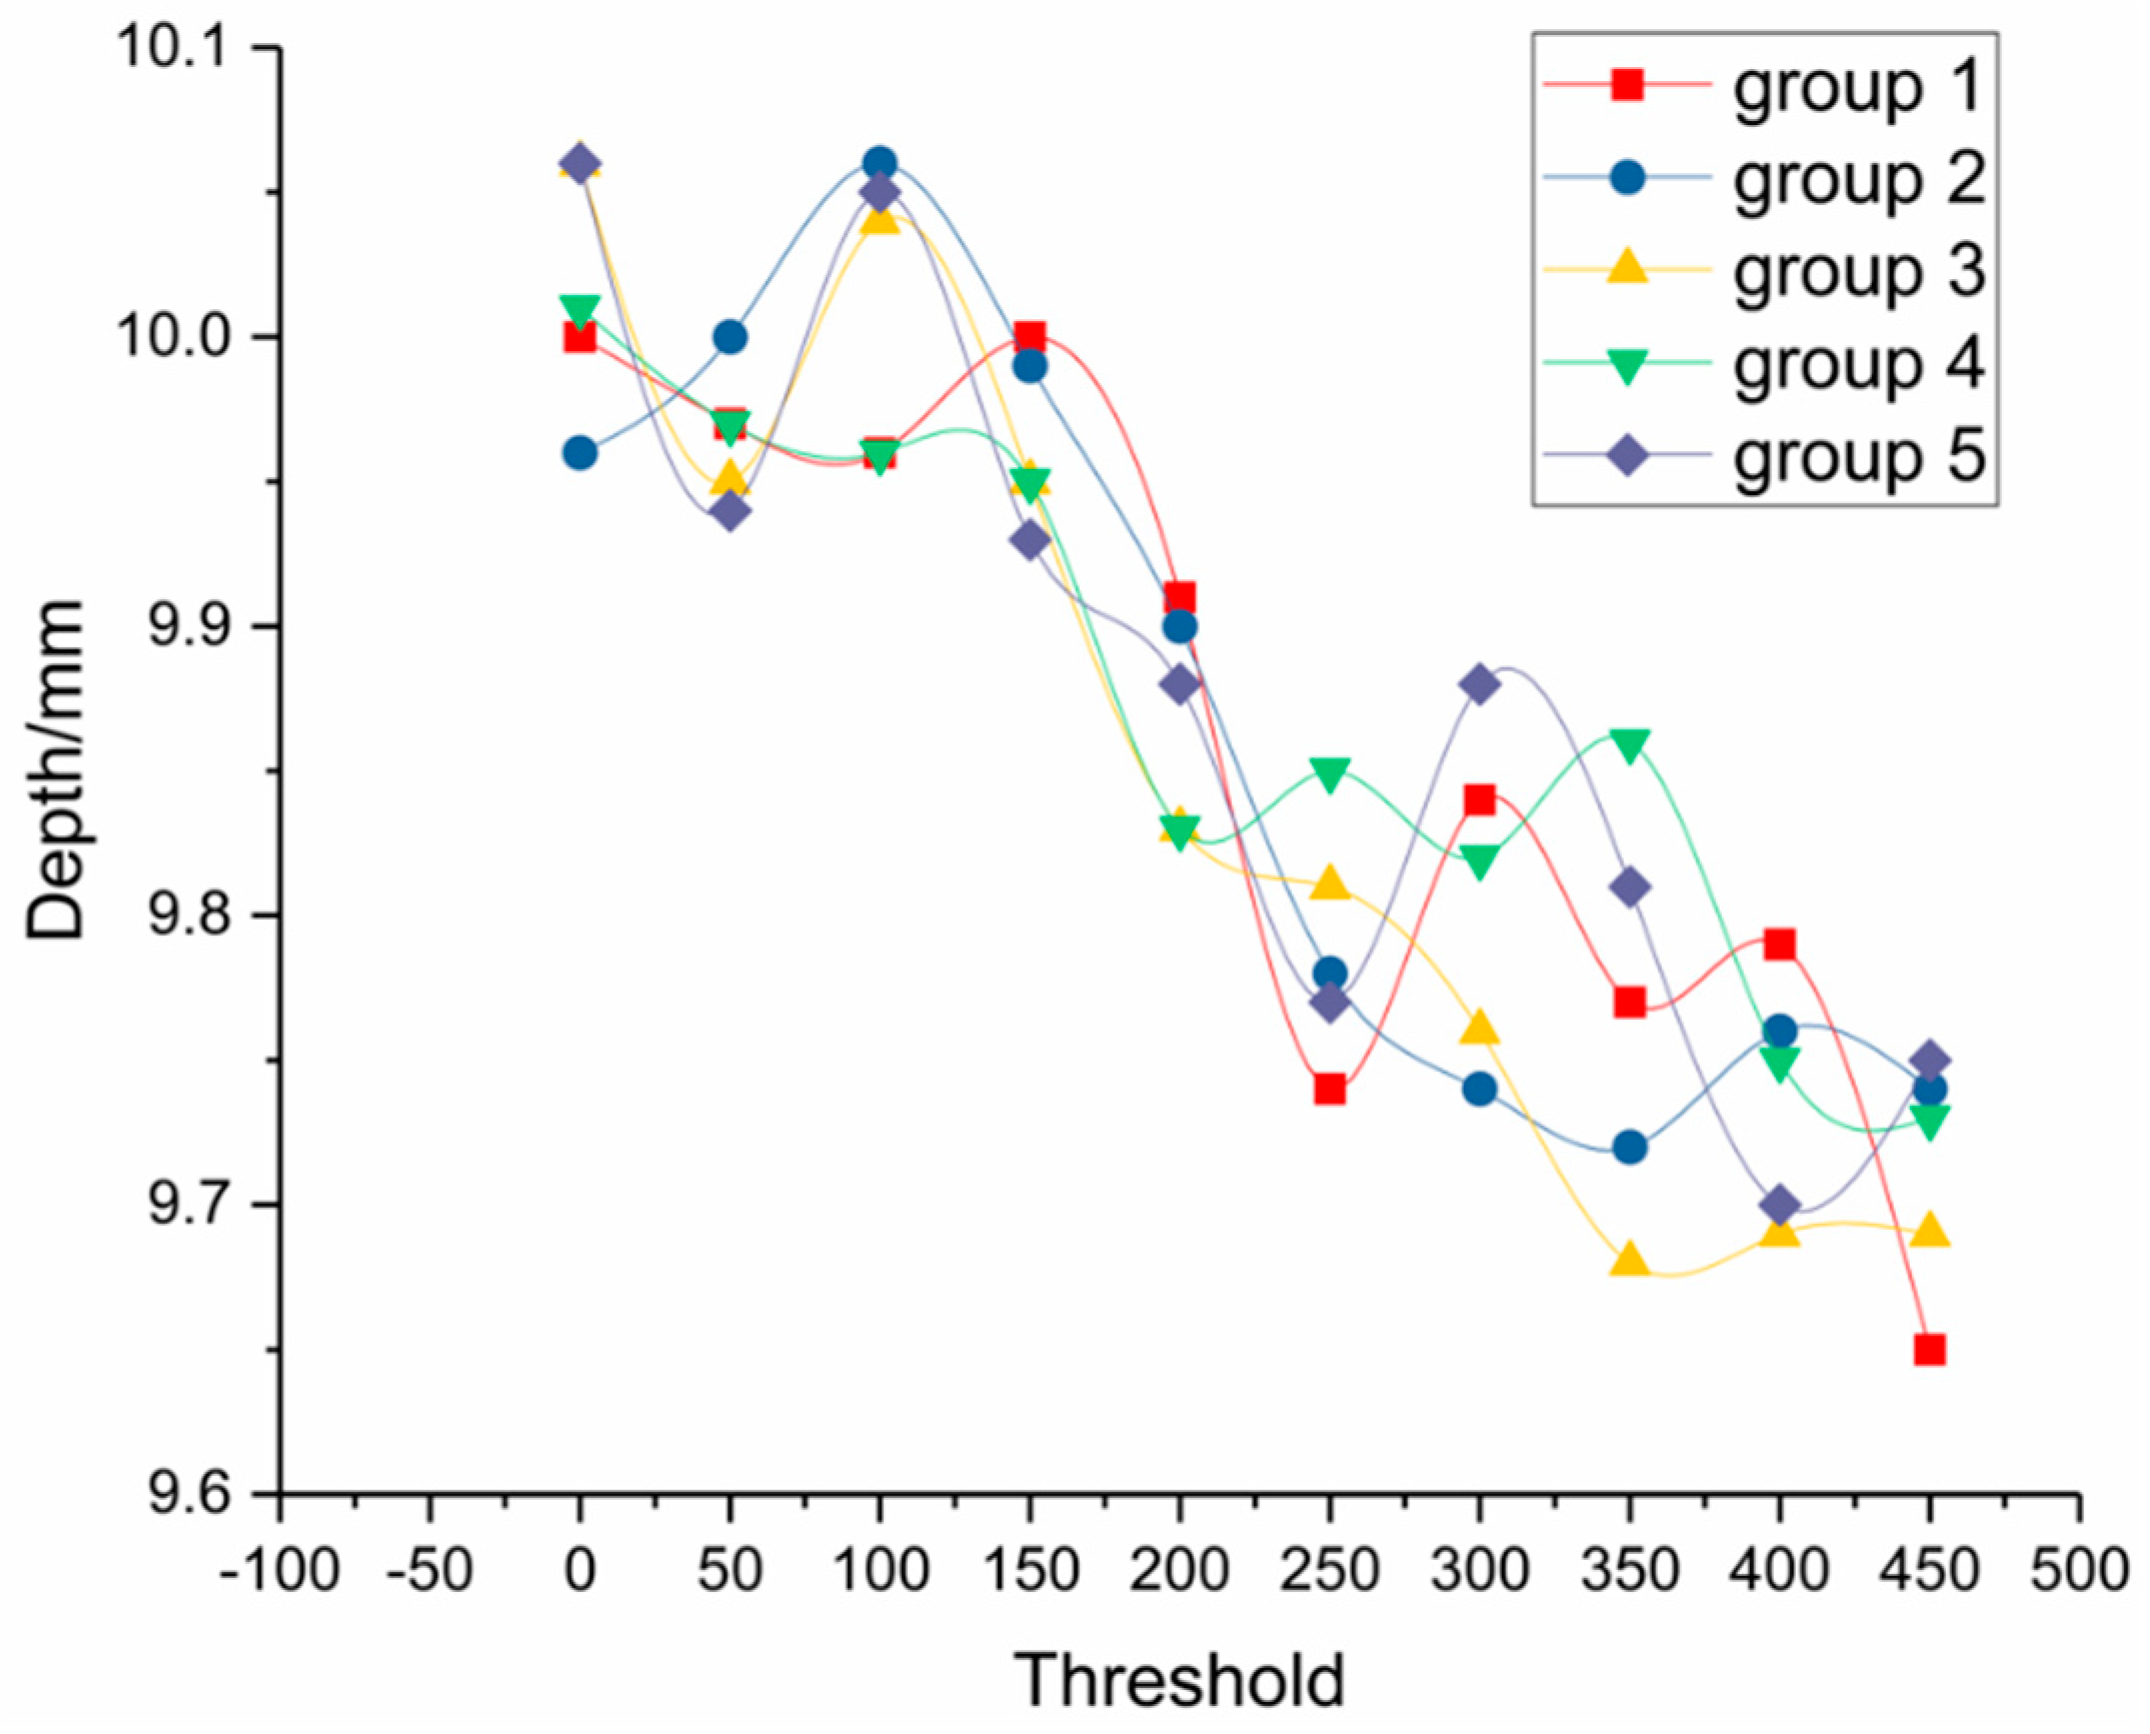
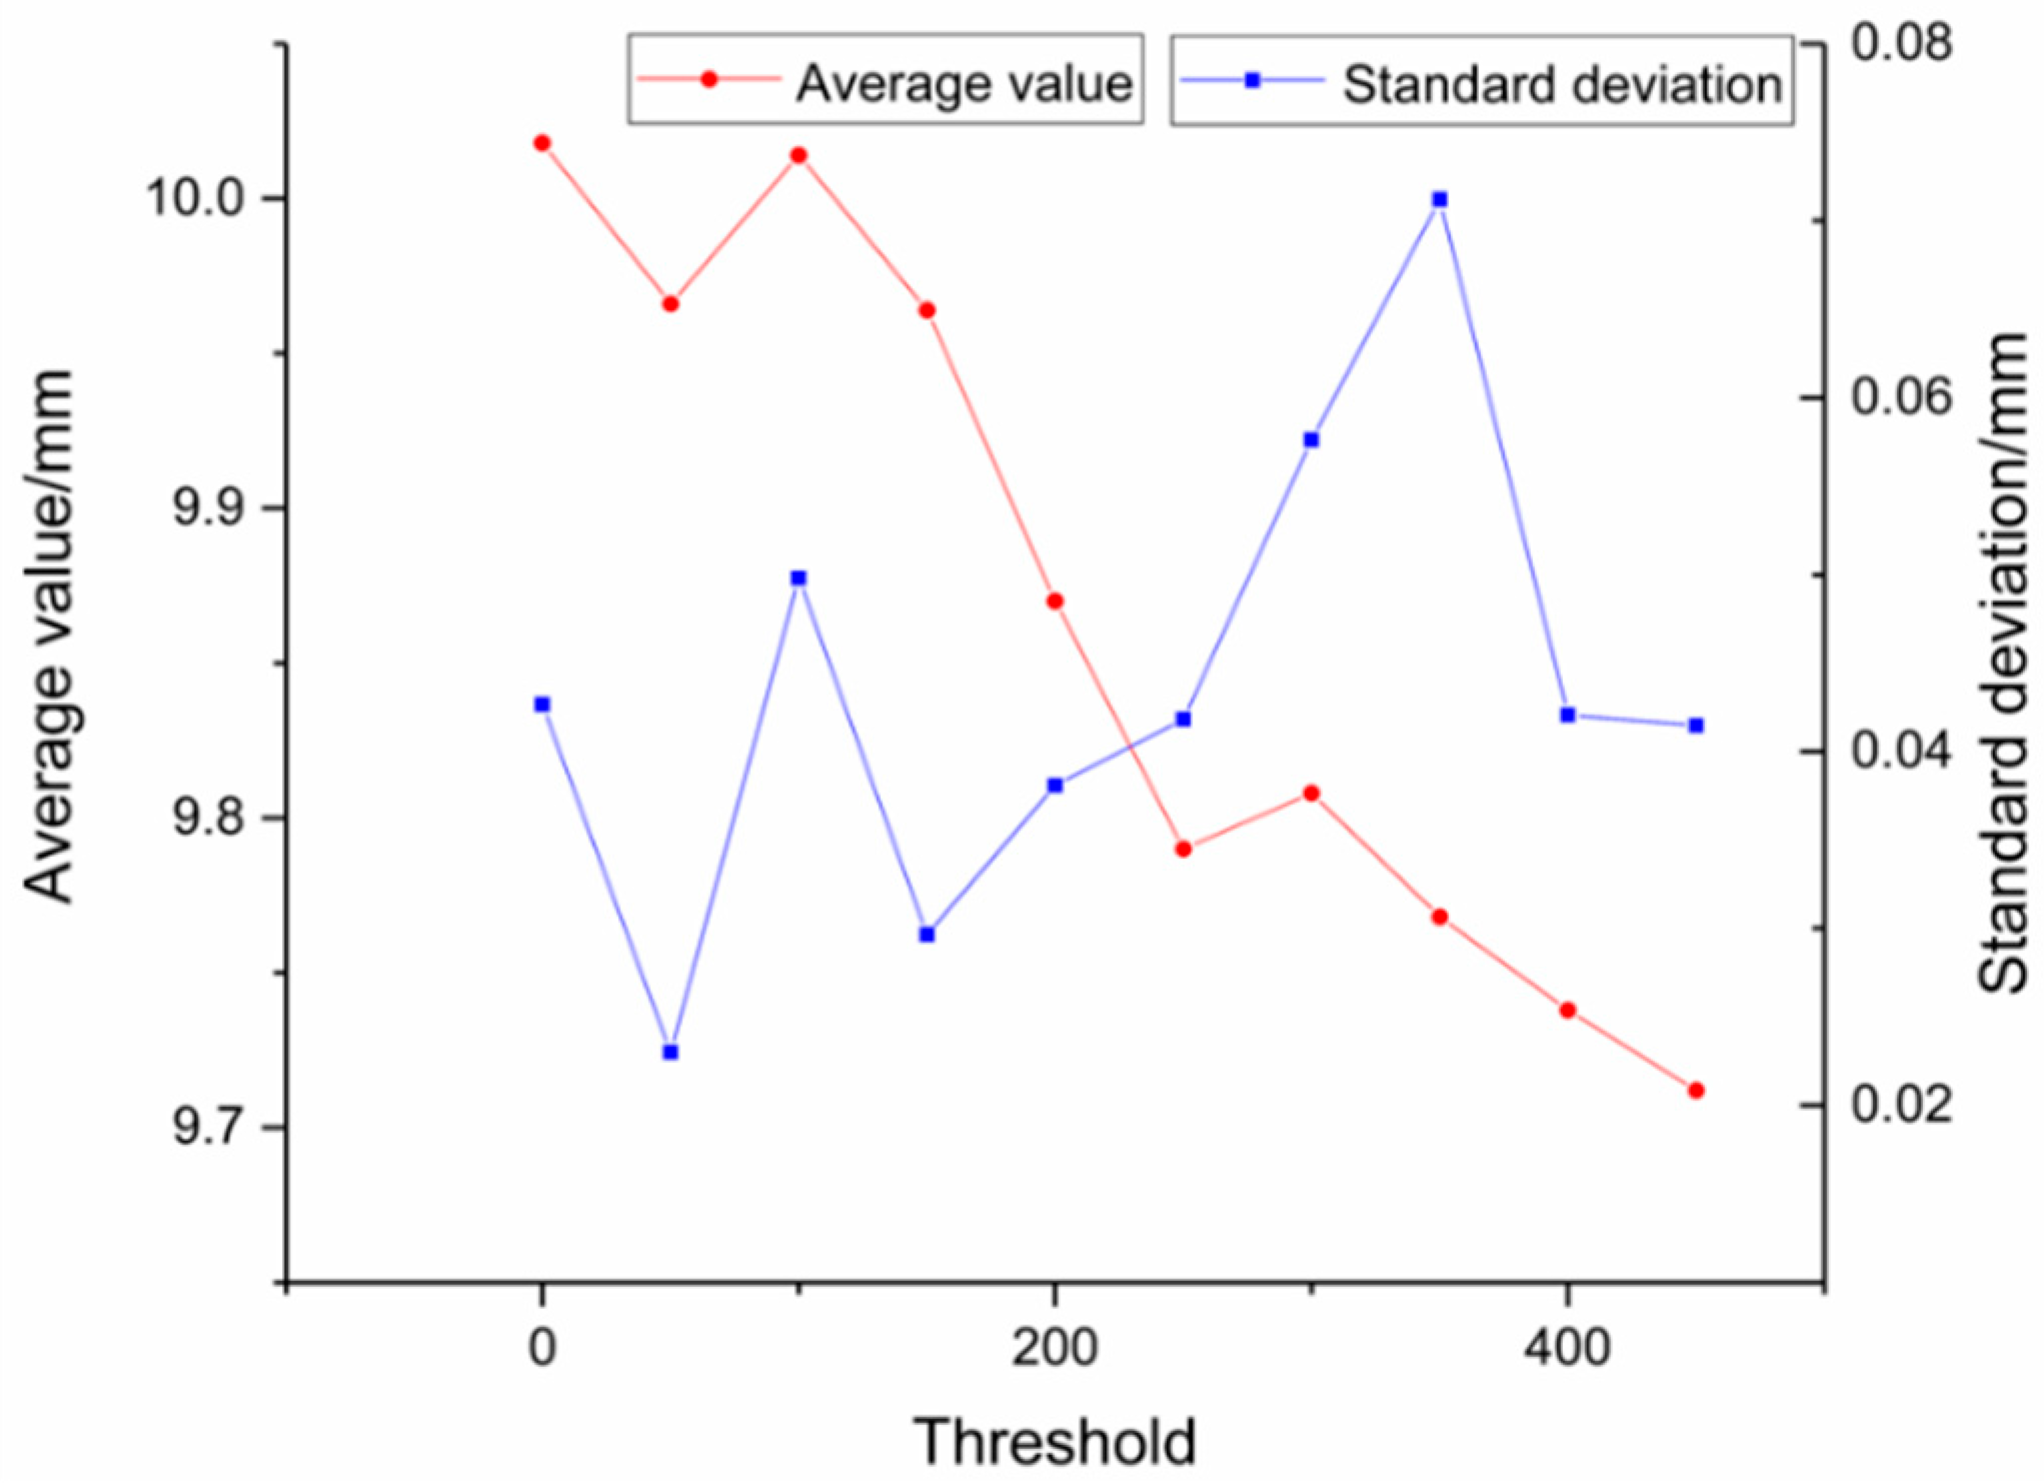
3.3. The Effect of Pixel Threshold on Measurement Accuracy and Stability

This experiment was conducted to test the relationship between the threshold value of the white pixels and the measured depth of holes. The size of the white pixel threshold will directly affect the measured results of the hole depth. The reason is that the laser is projected on the wall of the hole to form a laser spot, and the laser spot has a certain diameter. When the laser beam is just projected onto the edge of the hole wall, the laser spot is incomplete and it is a critical state. How the probe entering or leaving the hole is defined will directly affect the final measurement result.
The image of the laser spot signal received by the CCD sensor during the insertion of the probe into the hole is shown in Figure 12. At the very beginning, the laser beam just touches the upper surface of the hole and forms a very small laser spot [31]; later, about half of the laser beam is projected to the hole wall; after that, the laser spot continues to grow; and at last, all the laser beams are projected to the hole wall. The above processes are completed within a very short time. Therefore, knowing when to start triggering the capacitive grating displacement sensor to record the displacement data (i.e., how much the threshold of white pixels is set) will determine the final result of the measurement data. The relationship between the final measurement result and the white pixel threshold is explored below. The purpose of this experiment is only to find out the relationship between threshold setting and measurement results. There is no in-depth study on how threshold setting affects measurement stability and accuracy, and how to compensate for it. These issues will be addressed in follow-up studies.
Table 3 lists the raw data to reflect the relationship between the threshold value of the white pixels and the measured depth of holes. Ten groups of actual measured value were recorded under each selected pixel threshold in this experiment and five groups of actual measured value were randomly selected and listed in Table 3. The selected threshold of the pixel ranges from 0 to 450 with an interval of 50, the feed speed of the probe is fixed at 4 mm/s, and the standard depth of hole in this experiment is 10 mm.
Figure 13 is drawn to observe the experimental results more visually. The horizontal axis is the threshold value of white pixels, and the vertical axis is the measured hole depth data. As can be seen from this figure, with the increase of the pixel threshold, the measured hole depth data gradually decreases. This trend is in line with expectations. The specific relationship between pixel threshold and measured results are further explained below.
As shown in Figure 14, the red curve is the average of 10 groups of actual measured data. It can be clearly seen that with the increase of pixel threshold, the final measurement value will gradually decrease. The blue curve in Figure 14 shows the standard deviation of the 10 groups of actual measured data. Judging from this graph, the standard deviation of the final measurement data is always fluctuating with the increase of pixel threshold, but all of them are below 0.08. The error fluctuation is within a normal range.

4. Analysis and Discussion

The above experimental results offers the following analyses:
  • According to the repetitive measurement experiment in Section 3.1, it can be seen that in the absence of error compensation algorithm and under measuring speed of 4 mm/s and white pixel threshold of 100, the measurement error of each time is about 0.05 mm and does not exceed 0.1 mm; the fluctuation range of standard deviation is between 0.038 mm and 0.073 mm. Above accuracy and stability of the designed measuring device are sufficient to meet the hole depth measuring requirements for automatic drilling and riveting of large-scale composite board parts.
  • Through the experiment on the effect of feed speed on measurement accuracy in Section 3.2, it can be seen that with the increase of probe feed speed, the measurement stability of the device decreases gradually. Considering the factors of measurement efficiency, the optimal probe feed speed is 5 mm/s, while ensuring its measurement stability.
  • Based on the effect of pixel threshold on measurement values in Section 3.3, it can be seen that with the increase of the pixel threshold, the measured hole depth gradually decreases, which is in line with expectations. Moreover, with the increase of pixel threshold, the stability of measurement fluctuates. Therefore, in order to bring the measuring result closer to the true value, the optimal pixel threshold in this experiment should be 100. In practical applications, the optimal pixel threshold needs to be adjusted according to the measurement object due to effects such as flash, burrs, iron filings, etc.
  • In follow-up studies, we can further design and optimize an error compensation algorithm and automatic calibration method, study the corresponding relationship between feed speed and measurement error and find an effective compensation method, study the mapping relationship between pixel threshold and measurement error and offer a compensation method, study the specific relationship between the diameter of the laser spot and the measurement accuracy, etc., so as to further improve the measurement accuracy and efficiency of the device.
  • This paper only focuses on the design of measuring methods and measuring devices, and preliminarily proves the feasibility of the proposed method. Follow-up research can integrate the prototype device into the automatic riveting manipulator arm and measure the actual engineering sample, and further explore the feasibility and stability of its engineering application.

5. Conclusions

In order to get rid of manual intervention in hole depth measurement and realize on-machine automatic measurement in the automatic drilling and riveting process of largescale composite board parts, a novel hole depth measuring device was designed and developed to achieve accurate and efficient automatic measurement of hole depth parameters. The mechanical structure of the measuring device was developed according to our newly designed measurement scheme and optical path. The structure consists of three parts, namely a probe, an inner casing and an outer casing, the purpose of which is to convert the hole depth data into displacement data of probe motion. The electrical hardware of the device consists of three units: a laser transceiver unit, a displacement measuring unit, and a driving unit. Among them, the laser transceiver unit involves optical path design and image processing; the displacement measuring unit involves the data communication between capacitive grating displacement sensor and the host computer; the driving unit relates to the motion control of the probe. Finally, the experimental results indicated that the proposed measurement method and device can accurately measure the hole depth parameters, and its accuracy and stability are sufficient to meet the hole depth measuring requirements for automatic drilling and riveting of largescale composite board parts. In particular, the influence of probe feed speed and white pixel threshold on the accuracy and stability of the measuring device was explored, which lays the foundation for subsequent research of an error compensation algorithm and a probe calibration method.

Author Contributions

All works with relation to this paper has been accomplished by all authors’ efforts. Conceptualization, X.W. and Y.T.; methodology, Y.T.; software, N.W.; validation, Z.H.; formal analysis, N.W.; investigation, W.Z.; resources, X.W.; data curation, X.W.; writing—original draft preparation, N.W.; writing—review and editing, Y.T. and N.W; visualization, Z.H.; supervision, W.Z.; project administration, W.Z.; funding acquisition, Y.T. and W.Z.

Funding

This research was funded by the National Natural Science Foundation of China (Grant Nos. 51505310, 51435011), the Key Research & Development Program of Sichuan Province of China (Grant No. 2018GZ0282) and the Science & Technology Ministry Innovation Method Program of China (Grant No. 2017IM040100).

Conflicts of Interest

The authors declare no conflict of interest.

References

  1. Dehoff, R.; Duty, C.; Peter, W. Case study: Additive manufacturing of aerospace brackets. Adv. Mater. Process. 2013, 171, 22–25. [Google Scholar] [CrossRef]
  2. Yu, L.; Zhang, Y.; Bi, Q.; Wang, Y. Research on surface normal measurement and adjustment in aircraft assembly. Precis. Eng. 2017, 50, 482–493. [Google Scholar] [CrossRef]
  3. Patterson, J.B.; Grenestedt, J.L. Manufacturing of a composite wing with internal structure in one cure cycle. Compos. Struct. 2018, 206, 601–609. [Google Scholar] [CrossRef]
  4. Ahmed, E.; Wan Badaruzzaman, W.H.; Wright, H.D. Two-way bending behavior of profiled steel sheet dry board composite panel system. Thin-Walled Struct. 2002, 40, 971–990. [Google Scholar] [CrossRef]
  5. Tian, W.; Zhou, Z.; Liao, W. Analysis and investigation of a rivet feeding tube in an aircraft automatic drilling and riveting system. Int. J. Adv. Manuf. Technol. 2016, 82, 973–983. [Google Scholar] [CrossRef]
  6. Bernard, T.; Bergmann, H.W.; Haberling, C.; Haldenwanger, H. Joining Technologies for Al-Foam—Al-Sheet Compound Structures. Adv. Eng. Mater. 2002, 4, 798–802. [Google Scholar] [CrossRef]
  7. Li, Y.; Li, N.; Gao, J. Tooling design and microwave curing technologies for the manufacturing of fiber-reinforced polymer composites in aerospace applications. Int. J. Adv. Manuf. Technol. 2014, 70, 591–606. [Google Scholar] [CrossRef]
  8. Hassan, A.; Maskin, M.; Tom, P.P.; Brayon, F.; Hlavac, P.; Mohamed, F. Operator response modeling and human error probability in TRIGA Mark II research reactor probabilistic safety assessment. Ann. Nucl. Energy 2017, 102, 179–189. [Google Scholar] [CrossRef]
  9. Shetty, D.; Eppes, T.; Campana, C.; Filburn, T.; Nazaryan, N. New Approach to the Inspection of Cooling Holes in Aero-Engines. Opt. Lasers Eng. 2009, 47, 686–694. [Google Scholar] [CrossRef]
  10. Baeg, M.H.; Baeg, S.H.; Moon, C.; Jeong, G.M.; Ahn, H.S.; Kim, D.H. A New Robotic 3D Inspection System of Automotive Screw Hole. Int. J. Control Autom. Syst. 2008, 6, 740–745. [Google Scholar] [CrossRef]
  11. Usamentiaga, R.; Venegas, P.; Guerediaga, J.; Vega, L.; Lopez, I. Non-destructive inspection of drilled holes in reinforced honeycomb sandwich panels using active thermography. Infrared Phys. Technol. 2012, 55, 491–498. [Google Scholar] [CrossRef]
  12. Gong, X.; Su, H.; Zhang, Z.T.; Xu, C. Vision-based quality inspection for components with small diameter and deep hole. In Proceedings of the IEEE International Conference on Mechatronics and Automation, Takamatsu, Japan, 6–9 August 2017; IEEE: New York, NY, USA, 2017; pp. 2016–2021. [Google Scholar]
  13. Bernard, F.; Flaherty, T.; O’Connor, G.M. Novel fiber-based technique for inspection of holes in narrow-bore tubes. In Proceedings of the Optical Measurement Systems for Industrial Inspection VI, Munich, Germany, 15–18 June 2009; SPIE-The International Society for Optical Engineering: Bellingham, WA, USA, 2009; p. 7389. [Google Scholar]
  14. Zavyalov, P. 3D Hole Inspection Using Lens with High Field Curvature. Meas. Sci. Rev. 2015, 15, 52–57. [Google Scholar] [CrossRef] [Green Version]
  15. Quest, D.; Gayer, C.; Hering, P. Depth measurements of drilled holes in bone by laser triangulation for the field of oral implantology. J. Appl. Phys. 2012, 111, 013106. [Google Scholar] [CrossRef]
  16. Takeda, M.; Aokl, T.; Miyamoto, Y.; Tanaka, H.; Gu, R.; Zhang, Z. Absolute three-dimensional shape measurements using coaxial and coimage plane optical systems and Fourier fringe analysis for focus detection. Opt. Eng. 2000, 39, 61–68. [Google Scholar] [CrossRef]
  17. Heredia-Ortiz, M.; Patterson, E.A. On the industrial applications of moire and fringe projection techniques. Strain 2003, 39, 95–100. [Google Scholar] [CrossRef]
  18. Casavola, C.; Pappalettera, G.; Pappalettere, C. Design of a fiber optics fringe projector for 3D reconstruction of dental elements. In Proceedings of the 3rd Mediterranean Photonics Conference, Trani, Italy, 7–9 May 2014. [Google Scholar] [CrossRef]
  19. Lin, C.H.; Powell, R.A.; Jiang, L.; Xiao, H.; Chen, S.J.; Tsai, H.L. Real-time depth measurement for micro-holes drilled by lasers. Meas. Sci. Technol. 2010, 21, 025307. [Google Scholar] [CrossRef]
  20. Ho, C.C.; Chiu, C.M.; Chang, Y.J.; Hsu, J.C.; Kuo, C.L. On-line depth measurement for laser-drilled holes based on the intensity of plasma emission. Meas. Sci. Technol. 2014, 25, 094007. [Google Scholar] [CrossRef]
  21. Hung, Y.H.; Chien, H.L.; Lee, Y.C. Excimer Laser Three-Dimensional Micromachining Based on Image Projection and the Optical Diffraction Effect. Appl. Sci. 2018, 8, 1690. [Google Scholar] [CrossRef]
  22. Agnesi, A.; Degiorgio, V. Beam splitter phase shifts: Wave optics approach. Opt. Laser Technol. 2017, 95, 72–73. [Google Scholar] [CrossRef]
  23. Kumar, U.P.; Haifeng, W.; Mohan, N.K.; Kothiyal, M.P. White light interferometry for surface profiling with a colour CCD. Opt. Lasers Eng. 2012, 50, 1084–1088. [Google Scholar] [CrossRef]
  24. Jahedsaravani, A.; Massinaei, M.; Marhaban, M.H. Development of a machine vision system for real-time monitoring and control of batch flotation process. Int. J. Miner. Process. 2017, 167, 16–26. [Google Scholar] [CrossRef]
  25. Carney, M.N.; Johnston, W.M. A novel regression model from RGB image data to spectroradiometric correlates optimized for tooth colored shades. J. Dent. 2016, 51, 45–48. [Google Scholar] [CrossRef] [Green Version]
  26. Chaves-Gonzalez, J.M.; Vega-Rodriguez, M.A.; Gomez-Pulido, J.A.; Sanchez-Perez, J.M. Detecting skin in face recognition systems: A colour spaces study. Digit. Signal Prog. 2010, 20, 806–823. [Google Scholar] [CrossRef]
  27. Seo, D.K.; Kim, Y.H.; Eo, Y.D.; Park, W.Y. Learning-Based Colorization of Grayscale Aerial Images Using Random Forest Regression. Appl. Sci. 2018, 8, 1269. [Google Scholar] [CrossRef]
  28. Pai, K.J.; Qin, L.D.; Lin, C.H.; Tang, S.Y. Start-Up Current Spike Mitigation of High-Power Laser Diode Driving Controller for Vehicle Headlamp Applications. Appl. Sci. 2018, 8, 1532. [Google Scholar] [CrossRef]
  29. Chen, Q.; Sun, Q.S.; Heng, P.A.; Xia, D.S. A double-threshold image binarization method based on edge detector. Pattern Recognit. 2008, 41, 1254–1267. [Google Scholar] [CrossRef]
  30. Nouira, H.; Vissiere, A.; Damak, M.; David, J.M. Investigation of the influence of the main error sources on the capacitive displacement measurements with cylindrical artefacts. Precis. Eng. 2013, 37, 721–737. [Google Scholar] [CrossRef]
  31. Lee, D.; Cho, J.; Kim, C.H.; Lee, S.H. Application of laser spot cutting on spring contact probe for semiconductor package inspection. Opt. Laser Technol. 2017, 97, 90–96. [Google Scholar] [CrossRef]
Figure 1. Schematic diagram of the probe movement process.
Applsci 08 02671 g001
Figure 2. Optical path design of the measuring system.
Applsci 08 02671 g002
Figure 3. The block diagram of imaging identification and screening process; CCD: Charge-coupled device.
Applsci 08 02671 g003
Figure 4. Internal structure of the measuring device; MCU: microcontroller unit.
Applsci 08 02671 g004
Figure 5. Schematic diagram of equipment structure design.
Applsci 08 02671 g005
Figure 6. Hardware connection diagram of the measurement system; DC: direct current
Applsci 08 02671 g006
Figure 7. Control flow chart of the measurement process.
Applsci 08 02671 g007
Figure 8. The entity of the device and the state of its measurement.
Applsci 08 02671 g008
Figure 9. Measurement accuracy and repeatability analysis: (a) the average value and difference values under different standard depths; (b) the standard deviation curve of the repeatability experiment.
Applsci 08 02671 g009
Figure 10. The depth data measured at different feed speeds.
Applsci 08 02671 g010
Figure 11. The average value and standard deviation under different feed speeds.
Applsci 08 02671 g011
Figure 12. The image received by the CCD sensor of probe in the process of measurement: (a) Level with upper surface; (b) Half of the laser projection; (c) Most laser projection; (d) All laser projection.
Applsci 08 02671 g012
Figure 13. The measurement data under different pixel thresholds.
Applsci 08 02671 g013
Figure 14. The average value and standard deviation in pixel threshold experiment.
Applsci 08 02671 g014
Table 1. Experimental data for measurement accuracy and repeatability verification.
Standard Depth (mm)Five sets of Actual Measured Value (mm)
FirstSecondThirdFourthFifth
33.033.082.982.932.90
44.004.013.984.074.10
55.015.105.065.035.07
65.996.096.035.995.96
77.037.007.097.106.90
87.947.938.028.018.05
98.939.058.978.908.91
109.9310.049.909.9310.00
1110.9411.0311.0811.111.02
1211.9511.9712.0611.9111.95
1313.0513.0813.0313.0712.96
1414.0414.0714.0513.9214.01
1515.0615.0515.0515.0915.04
1615.9815.9215.9216.0115.93
1717.0717.0016.9417.0217.07
1818.0418.0618.0117.9818.00
1918.9518.9918.9519.0219.02
2019.9920.0720.0520.0620.03
2120.9721.0820.9721.0121.03
2222.0821.9821.9522.0421.95
2323.0222.9322.9923.0622.98
2424.0324.0323.9423.9423.98
2524.9825.0025.0724.9824.96
2625.9425.9726.0325.9525.94
2727.0826.9827.0726.9926.94
2827.9228.0228.0528.0727.96
2929.0028.9229.0729.0528.98
3029.9730.0630.0529.9929.97
Table 2. The effect of feed speed on the accuracy of measurement: actual measured value.
Feed Speed (mm/s)Five Groups of Actual Measured Value (mm)
FirstSecondThirdFourthFifth
39.979.999.979.949.99
49.9510.019.9110.0010.04
59.9910.019.9410.1310.00
610.1210.0310.1610.119.84
710.149.949.919.949.85
810.069.8410.109.749.81
910.1310.089.7410.2010.04
109.639.910.169.809.87
119.6310.3110.2910.259.64
129.759.879.559.7910.44
Table 3. The effect of pixel threshold on measurement value: actual measured value.
Pixel ThresholdFive Groups of Actual Measured value (mm)
FirstSecondThirdFourthFifth
0109.9610.0610.0110.06
509.97109.959.979.94
1009.9610.0610.049.9610.05
150109.999.959.959.93
2009.919.99.839.839.88
2509.749.789.819.859.77
3009.849.749.769.829.88
3509.779.729.689.869.81
4009.799.769.699.759.7
4509.659.749.699.739.75

