Article

Modelling Long-Term Durability Performance of Cementitious Materials under Sodium Sulphate Interaction

1
Division of Sustainable Resources Engineering, Faculty of Engineering, Hokkaido University, Kita 13, Nishi 8, Kita-ku, Sapporo 060-8628, Japan
2
Taisei Corporation, 344-1 Nase-cho, Totsuka-ku, Yokohama 245-0051, Japan
3
Hokkaido University, Kita 8, Nishi 5, Kita-ku, Sapporo 060-0808, Japan
*
Author to whom correspondence should be addressed.
Appl. Sci. 2018, 8(12), 2597; https://doi.org/10.3390/app8122597
Submission received: 29 November 2018 / Revised: 6 December 2018 / Accepted: 10 December 2018 / Published: 12 December 2018
(This article belongs to the Section Environmental Sciences)

Abstract

:
Cementitious materials are one of the essential components for low- and intermediate-level waste disposal sites. Low-level nuclear waste from power plants consists of highly concentrated (~25 wt %) Na2SO4, and the wastes are solidified with cementitious materials. Degradation of cementitious materials that result from chemical and physical sulphate attack is a major concern in the safety of the waste disposal. In this study, hydration and reactive transport models, developed in previous works by the authors, were applied with Pitzer interactions coefficients to evaluate the long-term performance of Portland cement (PC) solidified with high concentration of Na2SO4. Expansive sulphate-bearing products of ettringite and mirabilite were formed and filled the pores in the hydrating PC with 25% of Na2SO4 by weight, but they were destabilised as temperature increased. Influence of Na2SO4 concentration and temperature on mineralogical changes is discussed. The simulation results from the reactive-transport model showed that the degradation of solidified Na2SO4 waste by cementitious materials exposed to 10% Na2SO4 for 1000 years is due to dissolution of mirabilite and secondary formation of ettringite, but not Na2SO4 crystallisation. The phases and porosity became stable close to exposure surface after 10 years, although the deterioration progressed from the surface to core with exposure time.

Graphical Abstract

1. Introduction

Portland cement (PC) is an important material at several low- and intermediate-level radioactive waste disposal facilities in most countries, because of its high-quality performance in various environments and its ability to act as a chemical barrier to prevent or retard the transport of radionuclides [1,2]. In the past, a considerable amount of research has been carried out to assess the suitability of cementitious materials for immobilisation of various radionuclides, to ensure the reliable long-term performance of the disposal system [1,3,4,5,6]. Seawater has been used as a cooling water in many nuclear power plants, and the resultant precipitates in the pipes, including NaCl, have been removed by sulfuric acid. This process produces highly concentrated sodium sulphate, up to 25% by weight, as a low-level radioactive waste needing disposal [7,8]. These liquid wastes are solidified with cement systems at elevated temperature before they proceed to waste disposal. It is important to study the performance of solidified waste because of the chemical interaction between liquid wastes and the cement matrix, and the crystallisation of soluble solids.
It has long been recognised that the chemical interaction of sulphate with cement hydrates forms expansive products such as ettringite, gypsum, and thaumasite, resulting in spalling, swelling, cracking, and eventual failure of concrete structures [9]. Over the past couple of decades, intensive work has been carried out on internal and external sulphate attack in cementitious materials [8,9,10,11,12,13]. The formation of sulphate-bearing phases depends on the concentration of sulphate solution, the chemical composition of the cement, cement additives, and the porosity of hydrated cement [9,12]. In external sulphate attack, ingress of sulphate ions induces chemical degradation of cement matrix. Furthermore, leaching of calcium and hydroxide ions from the pore solution of the cement matrix to external environments causes decalcification of cementitious material, and thus increases the porosity and permeability of the material [10,12]. The formation of sodium sulphate crystals or their phase change can also induce degradation [14]. Crystallisation of mirabilite (Na2SO4:10H2O) and thenardite (Na2SO4), or their phase changes (mirabilite to thenardite or vice versa), due to temperature or sodium sulphate concentration do not involve any chemical interaction with cement hydrates. Although many studies have reported chemical and physical sulphate attack, the associated mechanisms and influencing parameters of sulphate attack are incomplete.
A critical concern of highly concentrated sodium sulphate nuclear waste with the co-hydration of PC is the degradation of the cementitious materials, by chemical interaction of sulphate with cement hydrates and crystallisation of sodium sulphate. Further, the repository environment and its changes significantly affect the long-term performance of waste storage systems [1]. The potential variation of physicochemical properties of cementitious materials, as a result of PC hydration in aqueous solid waste, and the transport of ions are important factors to consider in maintaining performance over the time scale required. Hydration and reactive-transport models are essential tools to evaluate the performance of waste storage systems, because the degradation of the materials needs to be predicted precisely as a function of time and depth. Several studies have published reactive transport simulations for performance evaluation of cementitious materials in nuclear waste repositories using various geochemical codes, and the models have been improved by incorporating various features and mechanisms and coupling between them [15,16,17,18,19,20]. However, research on the long-term performance of sodium sulphate waste solidified with cementitious materials is very limited. Therefore, it is essential to evaluate long-term performance of waste storage in terms of mineralogical changes as a function of time and distance, using mathematical models for hydration and reactive-transport.
In this paper, the interaction of sodium sulphate in the hydration and degradation of cementitious materials is studied, to evaluate PC on its performance in low- and intermediate-level radioactive waste. A hydration model [21] that coupled the geochemical code PHREEQC [22,23] with empirical equations for dissolution of clinker minerals, which were developed in a previous study, was used to predict composition of hydrate assemblage and pore solution concentration of co-hydrating PC with sodium sulphate. Pitzer interaction parameters were used for activity calculation in the model [24]. The sensitivity of the degradation to sodium sulphate concentration and temperature is discussed. Finally, performance of the sodium sulphate solidified waste due to external sulphate attack is evaluated using a reactive transport model [25], considering phase-equilibrium reactions and multi-species transport.

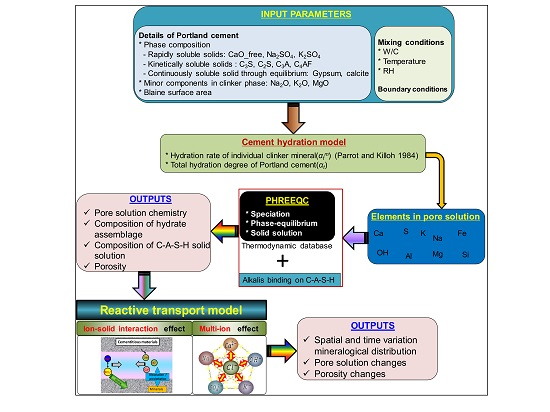
2. Calculation Procedure and Input Parameters

The hydration and reactive transport calculations were performed as presented schematically in Figure 1. Initially, pore solution concentration, composition of hydrate assemblage, solid solution composition of calcium aluminosilicate hydrate (CASH), and total porosity were calculated from the hydration model for the input of chemical composition and physical properties of PC, and mixing conditions such as water to cement ratio, the amount of sodium sulphate in the mixing water, temperature, and relative humidity The details of PC and mixing conditions used in the simulations are tabulated in Table 1. The simulation results from the hydration model were given to the reactive transport model, together with boundary conditions for thermodynamic equilibrium and multispecies transport calculations. The reactive transport simulations were performed using the incorporated multicomponent diffusion module in PHREEQC. The basic theory behind thermodynamic equilibrium reactions, cement hydration, and multi-ionic transport is described in the authors’ previous works [21,25,26], and given in Appendix A. The thermodynamic properties for various phases and minerals found in the cement system were collected from CEMDATA07 [27] and others [28,29], and the data were converted into a format suitable for PHREEQC. The converted data (reported in Reference [21]), together with the PHREEQC default thermodynamic database [23], were used for every calculation; the thermodynamic database for minerals and phases is given in Table A1. The dissolution rate of clinker minerals and their activation energy are described in Appendix A.2. The ideal solid solution model was assumed for CASH, and its composition consisted of CASH_5CA, CASH_INFCA, CSH_T2C, CSH_T5C, CSH_Jen, and CSH_TobH, as given in Table A1. Thermodynamic properties of aqueous species used in the simulations are from PITZER database, provided with PHREEQC and the Pitzer interaction parameters from references [30,31,32].

3. Simulation Results and Discussions

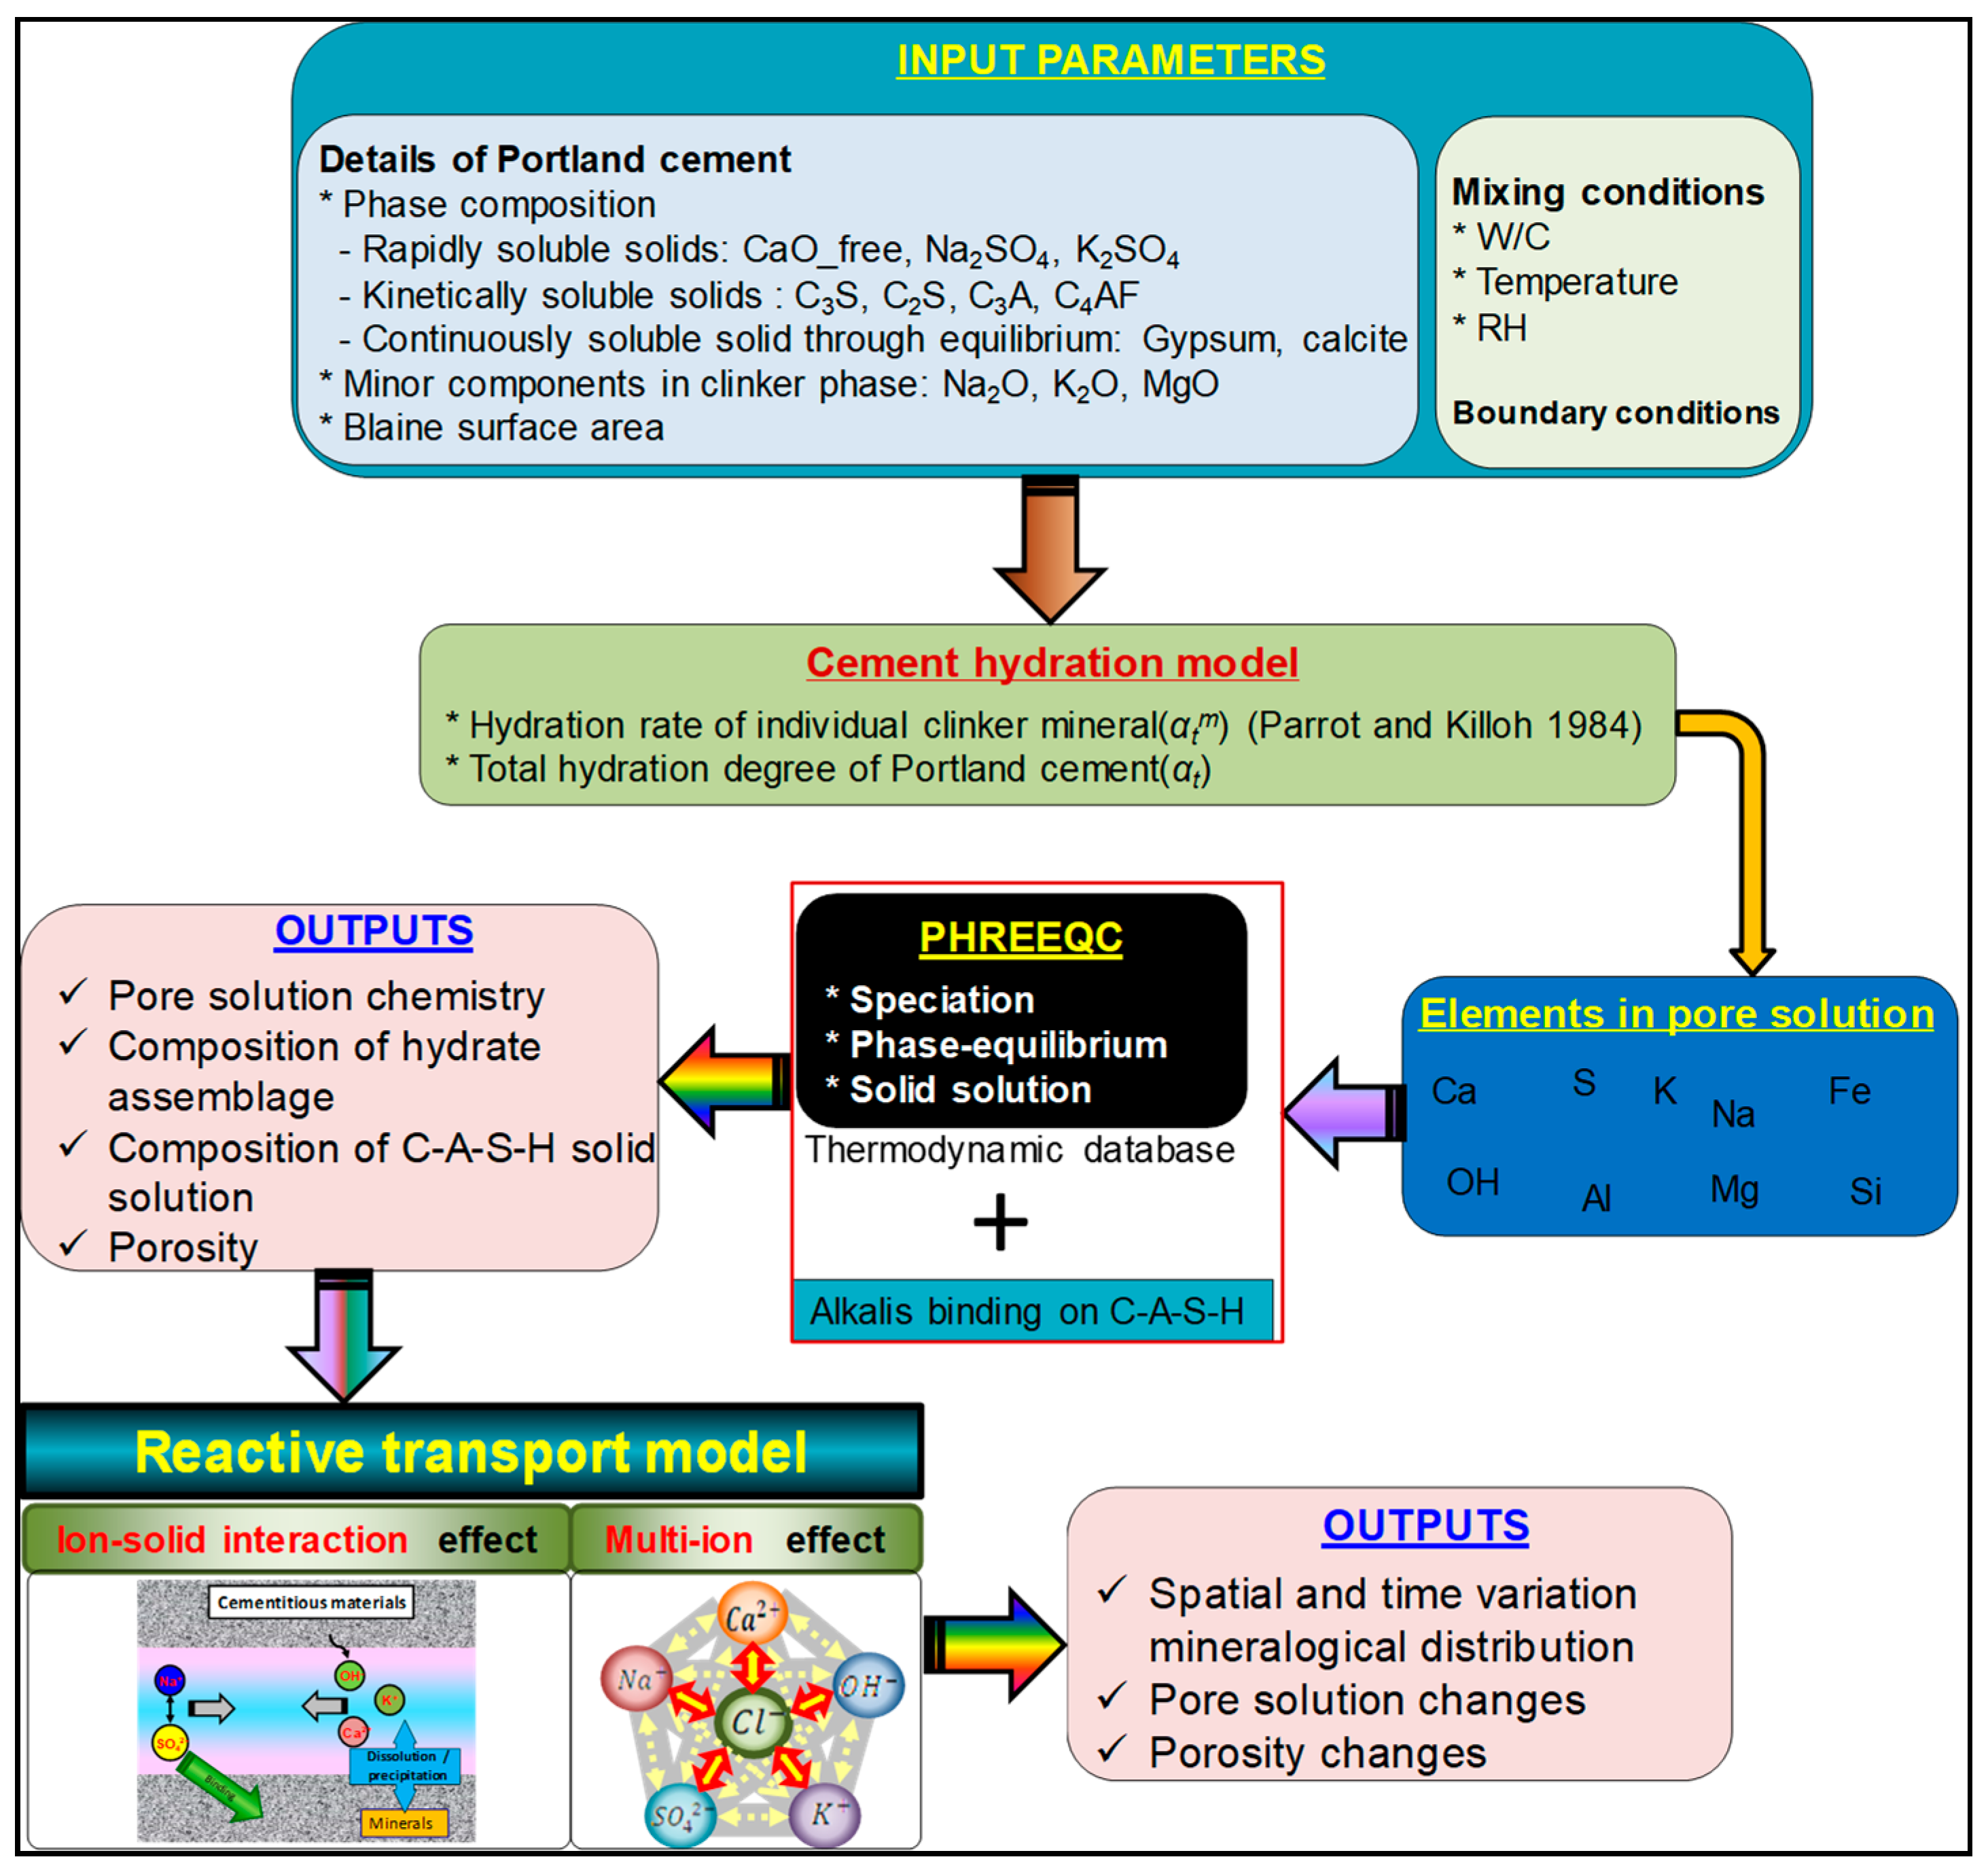
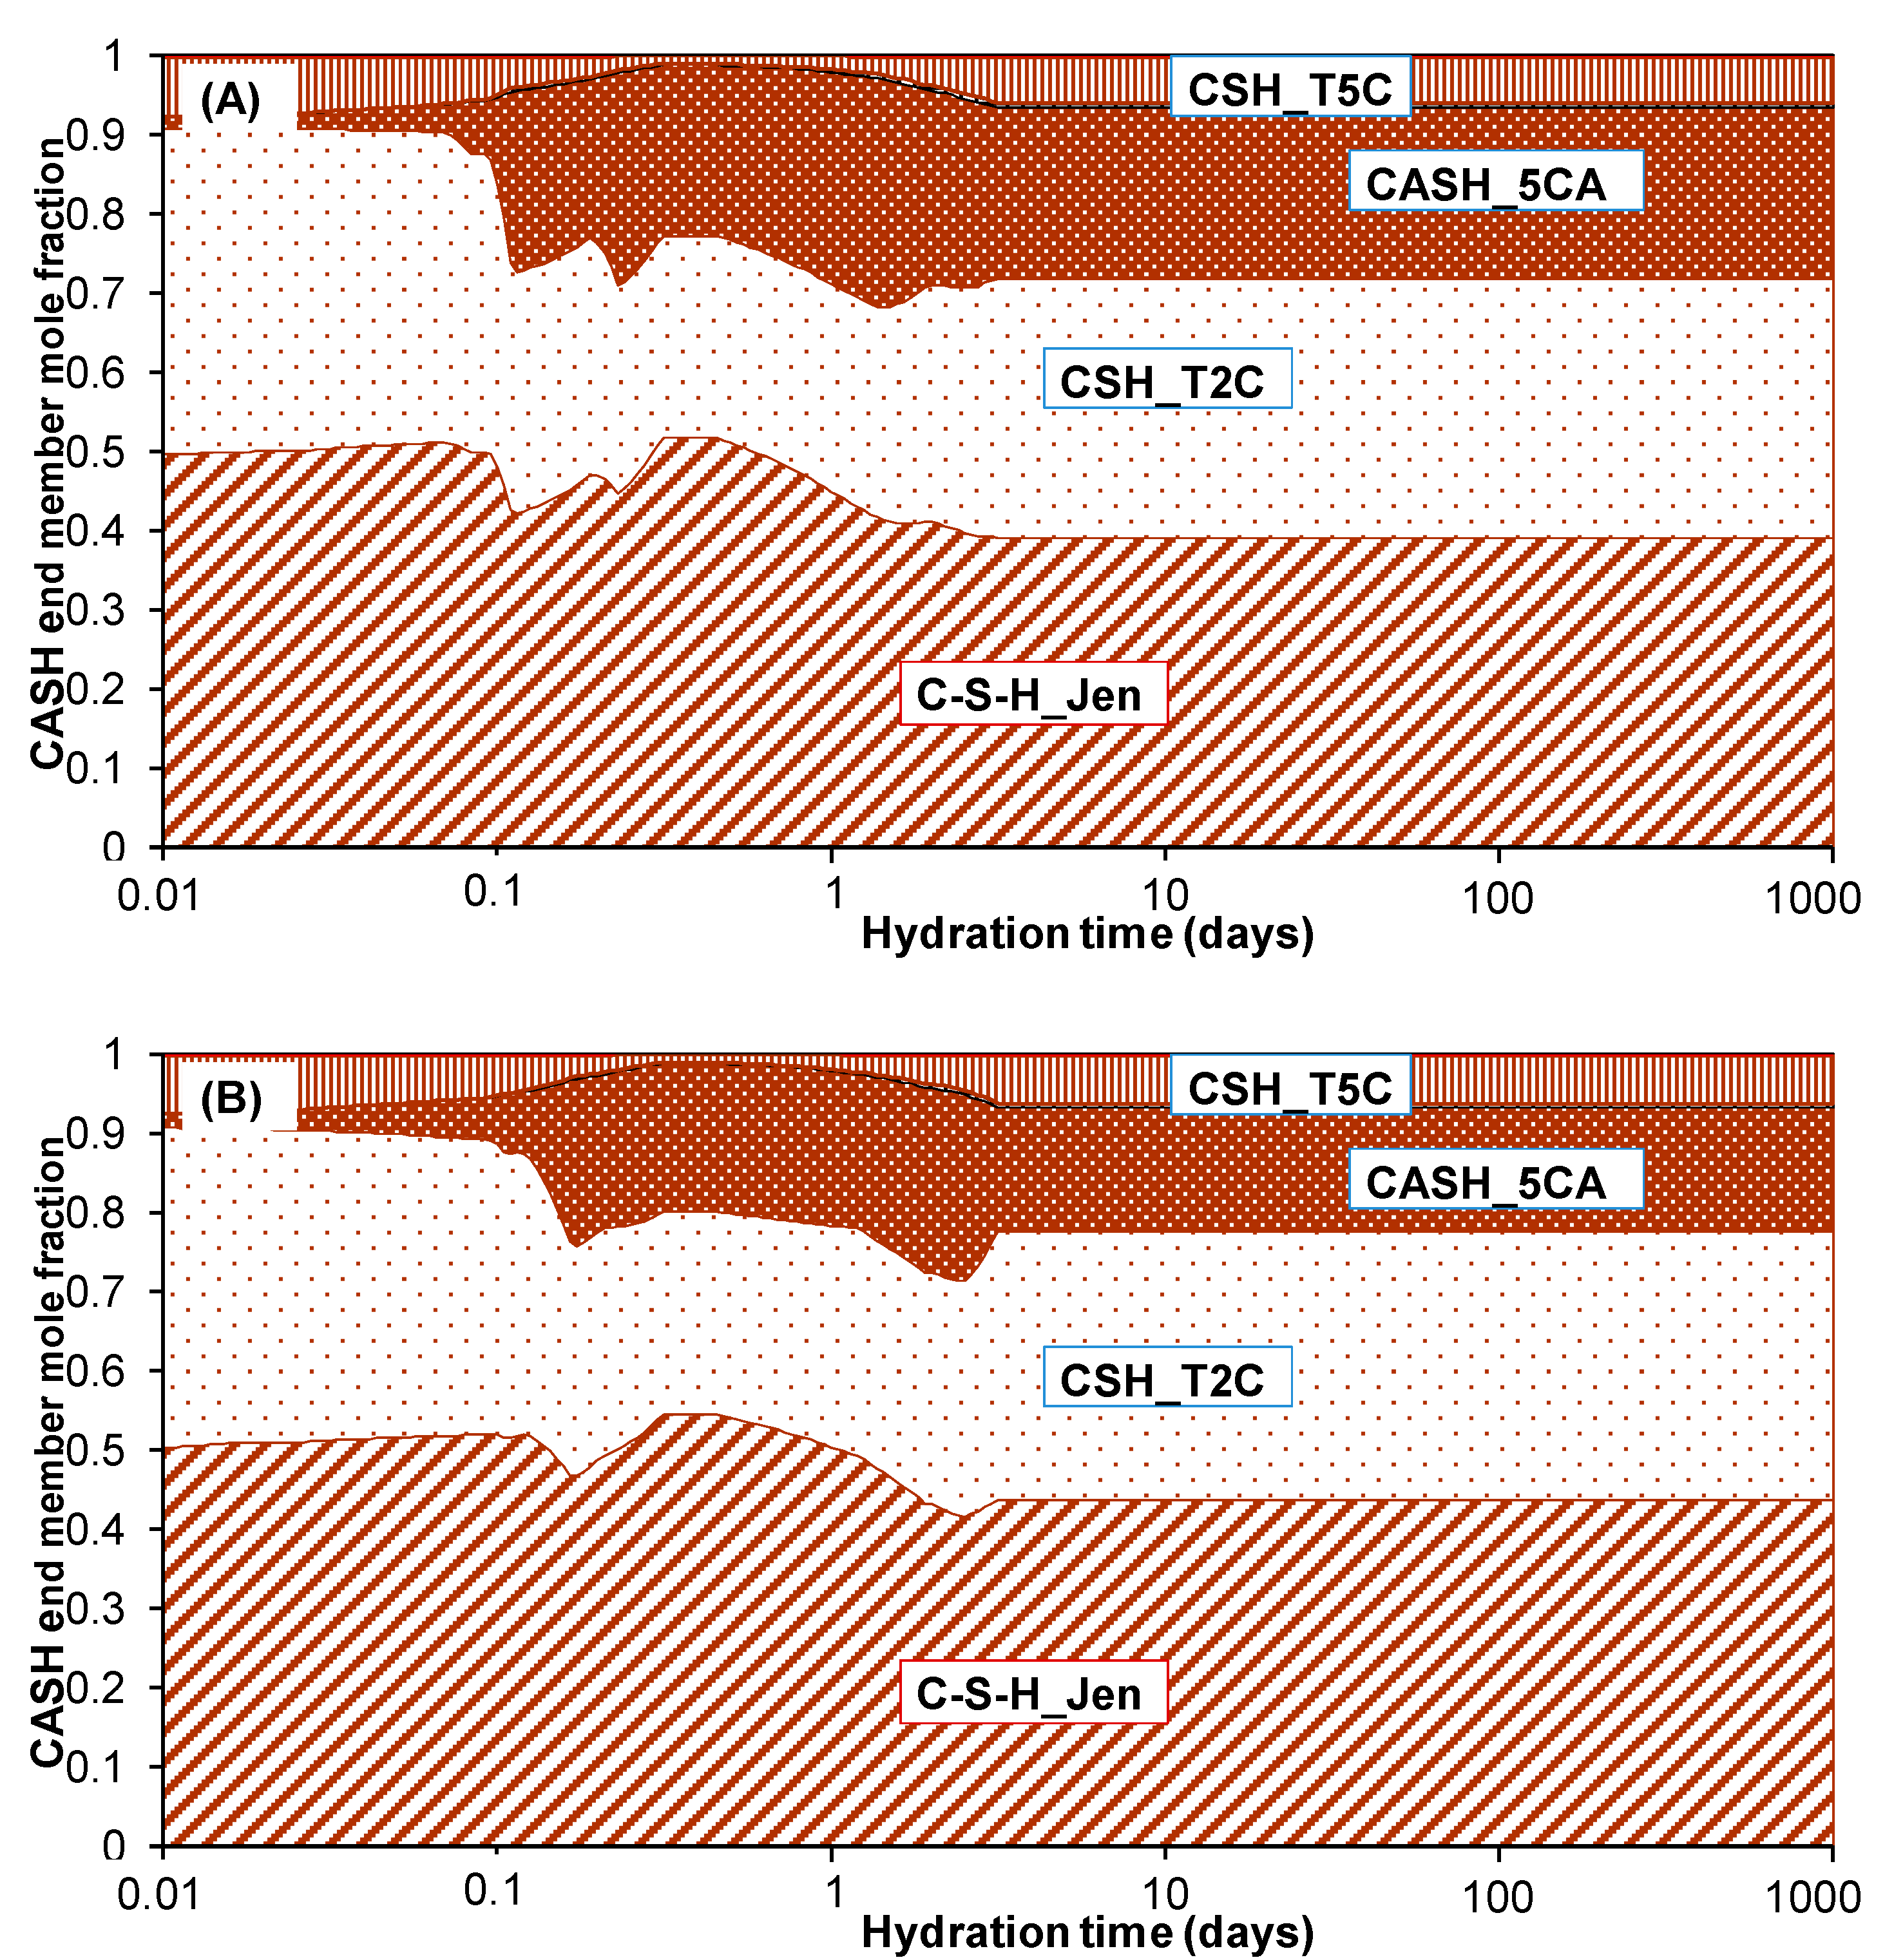
3.1. Check on Thermodynamic Database

The default PHREEQC database (Phreeqc.dat) uses the extended Debye-Huckel equation, or the Truesdell and Jones equation [22], for activity coefficient computation. It is well known that the usable range of the equation is limited, up to 2 of ionic strength in chloride solution [22]. However, the cementitious material environment considered in this study consists of a high concentration of Na2SO4 solution and thus, the use of the extended Debye-Huckel equation for speciation calculation would be questionable. On the other hand, the calculation using Pitzer’s model would provide a good approximation for activity coefficients in high concentration [30]. In order to check the database or the activity coefficient equation, a calculation for Na2SO4 solubility was performed using the PHREEQC default database [23] (Phreeqc.dat) and the PITZER database [30] (Pitzer.dat), which uses the PITZER equation described in the Appendix A.1, Equations (A2–A5), with interaction parameters for various ions. As shown in Figure 2, Pitzer.dat allowed us to predict the correct solubility of Na2SO4 as a function of concentration, but Phreeqc.dat could reasonably predict the experimental results at lower concentration only. Before applying the Pitzer model for the cement system at high ionic strength, it needed to be checked with the conventional database in terms of hydration. Figure 3 shows the influence of the two databases on the hydration of PC in water as a function of curing age. Both ionic profiles and mineralogical distribution were independent of the activity coefficient equation. This was due to low ionic strength of pore solution, which was lower than 0.52, and the Pitzer model showed the same results as the Debye-Huckel equation or the Truesdell and Jones equation.
The hydration model has already been validated in an authors’ previous study by comparing simulation results with experimental data on hydrate assemblage and composition of pore solution for hydrating PC, cement blended with slag, and blended cement containing limestone [21]. The validity of the reactive transport model was also established for short- and long-term ionic ingress in both cement paste and sulphate-resistant PC concrete [25,26]. Therefore, the models can be used to evaluate the long-term performance of cementitious materials in various environments.

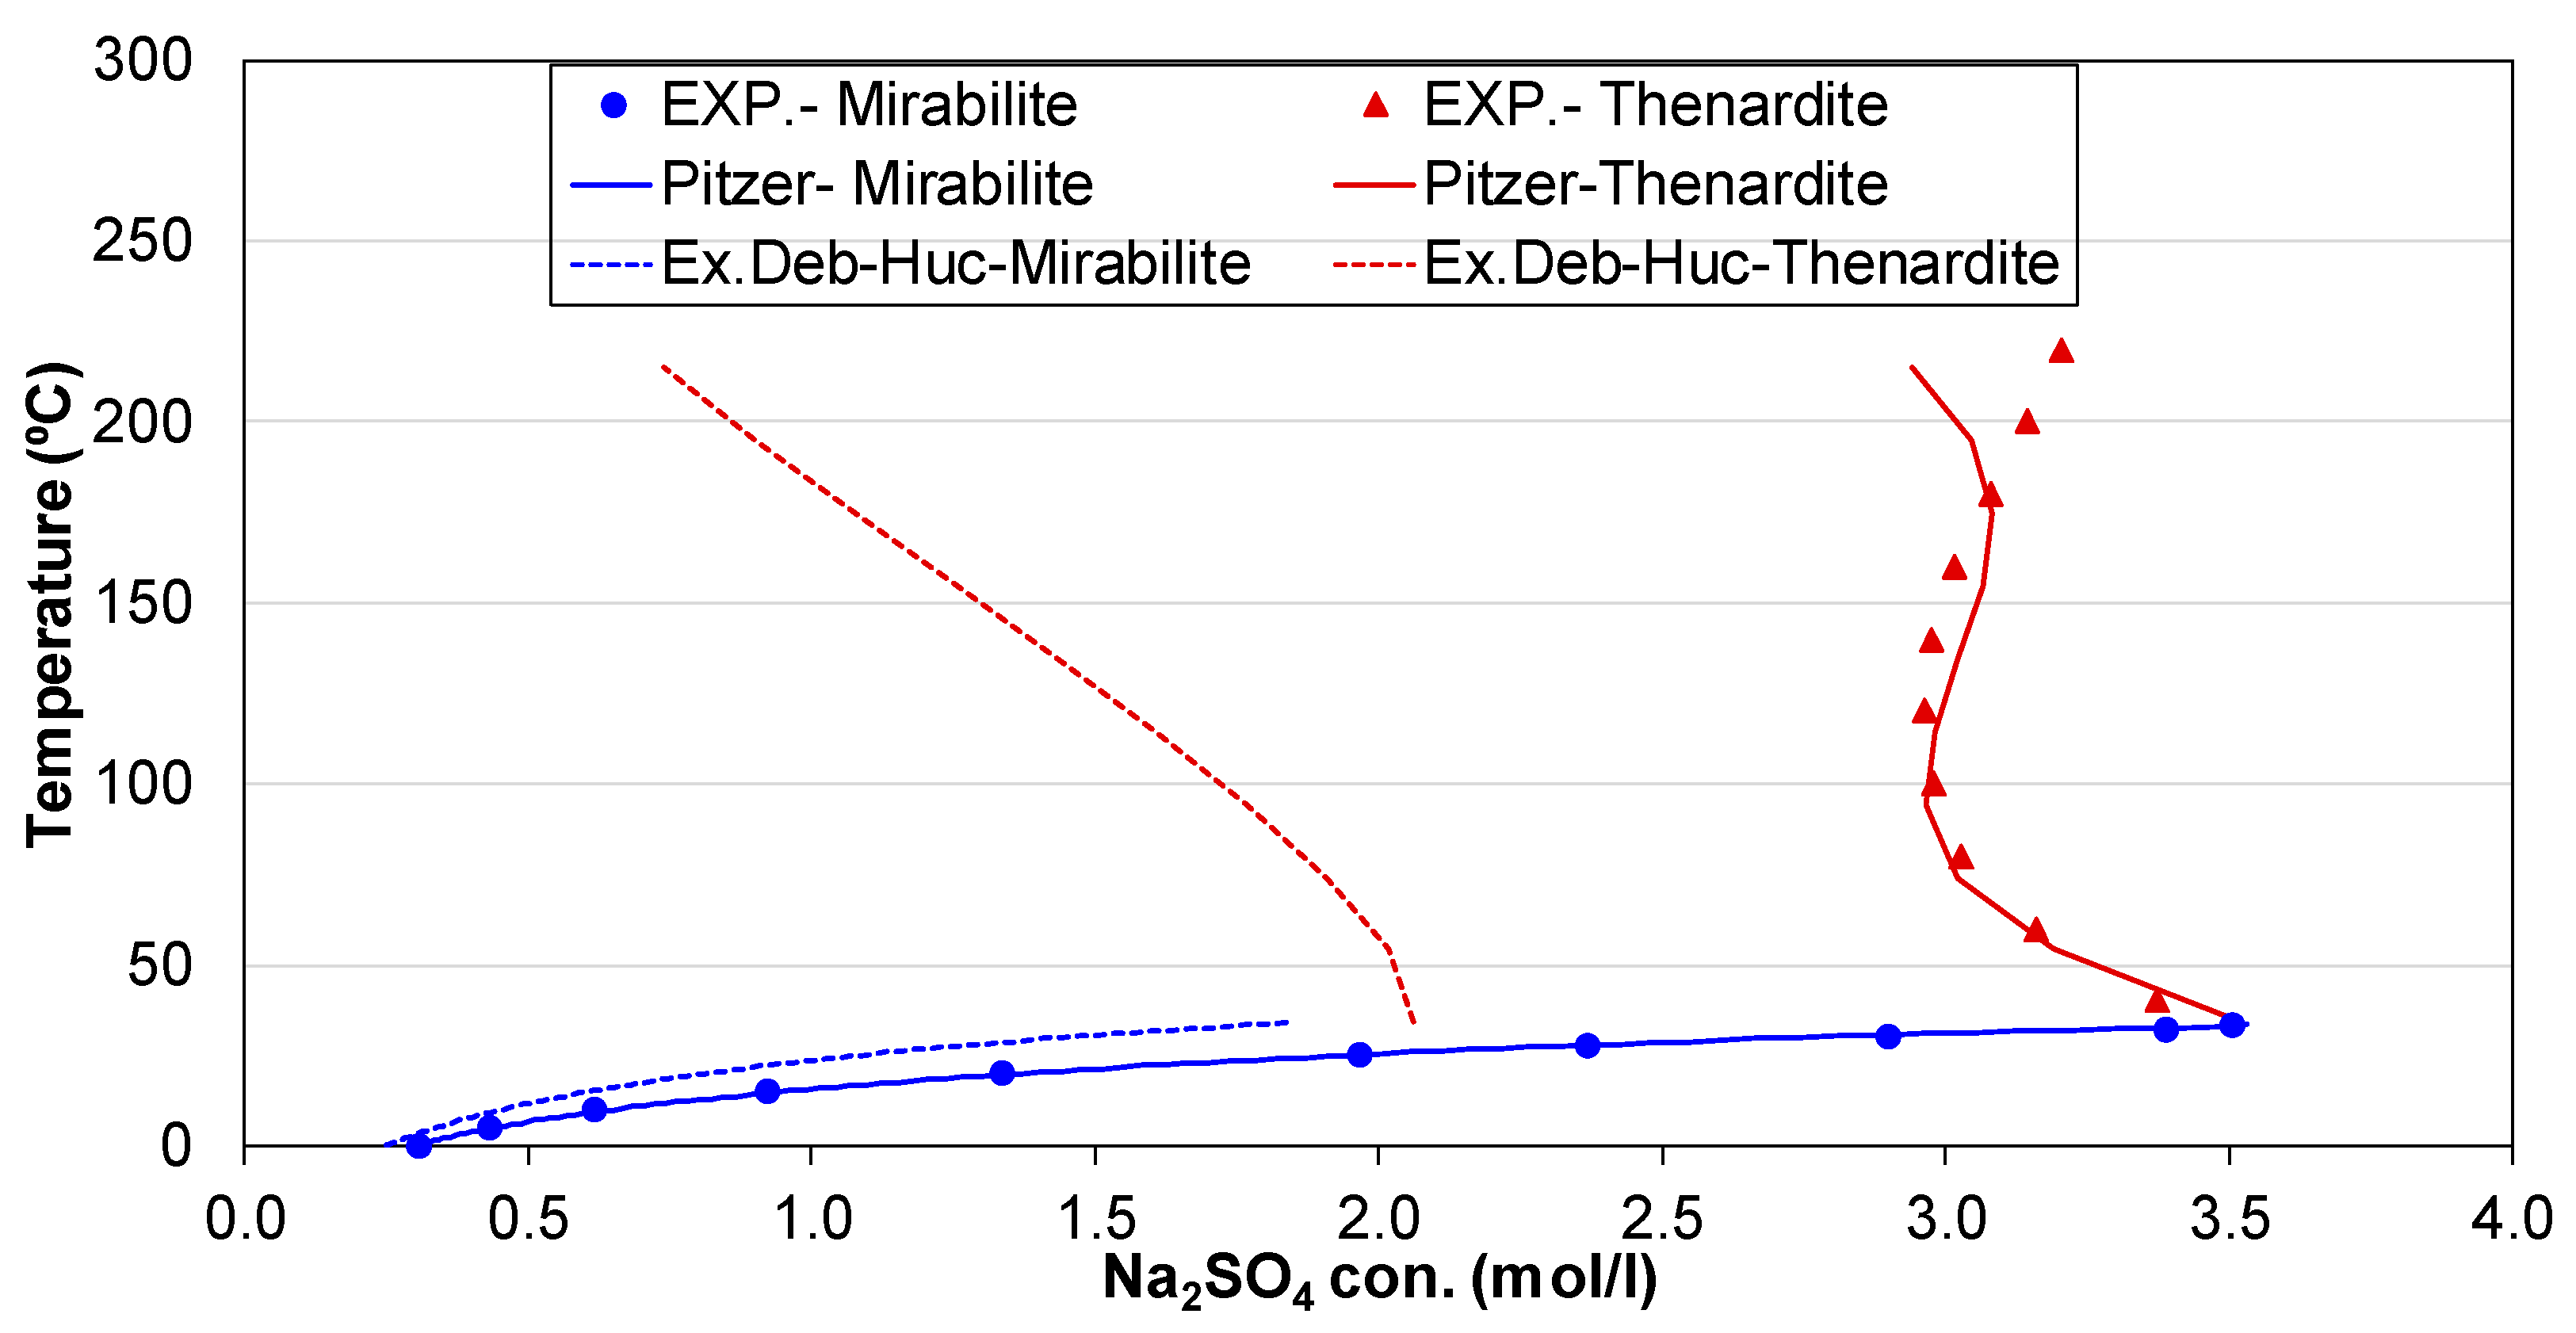
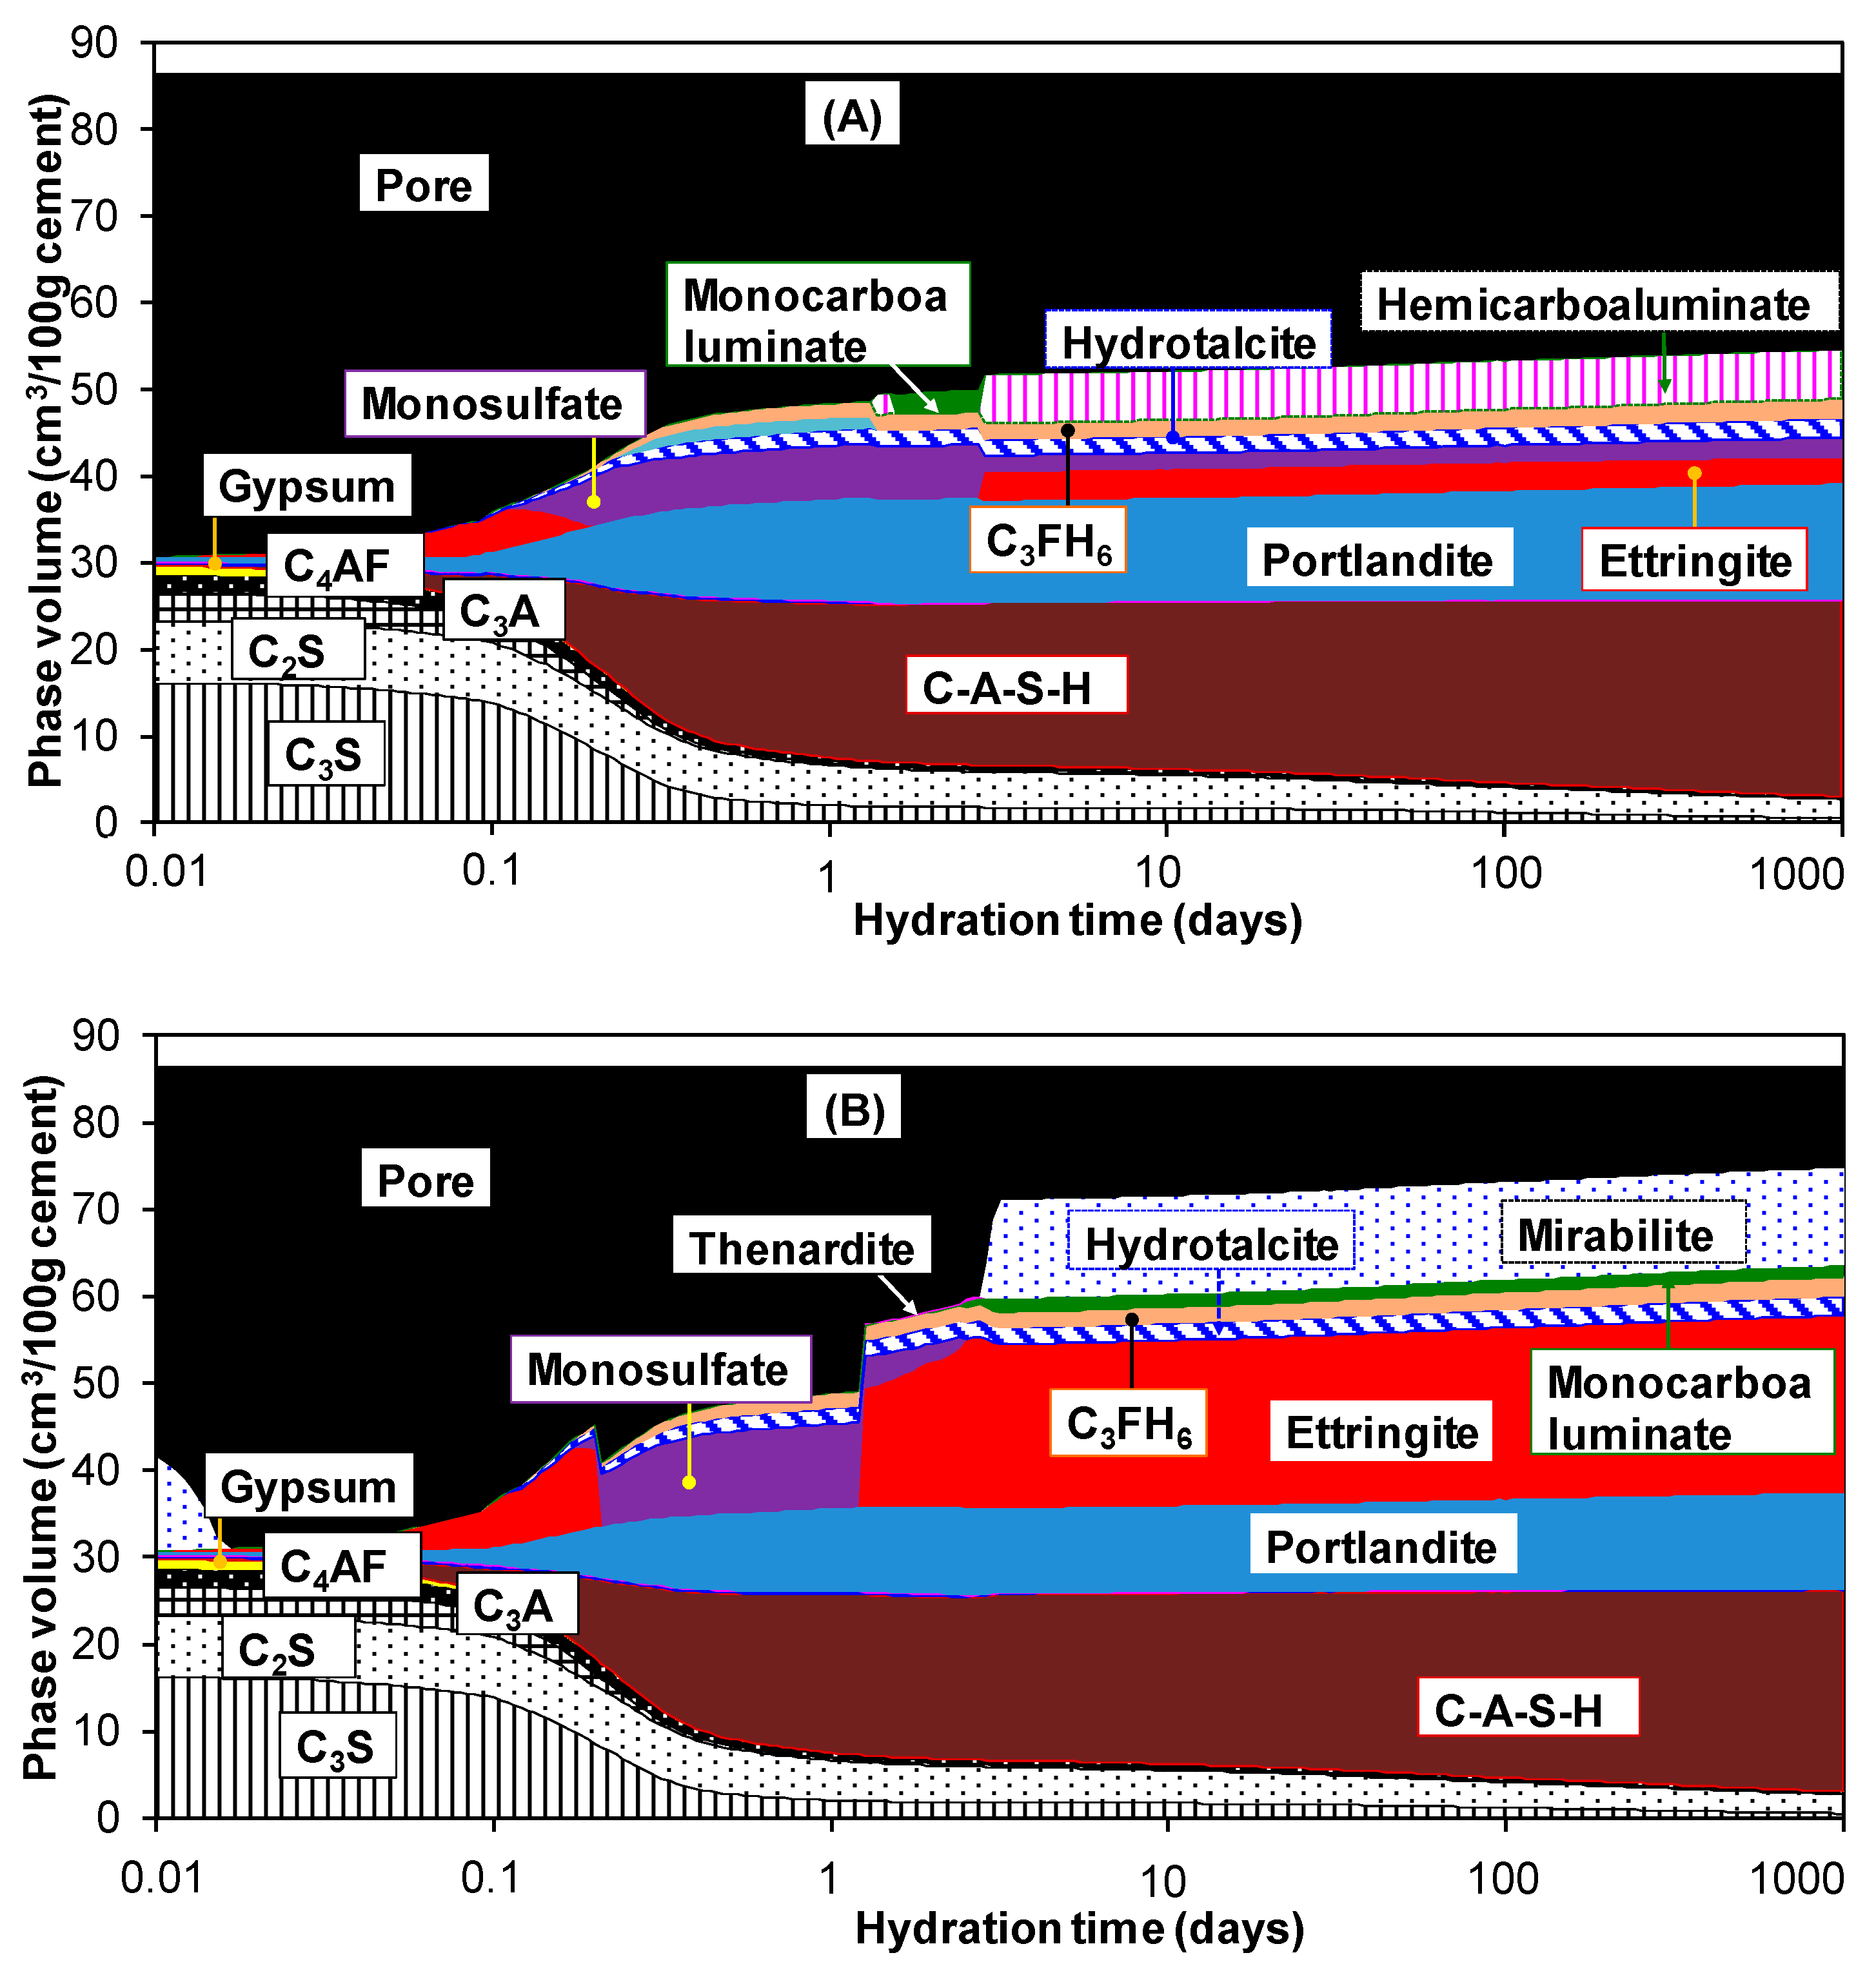
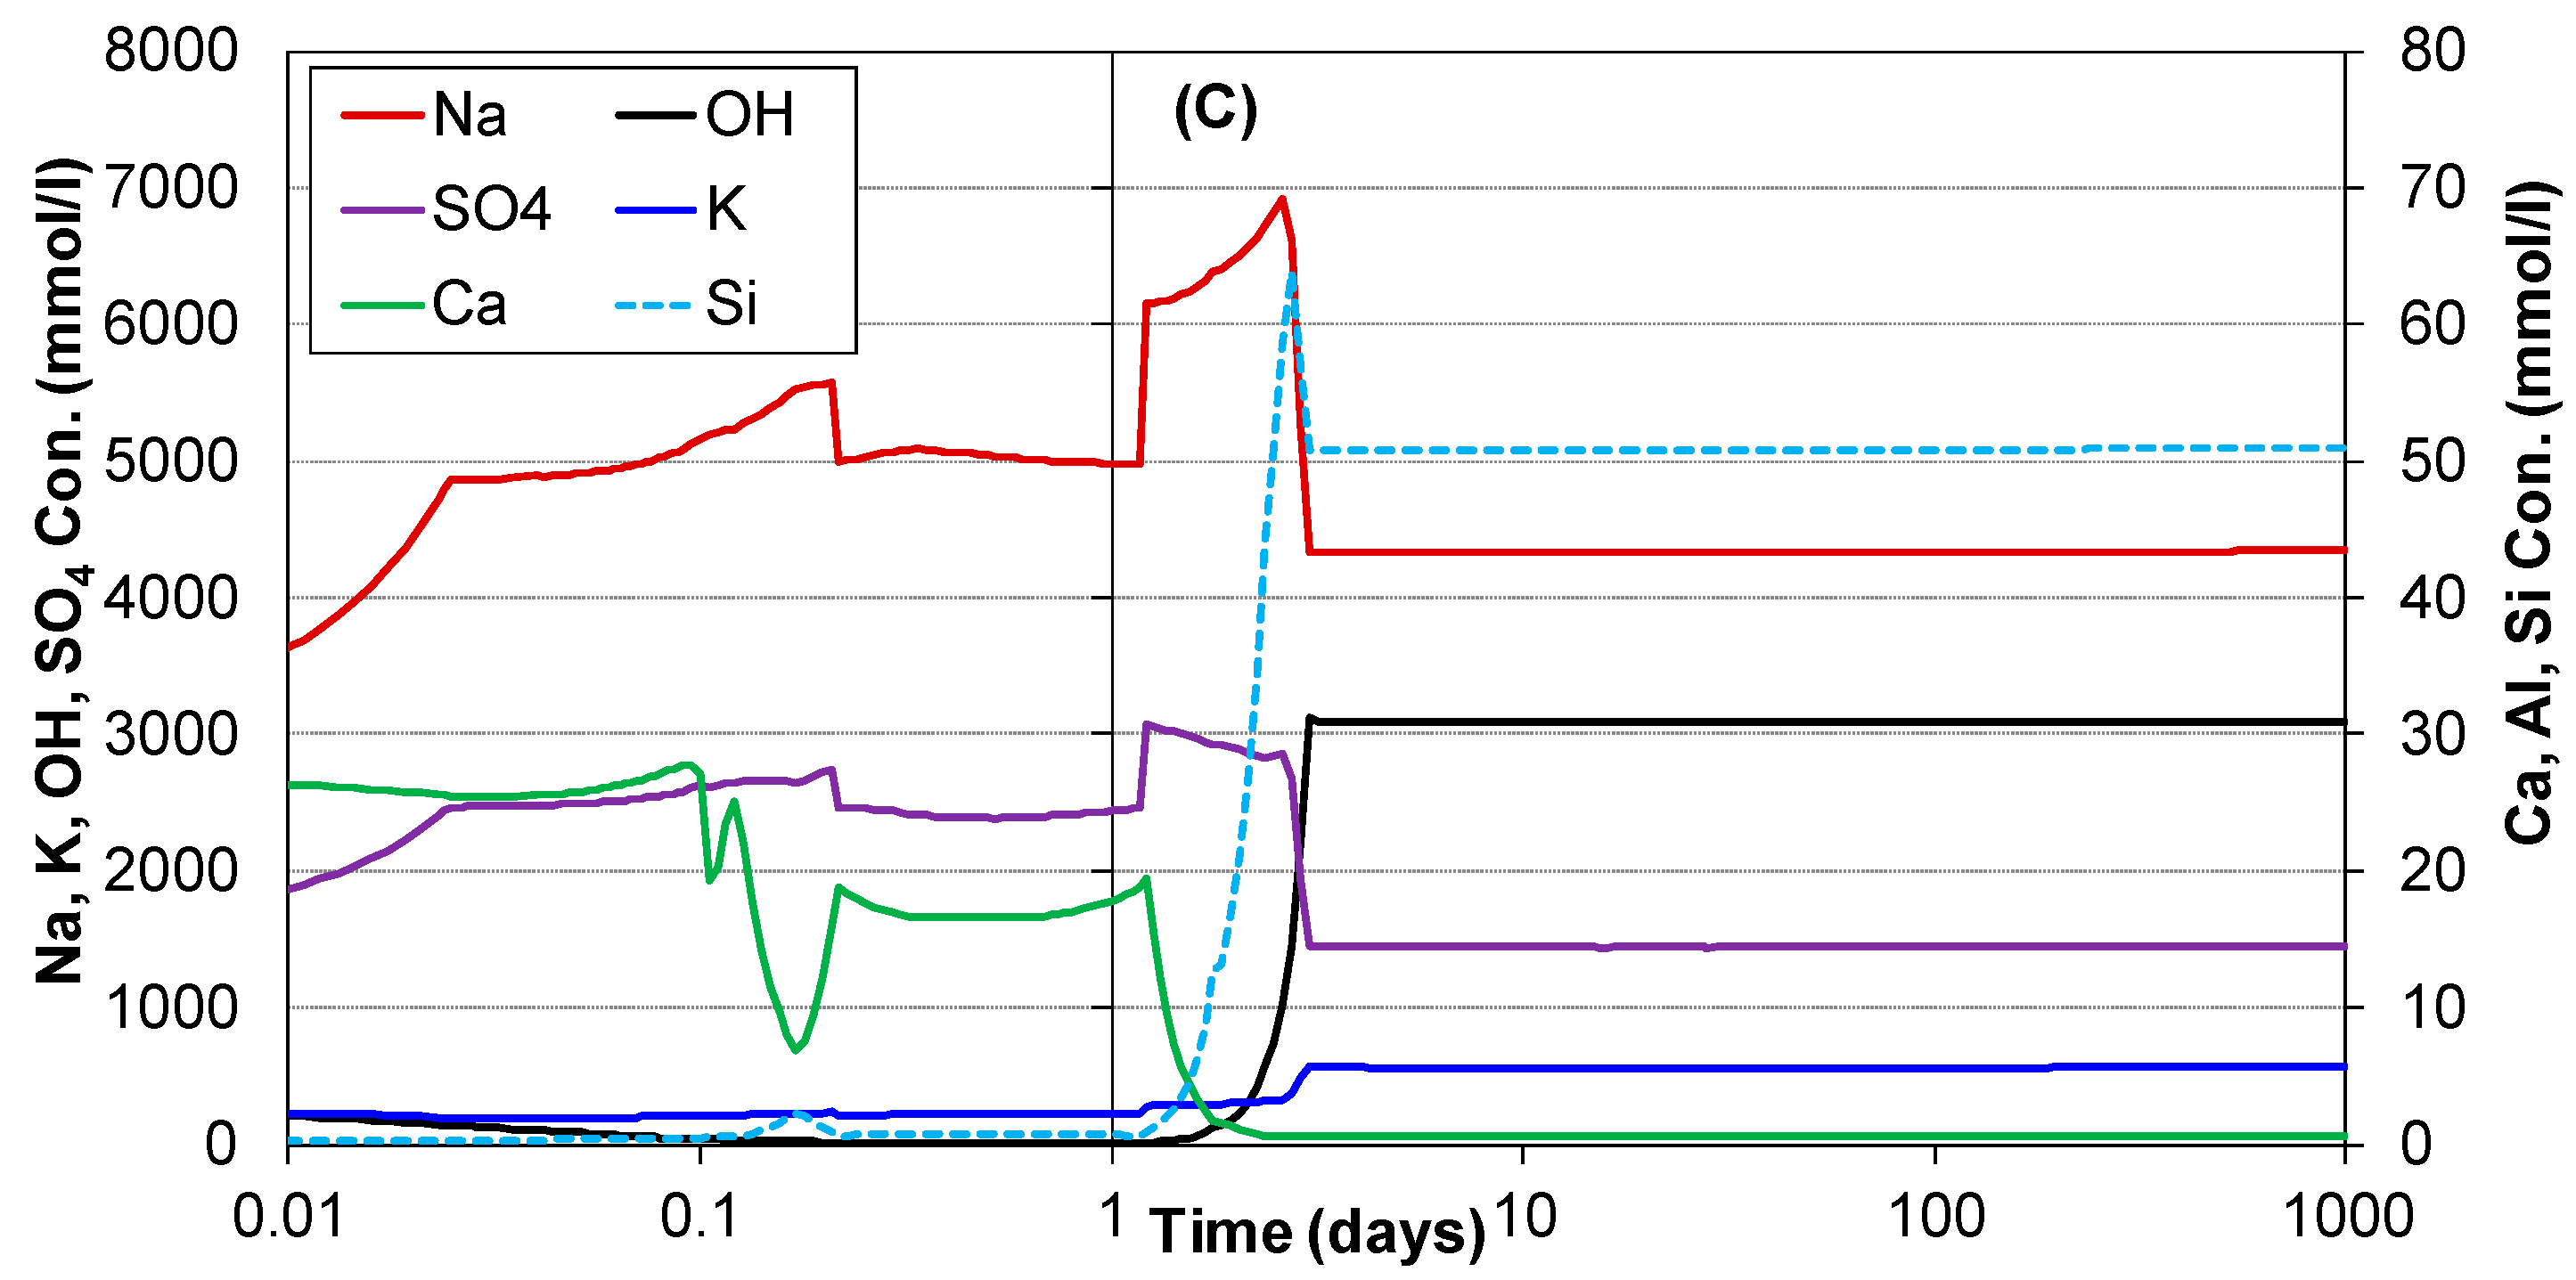
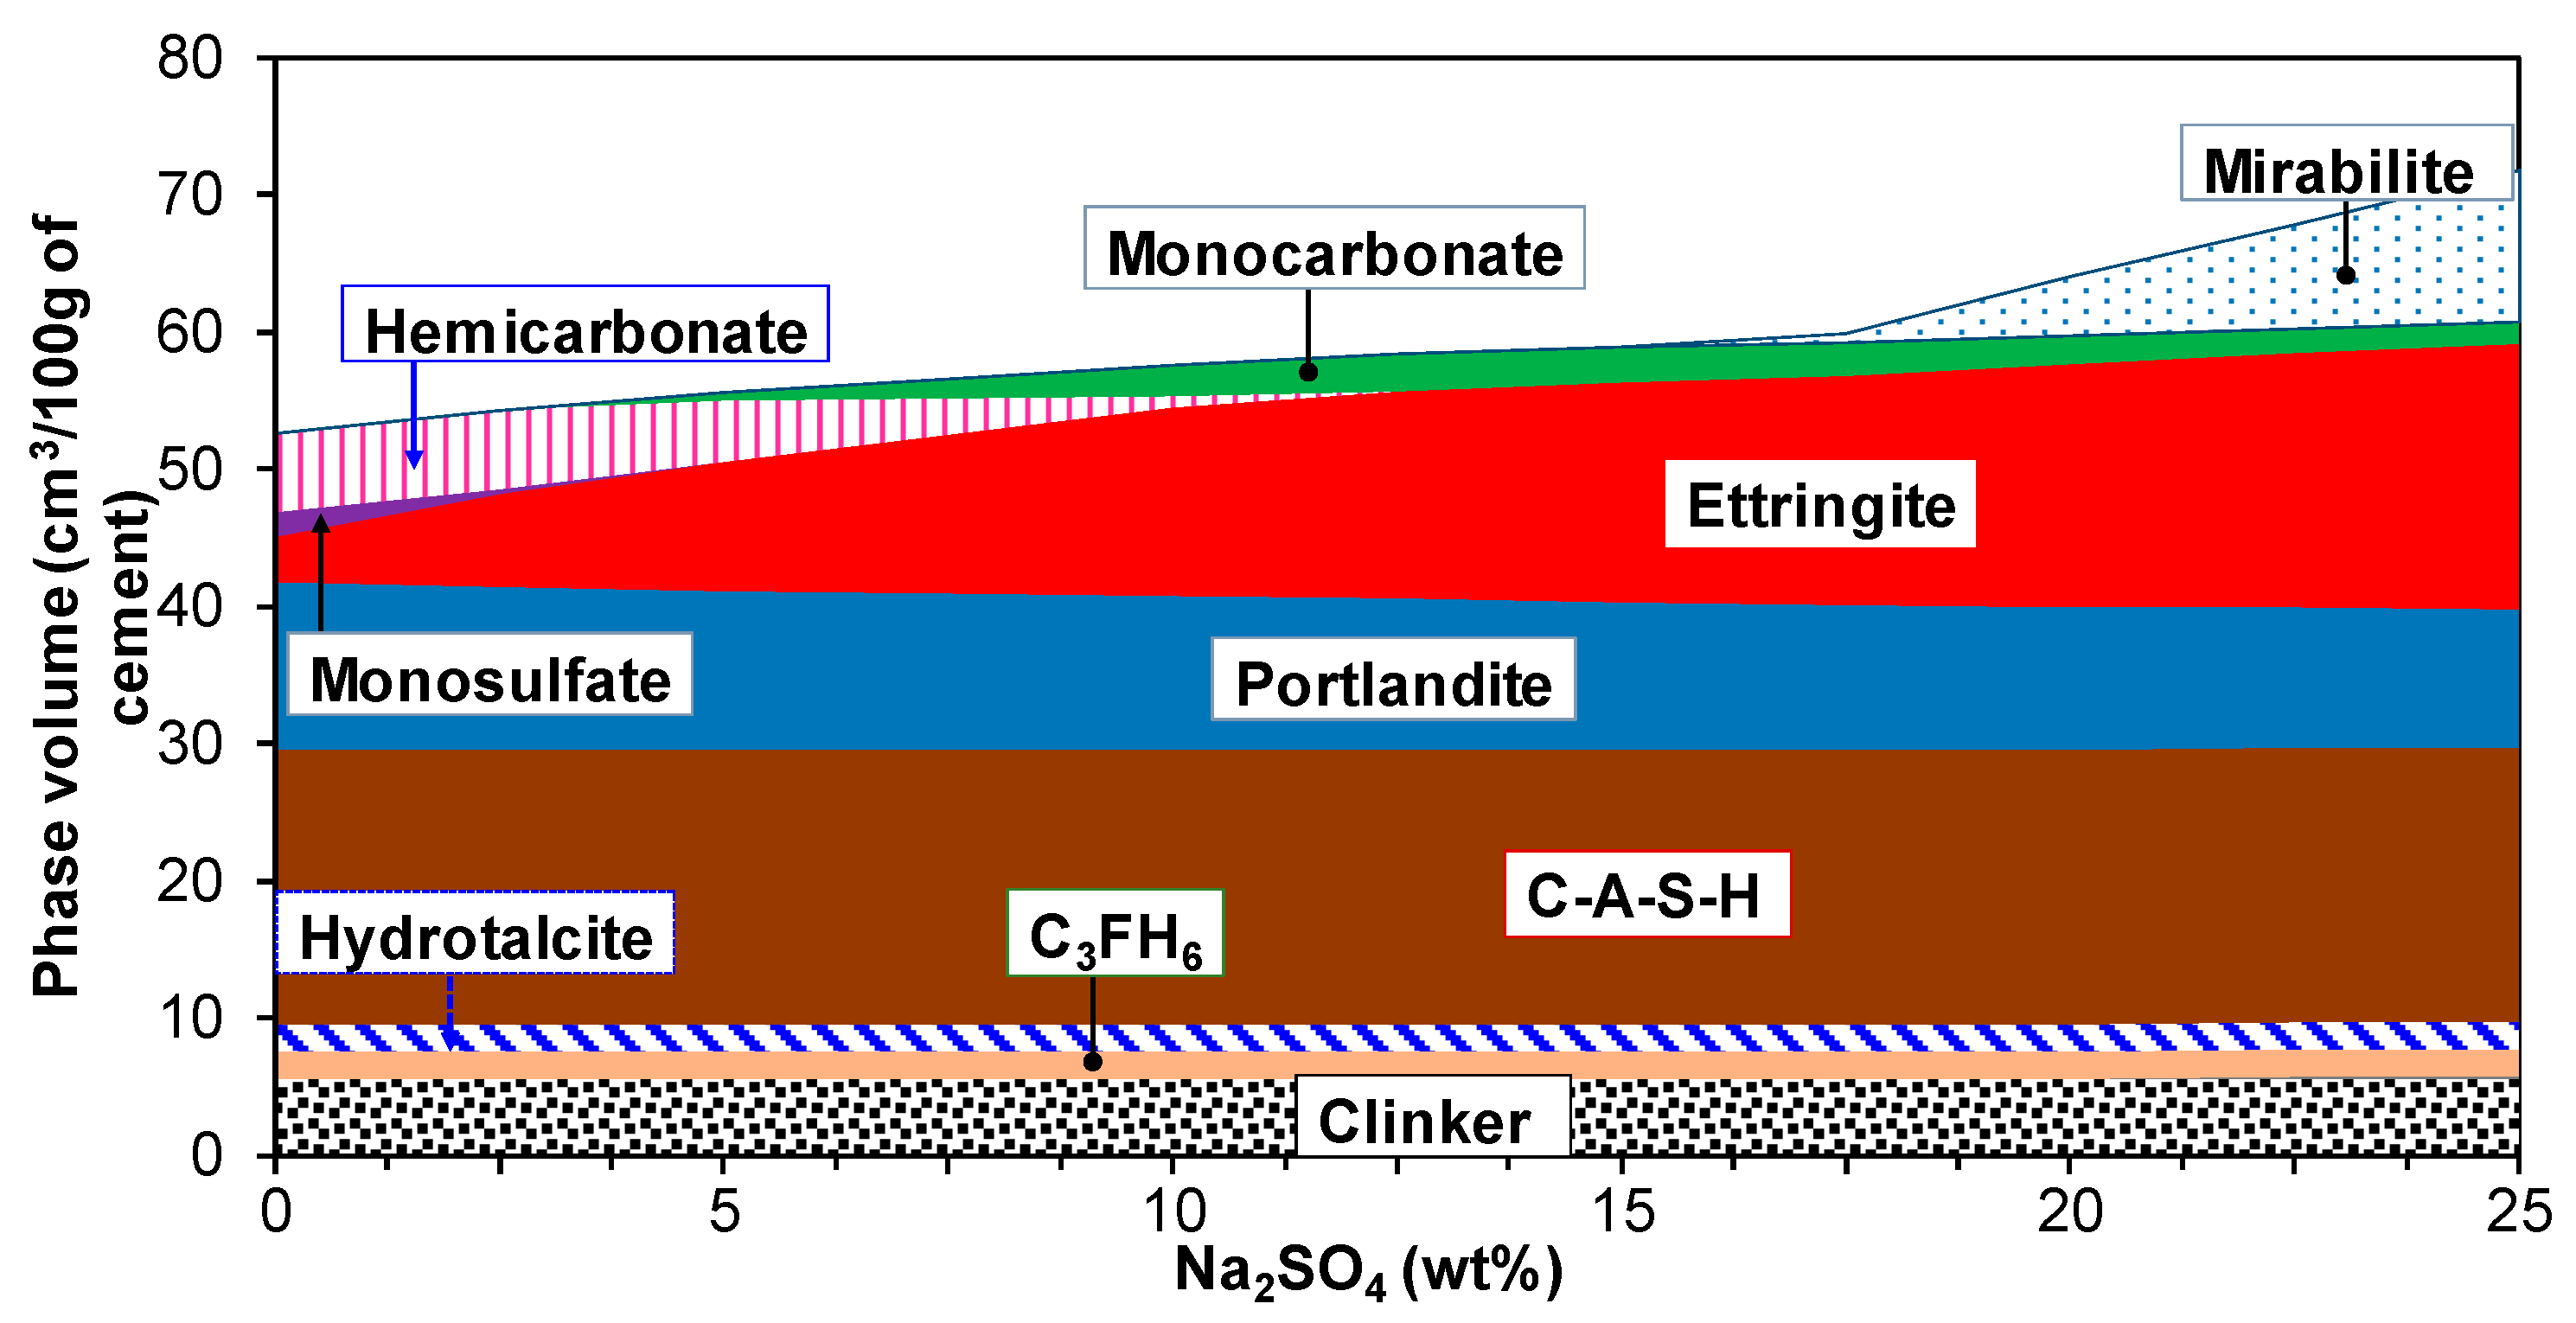
3.2. Hydration of Portland Cement with Sodium Sulphate

It has been reported that the U-phase could be formed in the hydration of PC with a high amount of Na2SO4 [33,34], and the thermodynamic equilibrium constant for the phase was reported in Reference [35]. Studies on the U-phase are very limited, and only a very few studies have reported on the U-phase in cementitious materials [33,34,35]. Further, the reported thermodynamic data are questionable, because the U-phase can easily be formed for the reported equilibrium constant in hydrating PC in the absence of Na2SO4 from the hydration model (Appendix A.2). However, the formation of U-phase has not been reported in the hydration of PC without Na2SO4. The authors’ recent experimental study showed that the U-phase was formed early in hydration of PC and slag-blended cementitious materials, and the phase was changed to ettringite with hydration time [36]. Furthermore, the temperature significantly influenced the formation of U-phase. More detailed experimental work and thermodynamic modelling is necessary to understand the conditions in which the U-phase forms, and its thermodynamic properties. Therefore, the U-phase is not considered in this study, and its formation and thermodynamic properties will be described in future work.
In order to simulate the core of the waste drum that contains the mixture of Na2SO4 and cementitious materials, the temperature profiles shown in Figure 4 were adopted as the curing temperature [8], which was needed to increase the solubility of Na2SO4 as well. Phase assemblage and pore solution profiles of PC hydration with 25% of Na2SO4 by weight for the dramatic change of temperature (Figure 4) are shown in Figure 5, along with the phase assemblage for PC without Na2SO4. In comparison to Figure 3, the temperature increase accelerated the hydration of clinker minerals and destabilised the ettringite, leading to more monosulfoaluminate formation (Figure 5A). The addition of sodium sulphate modified the mineralogy of hydrated cement (Figure 5B). The formation of mirabilite and ettringite at room temperature, in addition to other hydrates, filled the available pore space, but a very small or negligible amount of thenardite was observed at high temperature in the presence of Na2SO4. Further, the formed mirabilite and ettringite were destabilised at high temperature, giving large amounts of pore space. However, mirabilite was formed again once the system cooled down to room temperature, as was ettringite, which was produced as the dissolution of monosulfoaluminate and hemicarboaluminate. Mirabilite and ettringite were the main sulphate-bearing phases as PC hydrated with Na2SO4, and they filled the pore significantly and may induce cracking in the system, which supports the experimental data [34,37]. The ionic concentration in the pore solution showed a high concentration of Na+ and SO42− later in the process, which was in equilibrium with Na2SO4 crystals and cement hydrates (Figure 5C). Further, high silicate concentration in the pore solution was obtained for the PC hydrates with Na2SO4. This was due to differences in the composition of CASH solid solution (Figure 6). The addition of Na2SO4 decreased the fraction of CASH_5CA and increased that of CSH Jen, which released high concentrations of silica into the pore solution to form a low Ca/Si ratio of CASH.

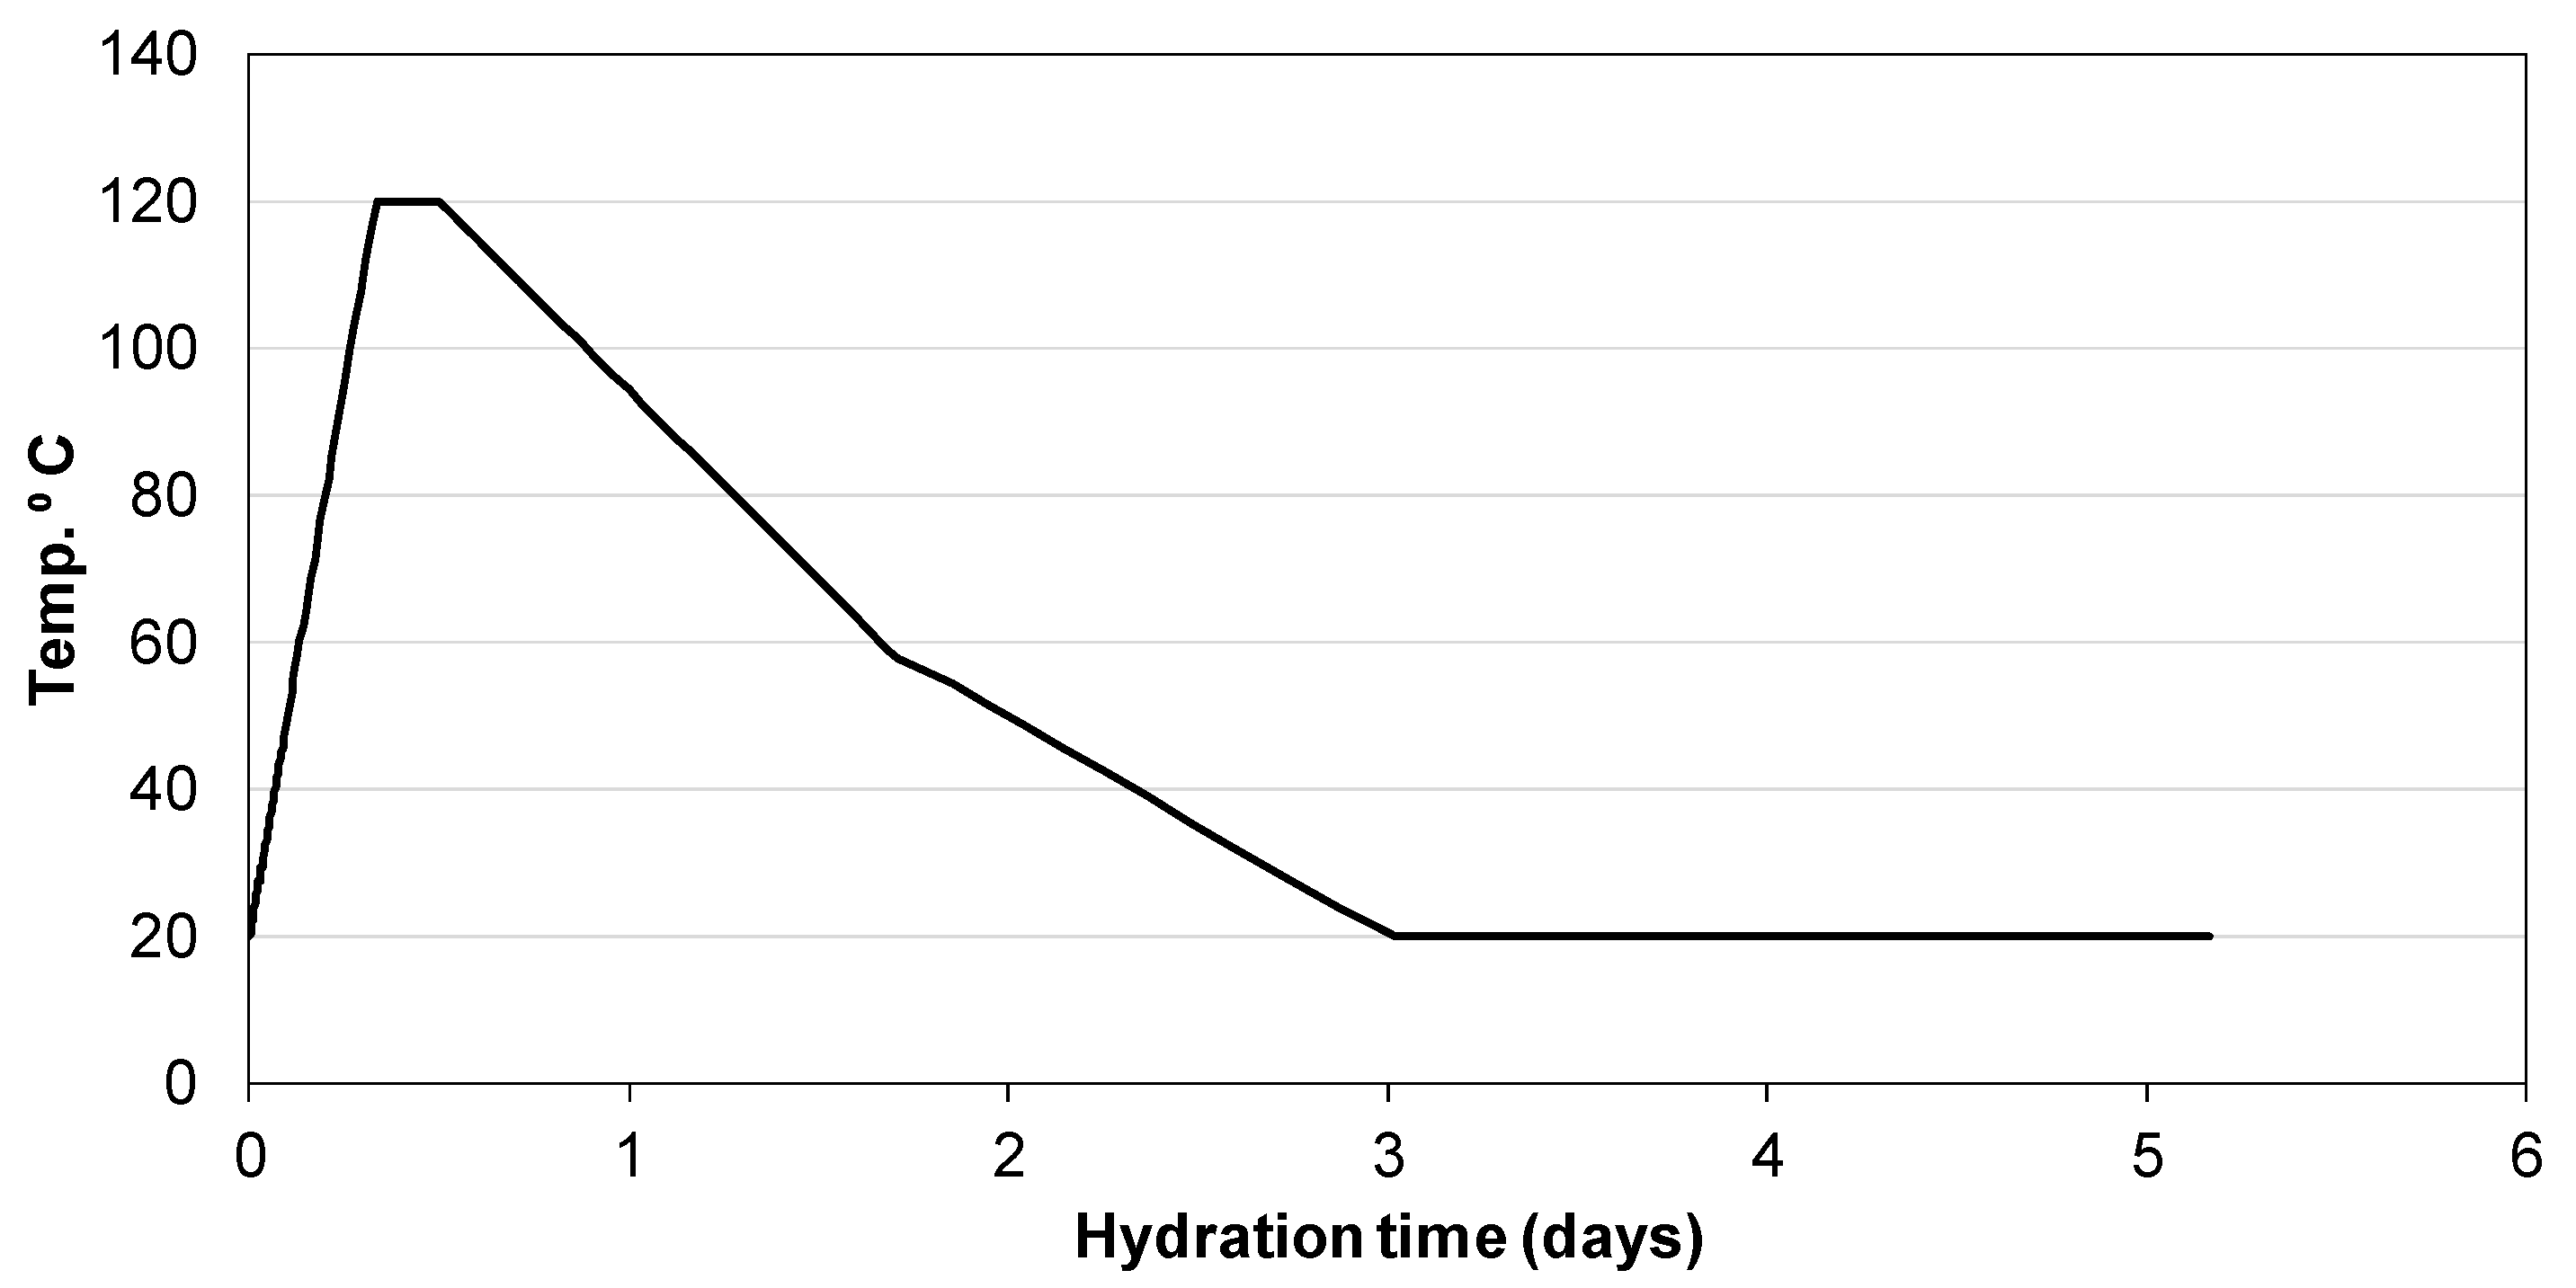
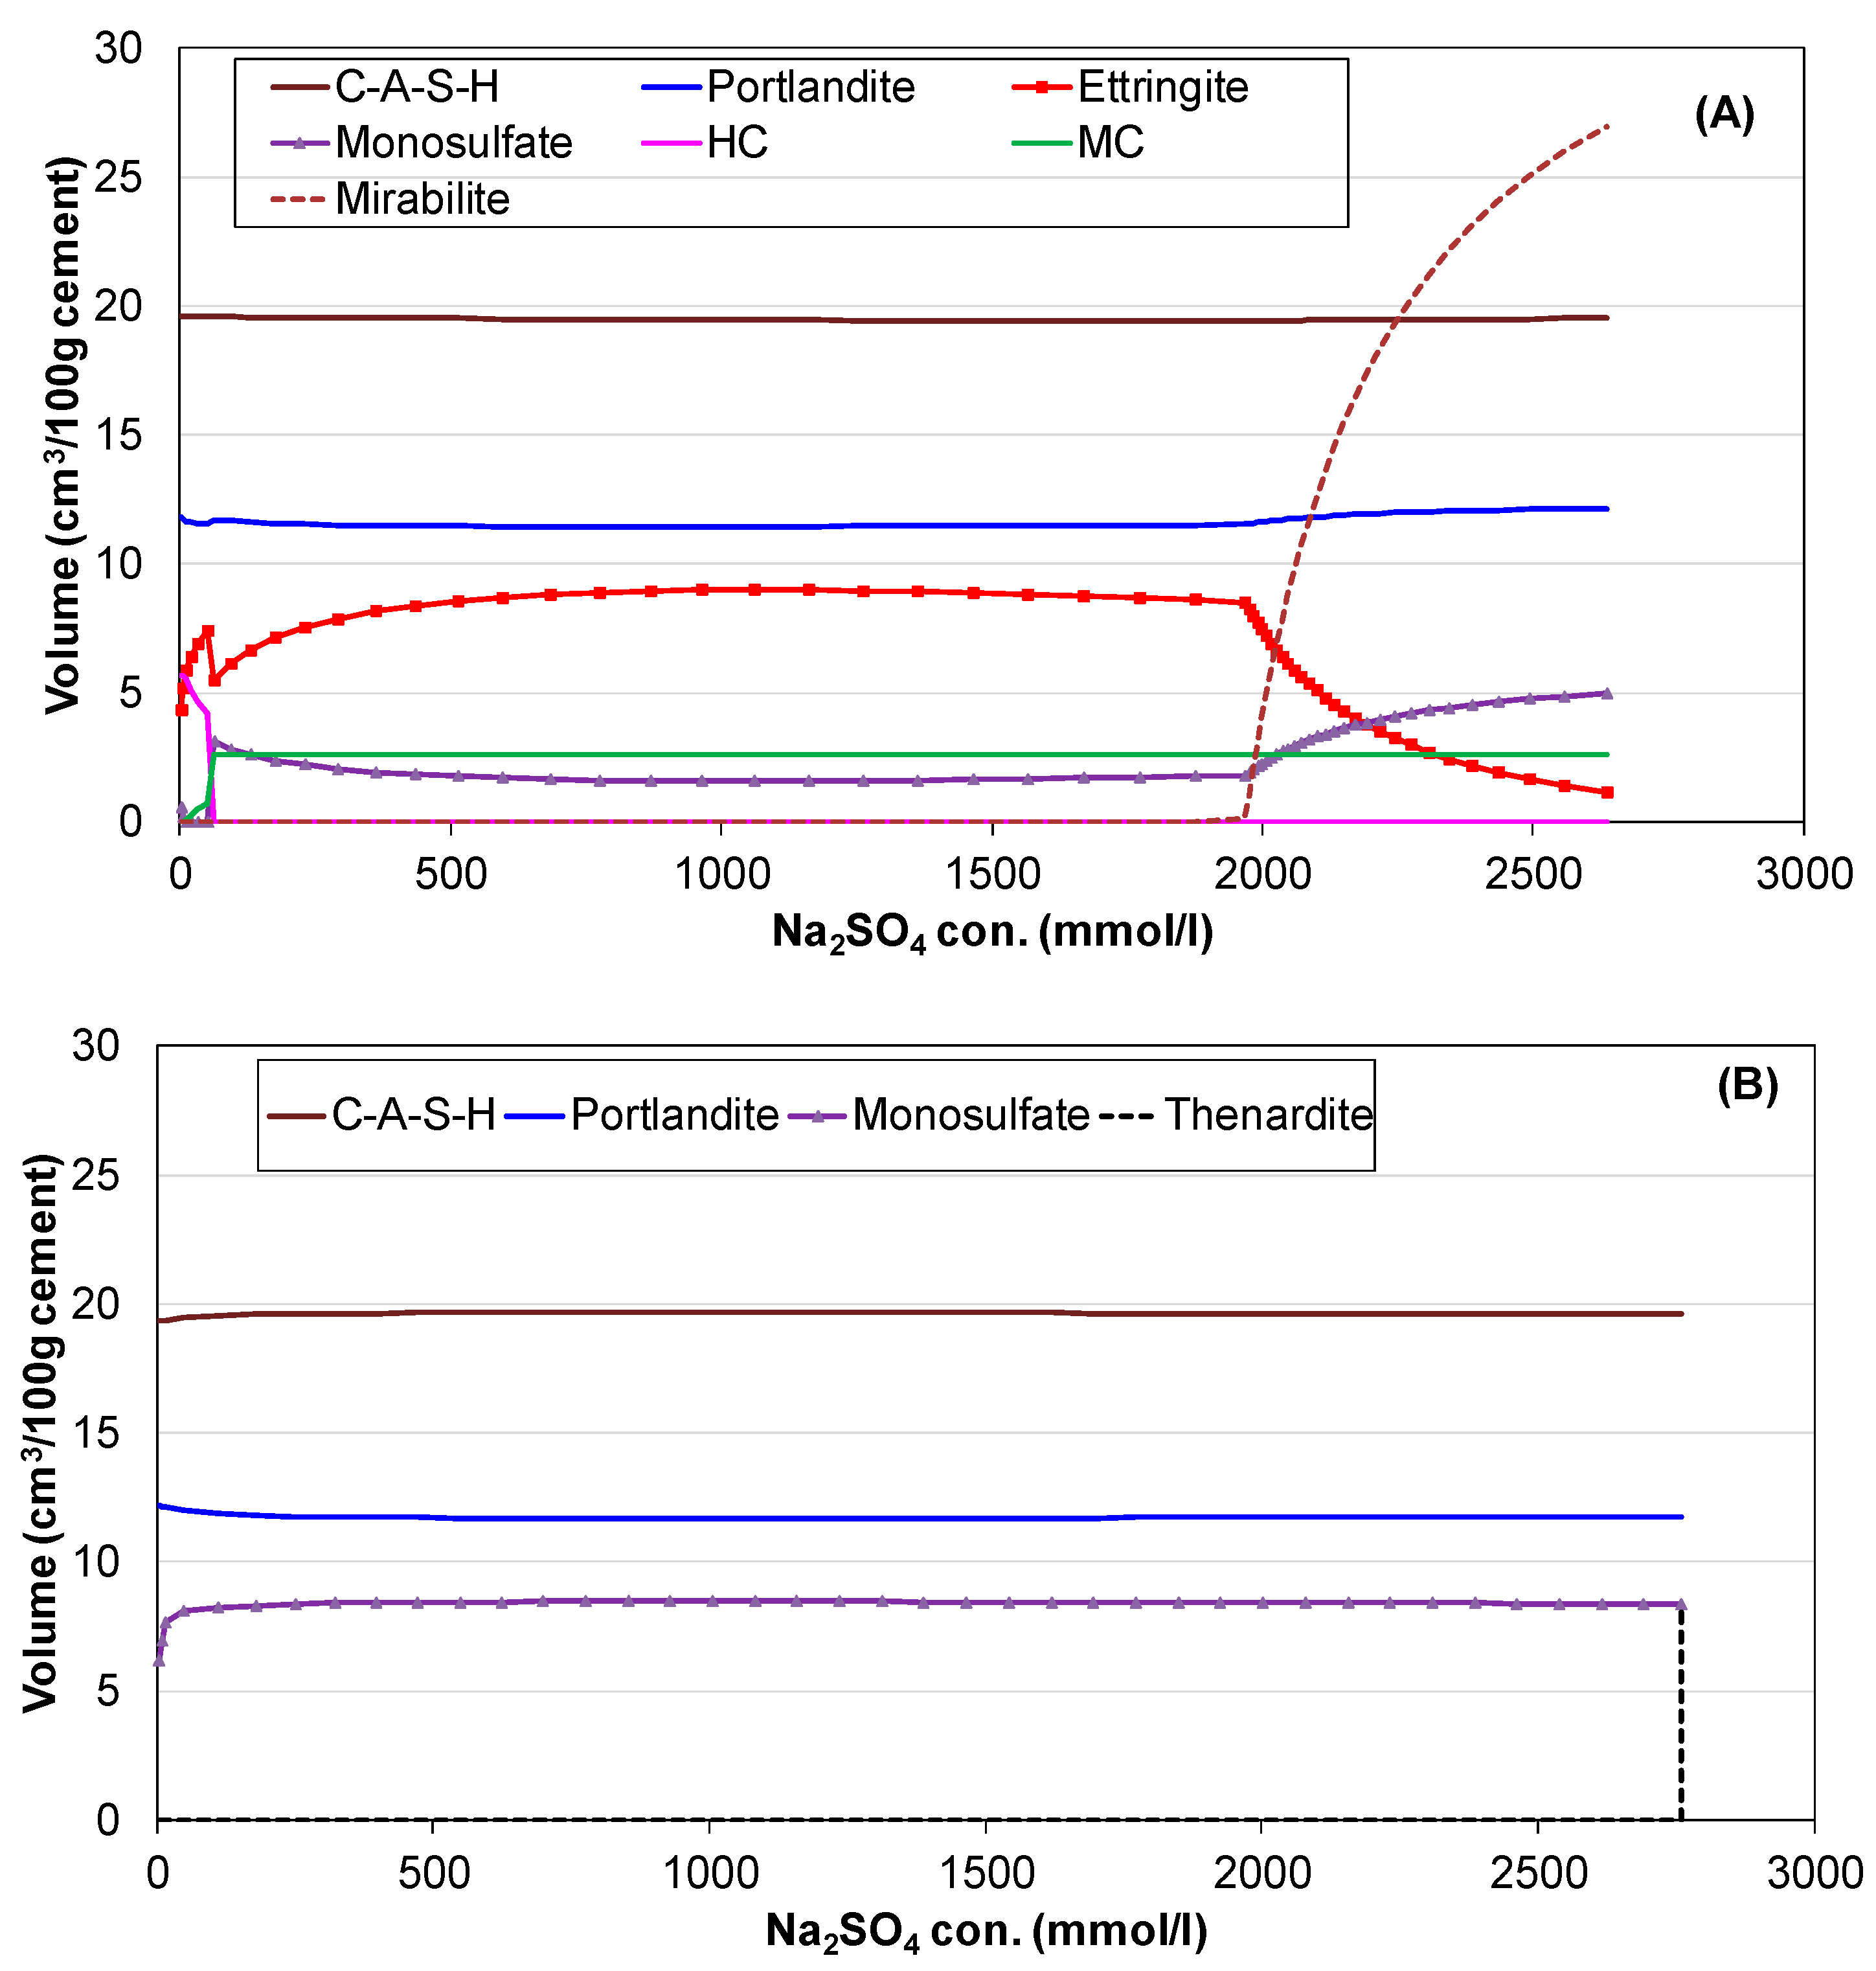
3.3. Influence of Na2SO4 Concentration and Temperature

Figure 7 shows the amount of Na2SO4 addition on the hydration of PC. The simulation conditions, input parameters, and temperature profiles (Figure 4), except Na2SO4 addition, are the same as used in Section 3.2. A higher addition of Na2SO4 resulted in a higher formation of sulphate-bearing products, which may induce cracking due to high volume of hydrates. Mirabilite could only be formed after 17% of Na2SO4 addition and there was no formation of thenardite, because the hydration temperature at 28 days of curing was 20 °C (Figure 4). As shown in Figure 2, the mirabilite was in equilibrium at around 1.3 mol/L of Na2SO4 at 20 °C; the concentration of sulphate ions in the pore solution with the addition of Na2SO4 up to 17% was less than 1.3 mol/L, hence the mirabilite could not form. Sodium sulphate addition did not influence the stability of main hydration products such as CASH and portlandite, and other hydration products of hydrotalcite and C3FH6, but hemicarboaluminate was formed at lower additions of Na2SO4 and was changed to monocarboaluminate with increasing Na2SO4. The formation of monosulfoaluminate was restricted to in very low (<2.5% of Na2SO4) concentrations or in the complete absence of Na2SO4, and it changed to ettringite with availability of sulphate. Thus, the simulation results provide useful insights into the degradation of cementitious materials relating to mineralogical distribution with Na2SO4 addition.
In order to examine the influence of Na2SO4 concentration on the hydrated PC, a thermodynamic calculation between hydration products and sodium sulphate solution was carried out. Solid products and pore solution concentration at 28 days of hydrated PC (as shown in Figure 3C,D) were used as initial input parameters. Figure 8 shows changes of equilibrated hydrates as a function of Na2SO4 concentration, which had a significant influence at equilibrium concentrations higher than almost 2 mol/L at 25 °C (Figure 8A). Mirabilite and monosulfoaluminate were produced and ettringite was destabilised at high concentrations of Na2SO4 equilibrated with hydrates at 25 °C. From the solubility of mirabilite (Figure 2), mirabilite could form at around 2 mol/L of Na2SO4 at 25 °C and destabilised the ettringite. The remaining sulphate and aluminium ions from the destabilisation of ettringite were in equilibrium with monosulfoaluminate to produce monosulfoaluminate. However, thenardite could only be formed at high concentration of Na2SO4 and elevated temperature, which changed ettringite to monosulfoaluminate independent of sodium sulphate concentration. The environment in the pore solution of cementitious materials induced formation of mirabilite or thenardite depending on sodium sulphate concentration and temperature, which affected stability of the other sulphate-bearing phases, mainly ettringite and monosulfoaluminate. The stability of CASH and portlandite did not depend on Na2SO4 concentration or temperature, as shown in Figure 8.

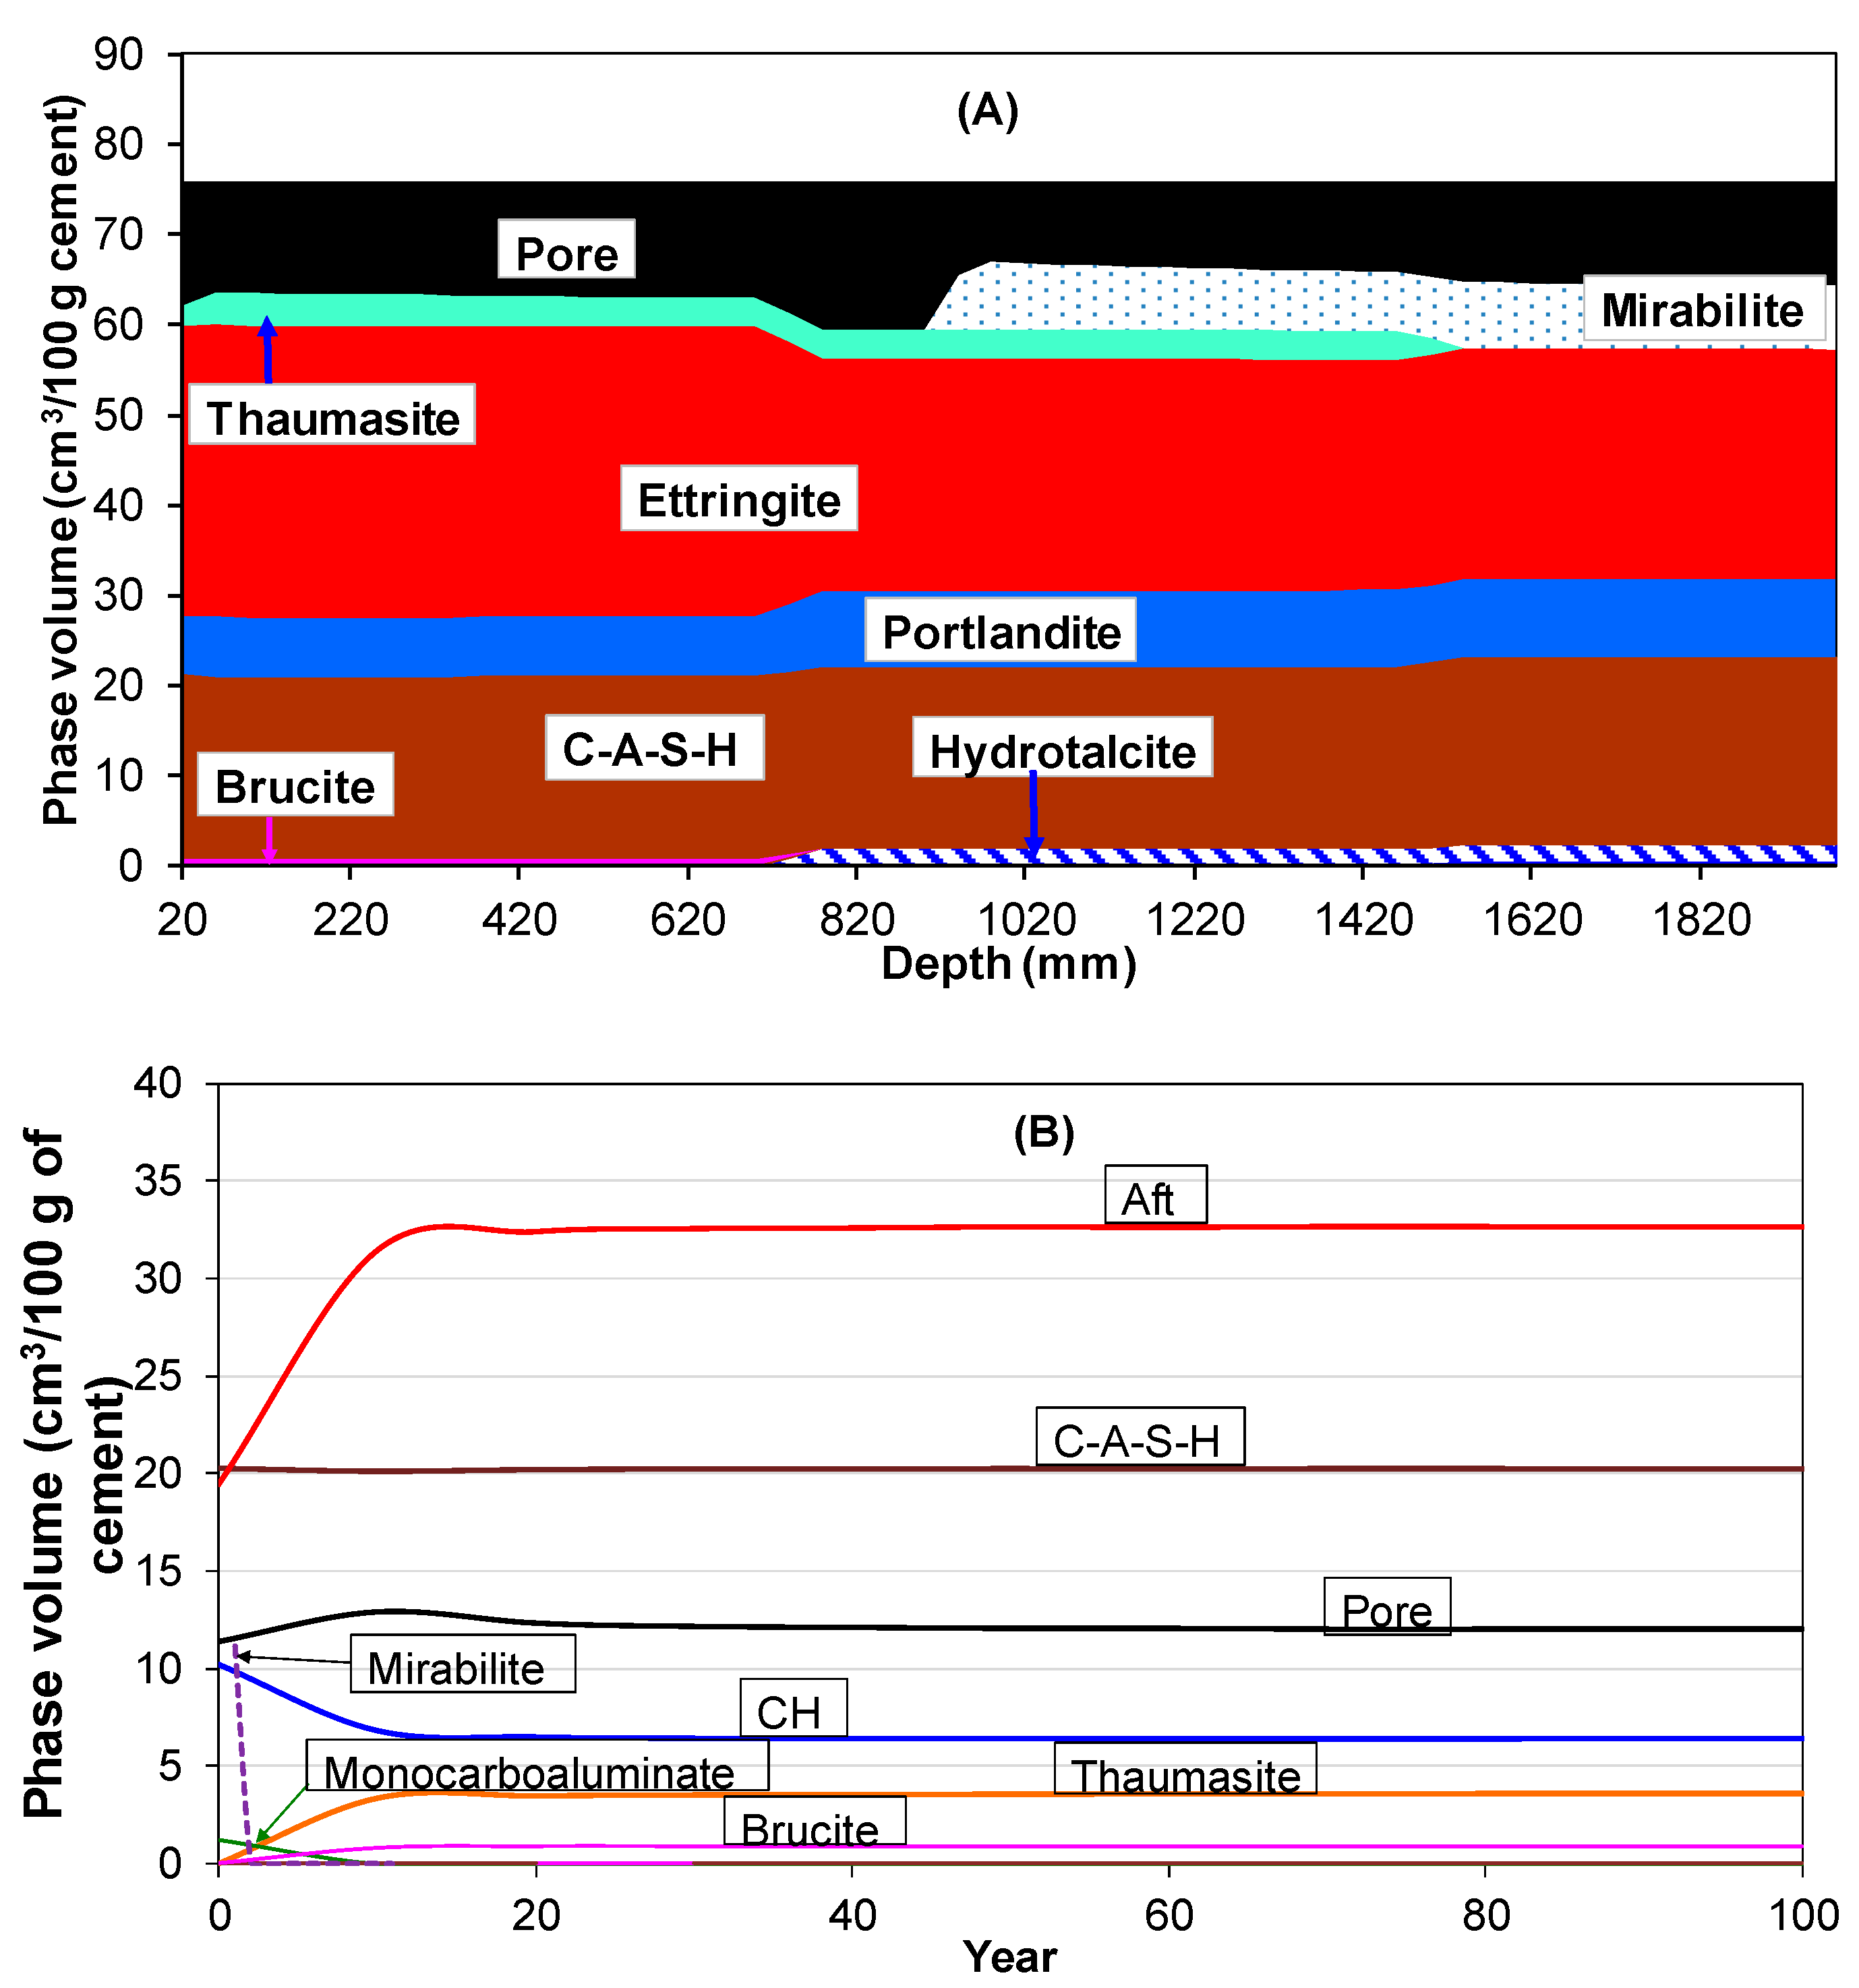
3.4. Sulphate Ingress into Hydrated Portland Cement

One-dimensional reactive transport calculations with multispecies effect were performed to assess the performance of hydrated PC (described in Section 3.2) exposed to sodium sulphate solution. The PC was hydrated with 25% of sodium sulphate at varying temperatures (Figure 4) before it was exposed to external solution. Pore solution concentration, phase assemblage, and porosity from the hydration model at 28 days of hydration, as given in Figure 5B,C, were used as initial input values for the reactive transport model. The multispecies diffusion was performed by solving Equation (A16), considering main species such as Na+, SO42−, K+, Ca2+, Al3+, H4SiO4, and OH. Self-diffusion coefficients of ions in free water for a specified temperature were used as diffusion coefficients and tortuosity value was equal to 1. The concentration of ionic species at the exposure surface (x = 0) was set to 10% of Na2SO4 (1564.5 mmol/L and 782.25 mmol/L for Na+ and SO42− respectively), while other ions were set to zero and the final boundary condition was set to zero flux. It should be noted that the concentration of Na+ and SO42− were higher in pore solution (Figure 5C) than that in exposure solution.
Figure 9 shows mineralogical distribution resulting from chemical reaction of PC hydration products with ingress of sulphate ions for 1000 years, together with changes of hydration products at 100 mm from the exposure surface as a function of hydration time. The dissolution of mirabilite, portlandite, and monocarboaluminate, due to high concentration of sulphate ions in the pore solution, caused the formation of secondary ettringite and thaumasite as the chemical reaction of hydration products with sodium sulphate ingress. In the conventional sulphate attack in cementitious materials, the ingress of sulphate ions, the concentration of which is almost negligible in the pore solution of cementitious materials, reacts with dissolved portlandite to form gypsum and then ettringite, due to reaction with monosulfoaluminate [11]. However, in this study, sulphate ions were diffused from pore solution to external solution, because PC was hydrated with 25% of sodium sulphate before exposure. Therefore, the dissolution of hydrates, which were in equilibrium with high concentration of sulphate ions in the pore solution (Figure 5C) before the exposure, was the main mechanism. The precipitation of secondary products and dissolution of hydrates changed the porosity of the matrix, and the porosity was fed back to change the diffusion coefficients of ions (Equation (A16)). The dissolution increased the porosity of the matrix; this, in turn, enhanced further leaching of ions. Although the simulation results are not verified with experimental data in this study, they are consistent with published modelling results and experimental data [11,20,37]. As shown in Figure 9B, a significant alteration was observed close to the exposure surface at the beginning, which increased the porosity for around 10 years of exposure, but CASH was stable throughout the exposure period.
The modelling approach and simulation results presented in this paper provide a promising method to evaluate the durability performance of encapsulated low-or intermediate level waste in cementitious materials on very long time scales. The solid solution, thermodynamic equilibrium, reaction kinetics, and reactive transport processes have been considered to understand the chemical mechanisms involved during solidification, and the solidified materials exposed to external sulphate attack. Therefore, the proposed approach can be used not only for assessing the durability of materials, but also for materials design for sodium sulphate containing nuclear waste. However, for better prediction of durability performance, additional chemical mechanisms and influencing factors need to be included in the model. Due lack of thermodynamic data, the U-phase was not considered in this study, but it may affect the durability of cementitious materials in high concentration of sodium sulphate through its formation and/or transformation to ettringite. Thermodynamic properties of the U-phase need to be determined experimentally and included in the model. The study focused on chemical interactions of sulphate with cement hydrates, and neglected the mechanical damage to the materials as result of formation of sulphate-bearing phases. The mechanical deterioration model should be integrated with the hydration and reactive transport models for better understanding of the sulphate phases on durability and mechanical performance. Lastly, a complete sensitive analysis is needed to evaluate the long-term performance of the materials in various environments.

4. Conclusions

Both extended Debye-Huckel or Truesdell and Jones equation and Pitzer equation for activity coefficients showed a similar hydrate assemblage and pore solution chemistry for hydrating PC in water. However, the Pitzer model predicted solubility experimental data better at high ionic strength than the extended Debye-Huckel model. Thermodynamic calculations were carried out using Pitzer interactions coefficients to predict the hydration products and pore solution composition of hydrating PC in high concentration of Na2SO4. The deterioration mechanism of co-hydrating cementitious materials with 25% of Na2SO4 by weight was the formation of mirabilite crystals and ettringite. Their formation strongly depended on Na2SO4 concentration and temperature. A reactive transport model was applied to predict mineralogical distribution in solidified cementitious materials exposed to 10% of Na2SO4 for 1000 years, where the material was hydrated with 25% of Na2SO4 before the exposure. The dissolution of mirabilite and secondary formation of ettringite were the dominant degradation mechanisms, but not the formation of Na2SO4 crystals. Further, the mineralogical distribution and pore volume at 100 mm from the exposure surface did not change significantly after 10 years of exposure, but the deterioration progressed from the surface to core of the materials with exposure time.

Author Contributions

Conceptualization, Y.E. and E.O.; methodology, Y.E.; software, Y.E.; validation, Y.E., E.O. and T.N.; formal analysis, Y.E.; investigation, Y.E. and E.O. and T. N.; writing—original draft preparation, Y.E.; writing—review and editing, Y.E., E.O., and T.N.; supervision, T.N.; project administration, Y.E.; funding acquisition, E.O.

Funding

A part of this research was funded by JSPS KAKENHI Grant No: 18K0429708.

Conflicts of Interest

The authors declare no conflict of interest.

Appendix A. Model Description

Appendix A.1. Phase-Equilibrium Model

This model was used to define the amount of cement hydrate phases that can react reversibly with an aqueous solution to achieve equilibrium. PHREEQC was employed to carry out thermodynamic equilibrium calculations [23]. When a pure phase is no longer in equilibrium with a solution, it will dissolve or precipitate. The equilibrium reactions are expressed by the mass-action equations as
K p = i ( γ i c i ) n i , p
where Kp is the thermodynamic equilibrium constant for phase p, γi is the activity coefficient of ion i (−), ci is the concentration of ion i (mol/L), and ni,p is the stoichiometric coefficient of ion i in phase p (−). The activity coefficients were calculated based on the Pitzer model, and the activity coefficients of the cations, γM, and anions, γX, were given by Reference [38].
ln γ M = z M 2 F + a m a ( 2 B M a + Z C M a ) + c m c ( 2 ϕ M C + a m a ψ M c a )     + a < a m a m a ψ a a M + | Z M | c a m c m a C c a
ln γ X = z X 2 F + c m c ( 2 B c X + Z C c X ) + a m a ( 2 ϕ X a + c m c ψ X a c )     + c < c m c m c ψ c c X + | Z X | c a m c m a C c a
where mi is the molarity of i; subscript M, c, and c′ denote cations; and X, a, and a′ denote anions. The double summations c < c′ and a < a′ denote all pairs of dissimilar cations and anions respectively. B is the function of experimentally measuring parameters β0, β1, and β2, C, φ, and ψ. The term F is defined by
F = A ϕ [ I 1 + b I + 2 b ln ( 1 + b I ) ] + c a m c m a B c a + c < c m c m c ϕ c c + a < a m a m a ϕ a a
where b equal to 1.2 and I is ionic strength. The Debye-Huckel osmotic parameter Aϕ is given by
A ϕ = 1 3 ( 2 π N 0 ρ w 1000 ) 1 2 ( e 2 D κ T )
where ρw is the density of water, N0 is the Avogadro constant, e is the charge of electron, D is the dielectric constant, and κ is the Boltzmann constant. Pitzer interaction parameters used in the calculations were collected from various references [30,31,32].
Cement hydrate phases are defined by chemical reaction, an equilibrium constant, and enthalpy. The thermodynamic equilibrium constant, Kp, at a given temperature T (K) can be expressed as
K p = exp ( Δ r G T 0 R T )
where ΔrGT0 is the standard Gibbs energy of reaction at temperature T and R is the universal gas constant (8.31451 J/(mol K)). The standard Gibbs energy of reaction is expressed as
Δ r G T 0 = Δ f G T , p r o d u c t s 0 Δ f G T , r e a c t a n t s 0
where ΔfGT0 is the Gibbs free energy of formation for a species at a given temperature T. The equilibrium constant (logKp) at standard conditions and the standard heat of reaction (ΔrH0), was used in the van’t Hoff equation [22] to determine temperature dependence of the equilibrium constant, for the dissolution reactions of phases used in the simulation which are tabulated in Table A1. The name of the phase (defined by dissolution reaction, logKp, and ΔrH0, as given in Table A1), the specified saturation index (which has a value of zero for equilibrium), and the amount of the phase were the input parameters for the phase-equilibrium module in PHREEQC. The model is described in our previous works [21,22,23,24,25,26].
Table A1. Thermodynamic properties of the phases at 25 °C used in the simulation.
PhaseReactionslogKprH0Ref.
AnhydriteCaSO4↔ Ca2+ + SO42-−4.36−1.71[23]
BruciteMg(OH)2 + 2H+ ↔ Mg2+ + 2H2O17.07−115.66[27]
C3AH6Ca3Al2(OH)12 + 12H+ ↔ 3Ca2+ + 2Al3+ + 12H2O82.22−595.76[27]
C3FH6Ca3Fe2(OH)12 + 12H+ ↔ 3Ca2+ + 2Fe3+ + 12H2O73.65−516.96[27]
CalciteCaCO3 ↔ Ca2+ + CO32−−8.48−2.297[23]
CASH_5CA(CaO)1.25(Al2O3)0.125(SiO2):1.625H2O + 3.25H+ ↔ 1.25Ca2+ + 0.25Al3+ + H4SiO4 + 1.25H2O22.00−141.58[29]
CASH_INFCA(CaO)(Al2O3)0.15625(SiO2)1.1875:1.65625H2O + 2.9375H+ ↔ Ca2+ + 0.3125Al3+ + 1.1875H4SiO4 + 0.75H2O16.60−110.67[29]
CSH_T2C(CaO)1.5(SiO2):2.5H2O + 3H+ ↔ 1.5Ca2+ + H4SiO4 + 2H2O25.88−127.10[29]
CSH_T5C(CaO)1.25(SiO2)1.25:2.5H2O + 2.5H+ ↔1.25Ca2+ + 1.25H4SiO4 + 1.25H2O18.74−83.46[29]
CSH_Jen(CaO)1.667(SiO2):2.1H2O + 3.334H+ ↔ 1.667Ca2+ + H4SiO4 + 1.767H2O29.60−148.44[27]
CSH_TobH(CaO)(SiO2)1.5:2.5H2O + 2H+ ↔ Ca2+ + 1.5H4SiO4 + 0.5H2O13.18−47.83[29]
EttringiteCa6Al2(SO4)3(OH)12:26H2O + 12H+ ↔ 6Ca2+ + 2Al3+ + 3SO42− + 38H2O57.73−389.36[27]
GypsumCaSO4:2H2O ↔ Ca2+ + SO42− + 2 H2O−4.58−0.109[23]
HemicarboaluminateCa4Al2(CO3)0.5(OH)13:5.5H2O + 13H+ ↔ 4Ca2+ + 2Al3+ + 0.5CO32− + 18.5H2O87.88−604.27[27]
HydrotalciteMg4Al2(OH)14:3H2O + 14H+ ↔ 2Al3+ + 4Mg2+ + 17H2O75.97−607.91[27]
MirabiliteNa2SO4:10H2O ↔ 2Na+ + SO42− + 10H2O−1.2279.471[28]
MonocarboaluminateCa4Al2(CO3)(OH)12:5H2O + 12H+ ↔ 4Ca2+ + 2Al3+ + CO32− + 17H2O71.54−533.14[27]
MonosulfoaluminateCa4Al2(SO4)(OH)12:6H2O + 12H+ ↔ 4Ca2+ + 2Al3+ + SO42− + 18H2O73.68−553.08[27]
PortlanditeCa(OH)2 + 2H+ ↔ Ca2+ + 2H2O22.79−129.66[27]
ThaumasiteCa6(SiO3)2(SO4)2(CO3)2: 30H2O + 4H+ ↔ 6Ca2+ + 2H4SiO4 +2CO32− + 2SO42− +28H2O−1.65520.23[27]
ThenarditeNa2SO4 ↔ 2Na+ + SO42−−0.34−2.46[28]

Appendix A.2. Cement Hydration Model

The cement hydration model proposed by Parrot and Killoh (1984) was used to estimate the hydration degree of each cement clinker mineral as a function of time [39]. The model is described in detail elsewhere [21,27,40]. Parrot and Killoh [39] derived a set of empirical equations to describe the hydration rate, Rtm, of an individual clinker mineral m at time t (m = C3S, C2S, C3A, C4AF):
Nucleation and growth
R t , 1 m = K 1 N 1 [ 1 α t m ] { ln ( 1 α t m ) } ( 1 N 1 )
Diffusion
R t , 2 m = K 2 ( 1 α t m ) 2 3 1 ( 1 α t m ) 1 3
Hydration shell formation
R t , 3 m = K 3 ( 1 α t m ) N 3
The associated empirical parameters in the equations are tabulated in Table A2, as reported by [27,40]. The minimum among above the rates ( R t , 1 m , R t , 2 m , R t , 3 m ) is considered to be the controlling rate. The hydration degree of clinker mineral m at the time t, αtm, is calculated from the hydration degree of the mineral at the previous time step (αt−1m), the time interval (Δt), and hydration rate of the clinker mineral at the previous time step (Rt−1m) as
α t m = α t 1 m + Δ t · min ( R t 1 , 1 m , R t 1 , 2 m , R t 1 , 3 m ) · β w / c · λ R H · A A 0 · exp [ E a m R ( 1 T 0 1 T ) ]
where,
β w / c = [ 1 + 3.333 × ( H m × w / c α t 1 ) ] 4      if   α t   >   H m   ×   w / c β w / c = 1      if   α t     H m   ×   w / c
λ R H = ( R H 0.55 0.45 ) 4
where Hm is the critical degree of the clinker mineral m, w/c is the water to cement ratio, αt−1 is the total hydration degree of cement at the previous time step, A is the Blaine surface area of cement (m2/kg), A0 is the reference surface area of cement (385 m2/kg), Eam is the apparent activation energy of clinker mineral m (J/mol), T0 is the reference temperature (293.15 K), and RH is the relative humidity. The adapted values for Hm and Eam are based on the work by Lothenbach et al. (2008a; 2008b), and are given in Table A2.
The total hydration degree of cement, αt, relative to the total clinker content at time t is expressed by
α t = f C 3 S α t C 3 S + f C 2 S α t C 2 S + f C 3 A α t C 3 A + f C 4 A F α t C 4 A F f C 3 S + f C 2 S + f C 3 A + f C 4 A F
where fm is the relative mass fraction of the cement clinker mineral m.
Table A2. Parameters adapted to calculate the hydration degree of the clinker minerals as a function of time [27,40].
C3SC2SC3AC4AF
K11.50.510.37
N10.710.850.7
K20.050.0060.040.015
K31.10.210.4
N33.353.23.7
H1.81.351.601.45
Ea (J/mol)41,57020,78554,04034,087
PHREEQC was coupled with Excel® to carry out thermodynamic calculations at each time step. PHREEQC performed speciation and batch-reaction calculations to calculate the solution composition and the kind and amounts of precipitated phases, based on a thermodynamic dataset and input parameters. The calculations on the dissolution rate of clinker minerals were carried out in Excel®, and the necessary data were transferred to PHREEQC as input parameters. The coupled model is described in a previous work [21], and used in here to simulate hydration reaction of cement in sodium sulphate environment.

Appendix A.3. Multispecies Transport Model

The diffusion coefficients of cations, anions, and neutral species in a solution have different values, and the diffusive flux of a selected ion, i, considering concentration and electrical potential gradients and the chemical activity effects, can be expressed by the Nernst-Planck equation as follows [22,25]
J i = D w , i [ ln ( γ i ) ln ( c i ) + 1 ] c i x + D w , i z i c i j = 1 n D w , j z j [ ln ( γ j ) ln ( c j ) + 1 ] c j x j = 1 n D w , j z j 2 c j
where Dw,i is its diffusion coefficient, γi is its activity coefficient, ci is its concentration, and zi is its valance; the subscript j is introduced to show that these species are for the potential term. The diffusion coefficient of ions in a porous medium, Dp, is related to Dw,i, porosity, Φ, and tortuosity, τ, by Archie’s law
D p = D w , i Φ τ
The multi-component diffusion calculation was performed using the built-in model in PHREEQC with the keyword of “-multi_d”. The length of a single pore in the hardened body is subdivided into several immobile cells, and one-dimensional multi-species transport takes place from the exposure solution to pore water. In the simulation, the transport model was applied with the phase-equilibrium model to simulate ionic profile and chemical reaction as a result of ionic ingress. The multicomponent diffusion model is described in detail in our previous studies [25,26].

References

  1. Metcalfe, R.; Walker, C. NUMO-TR-04-05. In Proceedings of the International Workshop on Bentonite-Cement Interaction in Repository Environments, Tokyo, Japan, 14–16 April 2004. [Google Scholar]
  2. IAEA. Near Surface Disposal of Radioactive Waste. In IAEA Safety Standards Series, Requirements; IAEA: Vienna, Austria, 1999. [Google Scholar]
  3. Atkins, M.; Glasser, F.P. Application of portland cement-based materials to radioactive waste immobilization. Waste Manag. 1992, 12, 105–131. [Google Scholar] [CrossRef]
  4. Glasser, F.P. Progress in the immobilization of radioactive wastes in cement. Cem. Concr. Res. 1992, 22, 201–216. [Google Scholar] [CrossRef]
  5. Jantzen, C.; Johnson, A. Cements in waste management. Adv. Cem. Res. 2010, 22, 225–231. [Google Scholar] [CrossRef]
  6. Lin, W.-S.; Liu, C.-W.; Li, M.-H. Influences of specific ions in groundwater on concrete degradation in subsurface engineered barrier system. Springerplus 2016, 5, 745. [Google Scholar] [CrossRef] [PubMed] [Green Version]
  7. Owaki, E.; Niwase, K.; Akatsuka, M.; Kudo, J. Effect of curing temperature on cement paste containing sodium sulphate. JSCE Ann. Meet. 2012, 67, 57–58. [Google Scholar]
  8. Divet, L.; Randriambololona, R. Delayed Ettringite Formation: The Effect of Temperature and Basicity on the Interaction of Sulphate and C-S-H Phase. Cem. Concr. Res. 1998, 28, 357–363. [Google Scholar] [CrossRef]
  9. Scrivener, K.; Skalny, J. International RILEM Workshop on Internal Sulfate Attack and Delayed Ettringite Formation. Mater. Struct. 2004, 37, 71–72. [Google Scholar] [CrossRef]
  10. Alexander, M.; Bertron, A.; De Belie, N. Performance of Cement-Based Materials in Aggressive Aqueous Environments, RILEM TC 211, ed.; Springer: New York, NY, USA, 2013. [Google Scholar]
  11. Sarkar, S.; Mahadevan, S.; Meeussen, J.C.L.; van der Sloot, H.; Kosson, D.S. Numerical simulation of cementitious materials degradation under external sulfate attack. Cem. Concr. Compos. 2010, 32, 241–252. [Google Scholar] [CrossRef]
  12. Marchand, J.; Samson, E.; Maltais, Y.; Beaudoin, J.J. Theoretical analysis of the effect of weak sodium sulfate solutions on the durability of concrete. Cem. Concr. Compos. 2002, 24, 317–329. [Google Scholar] [CrossRef]
  13. Rozière, E.; Loukili, A.; El Hachem, R.; Grondin, F. Durability of concrete exposed to leaching and external sulphate attacks. Cem. Concr. Res. 2009, 39, 1188–1198. [Google Scholar] [CrossRef] [Green Version]
  14. Rodriguez-Navarro, C.; Doehne, E.; Sebastian, E. How does sodium sulfate crystallize? Implications for the decay and testing of building materials. Cem. Concr. Res. 2000, 30, 1527–1534. [Google Scholar] [CrossRef] [Green Version]
  15. Soive, A.; Tran, V.Q. External sulfate attack of cementitious materials: New insights gained through numerical modeling including dissolution/precipitation kinetics and surface complexation. Cem. Concr. Compos. 2017, 83, 263–272. [Google Scholar] [CrossRef]
  16. Maekawa, K.; Ishida, T.; Kishi, K. Multi-Scale Modelling of Concrete; Taylor Francis: Abingdon-on-Thames, UK, 2009. [Google Scholar]
  17. Elakneswaran, Y.; Ishida, T. Development and verification of an integrated physicochemical and geochemical modelling framework for performance assessment of cement-based materials. J. Adv. Concr. Technol. 2014, 12, 111–126. [Google Scholar] [CrossRef]
  18. Geiker, M.R.; Michel, A.; Lepech, M.D.; Wu, J.; Stang, H. Multi-scale and multi-physics deterioration for design and assessment of reinforced concrete structures. RILEM Tech. Lett. 2017, 2, 119–128. [Google Scholar] [CrossRef]
  19. Jensen, M.M. A Coupled Transport and Chemical Model for Durability Predictions of Cement Based Materials. Ph.D. Thesis, Technical University of Denmark, Copenhagen, Denmark, 2014. [Google Scholar]
  20. Marty, N.C.M.; Bildstein, O.; Blanc, P.; Claret, F.; Cochepin, B.; Gaucher, E.C.; Jacques, D.; Lartigue, J.-E.; Liu, S.; Mayer, K.U.; et al. Benchmarks for multicomponent reactive transport across a cement/clay interface. Comput. Geosci. 2015, 19, 635–653. [Google Scholar] [CrossRef]
  21. Elakneswaran, Y.; Owaki, E.; Miyahara, S.; Ogino, M.; Maruya, T.; Nawa, T. Hydration study of slag-blended cement based on thermodynamic considerations. Constr. Build. Mater. 2016, 124, 615–625. [Google Scholar] [CrossRef]
  22. Appelo, C.A.J.; Postma, D. Geochemistry, Groundwater and Pollution; CRC Press Taylor & Francis Group: Boca Raton, FL, USA, 2009. [Google Scholar]
  23. Parkhust, D.L.; Appelo, C.A.J. A Computer Program for Speciation, Batch-Reaction, One-Dimensional Transport and Inverse Geochemical Calculations; USGS: Middleton, WI, USA, 1999.
  24. Pitzer, K.S. Ion Interaction Approach: Theory and Data Correlation. In Activity Coefficients in Electrolyte Solutions; Pitzer, K.S., Ed.; CRC Press: Boca Raton, FL, USA, 1991. [Google Scholar]
  25. Elakneswaran, Y.; Iwasa, A.; Nawa, T.; Sato, T.; Kurumisawa, K. Ion-cement hydrate interactions govern multi-ionic transport model for cementitious materials. Cem. Concr. Res. 2010, 40, 1756–1765. [Google Scholar] [CrossRef] [Green Version]
  26. Kari, O.P.; Elakneswaran, Y.; Nawa, T.; Puttonen, J.A. A model for a long-term diffusion of multispecies in concrete based on ion-cement-hydrate interaction. J. Mater. Sci. 2013, 48, 4243–4259. [Google Scholar] [CrossRef]
  27. Lothenbach, B.; Matschei, T.; Möschner, G.; Glasser, F.P. Thermodynamic modelling of the effect of temperature on the hydration and porosity of Portland cement. Cem. Concr. Res. 2008, 38, 1–18. [Google Scholar] [CrossRef]
  28. BRGM. THERMODDEM. Available online: http://thermoddem.brgm.fr/ (accessed on 2 October 2018).
  29. Myers, R.J.; Bernal, S.A.; Provis, J.L. A thermodynamic model for C-(N-)A-S-H gel: CNASH_ss. Derivation and validation. Cem. Concr. Res. 2014, 66, 27–47. [Google Scholar] [CrossRef] [Green Version]
  30. Appelo, C.A.J. Principles, caveats and improvements in databases for calculating hydrogeochemical reactions in saline waters from 0 to 200 °C. and 1 to 1000 atm. Appl. Geochem. 2015, 55, 62–71. [Google Scholar] [CrossRef]
  31. Accornero, M.; Marini, L. Empirical prediction of the Pitzer’s interaction parameters for cationic Al species with both SiO2 (aq) and CO2 (aq): Implications for the geochemical modelling of very saline solutions. Appl. Geochem. 2009, 24, 747–759. [Google Scholar] [CrossRef]
  32. Boily, J.F.; Qafoku, O.; Felmy, A.R. A potentiometric, spectrophotometric and pitzer ion-interaction study of reaction equilibria in the aqueous H+-Al3+, H+-oxalate and H+-Al3+-oxalate systems up to 5 mol/dm-3 NaCl. J. Solut. Chem. 2007, 36, 1727–1743. [Google Scholar] [CrossRef]
  33. Li, G.; Le Bescop, P.; Moranville-Regourd, M. Synthesis of the U phase (4CaO·0.9Al2O3·1.1SO3·0.5Na2O·16H2O). Cem. Concr. Res. 1997, 27, 7–13. [Google Scholar] [CrossRef]
  34. Li, G.; Le Bescop, P.; Moranville, M. The U phase formation in cement-based systems containing high amounts of Na2SO4. Cem. Concr. Res. 1996, 26, 27–33. [Google Scholar] [CrossRef]
  35. Champenois, J.B.; Dhoury, M.; Coumes, C.C.D.; Mercier, C.; Revel, B.; Le Bescop, P.; Damidot, D. Influence of sodium borate on the early age hydration of calcium sulfoaluminate cement. Cem. Concr. Res. 2015, 70, 83–93. [Google Scholar] [CrossRef]
  36. Morinaga, Y.; Kajio, T.; Elakneswaran, Y.; Nawa, T.; Owaki, E. U-phase[(CaO)x(Al2O3) (SO3)y(Na2O)z:nH2O] in hydrating cement with sodium sulfate. In Proceedings of the The International Conference on Advances in Construction Materials and Systems, Chennai, India, 3–8 September 2017. [Google Scholar]
  37. Lothenbach, B.; Bary, B.; Le Bescop, P.; Schmidt, T.; Leterrier, N. Sulfate ingress in Portland cement. Cem. Concr. Res. 2010, 40, 1211–1225. [Google Scholar] [CrossRef]
  38. Plummer, L.N.; Parkhurst, D.L.; Fleming, G.W. A Computer Program Incorporating Pitzer’s Equations for Calculation of Geochemical Reactions in Brines. US Geolog. Surv. Water-Resour. Investig. Rep. 1988, 88, 310. [Google Scholar]
  39. Parrot, L.J.; Killoh, D.C. Prediction of cement hydration. Br. Ceram. Proc. 1984, 35, 41–53. [Google Scholar]
  40. Lothenbach, B.; Winnefeld, F. Thermodynamic modelling of the hydration of Portland cement. Cem. Concr. Res. 2006, 36, 209–226. [Google Scholar] [CrossRef]
Figure 1. Schematic diagram for the calculation procedure.
Applsci 08 02597 g001
Figure 2. Influence of activity coefficient on Na2SO4 solubility [30].
Applsci 08 02597 g002
Figure 3. Activity coefficient equation on Portland cement hydration: (A) hydrate assemblage and (B) pore solution changes from PHREEQC.dat + extended Debye-Huckel equation; (C) hydrate assemblage and (D) pore solution changes from Pitzer.dat + Pitzer equation for activity coefficient.
Applsci 08 02597 g003
Figure 4. The temperature variation in the hydration calculations.
Applsci 08 02597 g004
Figure 5. (A) Hydrate assemblage of PC without Na2SO4, (B) hydrate assemblage of PC with 25% of Na2SO4, and (C) pore solution concentration of PC with 25% of Na2SO4, for varying temperature.
Applsci 08 02597 g005aApplsci 08 02597 g005b
Figure 6. CASH end member of hydrating PC, (A) without Na2SO4, and (B) with 25% of Na2SO4.
Applsci 08 02597 g006
Figure 7. Distribution of hydrates at 28 days of hydration of PC as a function of Na2SO4 addition.
Applsci 08 02597 g007
Figure 8. Influence of Na2SO4 concentration on hydrated PC, at (A) 25 °C and (B) 80 °C.
Applsci 08 02597 g008
Figure 9. PC exposed to 10% of Na2SO4 for 1000 years: (A) Phase changes after 1000 years; (B) phase changes at 100 mm from the exposure surface.
Applsci 08 02597 g009
Table 1. Chemical composition and physical properties of PC and mixing conditions.
Oxide Composition (wt %)Mineralogical Composition (wt %)
SiO221.60C3S50.61
Al2O35.40C2S23.83
Fe2O32.60C3A9.92
CaO64.00C4AF7.90
SO32.00Gypsum2.09
MgO1.80Calcite1.00
Na2O0.38CaO_free1.00
K2O0.55
Physical propertiesMixing conditions
Density (g/cm3)3.18W/B0.55
Blaine (m2/kg)334Temp. (°C)25
RHFully saturated

