Article

Online Determination of Boron Isotope Ratio in Boron Trifluoride by Infrared Spectroscopy

School of Chemical Engineering & Technology, Tianjin University, Tianjin 300072, China
*
Author to whom correspondence should be addressed.
Appl. Sci. 2018, 8(12), 2509; https://doi.org/10.3390/app8122509
Submission received: 17 September 2018 / Revised: 2 December 2018 / Accepted: 3 December 2018 / Published: 6 December 2018
(This article belongs to the Section Chemical and Molecular Sciences)

Abstract

:
Enriched boron-10 and its related compounds have great application prospects, especially in the nuclear industry. The chemical exchange rectification method is one of the most important ways to separate the 10B and 11B isotope. However, a real-time monitoring method is needed because this separation process is difficult to characterize. Infrared spectroscopy was applied in the separation device to realize the online determination of the boron isotope ratio in boron trifluoride (BF3). The possibility of determining the isotope ratio via the 2ν3 band was explored. A correction factor was introduced to eliminate the difference between the ratio of peak areas and the true value of the boron isotope ratio. It was experimentally found that the influences of pressure and temperature could be ignored. The results showed that the infrared method has enough precision and stability for real-time, in situ determination of the boron isotope ratio. The instability point of the isotope ratio can be detected with the assistance of the online determination method and provides a reference for the production of boron isotope.

1. Introduction

Boron in naturally occurring compounds is composed of two isotopes, one of mass 10 and the other of mass 11. 10B at a relative abundance of 18.8%, has an unusually large cross section for the capture of low energy neutrons [1]. Therefore, in high concentrations, it is particularly valuable for neutron shielding [2,3].
The design and realization of the isotopes separation processes of boron began as early as the Second World War. A large industrial plant with a productivity of up to 300 kg per year of elemental boron with 95% 10B content was put into operation in 1944 [4]. At present, the most common methods for the separation of boron isotopes include the distillation method [5], chemical exchange rectification [6,7], ion exchange [8,9], and laser isotope separation [10,11], among others. Chemical exchange rectification is the simplest and most productive method for the separation of 10B and 11B isotopes at concentrations of 95% and over [12]. Figure 1 shows the principal scheme of the apparatus for the separation of boron isotopes using the chemical exchange rectification method. 10B and 11B can be extracted from the separation and the complex parts of the apparatus, respectively [13]. The internal variations in this separation process tend to be very complex, making it necessary to frequently track any changes in the isotope ratio obtained.
The mass spectrometry (MS) method is one of the most important ways of analyzing the boron isotope ratio. Analysis comes from the peaks with mass-to-charge ratios (m/e+) equal to 10 and 11 [14]. Porteous [15] et al. determined the isotopic ratio of boron in samples of groundwater by inductively coupled plasma mass spectrometry (ICP-MS) to evaluate possible levels of boron pollution from anthropogenic inputs into natural aqueous systems. The matrix effect was reduced by the preconcentration and ion-exchange of the sample. Compared with the standard material, the precision of the method achieved 0.13% (natural abundance). However, the sampling and preparation for this method are very complex, so it is difficult to achieve real-time tracking for this process during actual production. Infrared spectroscopy (IR) is a traditional technology that has been used for on-line detection. For instance, Hepburn [16] et al. established a method using online FTIR spectroscopy to determine the siloxane content in bio-gas. Both the precision and the detection limit for siloxane were satisfactory when using this online FTIR technology.
The vibrational spectra of BF3 has been studied by Herrebout [17,18] et al.and Sluyts [19] et al. The results were obtained by dissolving BF3 in liquid Argon. The infrared absorption bands changed depending on the change in the boron isotope ratio. Thus, the bands could be used to measure the boron isotopic ratio in BF3. Despite having a good signal-noise ratio in the ν3 region, such a high dilution factor was difficult to realize via changing optical paths in the industrialized process. Although the 2ν3 is a weak IR absorption band for BF3, the difference in absorbance peaks was about 112 cm−1 between 10BF3 and 11BF3 at the 2ν3 bands, which means that there is good resolution for this measurement. In this paper, the IR method was applied to determine the boron isotope ratio based on calculating the BF3 infrared spectrum at 2ν3. Further, an infrared spectrophotometer was installed in a boron separation device to monitor the separation process online.

2. Experimental Method

2.1. Instruments and Reagents

The BF3 was purchased from LiuFang Gas Corporation (Dalian, LN , China) with a stated purity of 99.95%. Small amounts of SiF4 were present as an impurity in the BF3 but these were ignored in this study. NIST SRM 951a isotopic reference material of boric acid (10B/11B is 0.2473 ± 0.0002) was purchased from the National Institute of Standards and Technology (Gaithersburg, MD, USA). A gas cell (TianGuang Optical Instrument Co. Ltd., Tianjin, TJ, China) was equipped with the CaF2 windows (φ40 × 5 mm). The optical path length of this gas cell was 100 mm. An infrared spectrophotometer (Xintian Optical Analytical Instrument Co. Ltd., Tianjin, TJ, China) with an accuracy of transmittance lower than or equal to ±0.2%T. (TJ270-30A, Tianjin, China). The 10B/11B ratio was measured as a reference by an ICP-MS X7 (Thermo Electron Corporation, Waltham, MA, USA) series mass spectrometer manufactured by the Thermo Electron Corporation.

2.2. Procedure for Offline Measurement

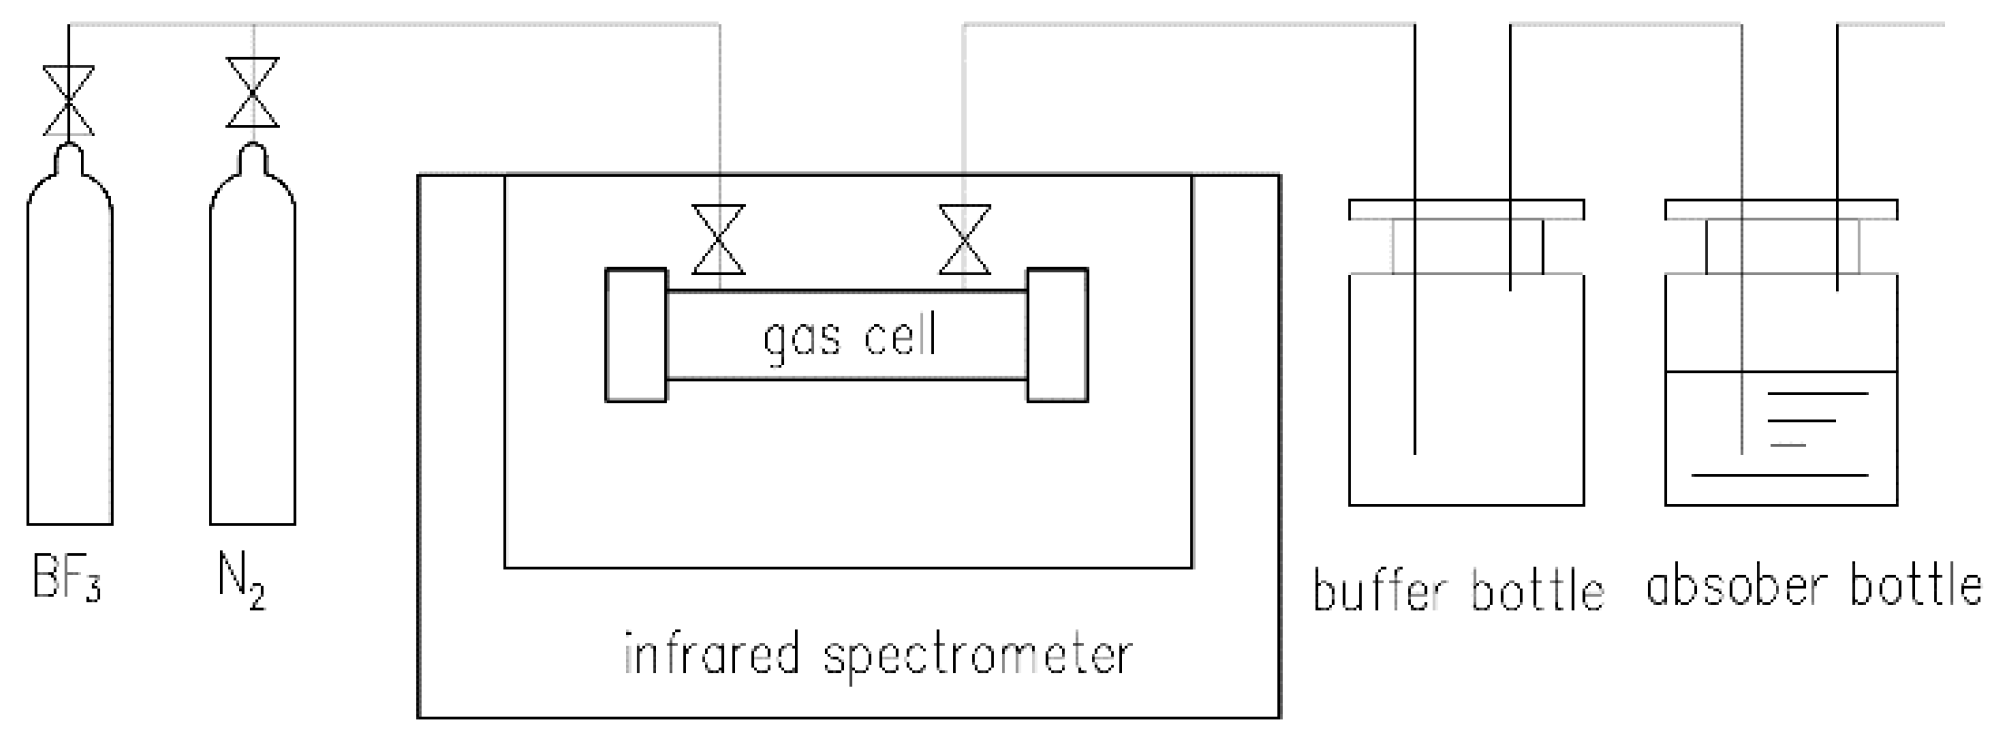
The procedure for the offline experiment is shown in Figure 2. BF3 gas samples with different amounts of boron were collected from the chemical exchange rectification device or feed gas cylinder. The outlet of the gas cell was linked to a buffer bottle and an absorber bottle filled with sodium hydroxide solution to prevent BF3 gas from escaping. BF3 was filling into the gas cell, which was replaced by N2 to remove the air (especially the water in air) inside of the gas cell beforehand. This was allowed to continue for at least 1–2 min, and the operation was stopped when the inside of the gas cell was fully replaced by BF3. The valves of the gas cylinder and gas cell were closed in turn for about 10 min before use. The infrared spectra were acquired from scanning the contents of the gas cell at a scanning speed of 1 cm−1/s and a scanning range of 4000 to 400 cm−1.

2.3. Procedure for Online Measurement

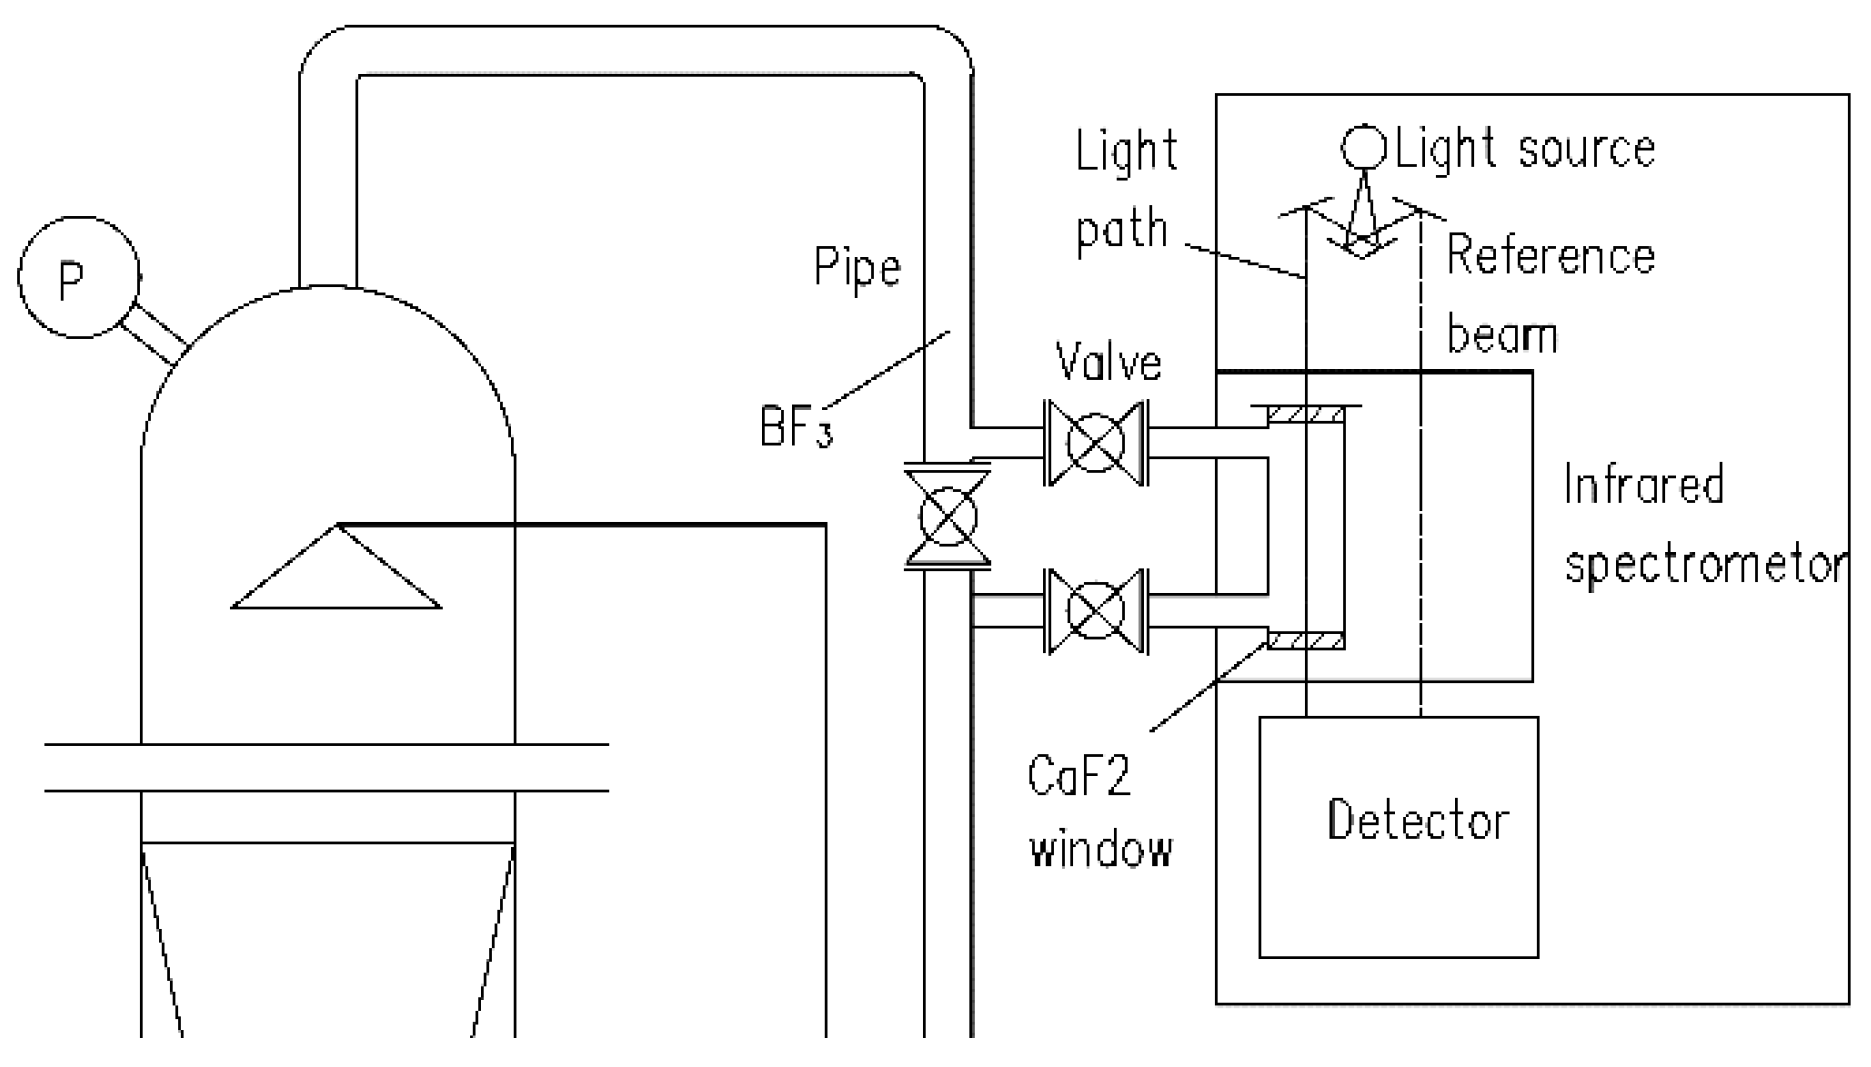
The online isotopic ratio determination system was set on the device used for boron isotope separation, as shown in Figure 3. The BF3 gas was extracted from a pipe where the gas flow and the pipeline can be controlled by valve. The BF3 flowed through a gas cell that was equipped with two CaF2 windows because the weatherability and corrosion resistance of CaF2 are superior to KBr under atmospheric and BF3 conditions. The whole gas cell was fitted to the IR spectrophotometer by which the infrared spectrogram could be obtained directly.

2.4. Testing method of ICP-MS

The ICP-MS was used to determine the isotope ratio as a reference. The BF3 gas was absorbed by a small amount of ethanol and diluted to samples containing 0.1 μg/mL of boron with ultrapure water. The operation method and experimental conditions of the ICP-MS experiments were similar to the method found in [15]. After each test, the system pipeline was alternately washed three times with 2% HNO3 and 0.1 mol/L ammonia water solution to reduce any errors due to memory effect. The specific parameters used for the ICP-MS experiments to determine the boron isotope ratios (10B/11B) are shown in Table 1.

3. Results and Discussion

3.1. Calculation and Correction of the Isotope Ratio

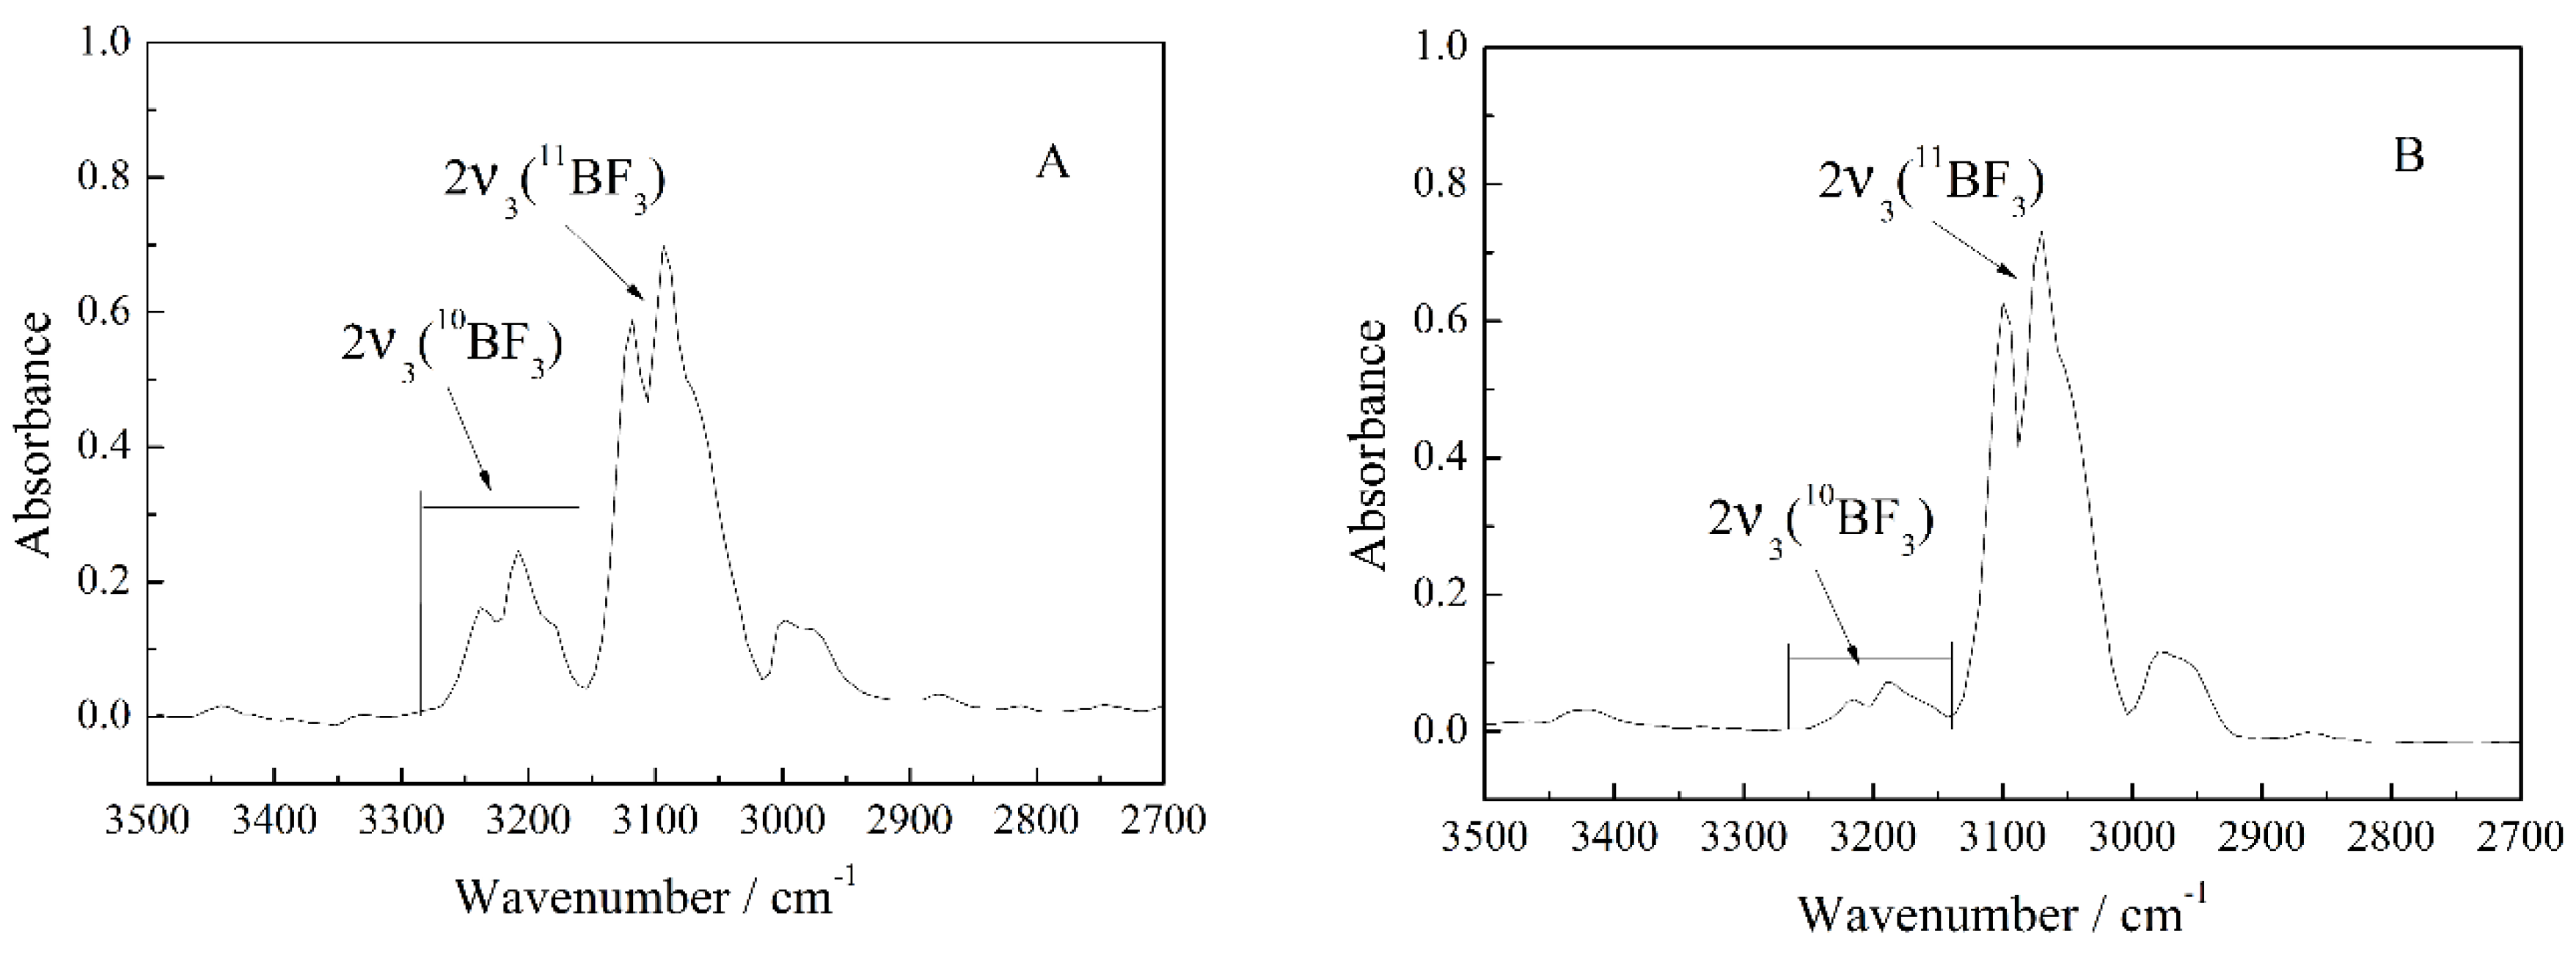
Figure 4 shows the comparison of the IR spectrograms in the 2ν3 regions between natural abundance BF3 and enriched 11BF3. The peaks at these regions are more complex than peaks in the ν3 regions. Fortunately, the peak changes had no significant overlap of the two bands. By contrast, the absorption band of 2ν3 for 10BF3 (the range being about 3270–3170 cm−1) was significantly reduced, which proved that this absorption band is influenced by the amount of 10BF3 that is present. In contrast, the absorption peaks in the 2ν3 band for 11BF3 (the range being about 3170–3070 cm−1) varied regularly with changing concentrations of 11BF3. Thus, it was feasible to calculate the isotope ratio based on comparing the peak areas of these two absorption bands.
The NIST SRM 951a boric acid standard sample was used to investigate the accuracy of the ICP-MS. Before testing by ICP-MS, the standard boric acid sample was dissolved and diluted to a solution containing 0.1 μg/mL of boron with ultrapure water. The relative error between the result from the ICP-MS and the standard value is shown in Table 2.
The relative error between the experimental result from the ICP-MS and the isotopic ratio of the standard material was less than 0.16%. This result indicated that the ICP-MS, which was used to determine the boron isotope ratio in solution has a high accuracy, and could be used to calibrate the isotope ratio of boron in BF3. In Figure 4, the isotopic ratio values of the samples were calibrated by ICP-MS. The 10B/11B ratios of the natural abundance BF3 and enriched 11BF3 samples were 0.2473 ± 0.0009 and 0.0526 ± 0.0011, respectively.
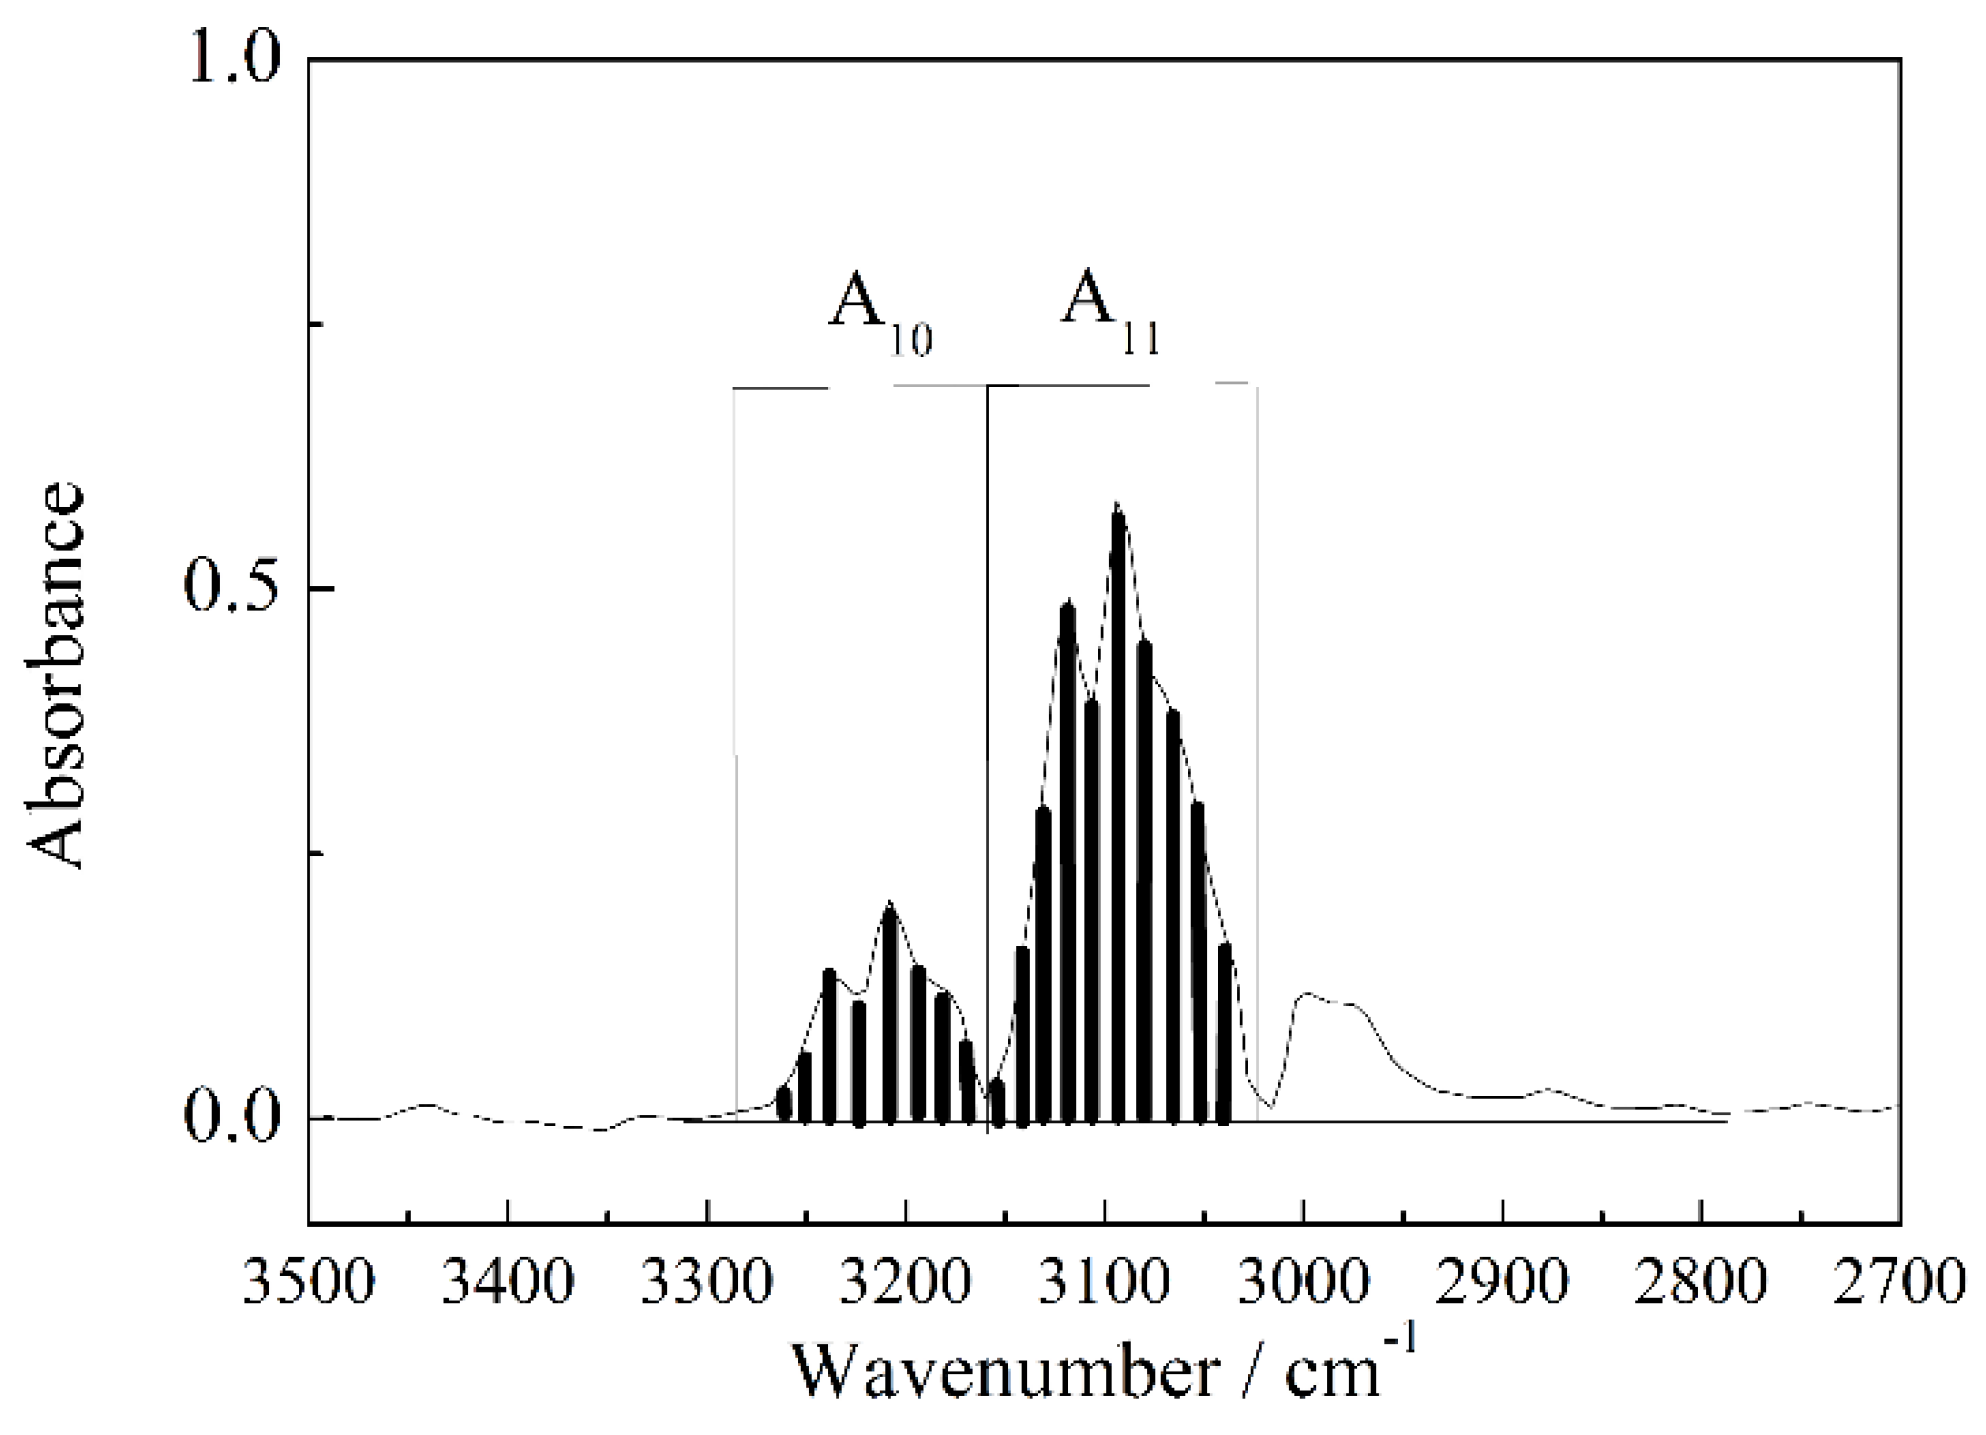
10BF3 and 11BF3 could be regarded as two distinct forms of matter. As is shown in Figure 5, the graph shape of A10 represents peaks of 2ν3 of 10BF3. Similarly, A11 represents 2ν3 peaks for 10BF3. The baselines of the spectrograms were adjusted to zero before calculation. The experiments were processed at room temperature (25 ± 3 °C).
It is obvious that the difference in the peak integration value is significant between the A10/A11 and the true value of 10B/11B, and this is most likely due to 10BF3 and 11BF3 having different molar absorption coefficients at the 2ν3 band. According to Lambert-Beer theory:
lg(I0/I) = ε × b × c
where, ε is the molar absorption coefficient, c is the molarity of the substance (mol/L), b is the optical length (cm), and lg(I0/I) is the absorbance at the specific wavenumber. A10 or A11 could be regarded as the addition of several fixed number of absorptions roughly:
A 10 / A 11 = i = 1 n lg ( I 0 / I 10 ) i / i = 1 n lg ( I 0 / I 11 ) i = i = 1 n ε 10 i b 10 i c 10 i / i = 1 n ε 11 i b 11 i c 11 i
For b10 = b11, c10i/c11i is a constant for the same gas (fixed concentration). Then:
A 10 / A 11 = ( i = 1 n ε 10 i / i = 1 n ε 11 i ) × ( c 10 / c 11 )
Let i = 1 n ε10i/ i = 1 n ε11i = K. K, which is the correction factor, then:
K = A11/A10 × c10/c11
and
c10/c11 = A11/A10 × K
The correction factor, K, is the ratio of the addition of a series of molar absorption coefficients in essence according to Equations (1)–(5). So, boron isotope ratio can be calculated by the peak areas of A10 and A11. The correction factor can be obtained by testing the BF3 gas of a known isotope ratio. Table 3 shows the continuous determination results of the A10/A11 ratio for the normal, natural abundance BF3 sample. The ICP-MS result of 10B/11B for this sample is 0.2473. While, the isotope ratio of 10B/11B is equal to c10/c11, based on the ICP-MS result and Equation (5), the value of correction factor K is 0.5431.

3.2. Precision Experiment for the IR Method

The precision experiment was achieved by continuous measurements of a group of samples of a known isotope ratio, and the results are shown in Table 4. The relative standard deviation (RSD) was calculated by Equation (6),
R S D = S x ¯ × 100 % = i = 1 n ( x i x ¯ ) 2 n 1 x ¯ × 100 %
where, S is the standard deviation, x ¯ is the mean value of the results of n tests, and n is the number of tests. The RSD of the samples with the higher levels of isotope ratio were less than 2.00%. Although the RSD of the sample where the 10B/11B ratio was 0.0506 (by ICP-MS) was more than 5.00%, the mean value of the IR method was close to the results from the ICP-MS experiments. These results indicated that the IR method is more precise when determining the boron isotope ratio.

3.3. Influence of the Pressure and Temperature

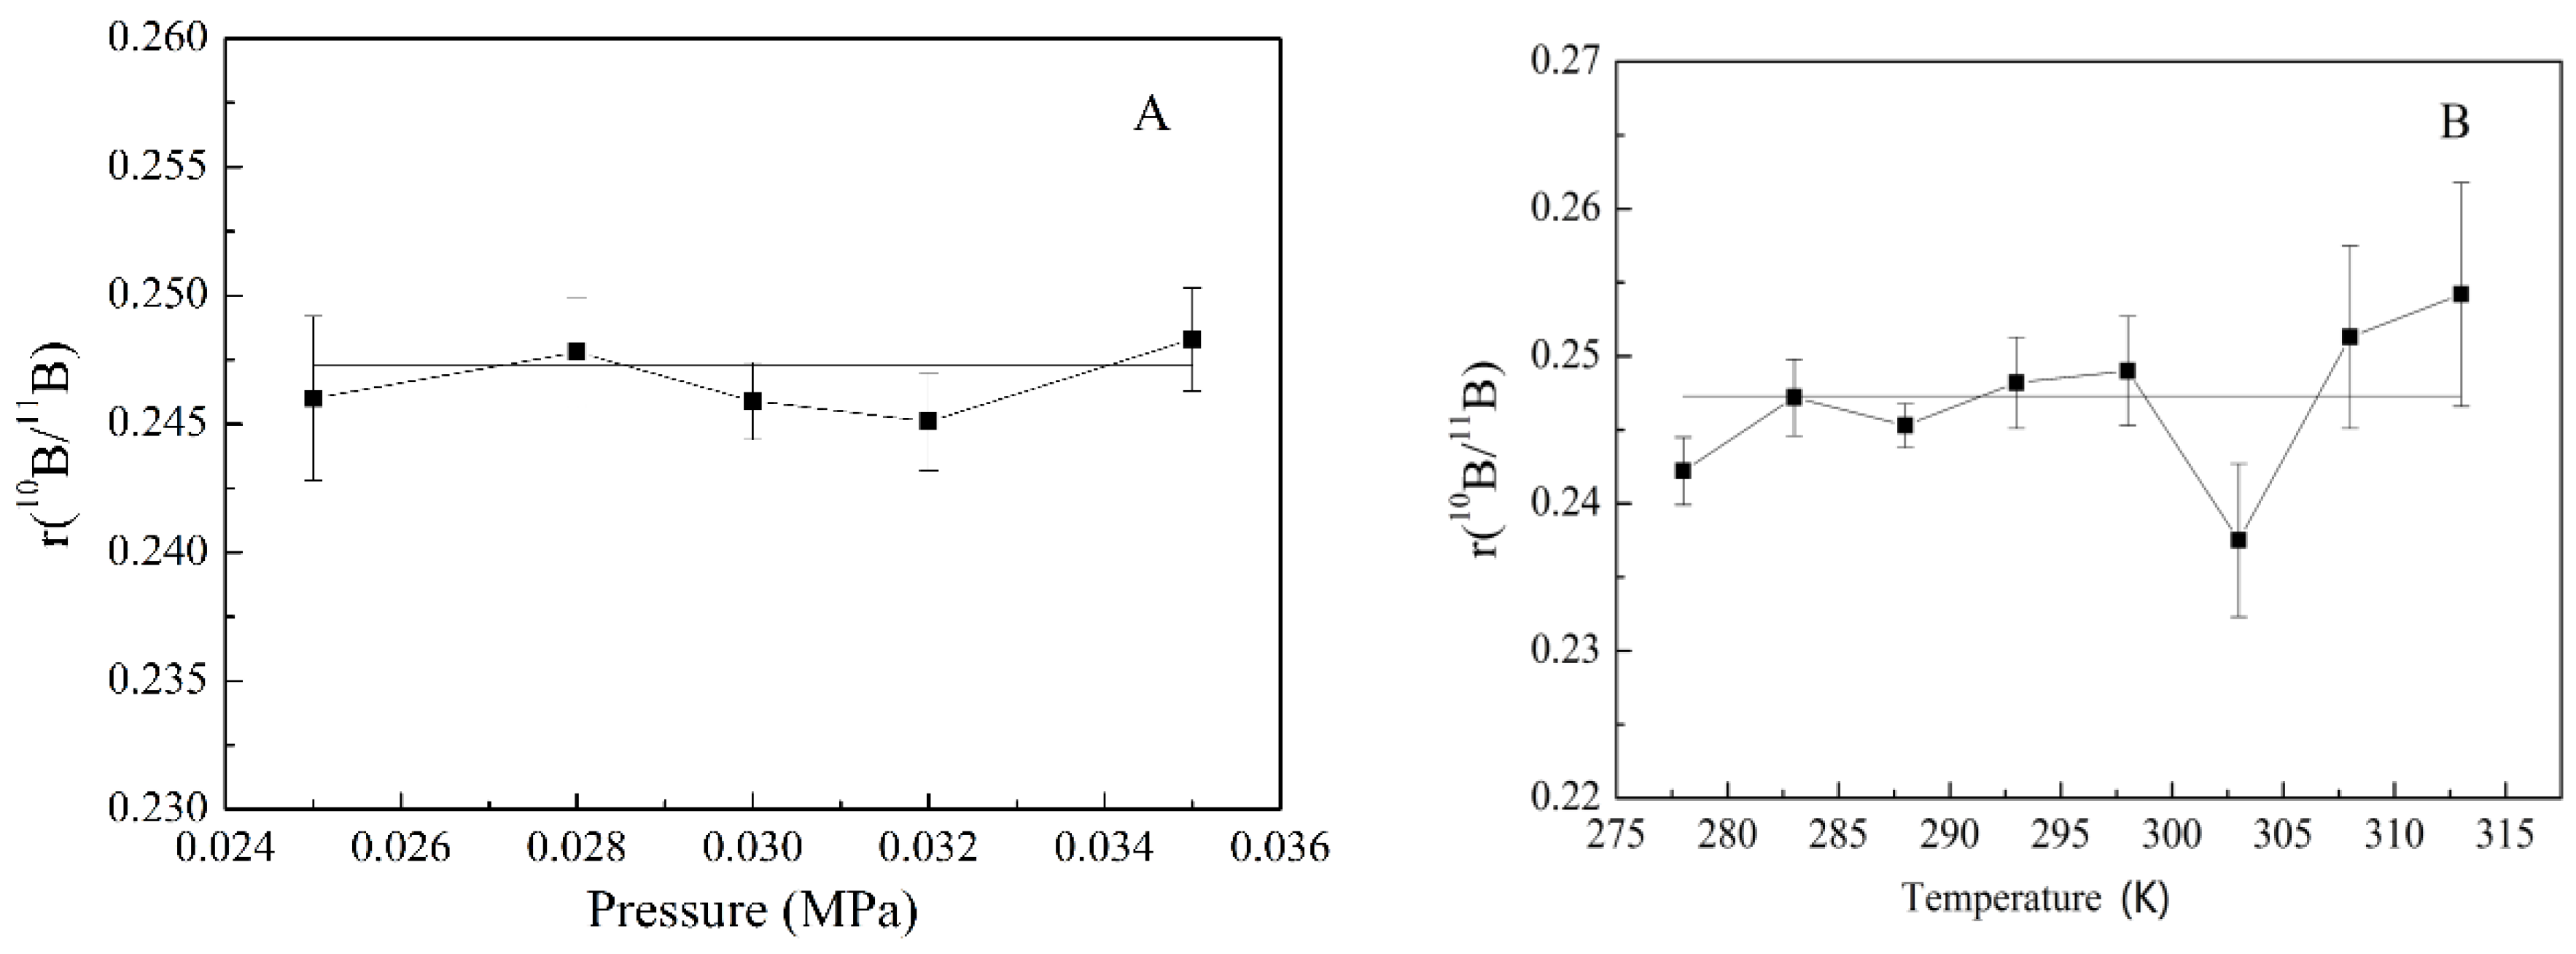
Due to the effect of the concentration of BF3, absorbance values grew with an increase in pressure. In addition, an increase in the temperature made the peak pattern wilder. Figure 6A,B show the influence of pressure and temperature on the isotope ratio of 10B/11B, with the ranges of pressure and temperature being the possible interval values for the chemical exchange rectification operation. It was found that both the pressure and temperature have little impact on the isotope ratio determination results. Nevertheless, the optimum operation temperature was in the range of 278 to 298 K, because the errors might increase significantly when the temperature is higher than 303 K.

3.4. Investigation of the Enriched BF3 Gas by IR

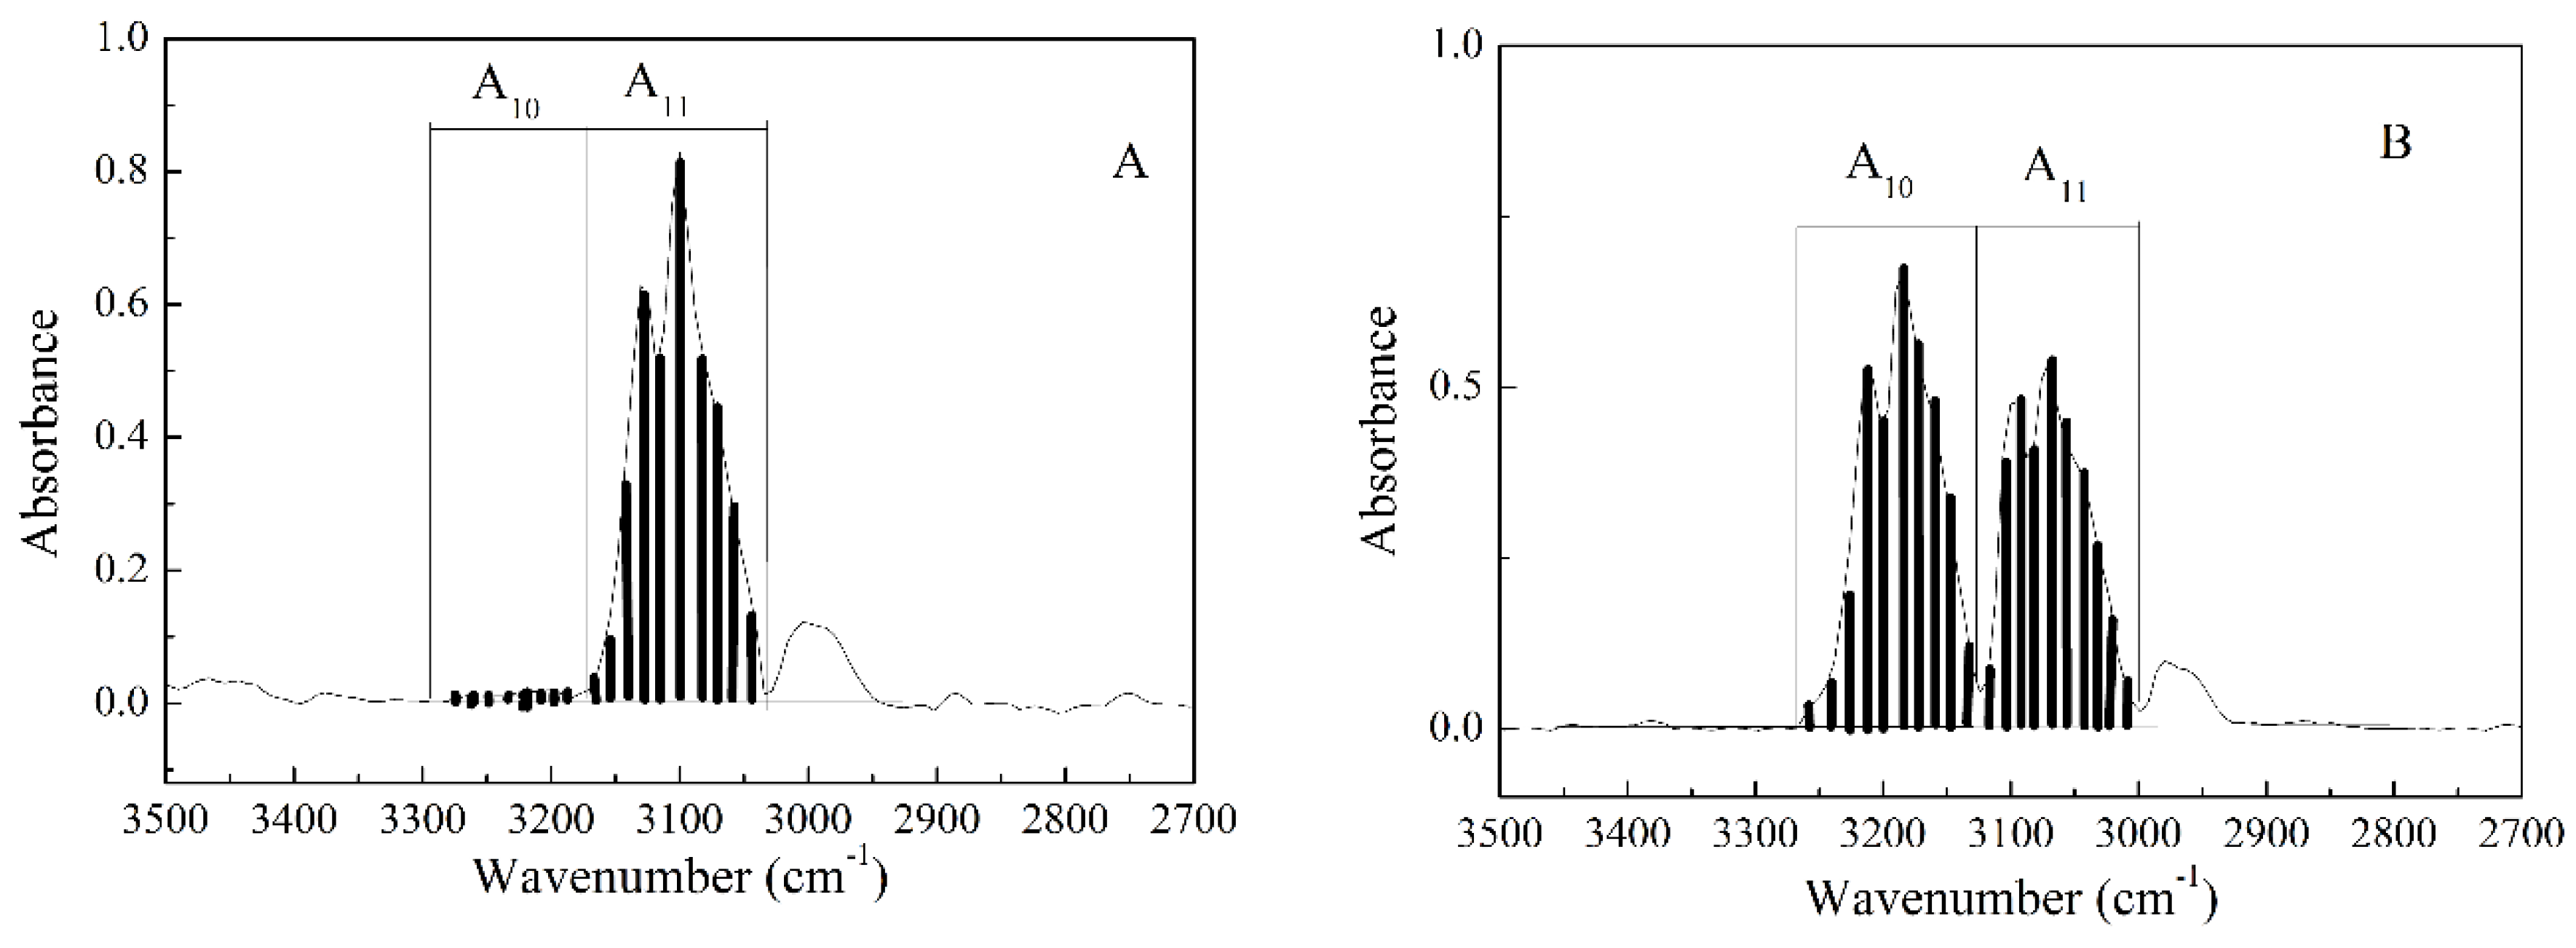
Figure 7 shows the IR spectrograms for an enriched 10BF3 sample and an enriched 11BF3 sample. It is clearly observed in Figure 7A that when the concentration of 10B decreased, the absorption peaks of A10 were reduced and the A11 peaks increased. Similarly, the absorption peaks of A11 were reduced and the A10 peaks were increased in Figure 7B. The calculation results for the samples in Figure 7A,B were 0.0120 and 0.7536, respectively. All of the results were in good agreement with the ICP-MS as a reference standard (the isotope ratios for Figure 7A,B were 0.0102 and 0.7546, respectively) for each sample, which proved the validity of the IR method. A series of enriched BF3 samples, with their isotopic ratios determined by IR, are listed in Table 5, with the mean and standard deviation obtained from 10 determinations. By comparing the results of the IR method and the ICP-MS method, the errors of measurement increased slightly when determining the ratio of high abundance samples. This could be attributed to the decline in the signal-noise ratio (SNR), which was caused by the decrease in the absorbance value.

3.5. Online Determination of Boron Isotope Ratio

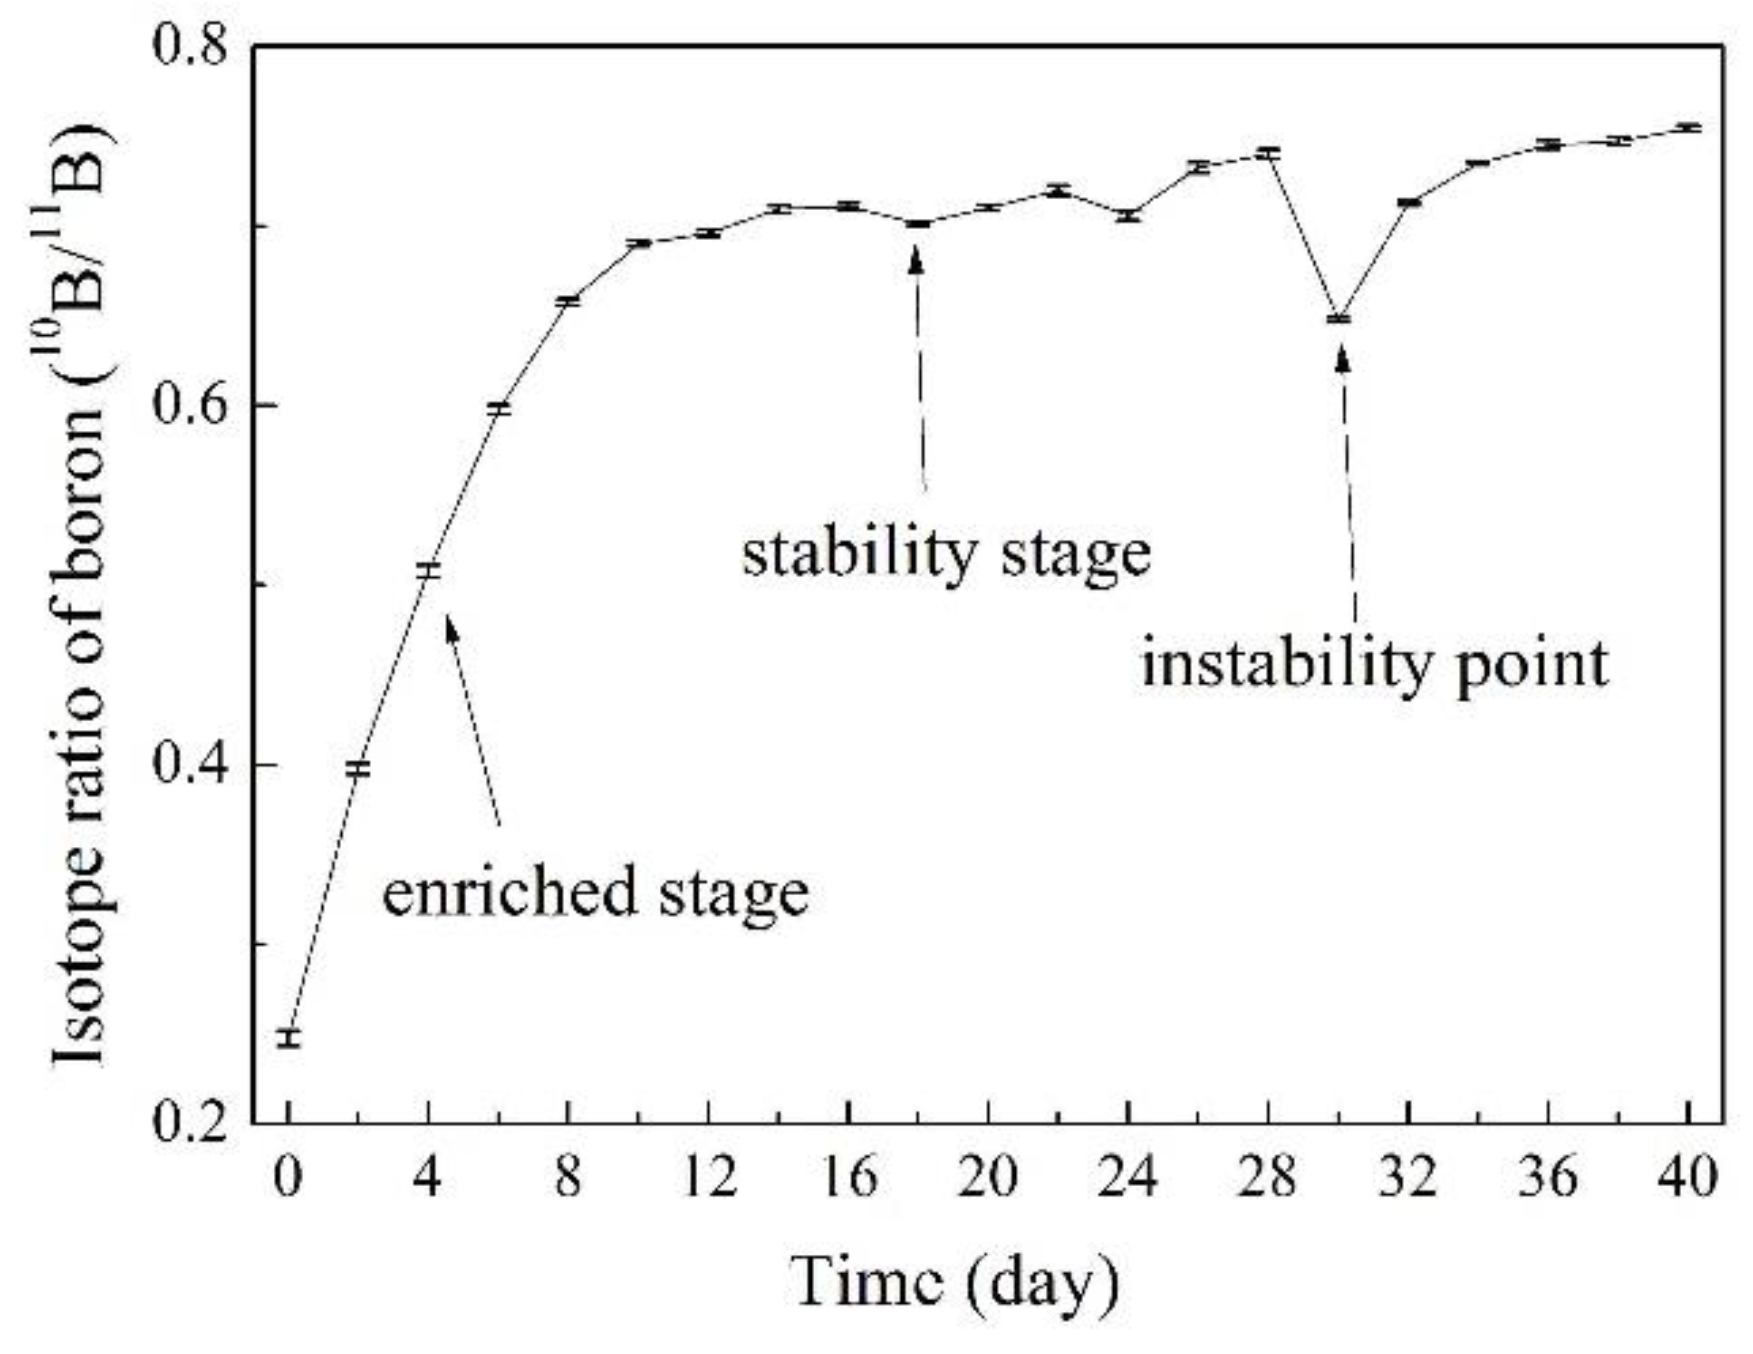
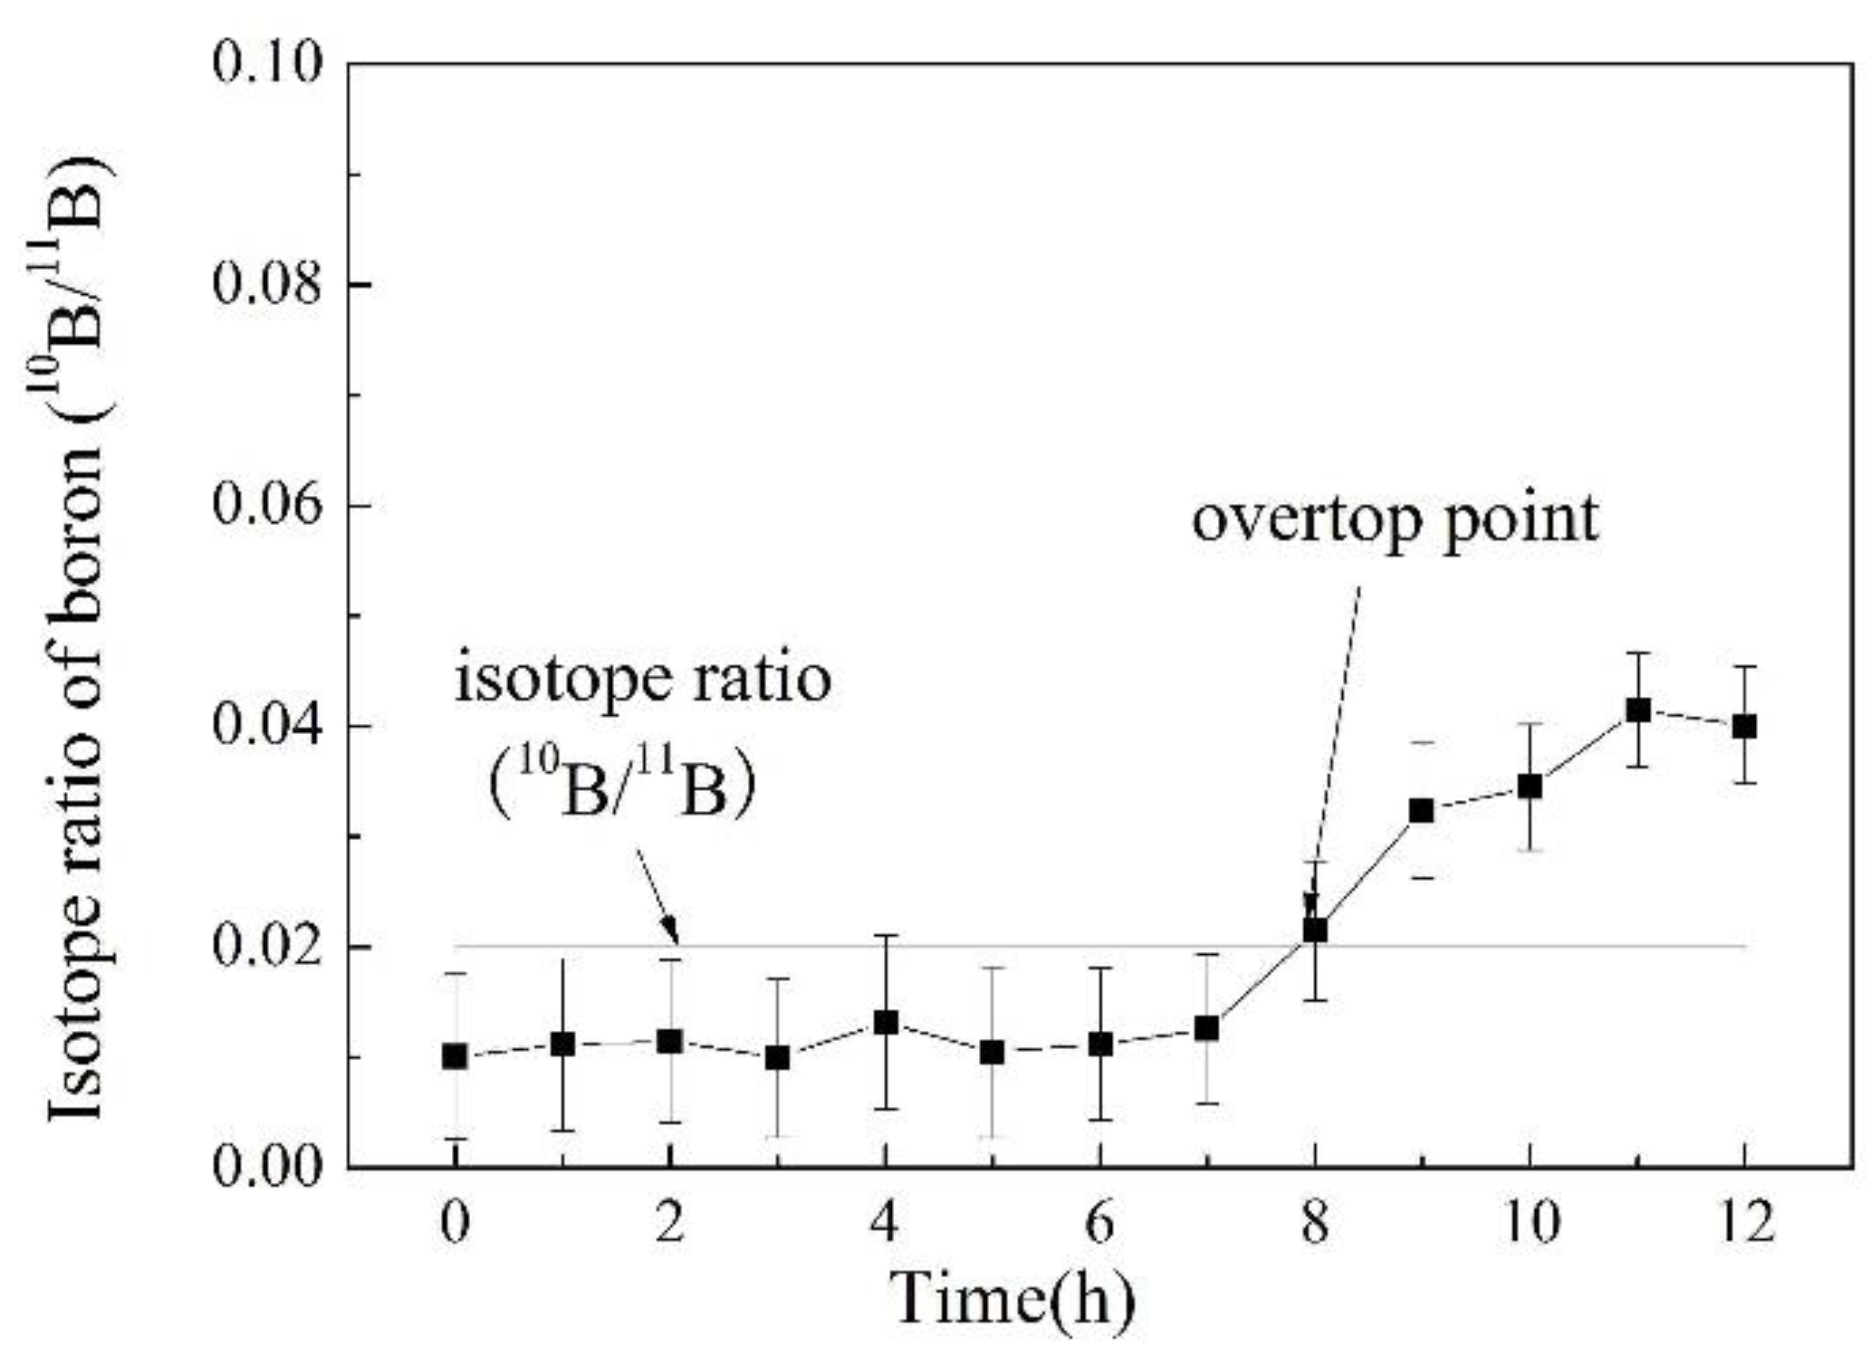
Figure 8 illustrates the online determination results from the separation part of a chemical exchange rectification device, showing the enriched stage, the stability stage, and an instability point (where the isotope ratio suddenly drops). With the assistance of IR spectroscopy, the instability point can be found and thus encourage correction of the operation. Figure 9 shows the isotope ratio curve of the complex part where the 11BF3 was enriched on the same isotope separation device. The errors of determination results were a little larger when the isotope ratio become smaller with the decrease in SNR. The sampling stage experiments lasted for 12 h and the sampling interval was 2 h. The curve shows the change of the isotope ratio in the process of product collection. The overtopping (exceeding limit value) point indicated that the sampling operation should be stopped at that moment, because the limit of the isotope ratio for 11B product (10B/11B ≤ 0.0204) has been exceeded.

4. Conclusions

A method was established to determine the isotope ratio of boron based on calculating the 2ν3 region of BF3 in infrared spectra used in a boron separation device to monitor the separation process online. The results showed that this has many benefits for a chemical exchange rectification device with the assistance of the online IR method. Response speed and measuring precision might be enhanced with further improvements such as the use fiber-optic technology.

Author Contributions

W.Z. and J.X. conceived and designed the experiments; Y.T. performed the experiments; Y.T. and J.X. analyzed the data; W.Z. contributed reagents/materials/analysis tools; Y.T. wrote the paper.

Funding

This research received no external funding.

Conflicts of Interest

The authors declare no conflicts of interest.

References

  1. Zhang, L.; Zhang, W.J.; Xu, J.; Ren, X. Synthesis of enriched 10B boric acid of nuclear grade. Trans. Tianjin Univ. 2014, 6, 458–462. [Google Scholar] [CrossRef]
  2. Zhang, W.J.; Liu, T.Y.; Xu, J. Preparation and characterization of 10B boric acid with high purity for nuclear industry. Springerplus 2016, 1, 1202–1212. [Google Scholar] [CrossRef] [PubMed]
  3. Ferreira, T.H.; Miranda, M.C.; Rocha, Z.; Leal, A.S.; Comes, D.A.; Sousa, E.M.B. An Assessment of the Potential Use of BNNTs for Boron Neutron Capture Therapy. Nanomaterials 2017, 4, 82–92. [Google Scholar] [CrossRef] [PubMed]
  4. Conn, A.L.; Wolf, J.E. Large-scale separation of boron isotopes. Ind. Eng. Chem. 1958, 9, 1231–1234. [Google Scholar] [CrossRef]
  5. Sevryugova, N.N.; Uvarov, O.V.; Zhavoronkov, N.M. Determination of the separation coefficients of the isotopes of boron in the equilibrium evaporation of BCl3. Sov. J. Atomic Energy 1956, 4, 567–572. [Google Scholar] [CrossRef]
  6. Zhang, L.; Zhang, W.J.; Xu, J.; Li, B. Preparation of boric-10 acid applied in nuclear industry. Trans. Tianjin Univ. 2015, 2, 172–177. [Google Scholar] [CrossRef]
  7. Ivanov, V.A.; Katalnikov, S.G. Physico-Chemical and engineering principles of boron isotopes separation by using BF3-Anisole•BF3 system. Sep. Sci. Technol. 2001, 8–9, 1737–1768. [Google Scholar] [CrossRef]
  8. Yoneda, Y.; Uchijima, T.; Makishima, S. Separation of boron isotopes by ion exchange. J. Phys. Chem. 1959, 12, 2057–2058. [Google Scholar] [CrossRef]
  9. Oi, T.; Tsukamoto, T.; Akai, H.; Kakihana, H.; Hosoe, M. Boron isotope separation by ion-exchange chromatography using an anion-exchange resin in halide forms: Separation factors at 25 °C. J. Chromatogr. A 1988, 3, 343–352. [Google Scholar] [CrossRef]
  10. Rockwood, S.; Rabideau, S. Boron isotope separation by laser-induced photochemistry. IEEE J. Quantum Electron. 1974, 9, 789–790. [Google Scholar] [CrossRef]
  11. Lyman, J.L.; Rockwood, S.D. Enrichment of boron, carbon, and silicon isotopes by multiple-photon absorption of doi:10.6-μm laser radiation. J. Appl. Phys. 1976, 2, 595–601. [Google Scholar] [CrossRef]
  12. Wei, F.; Zhang, W.J.; Han, M.; Han, L.G.; Zhang, X.M.; Zhang, S.F. Operational policy of the boron isotopes separation by chemical exchange reaction and distillation. Chem. Eng. Process. 2008, 1, 17–21. [Google Scholar] [CrossRef]
  13. Katal’nikov, S.G.; Paramonov, P.M.; Nedzvetskii, V.S. Separation of boron isotopes using isotopic exchange between BF3 and a complex of BF3 with phenetole. Sov. J. Atomic Energy 1967, 4, 372–377. [Google Scholar] [CrossRef]
  14. Lecuyer, C.; Grandjean, P.; Reynard, B.; Albarede, C.; Telouk, P. 11B/10B analysis of geological materials by ICP–MS Plasma 54: Application to the boron fractionation between brachiopod calcite and seawater. Chem. Geol. 2002, 1, 45–55. [Google Scholar] [CrossRef]
  15. Porteous, N.C.; Walsh, J.N.; Jarvis, K.E. Measurement of boron isotope ratios in groundwater studies. Analyst 1995, 5, 1397–1400. [Google Scholar] [CrossRef]
  16. Hepburn, C.A.; Vale, P.; Brown, A.S.; Simms, N.J.; McAdam, E.J. Development of on-line FTIR spectroscopy for siloxane detection in biogas to enhance carbon contactor management. Talanta 2015, 141, 128–136. [Google Scholar] [CrossRef] [PubMed] [Green Version]
  17. Herrebout, W.A.; Lundell, J.; Van der Veken, B.J. Van der Waals complexes between unsaturated hydrocarbons and boron trifluoride: An infrared and ab initio study of ethyne BF3, propyne BF3 and propyne (BF3)2. J. Mol. Struct. 1999, 480, 489–493. [Google Scholar] [CrossRef]
  18. Herrebout, W.A.; Van der Veken, B.J. Vibrational spectra and relative stabilities of the van der Waals complexes of boron trifluoride with cis-2-butene, trans-2-butene and 2-methyl propene. J. Mol. Struct. 2000, 550, 389–398. [Google Scholar] [CrossRef]
  19. Rayón, V.M.; Sordo, J.A. Van der Waals complexes between boron trifluoride and carbon monoxide: A theoretical study. J. Phys. Chem. A 1997, 40, 7414–7419. [Google Scholar] [CrossRef]
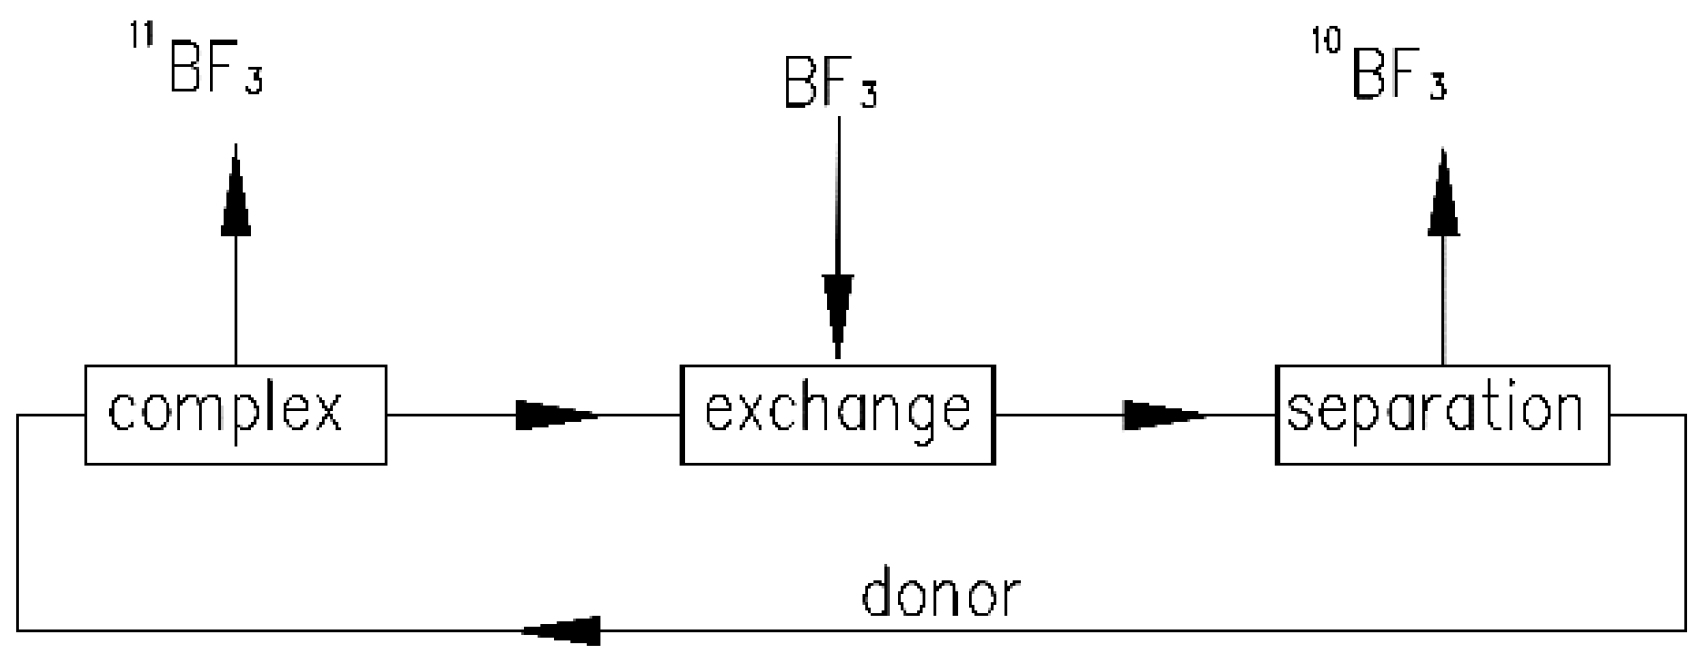
Figure 1. Principal scheme of the apparatus for the separation of boron isotopes using the chemical exchange rectification method.
Applsci 08 02509 g001
Figure 2. Diagram of offline experiment.
Applsci 08 02509 g002
Figure 3. Diagram of boron isotope ratio online determination system.
Applsci 08 02509 g003
Figure 4. Comparison of the IR spectrograms. (A) Natural abundance BF3; (B) Enriched 11BF3.
Applsci 08 02509 g004
Figure 5. Schematic of the calculation method.
Applsci 08 02509 g005
Figure 6. Influence of pressure and temperature on the isotope ratio of 10B/11B. (A) Influence of pressure; (B) Influence of temperature.
Applsci 08 02509 g006
Figure 7. IR spectrograms of enriched BF3. (A) Spectrogram of an enriched 11BF3 sample; (B) Spectrogram of an enriched 10BF3 sample.
Applsci 08 02509 g007
Figure 8. Online determination results of the separation part of a chemical exchange rectification device.
Applsci 08 02509 g008
Figure 9. The curve of isotope ratio about the complex part of a chemical exchange rectification device.
Applsci 08 02509 g009
Table 1. Experimental conditions and parameters of inductively coupled plasma mass spectrometry (ICP-MS). Counts per Second (CPS); Atomic Mass Unit (AMU).
ItemParameterItemParameter
NebulizerMicroconcentric NebulizerSensitivity/s−1 (μg·L−1)−11.759 × 10⁶ CPS
Spray chamber temperature/°C3Scanning modePeak-jump
Nebulizer gas flow/L·min−10.93Dwell time/ms10
Auxiliary gas flow/L·min−10.9Acquisition degree10
Cool gas flow/L·min−110Acquisition time/s20
Plasma power/W1250Channels per AMU3
ResolutionStandardRuns/replicates3
Sample uptake rate/mL·min−11Sample depth/mm104
Ionization lens parametersL1 3.8; L2 31.8; L3 189.8--
Table 2. Accuracy experiment of ICP-MS.
10B/11B Results of ICP-MSMean Value10B/11B Value of Standard MaterialRelative Error/%
123456
0.24710.24640.24690.24680.24690.24750.24690.2473 ± 0.00020.16
Table 3. Investigation of the correction factor by continuous determination of the ratio of A10/A11 of the natural abundance BF3.
A10/A11 (by IR Method)Mean ValueRSD/%10B/11B (by ICP-MS 1)K
0.45080.45130.46340.45531.160.2473 ± 0.00090.5431
0.45850.46010.4512
0.45350.44980.4515
0.4626
1 mean and standard deviation were obtained from 3 determinations.
Table 4. Precision experiment for the IR method.
10B/11B (by ICP-MS)Sample (10B/11B, by IR Method)Mean ValueSRSD/%
123456
1.23511.22901.23821.24011.23201.23551.24131.23600.00480.39
0.24730.24050.24280.24510.24220.25060.24720.24470.00371.52
0.05060.05590.05320.04850.05110.04630.05090.05100.00346.64
Table 5. Comparison of the results from the IR method and ICP-MS method.
Series No.Isotope Ratio of 10B/11B
Results of IR MethodResults of ICP-MS
11.6385 ± 0.00431.6390 ± 0.0006
20.7536 ± 0.00450.7546 ± 0.0010
30.4815 ± 0.00380.4832 ± 0.0009
40.0915 ± 0.00590.0905 ± 0.0010
50.0504 ± 0.00630.0488 ± 0.0012
60.0120 ± 0.00790.0102 ± 0.0007