Article

Influence of Calcium Sulfate Type on Evolution of Reaction Products and Strength in NaOH- and CaO-Activated Ground Granulated Blast-Furnace Slag

1
Department of Civil Engineering, Kyonggi University, 154-42, Gwanggyosan-ro, Yeongtong-gu, Suwon-Si, Gyeonggi-do 16227, Korea
2
School of Urban and Environmental Engineering, Ulsan National Institute of Science and Technology (UNIST), UNIST-gil 50, Ulju-gun, Ulsan 44919, Korea
3
Dept. of Architecture and Architectural Engineering, Seoul National University, 1, Gwanak-ro, Gwanak-Gu, Seoul 08826, Korea
*
Author to whom correspondence should be addressed.
Appl. Sci. 2018, 8(12), 2500; https://doi.org/10.3390/app8122500
Submission received: 16 October 2018 / Revised: 14 November 2018 / Accepted: 28 November 2018 / Published: 5 December 2018
(This article belongs to the Section Materials Science and Engineering)

Abstract

:
This study investigated the influences of CaSO4 type (i.e., anhydrite vs. gypsum) on strength development and reaction products in the activation of ground granulated blast-furnace slag (GGBFS) when different activators (i.e., CaO vs. NaOH) and sources of GGBFS were used. In the CaO-activation, the addition of calcium sulfates greatly enhanced 28-day strengths, regardless of the choice of CaSO4 or GGBFS source, through increasing the quantities of reaction products and reducing pore volume and size. However, in the NaOH-activation, the use of calcium sulfates showed the complex dependency of strength on the choice of CaSO4 type and GGBFS source, and it barely produced beneficial effects on the quantity of reaction products and reduction of pore volume and size. Thus, the results in this study indicate that the combination of CaO-activation and calcium sulfates is a more effective means of activating GGBFS to gain enhanced strength and significant quality control than the use of gypsum with NaOH-activation.

1. Introduction

The manufacturing process for ordinary Portland cement (OPC) accounts for 12–15% of the consumption of all industrial energy usage and emits a large amount of greenhouse gas, producing 800–1000 kg of carbon dioxide per ton of OPC. In general, the amount of carbon dioxide emitted during OPC production is thought to be responsible for approximately 6~8% of worldwide carbon dioxide emissions [1,2]. To reduce the current consumption of OPC, alkali-activated inorganic binders, which utilize industrial waste by-products such as coal fly ash and ground granulated blast-furnace slag (GGBFS), have been developed as an alternative to OPC [3,4]. Particularly, alkali-activated GGBFS is a strong candidate which is suitable for meeting established OPC standards (e.g., American Concrete Institute [ACI] or CEB-FIP codes) because it has characteristic similarities to OPC; it generates comparable binding properties with an analogous major reaction product, known as calcium silicate hydrate 1 [C-S-H(I)] [5,6], to those of OPC. Despite the aforementioned potential, alkali-activated GGBFS binder is still not widely used commercially in the construction industry, mainly because of the low cost-effectiveness of alkaline activators and the safety issues connected with their high pH toxicity [7]. Considering these issues, the choice of an appropriate alkali-activator is significant because it determines strength development and safety, and it represents a production cost of alkali-activated GGBFS. Thus, calcium-based activators [e.g., Ca(OH)2 or CaO] have gained attention [8,9,10,11,12] as alternatives to alkaline activators, due to their significantly lower pH and lower material costs [10] than those of alkaline hydroxide or silicates. Kim et al. reported the superior strength development of CaO activation over that of Ca(OH)2 [10].
CaSO4∙2H2O (gypsum) and CaSO4 (anhydrite) have been applied to activate fly ash, known as geopolymer [13,14]. These studies showed that both sulfate sources have different effects on compressive strength of geopolymers even for an equivalent SO3 content. Geopolymer activated by anhydrite had an improvement in early-age strength, but not in long-term strength compared to one activated by gypsum [13]. However, no detailed study has been conducted in influences of both sulfate sources on alkali-activated GGBFS.
The use of calcium sulfates as an additive in GGBFS systems significantly impacts not only reaction products in terms of type, quantity, or rate of formation, but it also influences strength development in CaO-, Ca(OH)2-, or alkali-activated GGBFS binders [12,15,16,17] because it may influence the degree of GGBFS dissolution and it modifies sulfate-bearing reaction products, such as Al2O3-Fe2O3-tri (AFt) (e.g., ettringite) or Al2O3-Fe2O3-mono (AFm) (e.g., monosulfate, monocarboaluminate). In particular, the formation of ettringite may boost the early strength of cementitious binders.
There are three types of calcium sulfates: CaSO4 (anhydrite), CaSO4∙0.5H2O (hemihydrate), and CaSO4∙2H2O (gypsum) [18]. These calcium sulfates have different crystalline forms and thermodynamic stabilities. In particular, they show a significantly different solubility below 150 °C. At room temperature, the high solubility is in the order of hemihydrate, anhydrite, and gypsum [18]. As the concentration of sulfate ions often greatly affects the dissolution degree of raw GGBFS [15], the solubility of the sulfate source may play an important role in enhancing the strength of a cementitious binder [16]. Therefore, selection of the calcium sulfate type may be a key issue in the achievement of the desired strengths. However, we know little about the influence of CaSO4 type on GGBFS activations, or its possible dependence on different types of activation (e.g., CaO- vs. NaOH-activation).
In this study, the mixture proportions were designed to have different variables in (1) CaSO4 type [i.e., anhydrite (CaSO4) vs. gypsum (CaSO4∙2H2O)], (2) activator type (i.e., CaO vs. NaOH), and (3) GGBFS source (i.e., different steel manufacturers) in order to investigate their influence on the activation of GGBFSs. For the alkali-activators of GGBFS, we selected CaO and NaOH as the recently developed Ca-based additive and the classical Na-based one, respectively. Strength testing, X-ray diffraction (XRD), thermogravimetry (TG), and mercury intrusion porosimetry (MIP) analyses were performed. Based on the measured strengths, the analysis of variance (ANOVA) statistical test was conducted to determine the significance level of those factors mentioned above.

2. Materials and Experimental Program
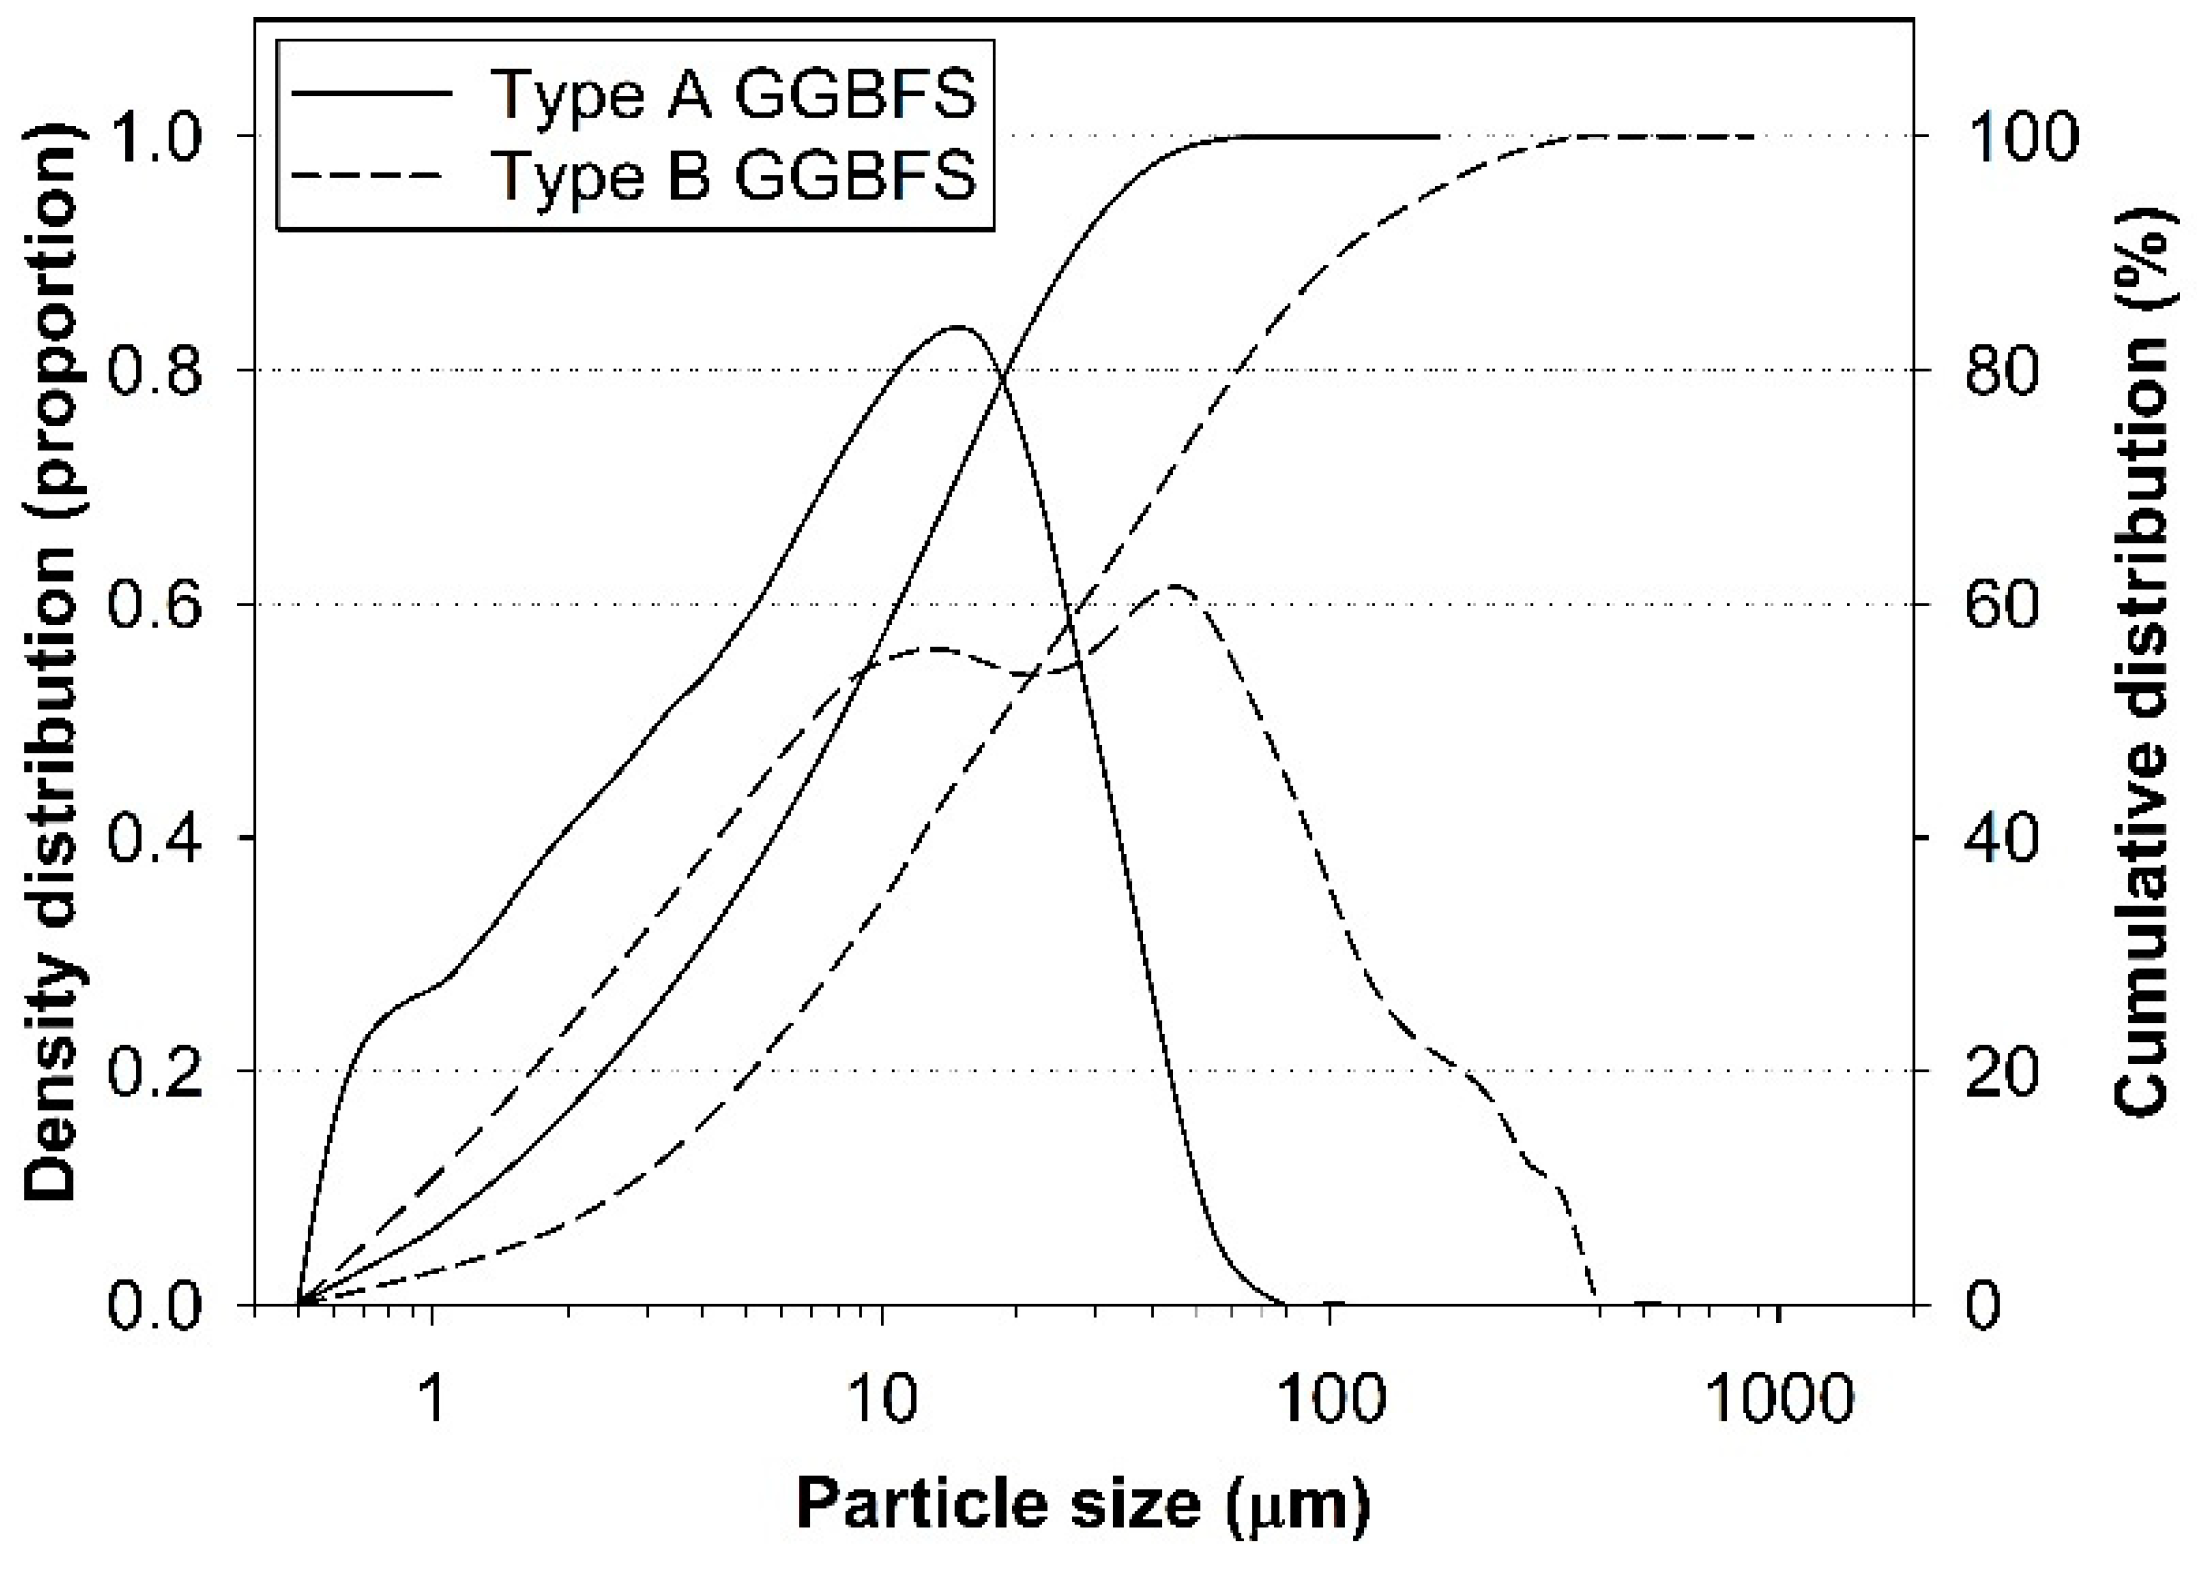
2.1. Materials

Two different raw GGBFS materials were obtained from two steel manufacturers, Pohang Iron and Steel Company (POSCO, Pohang, Korea) and Hyundai Steel Co., Ltd. (HSC, Dangjin, Korea). In the present study, these raw GGBFSs from POSCO and HSC will be noted as types A and B, respectively. These original GGBFSs did not contain any externally added calcium sulfate sources and had similar chemical compositions.
The oxide chemical compositions of the GGBFSs were determined by X-ray fluorescence (XRF) (S8 Tiger wavelength dispersive spectrometer; Bruker, Billerica, MA, USA) as shown in Table 1. Their (CaO + MgO + Al2O3)/SiO2 ratios were all higher than 1.6, which is a minimal criterion for GGBFS in many national standards [19,20]. Their Ca/Si and Al/Si ratios were similar to each other.
Crystallinity in the GGBFSs were examined using XRD (high-power X-ray diffractometer; Rigaku, Tokyo, Japan), and the results are displayed in Figure 1; type B had a weak reflection of akermanite (Ca2MgSi2O7), but its intensity was not significant, while type A consisted of only an amorphous phase.
Particle size distributions of the raw GGBFSs were examined using a laser scattering particle size analyzer (HELOS/RODOS H1433; Sympatec, Clausthal-Zellerfeld, Germany) as shown in Figure 2. The results showed that type B was coarser than type A. The Blaine fineness of type A and B was respectively 16,189.63 and 7310.36 cm2/g.
In summary, the raw GGBFSs were similar in terms of a chemical composition and a crystalline phase; however, they had different particle size distributions.

2.2. Sample Preparation

In the sample preparation, raw GGBFS powder, CaSO4 source, and activator were carefully dry-mixed for five minutes. Their mixed proportions and the sample labels are listed in Table 2, where the extra water in gypsum (CaSO4∙2H2O) was also counted in the calculation of water-to-solid ratio. Thus, the water-to-solid ratio was kept at 0.4 for all the samples. Analytical grade chemicals were used: CaO (Daejung Chemicals, Siheung-si, South Korea, 97%), NaOH (Sigma Aldrich, Saint Louis, MO, USA, 98%), anhydrite (Sigma Aldrich, 99%), and gypsum (Sigma Aldrich, 99%). After dry-mixing, deionized water was added to the mixture and then mixed for 5 min. NaOH in the form of pallets was dissolved in water first, and then mixed with other solids. For each mixture proportion, triplicate samples for strength testing were cast in cubic molds of 50 × 50 × 50 mm, and one cylindrical sample for the MIP test was prepared to a height of 25.4 mm and a 25.4 mm diameter. These samples were cured at 23 °C in 99% relative humidity until tested. After the strength tests, the fractured paste samples were finely ground for XRD and TG tests. The hydration process of these powdered samples was stopped by using a solvent-exchange method with isopropanol and vacuum drying for 24 h in order to remove any remaining solvent from the samples [21]. For the MIP test, the inner parts of the hardened cylindrical samples were cut into 5 mm cubic pieces, which were then immersed in isopropyl alcohol for four weeks with a solvent-sample volume ratio of 240:1. The solvent was continuously renewed. After the solvent exchange, the samples were vacuum-dried for two days to eliminate residual solvent from the samples prior to testing.

2.3. Tests

The compressive strength of all the hardened paste samples was measured using a universal testing machine (1500HDX; INSTRON, Norwood, MA, USA) at a loading rate of 0.4 mm/min. The XRD measurement was performed on powder samples using a high power X-ray diffractometer (D/MAX 2500 V/PC; Rigaku, Tokyo, Japan) with an incident beam of Cu-Kα radiation (λ = 1.5418 Å) and a 5° to 60° 2θ scanning range. The TG measurement was performed in a nitrogen gas environment on powdered samples at a temperature range from 30 °C to 1000 °C with a heating rate of 10 °C/min using a thermal analyzer (SDT Q600; TA instruments, New Castle, DE, USA). The MIP for examining pore size distributions of the hardened samples was conducted using a mercury porosimeter (AutoPore IV 9500; Micromeritics, Norcross, GA, USA), which was capable of pressure ranging from 0.0007 to 414 MPa (60,000 psi).

3. Results and Discussion

3.1. Strength Development
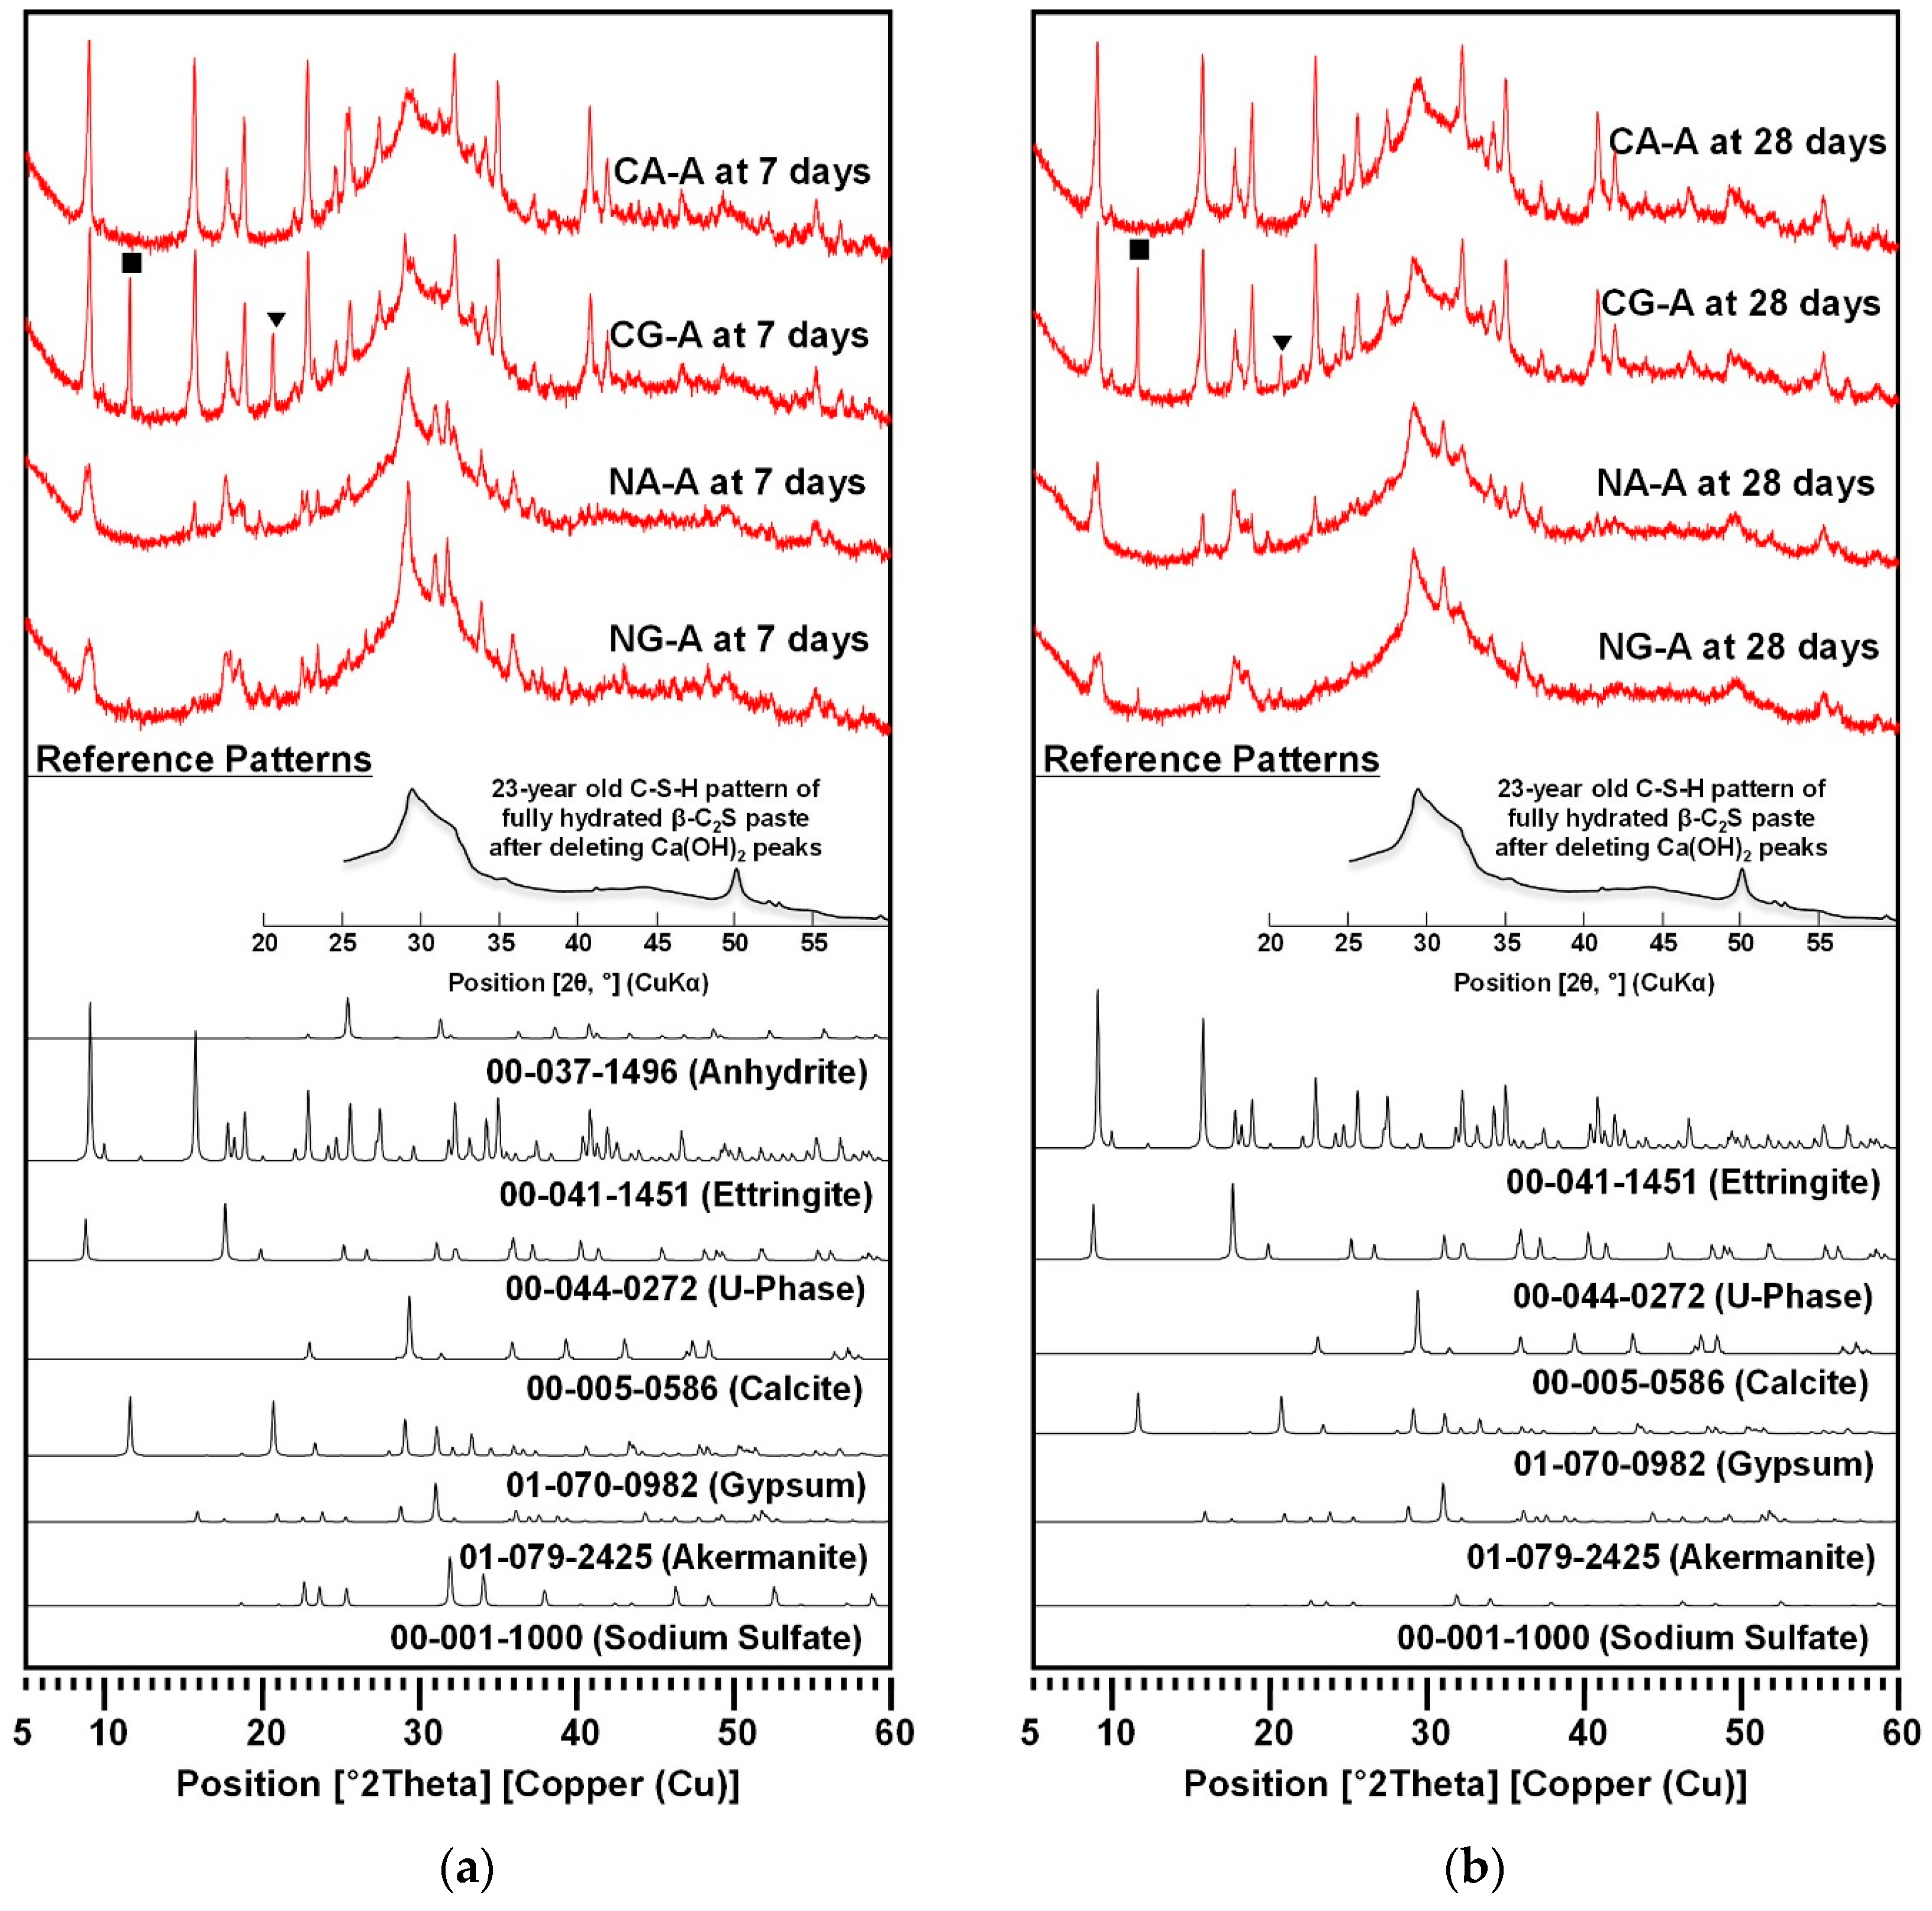
The strength test results are presented in Figure 3, and the detailed strength values are provided in Appendix A. As shown in Figure 3a,b, the CaO-activated GGBFS achieved a great strength increase from the addition of CaSO4 sources, regardless of the choice of different calcium sulfate type or GGBFS source; in particular, it produced a notable strength increase from day 7 to day 28. However, the NaOH-activated GGBFS showed its complicated dependency on the calcium sulfate type and the GGBFS source (see Figure 3c,d) as the strength development was largely affected. Thus, we performed the ANOVA test to quantitatively evaluate the significance level of each explanatory factor’s effect on the compressive strength of the samples as it was difficult to directly estimate the influential degrees of the experimental variables. In the analysis, the explanatory factors were the GGBFS source (i.e., type A vs. type B), activator type (i.e., CaO vs. NaOH), and CaSO4 type (i.e., anhydrite vs. gypsum). The calculations were carried out using the N-way ANOVA function implemented in MATLAB (version 2015a, Natick, MA, USA). The results are given in Table 3. In the ANOVA test, a smaller p-value represents a higher significance level of an explanatory factor.
The ANOVA results for the entire data showed that the activator type was the most significant (i.e., p = 0.00) on the strength development; this is consistent with the results in Figure 3, which showed that the strength development considerably changed depending on the activator type. Thus, the p-values were re-estimated individually for the groups of CaO- and NaOH-activated samples in terms of the sources of GGBFS and CaSO4 (see the separate data calculation in Table 3).
In the separate data calculation, the p-values for the GGBFS source were only slightly different between CaO- and NaOH activations (i.e., p = 0.50 in NaOH-activation and p = 0.52 in CaO-activation). This small difference in the p-values may look as if it lacks consistency with Figure 3c,d because, in these figures, the GGBFS source more significantly affected the 28-day strength in the NaOH-activation, unlike in the CaO-activation. However, a close inspection revealed the following observations: (1) when no externally added CaSO4 was present, the strength development barely depends on the slag type; (2) in Figure 3c,d where the use of anhydrite produced a higher strength than that of gypsum after 3 days; and (3) the only visible difference between Figure 3c,d was that the use of anhydrite improved the strength in GGBFS type A, while it decreased the strength in type B. Thus, the calculated p-value indicated the GGBFS source as not a significantly influential factor on the trend of strength development in the NaOH-activation.
The calcium sulfate type was highly influential on strength in the NaOH-activation (i.e., p = 0.02), while it was relatively insignificant in the CaO-activation (i.e., p = 0.49). Thus, when GGBFS is activated with NaOH, the calcium sulfate should be carefully selected to achieve a desired strength performance. Since the CaO activation is less-affected by both GGBFS source and CaSO4 type, it is more likely to be advantageous in quality-controlling of cementless binder production than the NaOH activation when a GGBFS is used as a binder precursor. Furthermore, the use of anhydrate seems to be a better choice than that of gypsum because it improved the strength, except the case of the NaOH-activated GGBFS type B.

3.2. XRD

The XRD patterns were collected for CA-A, CG-A, NA-A, and NG-A samples at 7 and 28 days as shown in Figure 4, and the phases detected from XRD were listed in Table 4. The XRD data was analyzed using X’Pert HighScore Plus [22] based on reference patterns of the International Center for Diffraction Data (ICDD) PDF-2 database [23]. To identify calcium silicate hydrate (C-S-H), the experimental pattern of 23-year-old C-S-H, measured by Mohan and Taylor [24], was referenced after eliminating the reflections of calcium hydroxide because the reference pattern of C-S-H in the database (i.e., PDF 033-0306) showed only three major peaks (d-spacing = 3.04, 2.79, and 1.82 Å) without amorphous characteristics.
All the samples produced a C-S-H phase; however, due to its amorphous nature, it was not possible to quantitatively compare the peak intensities of C-S-H in XRD with the samples in this study.
Ettringite [Ca6Al2(SO4)3(OH)12∙26H2O, AFt phase] also formed in all the samples. However, the CaO-activated samples produced significantly stronger ettringite peaks, unchanged after 7 days, than those of the NaOH-activated samples.
In the CaO-activation, CA-A showed weak reflections of unreacted anhydrite at 7 days, which disappeared at 28 days, while CG-A exhibited noticeable peaks of unreacted gypsum until 28 days. At 28 days, it might appear as though CG-A contained a large quantity of unreacted gypsum because of the strong intensity of the first peak (see ■ in Figure 4); note, however, that only the first peak was unusually strong when it was compared to that of the reference pattern of gypsum (i.e., PDF 01-070-0982), while the second peak (see ▼) was much reduced from day 7 to day 28. Thus, CG-A at 28 days did not contain a large portion of unreacted gypsum (more discussion will be made later in Section 3.4). Nonetheless, the result showed that anhydrite was significantly more consumed than gypsum in the CaO-activation.
In the NaOH-activation, NA-A and NG-A similarly showed complex phase compositions that consisted of U-phase (NaCa4Al2(SO4)1.5(OH)12·9H2O, AFm phase), Na2SO4, akermanite (Ca2MgSi2O7), and ettringite, except that NG-A showed a small portion of remaining gypsum. It is worth noting that Na2SO4 formed in both samples. In earlier studies [12,25,26], U-phase often formed when Na2SO4 was present in cementitious systems, and it competed with ettringite under lowered pH environments. Thus, in the NaOH-activation, due to the substantial formation of U-phase, the ettringite formation seemed to be suppressed. As the formation of ettringite generally contributes to strength evolution to some extent, the formation of more ettringite in CaO-activation may be the reason for the higher strengths of CaO-activated samples than in NaOH-activation.

3.3. TGA

The thermogravimetric analysis (TGA) results of 28-day cured samples are presented with derivative thermogravimetry (DTG) in Figure 5, where identified phases are labeled. The identified peaks were attributed to C-S-H [10,24,27], ettringite [16,24,27], calcite [27,28,29], gypsum [30], and U-phase [31,32,33], which were confirmed by the XRD results. The CA-A and CG-A samples showed notably strong peaks of ettringite, but the NA-A and NG-A samples barely exhibited these. The DTG peaks for U-phase appeared at two separate temperatures near 150 °C and 270 °C, which generally corresponded to dehydration of layered double hydroxides, such as hydrotalcite-like phases or AFm phases (e.g., U-phase).
The small hump between 100–150 °C in the DTG of CG-A was attributed to the water loss of gypsum, which corresponded to ~22 wt.% of gypsum weight [30]. Because the added weight of gypsum in the mixture proportion of CG-A was only ~5.7 wt.% and a large portion of the added gypsum was consumed, the DTG peak of the remaining portion of gypsum was also of very limited intensity, although the XRD result of CG-A at 28 days showed intermediate intensities of gypsum peaks. The NG-A sample also had small gypsum peaks in XRD, but a weight loss for gypsum was barely seen in DTG.
A higher weight loss from 0 °C to 600 °C in TGA in cementitious systems is generally related to a higher strength development because most of the major reaction products, such as C-S-H, AFt, AFm, and Ca(OH)2, are dehydrated within this temperature range [24]. With the CaO-activation, the use of calcium sulfate sources clearly increased the weight loss in that range; however, in the NaOH-activation, it barely increased (i.e., NA-A) or even decreased the weight loss (i.e., NG-A). This observation was consistent with the strength testing results.

3.4. MIP

Figure 6 presents the MIP results for the samples at 7 and 28 days. The suitability of the MIP measurement method has been questioned as a valid means of evaluating a real pore size distribution in cement-based systems mainly due to the bottle-neck effect and systematical misallocation of pore sizes [34]; thus, the direct comparison between different labeled samples (e.g., CA-A vs. NG-A) using the MIP result may not be appropriate, and it may show particular inconsistencies with the interpretation of the results of strength testing, XRD, or TGA/DTG. However, the MIP results remain valuable in the current study because they allow a relative comparison of pore size distribution in each mixture proportion between 7 and 28 days.
Figure 6 indicates that all the samples exhibited the reduction of total porosity and overall pore size with the progress of curing time, although the reduction degrees were much different from each other.
In the CaO-activation, the incorporations of both calcium sulfates (i.e., gypsum and anhydrite) produced similar effects on the pore size distributions; for instance, a large portion of pores in the range from 0.02 to 1 μm were produced in both samples with calcium sulfates (i.e., CA-A and CG-A) as shown in Figure 6a at 3 days, unlike the sample with no calcium sulfates (i.e., C-A), but these pores were significantly removed at 28 days, whereas the sample C-A showed no significant difference between 7 and 28 days in terms of total porosity and pore size. Thus, the use of calcium sulfates in CaO-activation was effective for reducing overall pore size and total porosity, and this would likely lead to the great strength increase from 7 to 28 days.
In the NaOH-activation, all the samples showed similar pore size distributions and porosity at each age, and thus the addition of calcium sulfates did not show any positive effect on the reduction of porosity and pore size. It is worth noting that the sample with gypsum (i.e., NG-A) showed the largest values of total porosity at all ages, and this should be related to the lowest strength development of NG-A and NG-B. Thus, the combination of NaOH and gypsum for activating GGBFS was found to be the least effective in this study.

4. Conclusions

This study investigated the influences of the CaSO4 type (i.e., anhydrite vs. gypsum) on strength development and hydration products in the activation of GGBFSs when different activators (i.e., CaO vs. NaOH) and GGBFS sources (i.e., different steel makers) were used. This study found that the combination of CaO and calcium sulfate sources is a more effective means of activating GGBFS than any other combinations in order to gain greater strength and better quality control, while the use of gypsum with NaOH-activation was found to be the worst mixture for strength. Detailed conclusions of the study are as follows:
(1)
The CaO-activated GGBFS achieved a great strength enhancement from the addition of CaSO4 sources, and the type of calcium sulfates and source of GGBFS did not significantly affect the strength development in this study, while the NaOH-activated GGFBS showed its complicated dependency on the choice of CaSO4 type and GGBFS source for strength development; thus, the use of CaO was found to be better than that of NaOH for quality control (meaning less change in strength by input parameters) when calcium sulfates were present in raw GGBFS.
(2)
In the ANOVA study, the influential degree of each variable for strength was found to be greater in the following order: activator type > CaSO4 type > GGBFS source; in particular, the type of calcium sulfate was highly influential in NaOH-activation, while it was relatively insignificant in CaO-activation.
(3)
When calcium sulfate sources were added, the NaOH-activated samples showed significantly complex phase composition of reaction products, while the CaO-activated ones exhibited a much simpler composition.
(4)
In the NaOH-activation, due to the substantial formation of U-phase, the ettringite formation seemed to be suppressed. As the formation of ettringite generally contributes to strength evolution to some extent, more formation of ettringite in CaO-activation may be the cause for the higher strength of CaO-activated samples than those of NaOH-activation.
(5)
The TGA results indicated that the use of calcium sulfate sources in the CaO-activation clearly increased the quantity of reaction products; however, in the NaOH-activation, this barely increased, or even reduced, the quantity of reaction products.
(6)
In the MIP results, in the CaO-activation, the use of calcium sulfates significantly reduced the pore size and the total porosity from 7 to 28 days, while, in the NaOH-activation, it showed almost no reducing effect on total porosity and pore size; even the use of gypsum increased the porosity.

Author Contributions

All the authors have contributed equally to the idea of the paper, performing the experiments, analyzing and discussing the experimental results, and preparing this manuscript.

Funding

This research was supported by a grant (18TBIP-C144132-01) from Technology Business Innovation Program funded by Ministry of Land, Infrastructure and Transport of Korean government, and Dr. Yoon’s stipend was supported by Korea Research Fellowship Program through the NRF, funded by the Ministry of Science, ICT & Future Planning (2015H1D3A1061913).

Conflicts of Interest

The authors declare no conflicts of interest.

Appendix A

In the appendix, the following values are provided because those can be useful to following researchers to remove repetitive tests performed in the present study.
-
Compressive strength: the measured values of all 144 samples are listed in Table A1.
Table A1. Compressive strength of all 144 samples.
ActivatorSource of CaSO4Curing (days)Type A GGBFSType B GGBFS
Sample 1 (MPa)Sample 2 (MPa)Sample 3 (MPa)Sample 1 (MPa)Sample 2 (MPa)Sample 3 (MPa)
None11.771.791.801.161.141.05
36.336.266.527.767.998.19
719.3717.3319.4217.1917.5118.31
2831.6629.5731.3030.1527.8529.09
CaOGypsum14.824.714.825.455.485.07
310.249.7810.1712.3411.7112.05
717.0317.4517.2519.1619.4019.86
2841.7244.6041.3945.2444.2246.62
Anhydrite14.964.844.503.473.403.51
311.8811.4212.3412.6913.8913.30
719.2518.1118.5617.1816.8017.55
2844.0744.3848.3445.9151.6151.10
None19.639.779.7711.0811.1511.05
313.3114.0213.8517.0416.4417.30
720.1819.0318.8422.8722.7322.87
2829.8430.0129.5633.5232.9334.02
NaOHGypsum16.096.275.604.574.354.45
312.3312.3912.8010.6311.1410.94
717.2617.5716.8814.2613.9113.48
2826.2925.7626.3520.9519.9421.80
Anhydrite13.563.503.602.482.452.39
319.2419.2019.2012.6811.7113.46
727.2427.0826.6019.1619.4019.86
2835.1629.7336.0726.7024.7122.25
-
ANOVA test: all calculated values of the factorial designs from ANOVA are listed in Table A2.
Table A2. Detailed calculations of the factorial designs from ANOVA.
DataExplanatory FactorSum F SquaresMean SquareF Statisticp-Value
Entire data calculationTime2.011.00229.020.00
Activator type0.740.74169.510.00
GGBFS type0.00230.00230.530.47
CaSO4 type0.00420.00420.950.33
Residual0.290.0044
Separate dataGroup of CaO-activationTime1.930.96287.020.00
GGBFS type0.00150.00150.440.52
CaSO4 type0.00160.00160.480.49
Residual0.100.0034
Group of NaOH-activationTime0.530.26523.870.00
GGBFS type0.000230.000230.470.50
CaSO4 type0.00290.00295.680.02
Residual0.0160.00050

References

  1. Flower, D.J.M.; Sanjayan, J.G. Greenhouse gas emissions due to concrete manufacture. Int. J. Life Cycle Assess. 2007, 12, 282–288. [Google Scholar] [CrossRef]
  2. Ali, M.; Saidur, R.; Hossain, M. A review on emission analysis in cement industries. Renew. Sustain. Energy Rev. 2011, 15, 2252–2261. [Google Scholar] [CrossRef]
  3. Pacheco-Torgal, F.; Castro-Gomes, J.; Jalali, S. Alkali-activated binders: A review: Part 1. Historical background, terminology, reaction mechanisms and hydration products. Constr. Build. Mater. 2008, 22, 1305–1314. [Google Scholar] [CrossRef] [Green Version]
  4. Pacheco-Torgal, F.; Castro-Gomes, J.; Jalali, S. Alkali-activated binders: A review. Part 2. About materials and binders manufacture. Constr. Build. Mater. 2008, 22, 1315–1322. [Google Scholar] [CrossRef] [Green Version]
  5. Oh, J.E.; Monteiro, P.J.; Jun, S.S.; Choi, S.; Clark, S.M. The evolution of strength and crystalline phases for alkali-activated ground blast furnace slag and fly ash-based geopolymers. Cem. Concr. Res. 2010, 40, 189–196. [Google Scholar] [CrossRef]
  6. Richardson, I.; Brough, A.; Groves, G.; Dobson, C. The characterization of hardened alkali-activated blast-furnace slag pastes and the nature of the calcium silicate hydrate (CSH) phase. Cem. Concr. Res. 1994, 24, 813–829. [Google Scholar] [CrossRef]
  7. Van Deventer, J.S.; Provis, J.L.; Duxson, P. Technical and commercial progress in the adoption of geopolymer cement. Miner. Eng. 2012, 29, 89–104. [Google Scholar] [CrossRef]
  8. Yang, K.-H.; Cho, A.-R.; Song, J.-K.; Nam, S.-H. Hydration products and strength development of calcium hydroxide-based alkali-activated slag mortars. Constr. Build. Mater. 2012, 29, 410–419. [Google Scholar] [CrossRef]
  9. Yang, K.-H.; Sim, J.-I.; Nam, S.-H. Enhancement of reactivity of calcium hydroxide-activated slag mortars by the addition of barium hydroxide. Constr. Build. Mater. 2010, 24, 241–251. [Google Scholar] [CrossRef]
  10. Kim, M.S.; Jun, Y.; Lee, C.; Oh, J.E. Use of CaO as an activator for producing a price-competitive non-cement structural binder using ground granulated blast furnace slag. Cem. Concr. Res. 2013, 54, 208–214. [Google Scholar] [CrossRef]
  11. Jeon, D.; Jun, Y.; Jeong, Y.; Oh, J.E. Microstructural and strength improvements through the use of Na2CO3 in a cementless Ca(OH)2-activated Class F fly ash system. Cem. Concr. Res. 2015, 67, 215–225. [Google Scholar] [CrossRef]
  12. Jeong, Y.; Oh, J.E.; Jun, Y.; Park, J.; Ha, J.-h.; Sohn, S.G. Influence of four additional activators on hydrated-lime [Ca(OH)2] activated ground granulated blast-furnace slag. Cem. Concr. Compos. 2016, 65, 1–10. [Google Scholar] [CrossRef]
  13. Poon, C.; Kou, S.; Lam, L.; Lin, Z. Activation of fly ash/cement systems using calcium sulfate anhydrite (CaSO4). Cem. Concr. Res. 2001, 31, 873–881. [Google Scholar] [CrossRef]
  14. Ma, W.; Liu, C.; Brown, P.W.; Komarneni, S. Pore structures of fly ashes activated by Ca(OH)2 and CaSO4· 2H2O. Cem. Concr. Res. 1995, 25, 417–425. [Google Scholar] [CrossRef]
  15. Park, H.; Jeong, Y.; Jeong, J.-H.; Oh, J.E. Strength Development and Hydration Behavior of Self-Activation of Commercial Ground Granulated Blast-Furnace Slag Mixed with Purified Water. Materials 2016, 9, 185. [Google Scholar] [CrossRef] [PubMed]
  16. Park, H.; Jeong, Y.; Jun, Y.; Jeong, J.-H.; Oh, J.E. Strength enhancement and pore-size refinement in clinker-free CaO-activated GGBFS systems through substitution with gypsum. Cem. Concr. Compos. 2016, 68, 57–65. [Google Scholar] [CrossRef]
  17. Chang, J.J.; Yeih, W.; Hung, C.C. Effects of gypsum and phosphoric acid on the properties of sodium silicate-based alkali-activated slag pastes. Cem. Concr. Compos. 2005, 27, 85–91. [Google Scholar] [CrossRef]
  18. Charola, A.E.; Pühringer, J.; Steiger, M. Gypsum: A review of its role in the deterioration of building materials. Environ. Geol. 2007, 52, 339–352. [Google Scholar] [CrossRef]
  19. Standards, B. BS EN 15167-1, Ground Granulated Blast Furnace Slag for Use in Concrete, Mortar and Grout—Part 1: Definitions, Specifications and Conformity Criteria; BSI Milton Keynes: Milton Keynes, UK, 2006. [Google Scholar]
  20. Starndards, K. KS F 2563, Ground Granulated Blast-Furnace Slag for Use in Concrete; British Standards Institution: London, UK, 2009. [Google Scholar]
  21. Zhang, J.; Scherer, G.W. Comparison of methods for arresting hydration of cement. Cem. Concr. Res. 2011, 41, 1024–1036. [Google Scholar] [CrossRef]
  22. PANalytical. X’Pert HighScore Plus Software; PANalytical: Almelo, The Netherlands, 2012. [Google Scholar]
  23. ICDD. International Centre for Diffraction Data; International Centre for Diffraction Data: Newtown Square, PA, USA, 2000. [Google Scholar]
  24. Taylor, H.F.W. Cement Chemistry; Thomas Telford: London, UK, 1997. [Google Scholar]
  25. Li, G.; Le Bescop, P.; Moranville, M. The U phase formation in cement-based systems containing high amounts of Na2SO4. Cem. Concr. Res. 1996, 26, 27–33. [Google Scholar] [CrossRef]
  26. Sánchez-Herrero, M.J.; Fernández-Jiménez, A.; Palomo, A.; Viehland, D. Alkaline Hydration of Tricalcium Aluminate. J. Am. Ceram. Soc. 2012, 95, 3317–3324. [Google Scholar] [CrossRef]
  27. Jeong, Y.; Park, H.; Jun, Y.; Jeong, J.-H.; Oh, J.E. Microstructural verification of the strength performance of ternary blended cement systems with high volumes of fly ash and GGBFS. Constr. Build. Mater. 2015, 95, 96–107. [Google Scholar] [CrossRef]
  28. Chaunsali, P.; Peethamparan, S. Evolution of strength, microstructure and mineralogical composition of a CKD–GGBFS binder. Cem. Concr. Res. 2011, 41, 197–208. [Google Scholar] [CrossRef]
  29. Dweck, J.; Melchert, M.; Viana, M.; Cartledge, F.; Büchler, P. Importance of quantitative thermogravimetry on initial cement mass basis to evaluate the hydration of cement pastes and mortars. J. Therm. Anal. Calorim. 2013, 113, 1481–1490. [Google Scholar] [CrossRef]
  30. Vassileva, C.G.; Vassilev, S.V. Behaviour of inorganic matter during heating of Bulgarian coals: 1. Lignites. Fuel Process. Technol. 2005, 86, 1297–1333. [Google Scholar] [CrossRef]
  31. Gruskovnjak, A.; Lothenbach, B.; Holzer, L.; Figi, R.; Winnefeld, F. Hydration of alkali-activated slag: comparison with ordinary Portland cement. Adv. Cem. Res. 2006, 18, 119–128. [Google Scholar] [CrossRef]
  32. Kanezaki, E. Thermal behavior of the hydrotalcite-like layered structure of Mg and Al-layered double hydroxides with interlayer carbonate by means of in situ powder HTXRD and DTA/TG. Solid State Ionics 1998, 106, 279–284. [Google Scholar] [CrossRef]
  33. Haha, M.B.; Lothenbach, B.; Le Saout, G.; Winnefeld, F. Influence of slag chemistry on the hydration of alkali-activated blast-furnace slag—Part I: Effect of MgO. Cem. Concr. Res. 2011, 41, 955–963. [Google Scholar] [CrossRef]
  34. Diamond, S. Mercury porosimetry: an inappropriate method for the measurement of pore size distributions in cement-based materials. Cem. Concr. Res. 2000, 30, 1517–1525. [Google Scholar] [CrossRef]
Figure 1. Powder XRD (X-ray diffraction) of the raw GGBFSs (ground granulated blast-furnace slags): the weak crystalline peak in the type B GGBFS is akermanite.
Applsci 08 02500 g001
Figure 2. Particle size distributions of the raw GGBFS materials.
Applsci 08 02500 g002
Figure 3. Compressive strength development of hardened paste samples with/without calcium sulfates: (a) CaO-activated type A GGBFSs, (b) CaO-activated type B GGBFSs, (c) NaOH-activated type A GGBFSs, and (d) NaOH-activated type B GGBFSs.
Applsci 08 02500 g003
Figure 4. XRD patterns at (a) 7 days and (b) 28 days. The symbols ■ and ▼ indicate the first and the second peak of remaining gypsum at 28 days, respectively; XRD peaks of akermanite: 28.934 [23.1%], 30.150 [100%].
Applsci 08 02500 g004
Figure 5. TGA and derivative thermogravimetry (DTG) results at 28 days; (a) effect of calcium sulfate type under CaO-activation, (b) effect of calcium sulfate type under NaOH-activation, (c) effect of activator type when anhydrite was present, and (d) effect of activator type when gypsum was present. *: Weight loss possibly related to glass of GGBFS.
Applsci 08 02500 g005
Figure 6. Pore size distributions from MIP: (a) effect of calcium sulfate type under CaO-activation, (b) effect of calcium sulfate type under NaOH-activation, (c) effect of activator type without calcium sulfates, (d) effect of activator type with anhydrite, and (e) effect of activator type with gypsum.
Applsci 08 02500 g006
Table 1. Chemical compositions of raw ground granulated blast-furnace slag (GGBFS) materials.
GGBFSOxide (wt.%)Atomic Ratio
CaOSiO2Al2O3MgOSO3TiO2K2OFe2O3Ca/SiAl/Si
Type A44.6%34.4%13.8%3.7%1.4%0.6%0.5%0.4%1.30.4
Type B44.2%34.3%14.3%3.3%1.4%0.7%0.6%0.5%1.30.4
Table 2. Mixture proportions of prepared paste samples in wt.% and conducted tests.
Data GroupSample LabelActivator TypeGGBFS SourceCaSO4 TypeWaterTests
CaONaOHType AType BAnhydriteGypsumSXTM
CaO-activationC-A5-95---40
C-B5--95--40
CA-A5-90-5-40
CA-B5--905-40
CG-A5-90--5.739.3
CG-B5--90-5.739.3
NaOH-activationN-A-595---40
N-B-5-95--40
NA-A-590-5-40
NA-B-5-905-40
NG-A-590--5.739.3
NG-B-5-90-5.739.3
Note: S: compressive strength test; X: X-ray diffraction (XRD), T: thermogravimetry (TG); M: mercury intrusion porosimetry (MIP); ●: test conducted. Strength tests were conducted at 1, 3, 7, and 28 days; XRD was taken at 7 and 28 days; TG was performed at 28 days, and MIP was conducted at 7 and 28 days. The same wt.% of CaSO4 is contained in 5.00% of anhydrite and 5.70% of gypsum.
Table 3. Calculated significance levels (p-values) of the explanatory factors from the factorial design using ANOVA.
Explanatory FactorEntire Data CalculationSeparate Data Calculation
Group of CaO-ActivationGroup of NaOH-Activation
Activator type (CaO vs. NaOH)0.00--
GGBFS source (type A vs. B)0.470.520.50
CaSO4 type (anhydrite vs. gypsum)0.330.490.02
Table 4. Identified phases with relative intensities in XRD for hardened samples.
PhaseCaO-ActivationNaOH-Activation
CA-ACG-ANA-ANG-A
7-Day28-Day7-Day28-Day7-Day28-Day7-Day28-Day
C-S-HC-S-H formed in all the samples, but the relative comparison of the peak intensities was not possible among samples because C-S-H is semi-amorphous.
Ettringite●●●●●●●●●●●●●●●●●●●●
Gypsum--●●●●●--
Anhydrite-------
U-phase----●●●●●●●●
Calcite● or -● or -● or -● or -●●●●●●
Sodium sulfate----●●● or -●●● or -
Akermanite----● or -● or -● or -● or -
Note: ●●●●: very strong; ●●●: strong; ●●: intermediate; ●: weak, -: no formation.

