1. Introduction
The golf swing is a whole-body multidimensional movement requiring the interaction between golfer and club to strike the golf ball a certain distance and direction towards a target. Golf biomechanics studies strive to explain differences in clubhead–ball impact parameters, which ultimately determine shot distance and direction, based on the analysis of golfers movement patterns [
1]. Golfers, however, show inter-individual differences in their movement patterns even for similar clubhead–ball impact parameters [
2]. The recommendation for future studies is that data analysis methods must provide interpretation and understanding of this individualized, multidimensional movement [
3]. Analysis methods that can provide this type of interpretation are of interest to include in analysis systems aimed at providing quantitative feedback to coaches about the golfer’s technique which help inform personalised coaching interventions for performance enhancement or injury prevention.
A key stage of biomechanics analysis is to describe the salient patterns of a sporting movement [
4]. Salient patterns in the golf swing are often referred to during phases of the swing, called the backswing, the downswing, and the follow-through, which are typically defined between the events takeaway to the top of the backswing, top of the backswing to impact, and impact to the end of the swing, respectively. Body rotation, typically described as axial rotation of the central body segments, is commonly investigated in golf biomechanics research based on coaches’ insights [
5] and regression analysis [
1] linking rotation to overall driving distance. Discrete body rotation measures, such as the magnitude of pelvis and thorax axial rotation, the rate of change in pelvis and thorax axial displacement (i.e., axial rotation velocity), and the separation between pelvis and thorax axial rotation at top of the backswing or impact have been linked to clubhead and ball velocity, which are two important impact parameters determining overall driving distance [
6,
7]. The choice of discrete measures in body rotation are often pre-defined by the researcher which raises the question of whether these are the key axial rotation features that distinguish golfers techniques. Data analysis methods, such as principal component analysis (PCA), can alleviate this limitation and could be used to identify the key movement patterns in axial rotation variables across the whole time-series.
Principal component analysis has successfully identified distinct movement patterns in golfers centre of pressure, centre of gravity [
2], and ground reaction force time-series data [
8]. Graphical representation of PCA results highlighted differences between groups of golfers (i.e., amateurs and professionals) and between individual golfers. Notably, the linear relationship between the first principal components of medial-lateral centre of pressure and centre of gravity patterns identified extremes of movement in golfers (i.e., back foot style and front foot style) and was a proposed indicator of how golfers achieved dynamic balance, either with more lateral or rotational body movements [
2]. Similarly, in baseball, hitters who aligned centre of pressure and centre of gravity evenly between their feet near impact emphasised rotational body movements which facilitated pelvis rotational acceleration [
9]. The relationships between biomechanics variables and their ability to explain impact parameters are often explored using correlation or linear regression analysis methods that assume a change in outcome is directly proportional to the change in input. Human movement, however, has been described as non-linear and there is a recognized need for non-linear data analysis to study relationships in complex human movement [
10].
Multiple correspondence analysis (MCA), the correspondence analysis of multivariate data, can be used to identify non-linear relationships in data. As with PCA, graphical visualization of MCA results can show the association and strength of the association within a set of variables (e.g., biomechanics variables) [
11,
12]. A prerequisite of using MCA on discrete biomechanics variables is the need to fuzzy code the biomechanics variables so that the data can be transformed into categorical variables ready for this analysis. Multiple correspondence analysis has then been applied to fuzzy coded biomechanics data to help explain multi-dimensional, non-parametric and descriptive properties of gait patterns in abnormal and normal gait [
13,
14]. Given the multidimensional and potentially non-linear relationships in golfer biomechanics data, it is anticipated that MCA could provide interesting insights into the association between biomechanics variables (i.e., pelvis and thorax axial rotation, centre of pressure, centre of gravity) and their relationship to clubhead–ball impact parameters (e.g., clubhead velocity and ball velocity). The proposed benefit of a combined PCA, fuzzy coding and MCA approach are that a high dimensional biomechanics dataset can be drastically reduced whilst retaining a large proportion of the explained variance in golfers’ movement patterns. Firstly, PCs can capture key movement patterns (variances) in individual biomechanics variables wherever they occur during the swing. Fuzzy coding can then convert any type of data into categorical variables allowing varying types of data to be analysed using MCA. Multiple correspondence analysis can then identify associations within key movement patterns. These associations can then be visualised alongside impact measures (such as clubhead and ball velocity) in a scatterplot for easy identification of mismatched movement patterns.
The purpose of this study was to use a combined PCA, fuzzy coding and MCA data analysis approach to visualise associations within key biomechanics movement patterns and impact parameters in a group of low handicap golfers. Specifically, this data analysis approach was used to visualise associations between key movement patterns in thorax and pelvis axial rotation, centre of pressure and centre of gravity and clubhead–ball impact parameters, clubhead and ball velocity in a group of low handicap golfers. The outcomes of this analysis method are of interest for biomechanics analysis systems aimed at providing quantitative feedback to coaches about the golfer’s technique to help inform personalised coaching interventions for performance enhancement or injury prevention.
2. Methods
2.1. Participants
Twenty-two right-handed low-handicap golfers (handicap range +3 to 4; age = 26 ± 7 years; height = 179.5 ± 7.3 cm; mass = 79.4 ± 13.1 kg) gave their informed consent to take part in the study. Ethical clearance was obtained from the University Ethical Advisory Committee which was in accordance with ethical standards and principles of the 1964 Helsinki declaration.
2.2. Data Collection
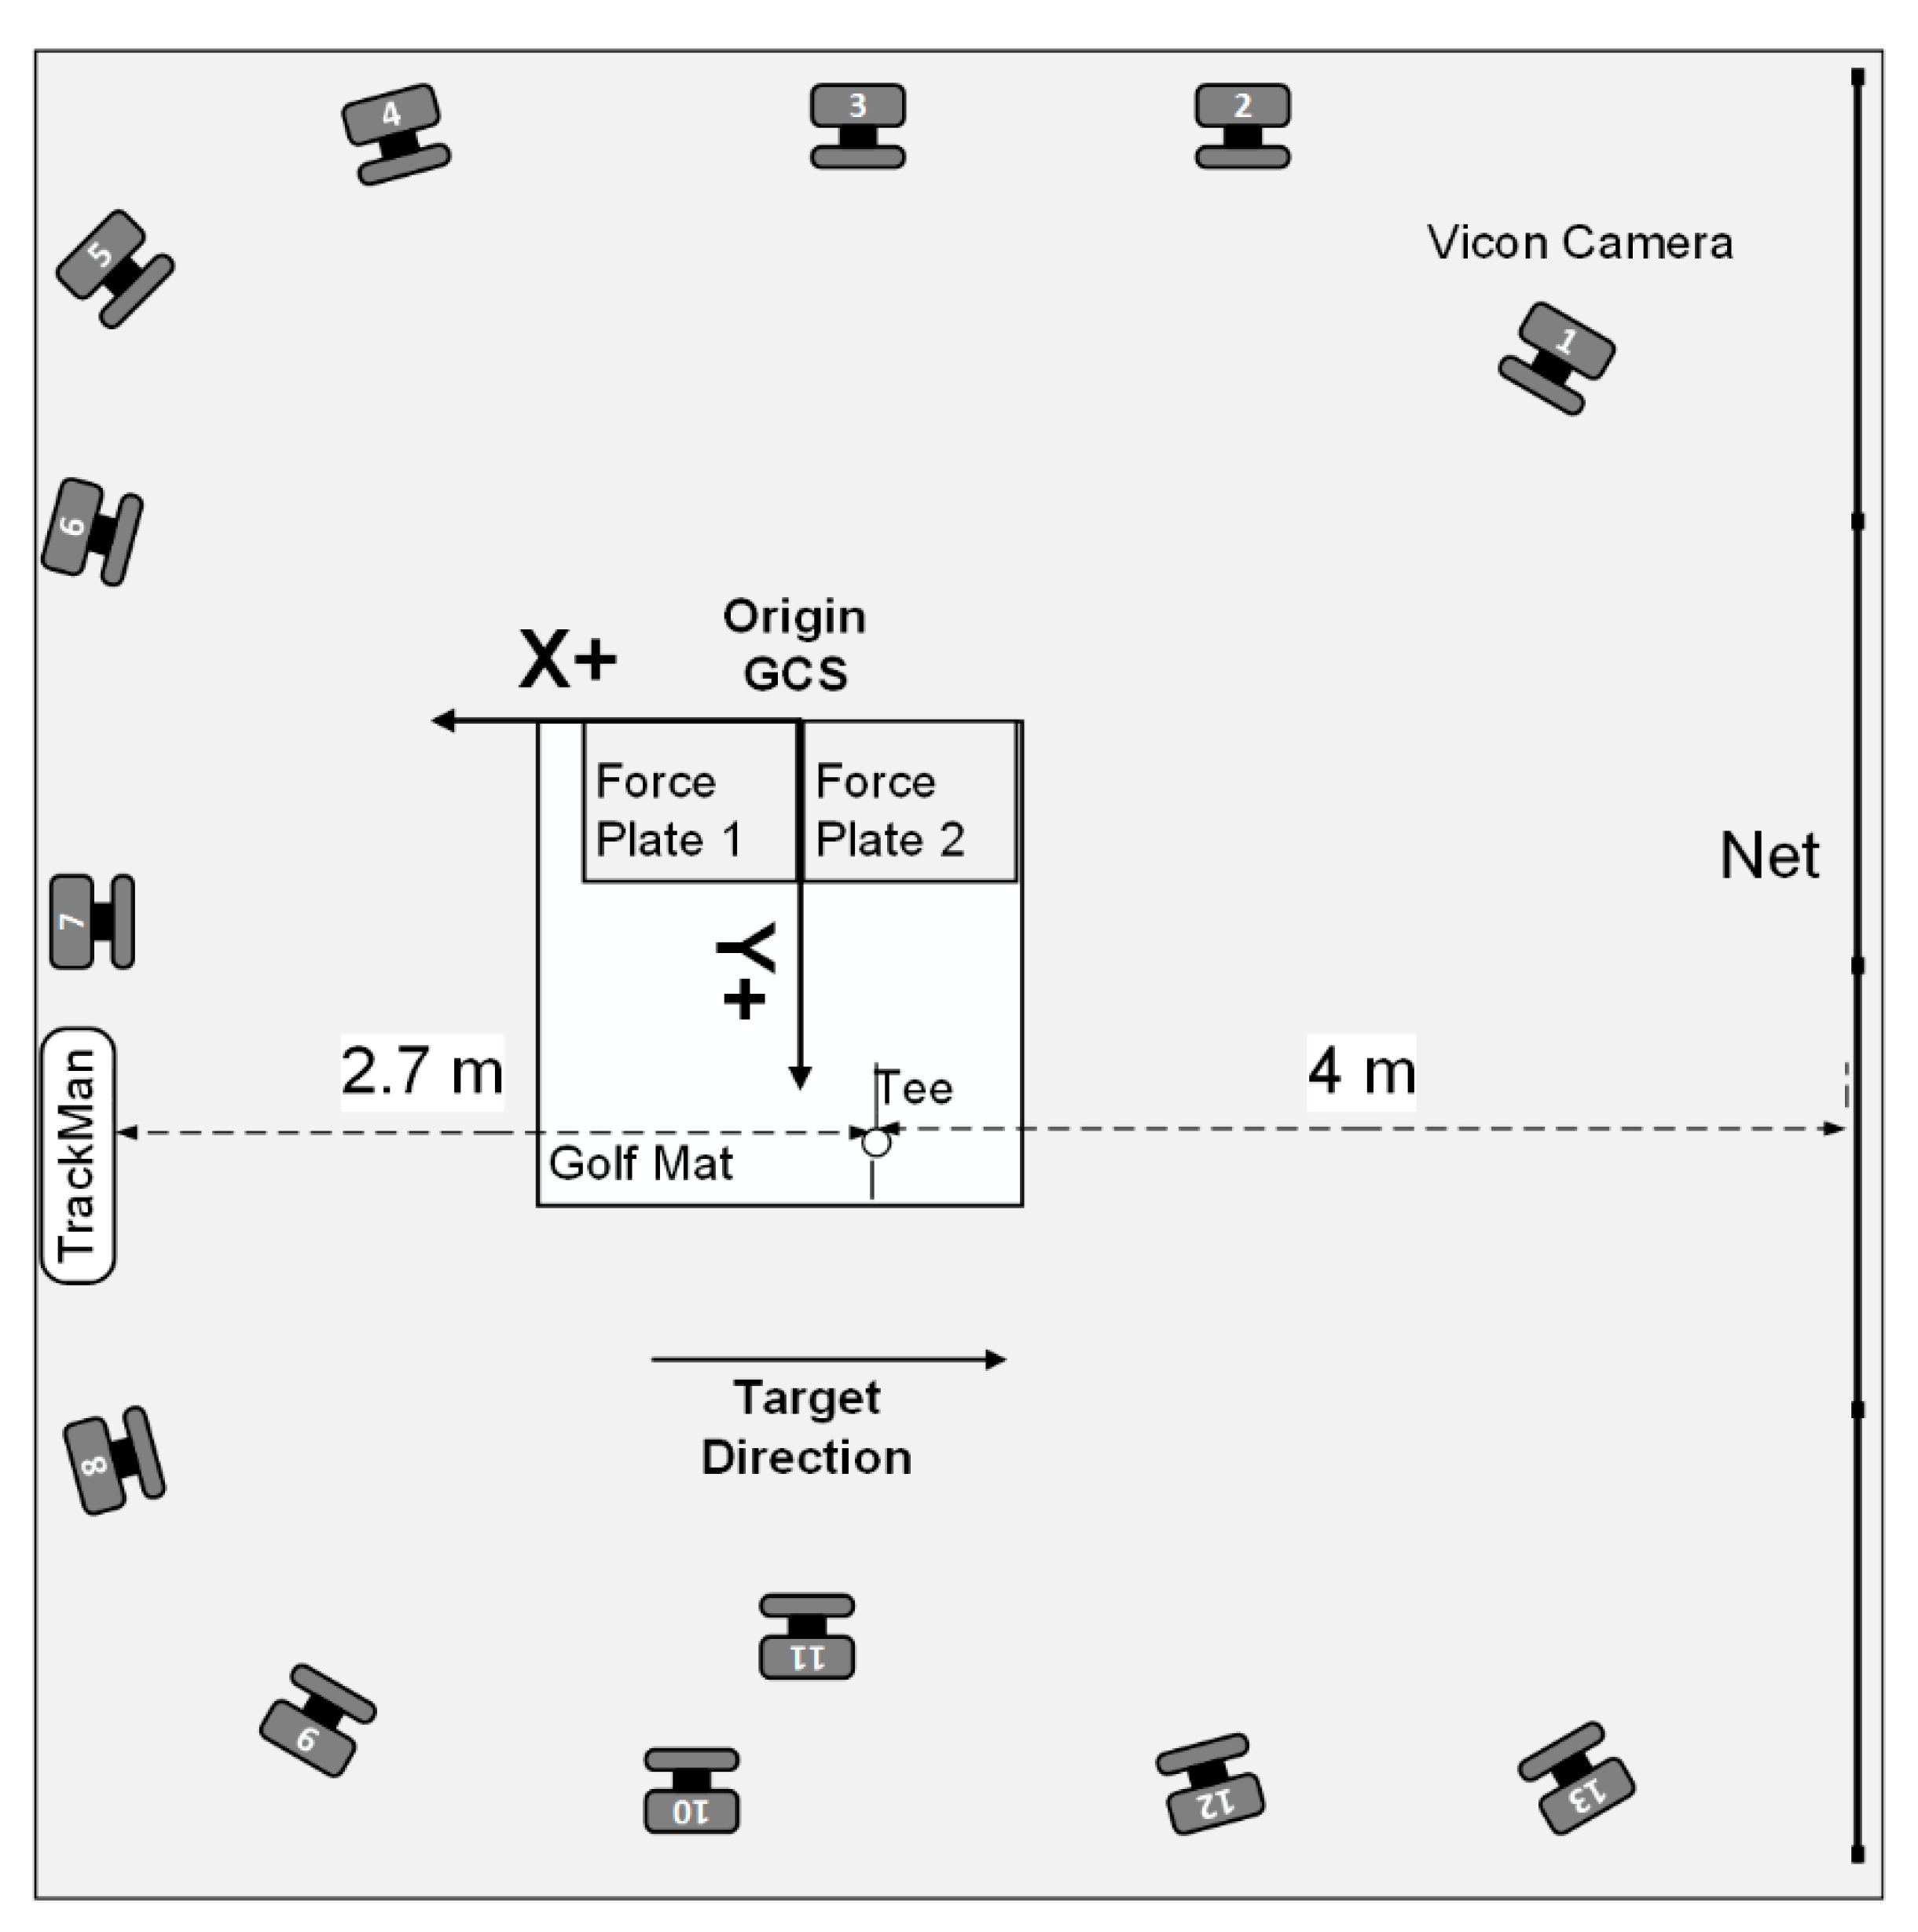
A 13-camera Vicon Nexus Motion Analysis System (Oxford Metrics Ltd., Oxford, UK) captured three-dimensional marker trajectories at 250 Hz in an indoor laboratory (
Figure 1). The global co-ordinate system origin (0, 0, 0) was at ground level in the middle of the capture volume. The positive global co-ordinate system axes were defined from the origin, with the
X-axis parallel to the target line but directed away from the target, the
Y-axis directed anteriorly and the
Z-axis directed vertically upwards.
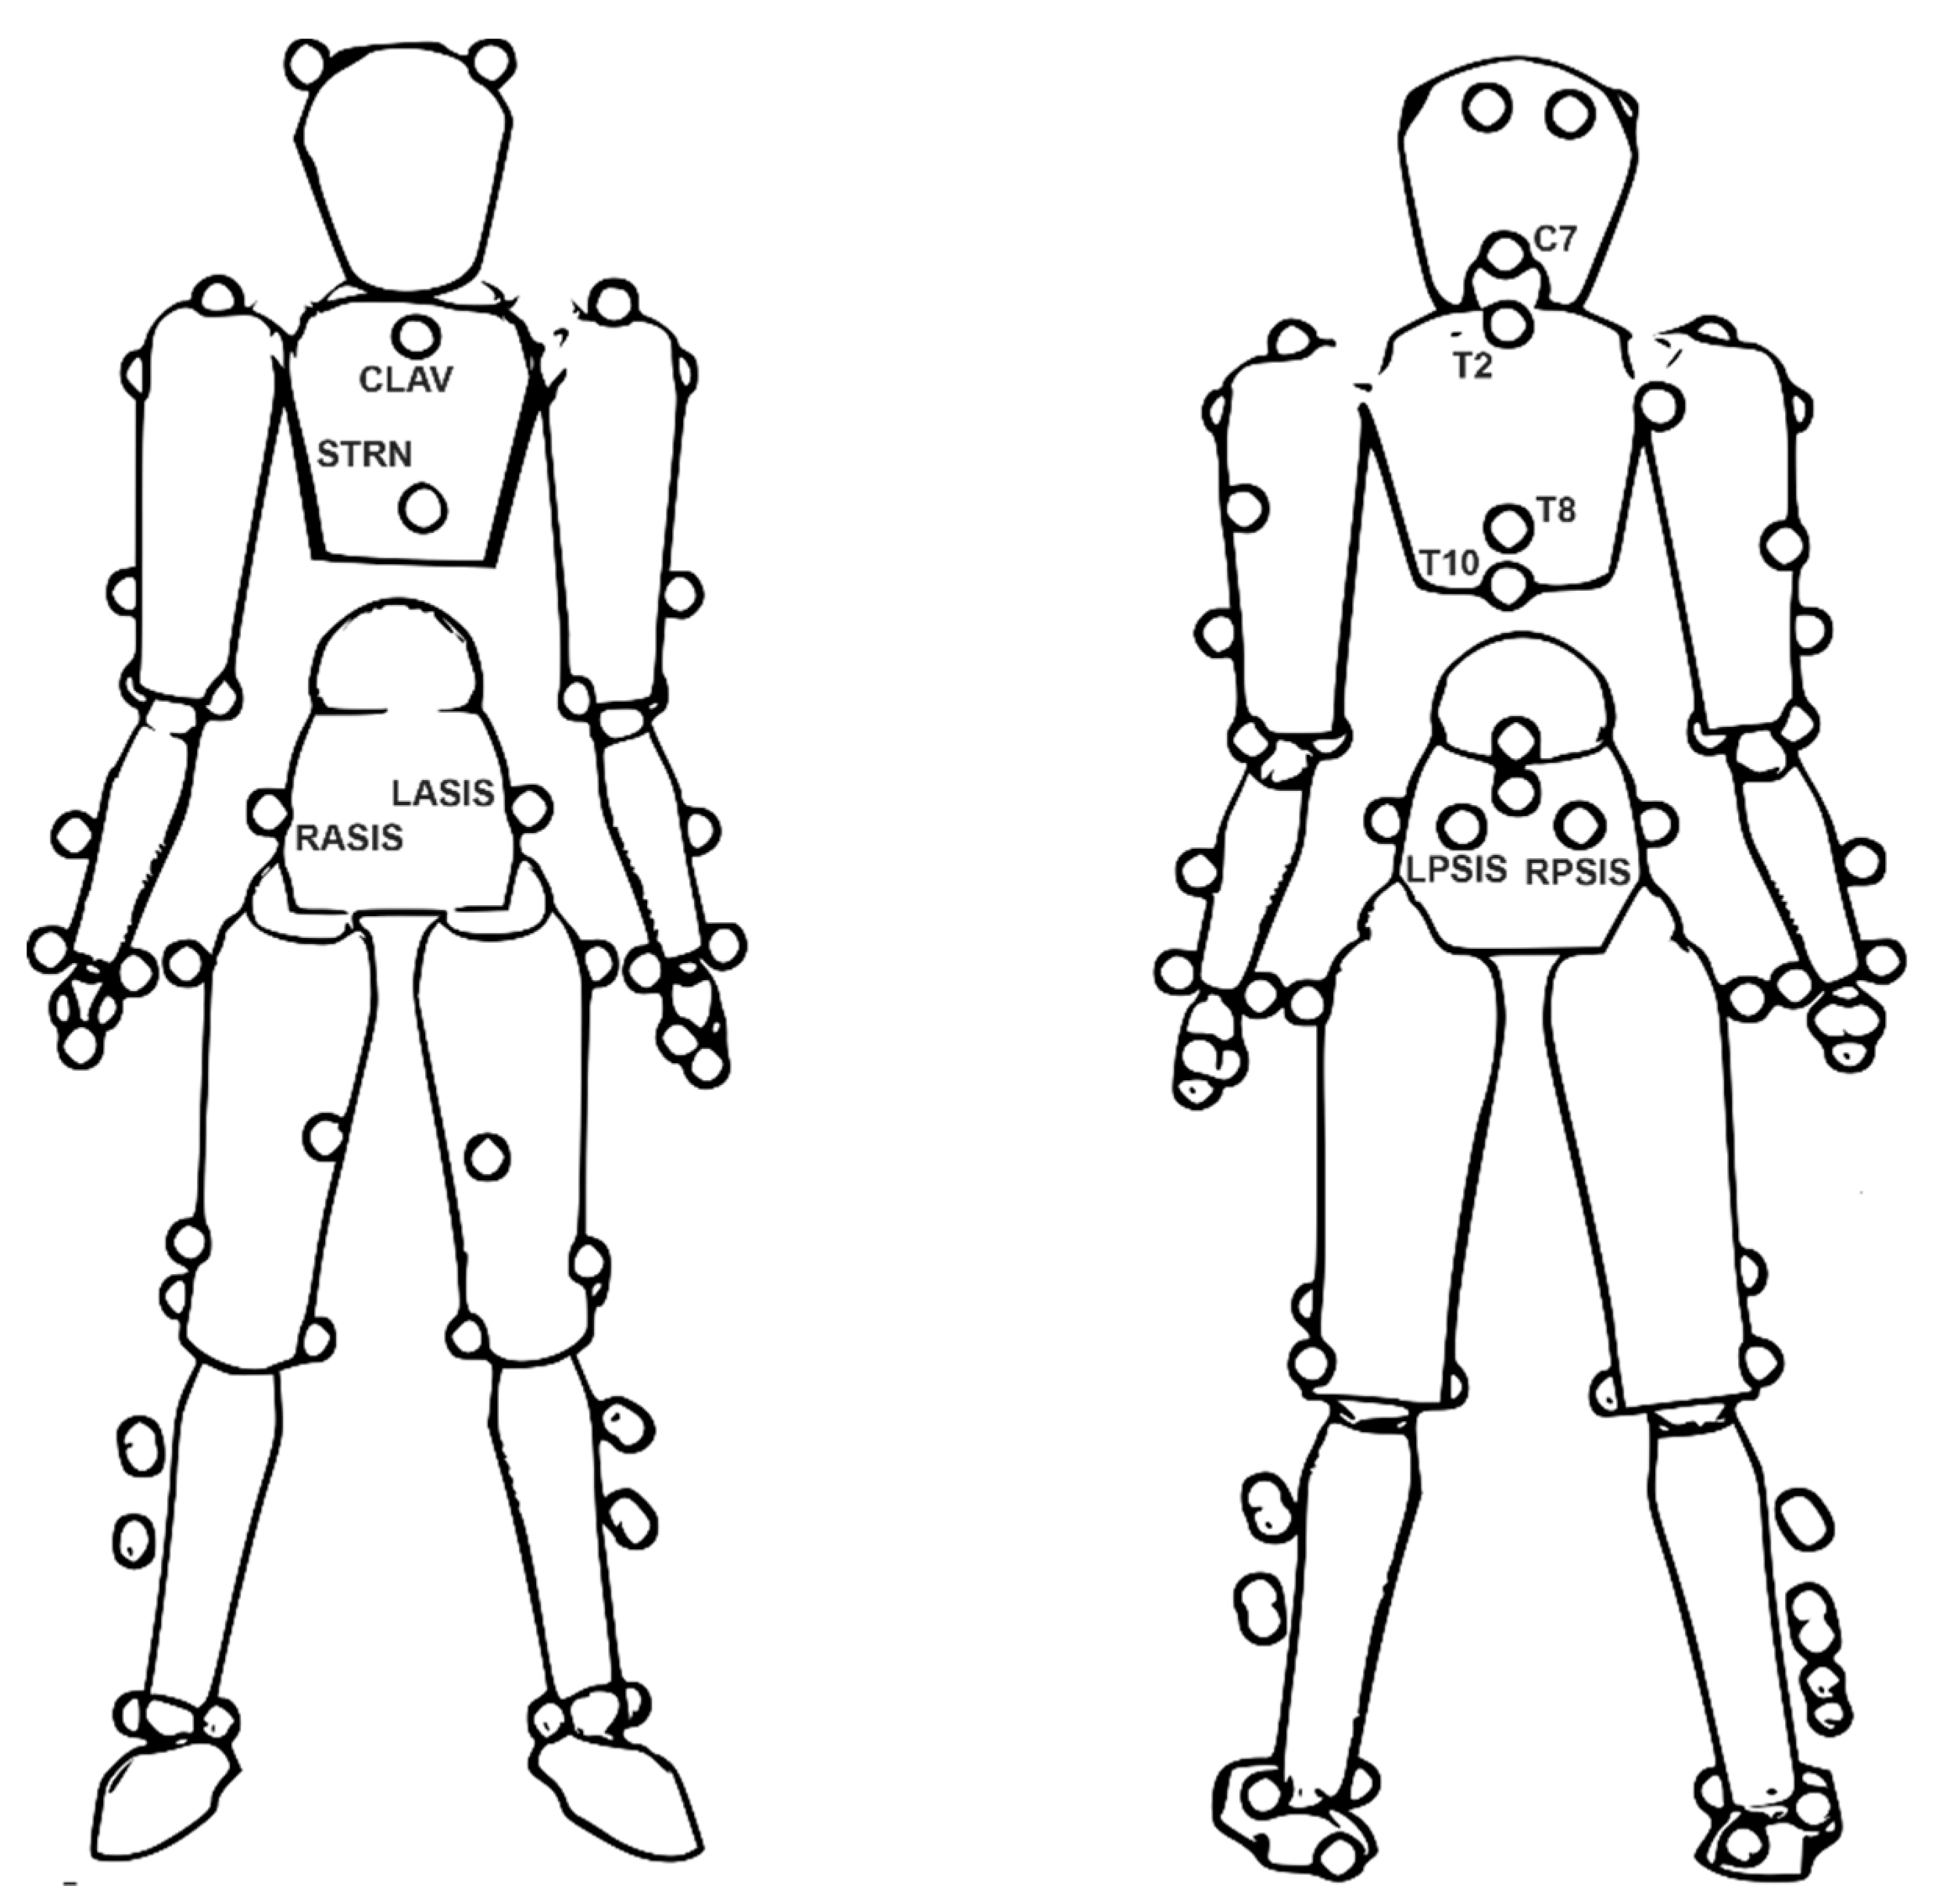
Sixty-three 14-mm diameter retro-reflective markers were attached to the golfer at anatomical locations and four markers were placed on the golfer’s own driver. Notably, the pelvis segment was defined and tracked using markers attached to the left and right anterior-superior iliac spine and left and right posterior-superior iliac spine (LASIS, LPSIS, RASIS, RPSIS). The thorax was tracked using markers attached to the 7th cervical vertebrae (C7), clavicular notch (CLAV), xiphoid process (STRN), 2nd, 8th, and 10th thoracic vertebrae (T2, T8, T10) (
Figure 2).
Markers were attached to the club at the toe, hosel, below the grip and approximately 50% the distance between the hosel and toe marker. The instant of impact was identified based on the tracking of retro-reflective tape attached to the golf ball. A launch monitor (TrackMan IIIe, ISG Company, Vedbæk, Denmark) was used to measure the clubhead–ball impact parameters, clubhead velocity (defined by TrackMan as the linear speed of the clubhead’s centre of gravity at first contact with the golf ball) and ball velocity (defined by TrackMan as the speed of the golf ball’s centre of gravity immediately after separation from the club face). An independent study of TrackMan accuracy reported clubhead velocity values of 0.49 m·s
−1 and ball velocity of 0.09 m·s
−1 [
15]. The launch monitor was positioned three metres in the global co-ordinate system
X-axis direction away from the ball on the target line at the same height as the golf mat. A reflective dot was placed on the golf ball facing towards the launch monitor in accordance with the manufacturer’s instructions.
Golfers used their own driver, golf shoes and glove but used the same brand golf ball (ProV1, Titelist, Fairhaven, MA, USA). The golfers were asked to hit from the golf mat into a net positioned approximately four metres away; a vertical line was placed on the net to provide a target line. After each golfer had performed their own warm up, golfers were instructed to address the ball in their normal stance position and to hit a full shot as accurately as possible (i.e., towards the target) with their driver. The golfer then performed ten shots with their driver, with a one-minute rest between shots. Following each shot, the golfer gave a subjective rating of shot quality on a 10-point scale (1–10) where the highest rating was considered representative of their best shot.
2.3. Data Analysis
Marker positions were labelled using a Vicon Nexus (Oxford Metrics Ltd., Oxford, UK) and post-processing which included filtering marker positional data and model building were carried out in Visual3D (C-Motion, Germantown, MD, USA). Marker trajectories were filtered using a fourth order zero-lag Butterworth low-pass filter with a cut-off frequency of 15 Hz. Five trials per golfer were selected for analysis based on the quality of data and a high subjective rating of shot quality, similar to the criteria proposed by Wheat et al. [
16].
A seventeen-segment golfer model was defined. Notably, the origin of the pelvis local co-ordinate system was midway between right and left anterior-superior iliac spine markers. The origin of the thorax local co-ordinate system was defined mid-way between iliac crest landmarks which were created based on the pelvis segment definition. The local co-ordinate systems for pelvis and thorax were based on a right-handed orthogonal system with
X-axis medial-lateral,
Y-axis anterior-posterior, and
Z-axis superior-inferior. A complete list of computed variables were thorax axial rotation, pelvis axial rotation, medial-lateral centre of pressure and medial-lateral centre of gravity. Thorax and pelvis axial rotation angles were computed relative to the lab global co-ordinate system using the
YXZ Cardan rotation order. Positive angles represented thorax and pelvis internal axial rotation (i.e., anti-clockwise rotation towards the target direction). Whole body centre of gravity, was estimated as the weighted sum of individual segments in accordance with Dempster’s regression equations and the Hanavan model [
17] as detailed in Smith et al. [
2]. Force plate co-ordinate systems were transformed into the laboratory global co-ordinate system and centre of pressure between the feet was computed from combining both force plates. The centre of pressure and centre of gravity projected onto the laboratory floor global horizontal plane, were defined along the
X-axis (medial-lateral (ML)) of the global co-ordinate system. Medial-lateral centre of pressure (COP
ML) and centre of gravity (COG
ML) were defined as a percentage of the distance between the
X-coordinates of the mid-point of the front (0%) and back (100%) foot at set-up (i.e., one frame before takeaway).
All biomechanics data were time normalised between takeaway (TA) and top of the backswing (TB), TB to impact (IMP) and IMP to mid follow through (MDFT) in MATLAB (The Mathworks, Inc., Natick, MA, USA) using the piecewise linear length normalisation technique [
18]. The key events were defined based on the following thresholds: TA when the
x-component of velocity of the clubhead heel marker first increased above 0.2 m·s
−1; TB when the
x-component of velocity of the clubhead heel marker changed from negative to positive; IMP as the frame where ball
x-position first changed; and MDFT when the club shaft was parallel to the global
X-axis after IMP.
2.4. Statistical Analysis
Statistical analysis was completed using MATLAB and R (R Foundation for Statistical Computing, Vienna, Austria). The following stages of statistical analysis were performed: (i) principal component analysis of thorax axial rotation, pelvis axial rotation, COPML and COGML variables, (ii) fuzzy coding of retained principal components, clubhead velocity and ball velocity using a triangular fuzzy window coding system and, finally, (iii) multiple correspondence analysis of fuzzy-coded biomechanics variables with clubhead and ball velocity as supplementary points.
In the first stage, a PCA was performed. For each golfer and variable, an n × p data matrix was formed where n was the number of trials (n = 5) and p each normalised time point throughout the swing (p = 501) ready for PCA. Matrices for each golfer were vertically concatenated to form a single 110 × 501 data matrix representing all the golfers’ data for a given variable. The MATLAB function ‘pca’ was used to perform independent PCA on axial rotation variables, centre of pressure, and centre of gravity variables whereby data was normalised to have a mean of zero and then the singular value decomposition (SVD) algorithm used. Results of principal component analysis included the number of principal components (PCs), percentage of variance each PC explained, the PCs loading factors, and PC scores. Only principal components explaining at least 80% of the variance were considered due to the limited dataset of golfers and trials. A PC score, for each principal component, golfer, and trial was computed. A large negative (−ve) or positive (+ve) PC score represented golfers whose curves were further away from the mean curve in the portions of the swing that had higher loading factors. Loading factors were the same length as the original data and could help deduce the stage in the swing where the greatest variation in movement patterns occurred. Positive or negative loading factors had an additive or subtractive effect on the mean data curve at those stages in the swing. A loading factor close to zero contributed little to the PC and indicated that there was little difference between golfers’ movement patterns at this stage in the swing and golfers tended towards the mean curve. Qualitative biomechanical interpretation of the PCs was achieved by examining the loading factors for each PC throughout the swing and by observing the mean data curves with plus and minus one standard deviation of the PC scores multiplied by the loading factor for each PC.
The PCs which cumulatively explained at least 80% of the variance in the first stage of analysis were used in the second stage of the analysis. Thorax and pelvis axial rotation variable PC scores (five PCs), COP
ML PC scores (three PCs), COG
ML PC scores (two PCs), clubhead velocity, and ball velocity impact parameters were separately coded between zero and one using three triangular fuzzy membership functions related to three modalities; low, median, and high as used by Bonnefoy–Mazure et al. [
13]. The membership values were determined based on the distribution of data for each variable whereby low and high boundaries corresponded to the 5th and 95th percentiles, respectively. Three membership values corresponding to the three modalities for each variable and golfer were deduced and vertically concatenated. The three membership values cumulatively equaled one. This process resulted in a fuzzy coded indicator matrix consisting of 110 rows × 36 columns (i.e., rows = 22 golfers × 5 trials and columns = 10 biomechanics PCs + 2 impact parameters × 3 modalities).
Thirdly, a correspondence analysis was carried out on the indicator matrix (i.e., MCA) using the R statistical analysis package ‘FactoMineR’. Multiple correspondence analysis is a descriptive data analysis method useful for revealing associations between variables. Multiple correspondence analysis generates a number of dimensions each explaining some variance in the dataset. Each dimension is explained by the variables included in the analysis, which in this study were the PCs and a scatterplot of the MCA results shows the contribution of each variable and their association to each other. In MCA, the factor planes and their dimensions (i.e., axes) are computed in order of those that explained the most to the least about the relationships between variables [
11]. In this study, the most explanative factor plane was presented. The PCs which contributed the most to each dimension were determined using their inertia values (Cos
2). Principal components close to the origin had low inertia and did not contribute strongly to the dimension. Conversely, principal components further away from the origin had higher inertia values and contributed more strongly to the dimension. A close relationship between principal components was inferred when points were close to each other on the MCA graph. Principal components located in opposite directions on a dimension had opposing relationships. Fuzzy-coded clubhead and ball velocities were included as supplementary points which meant they did not contribute to the computation of the factor planes and effectively had a zero inertia value. Instead, the supplementary clubhead and ball velocity points were included on the MCA graph to help interpret the features discovered between biomechanics variables that did contribute towards the factor planes [
10].
4. Discussion
The purpose of this study was to visualise the relationships between key movement patterns in thorax and pelvis axial rotation, centre of pressure and centre of gravity and clubhead–ball impact parameters in a group of low handicap golfers using multiple correspondence analysis. The principal component analysis results indicate that key features of thorax and pelvis axial rotation explained variations in magnitude, rate of change and timing throughout the swing. Therefore, the first hypothesis that key movement patterns extracted using PCA would encompass discrete body rotation measures at top of the backswing or impact was supported. The graphical representation of MCA results inferred a close relationship between principal components describing back foot style medial-lateral centre of pressure patterns and principal components explaining increased pelvis and thorax internal axial rotation and increased rate of change in the downswing. Graphical representation of MCA results also showed potential to identify movement patterns of golfers that matched and subsequent implications for clubhead–ball impact parameters, but future studies would require a larger dataset of golfer’s biomechanics data to confirm the results for use in golf coaching interventions.
Pelvis and thorax axial rotation principal components followed similar patterns to those found in previous literature with external thorax axial rotation (i.e., clockwise rotation away from the target) greater than pelvis external axial rotation during the backswing (
Figure 1) [
19,
20,
21]. Similarly, the later PCs, pelvis axial rotation PC2, and thorax axial rotation PC3 largely explained the rate of change in internal axial rotation in the downswing and the magnitude of internal axial rotation through IMP which closely resembled discrete explanatory variables of clubhead velocity used in regression analysis studies [
1,
7]. Discrete data analysis methods in biomechanics studies have been criticised for being used for ease rather than justified reasons [
22]. The PCA results in this study support the use of discrete variables such as magnitude of axial rotation at impact or velocity at impact, to distinguish between golfers’ technique during a drive, however, it is later discussed that the relationship with other biomechanics variables would be more explanative of impact parameters.
The outcome of principal component analysis coupled with MCA revealed relationships between key movement patterns in biomechanics data and highlighted the spread in golfers’ techniques with similar handicaps. The supplementary points clubhead velocity and ball velocity were also very close on the MCA plot and helps to confirm the ability of MCA to highlight close relationships between variables (
Figure 2). Additionally, medial-lateral centre of pressure and centre of gravity PC1 high and low points were closely related which confirms the strong correlation reported in Smith et al. [
2]. Principal components that explained changes in the mid-backswing and late downswing through to IMP contributed to dimension one (
Table 2). Golfers who fell further to the left-hand-side of dimension one exhibited increased thorax axial rotation in mid-backswing (approx. swing time 40%) (thorax AR Low PC1), a back-foot centre of pressure style (COP
ML low PC1), centre of gravity positioned evenly between stance at IMP (COG
ML low PC1), rapid pelvis rotation in the downswing and increased internal pelvis axial rotation through IMP (pelvis AR High PC2) (
Figure 2 and
Figure 4). Golfer 7 provided a good example of this movement pattern. These movement patterns are in agreement with suggestions that back foot centre of pressure styles are associated with increased external axial rotation magnitude in mid-backswing and increased internal axial rotation through impact due to the more centred position of the COP (i.e., 50%) between the feet [
2,
8]. Golf coaches, when describing the key technical movements of a successful golf swing, also advocated that golfers should be “centred” during the swing to allow for better axial rotation through impact [
5]. The evenly positioned centre of pressure and centre of gravity between stance coupled with increased internal pelvis axial rotation was in agreement with Welch et al.’s. [
9] description of rotational baseball hitters. Principal components explaining front foot centre of gravity position and rapid thorax axial rotation in the downswing contributed to Dimension two (
Table 2). Golfers who were higher on dimension two (i.e., vertical axis) tended to exhibit rapid thorax axial rotation in the downswing (thorax AR high PC3), their centre of gravity positioned closer to the front foot throughout swing (COG
ML high PC1), a rapid shift of centre of pressure to the front foot in downswing (COP
ML High PC2) and less pelvis axial rotation at top of the backswing (pelvis AR high PC1). These key movements were commensurate with golfer’s who would be described as exhibiting linear movement.
The focus of this paper was to observe the relationships between movement patterns in golfer biomechanics data, therefore, clubhead velocity and ball velocity were supplementary points in the MCA. Although there was not a clear separation in golfers’ technique based on clubhead or ball velocity, the graphical representation of MCA results did highlight some individual golfer differences which may be linked to reduced impact parameter measures (
Figure 3).
Figure 3 identified golfers who seemingly had similar movement patterns, but displayed noticeably lower clubhead velocity and ball velocity. Inspection of golfer number 6, 15, and 17 individual data could be used in future research whereby coaches develop interventions or changes are made to equipment to modify the centre of pressure and centre of gravity movement patterns to match axial rotation movements or vice versa. The MCA method could then be used to investigate whether clubhead velocity and ball velocity improved when movement patterns matched. Lamb and Pataky [
3] emphasised the need for individual golfer analysis which given the spread of data points seen on the MCA plots would somewhat support this need. However, both a benefit and limitation of MCA is the ability to visualize small variations in the data. The detected variations in the data may be separating golfers on an MCA plot but the variations may not be meaningful in terms of real overall performance differences. Including additional supplementary points in the analysis, such as other clubhead impact parameters or overall driving displacement and direction measures could help to explore whether the separation between golfers is meaningful. With previous research using MCA on discrete kinematic and kinetic data able to classify diverse clinical populations [
13,
14], it supports the use of MCA in future golf studies to provide a meaningful interpretation of the biomechanics data. As aforementioned, a key stage of biomechanics analysis is to describe the salient patterns of a sporting movement. Previously this has been limited to describing patterns in individual variables and using linear data analysis techniques to find relationships between movement patterns that explain impact parameters. The benefits of the combined PCA, fuzzy coding, and the MCA approach used in this study are that, firstly, PCs capture key features (variances) wherever they occur during the swing. These can subsequently be used to investigate relationships within multiple other key movement patterns and related to impact measures (such as in clubhead and ball velocity presented herein). Exploring variation between golfers’ biomechanics data, as with MCA, has potentially allowed for inconsistencies in golfer biomechanics to be identified. The ability to highlight inconsistencies in the matched movement patterns could help guide coaching interventions aimed at improving performance by addressing possible movement inconsistencies. Furthermore, with the ability to add supplementary points from different data sources, these methods could be coupled with injury reporting data to identify whether movement inconsistencies are linked with an injury.
The number of golfers and trials used in this study is a potential limitation. The limited guidance that does exist about an adequate dataset size for MCA suggests that the number of cases (i.e., golfers and trials) should be 20 times higher than the number of variables [
23]. Based on this guidance, for ten biomechanics variables, 200 cases should have been included in the analysis but, in this study, only 110 were used. Larger datasets will need to be gathered to explore relationships between more biomechanics variables and to include other supplementary data points. Interpretation of an MCA plot is challenging and requires familiarisation with the data and plot. In an applied setting, interpretation of an MCA plot could be improved by creating larger figures with more descriptive labels added to each quadrant. For example, descriptions of the data which use coaching terminology could also be used to annotate the MCA plot.


