1. Introduction
1.1. Research Background and Objectives
Recently, the importance of worker safety in the construction industry has become a prominent issue, and the Ministry of Employment and Labor in Korea has set a goal of reducing deaths due to industrial accidents by half before the end of 2022. Institutional and legal improvements are being pursued, and the need for safety is being emphasized [
1].
Despite this progress, the most deaths occurred in construction industry accidents (579 people, 29.6%) among all industrial accidents in 2017; furthermore, the number of deaths has risen, as there was a 4.5% increase in the number of worker deaths compared to the same period in the previous year [
2]. An analysis of construction accidents by body part showed that the head (161 people, 41.2%) and multiple body parts (123 people, 31.5%) were the most frequently injured, and among the fatal construction accidents, falls were the most common type (8699 people, 32.7%) [
3].
These results indicate that it is very important to manage the wearing of safety helmets, which can protect the heads of workers, as there is a high possibility that the head will be the body part that first impacts the ground in a fall accident [
3,
4]. When safety helmets are properly worn, they provide shock absorption, which reduces the force transmitted to the head of the wearer upon object impact to less than 10%, thus enhancing worker safety. Aside from falls, helmets also reduce the danger from accidents involving falling objects, flying objects, impacts, electrical shocks, and so on. Therefore, numerous institutional and technical studies have been conducted on increasing validity and accuracy when determining whether or not safety helmets are being worn properly [
5,
6,
7,
8,
9,
10,
11].
In terms of technology, the read sensors have been attached to chinstraps in previous studies to detect emergencies based on such information such as whether or not the helmet is being worn and its position. In those studies, it was determined whether or not the helmet was being worn by using sensors attached to chinstraps or additional sensing data such as altitude and position information. For example, chinstrap sensors and altitude sensing data have been used to confirm that the helmet was being worn [
9,
10,
11].
However, the previous studies in which sensors were attached to chinstraps were limited in that it is difficult to determine whether or not a helmet is being worn when looking at the movements of a worker in a work environment who fastens the chin strap but does not wear the helmet, carries or wears the helmet on his or her body, or performs other similar activities. The previous studies suggest that additional sensing data such as altitude and position information are necessary since using only the sensors attached to chinstrap is not enough to classify whether or not a safety helmet is being worn [
9,
10,
11].
The objective of this research was to resolve the shortcomings of previous studies by developing a system using a three-axis accelerometer sensor to identify the activities of workers in the work area of a current construction site based on their movement data and to determine not only whether or not safety helmets are being worn, but also whether they are being worn improperly. The development of the system included developing a sensing safety helmet using a three-axis accelerometer sensor, a worker smartphone app to transmit the data acquired by the safety helmet, and a web platform for an on-site PC to store the data. It is expected that managing construction workers who do not wear their helmets or wear them improperly will help prevent construction site accidents.
1.2. Research Scope
In this study, the hardware and software necessary to develop a management system for proper wearing of safety helmets based on three-axis accelerometer sensing were established. This work resolves the shortcomings of existing studies in which sensors were employed and the focus was on whether or not the safety helmet was being worn. This research was focused on developing a method of using worker motion data captured by three-axis accelerometer sensing to determine whether safety helmets are being worn improperly at construction sites. The specific steps performed in this study are described as follows:
First, statistical data on Korean construction site safety accidents were analyzed to understand the importance of not wearing safety helmets, and the necessity of developing a system for monitoring the proper wearing of safety helmets was identified. Existing studies on monitoring the proper wearing of safety helmets have been limited to determining when safety helmets are not being worn. As such, it was observed that improper wearing, such as when the chinstrap and harness of the safety helmet are not fastened correctly, have not been monitored adequately in previous studies.
Second, a sensing safety helmet measurement system was developed in which the safety helmet has a three-axis accelerometer sensor that can identify user activities to monitor whether the safety helmet is properly worn, not worn, or improperly worn.
Third, the raw data from the three-axis accelerometer sensor of the safety helmet were converted into a signal vector magnitude (SVM). The recognition rate for each activity was found to be high, but it was difficult to distinguish between proper and improper wearing.
Fourth, to resolve this problem, the SVM was converted into a frequency by performing a fast Fourier transformation (FFT), and specific features were found at certain frequencies. These frequency features were used to classify the data by work activity and to analyze them.
Fifth, the Waikato Environment for Knowledge Analysis (WEKA) data mining program was used to verify that it is possible to differentiate among proper wearing, not wearing, and improper wearing of the safety helmet during work for each of the work activities.
2. Materials and Methods
2.1. Existing Research Trends
2.1.1. Korean Construction Site Accident Types
Figure 1 shows the industrial accidents in 2016 by cause of accident according to the Korea Occupational Safety and Health Agency. Out of the total of 90,656 people involved in industrial accidents, 26,570 (or 29.3%) were in construction accidents. Of those, falls (8,699 people, 32.7%) were the most numerous, followed by slips (3995 people, 15.0%) and being struck with objects (3368 people, 12.7%) [
3].
Figure 2 shows the industrial accidents by the injured body part. Out of the total of 826 people with body parts injured in industrial accidents, 391 of them (47.3%) were in the construction industry. Among those, the head (161 people, 41.2%) was the most frequently injured, followed by multiple body parts (123 people, 31.5%) [
3].
As shown in
Figure 1, falls often occur at constructions sites (8699 people, 32.7%). In
Figure 2, injuries to the head (161 people, 41.2%) account for a high proportion of the injuries by body part. Based on this information, it can be expected that there is a high possibility that the head will impact the ground first during a fall accident. Because the head is the most vulnerable body part, wearing a safety helmet to protect the head is very important. Thus, ensuring head protection is directly connected to promoting worker safety not only in falls, but also in many other types of safety accidents that occur on construction sites, such as those involving dropped and flying objects [
3,
4,
6].
2.1.2. Trends in Research on Improving Safety Helmet Wearing
The Rules for Industrial Safety and Health Standards in Korea stipulate that safety helmets must be worn for protection when doing work that involves a risk of flying or falling objects or the worker falling at construction sites [
5]. Because safety helmets reduce the risk of accidents related to falling objects, flying objects, impacts, and electrical shocks, safety helmets are among the important pieces of protection equipment responsible for worker safety at construction sites [
6].
As shown in
Figure 3, the Occupational Safety and Health Agency recommends a method of properly wearing a safety helmet that includes checking the helmet for abnormalities, adjusting the harness so that the helmet is the right size for the head of the wearer, and ensuring that the chinstrap is placed around both ears and fastening it securely so that the helmet does not come off [
7].
Properly wearing a safety helmet in this manner provides shock absorption, which reduces the force transmitted to the head of the wearer upon object impact to less than 10%. However, there are many cases in which workers avoid wearing safety helmets or do not fasten their chinstraps, and safety accidents often occur as a result [
8]. To resolve this issue, a case study was conducted involving a system with a sensor attached to the chinstrap that turned on when the chinstrap was fastened and determined whether or not the safety helmet was worn properly [
9]. Aside from chinstrap detection sensors, a safety control server was investigated that can determine worker locations through relays by calculating the communication distance based on the communication range to provide notifications about worker locations and emergencies via wireless electromagenetic compatibility (EMC) techniques [
10]. In another study, Zigbee communications and chinstrap sensor, intensity of illumination, and altitude data were used to determine whether or not workers were properly wearing helmets with their chinstraps fastened. This method was employed to determine the locations, emergency situations, etc. of workers [
11].
However, if a worker does not wear his or her safety helmet and instead places it at the construction site with the chinstrap fastened, the monitoring system may consider the helmet to be worn based on the node status. Even when the determination is made using data such as the illumination and altitude of the worker, if he or she carries the safety helmet without wearing it and creates movement data by performing activities involving motion in the work environment, or if the worker fastens the chinstrap and keeps the safety helmet on his or her head and moves, it will be determined that the safety helmet is being worn properly and work is being performed at the work location. Thus, it is possible for the system to recognize that the safety helmet is being worn properly even when it is not.
To resolve this issue, it is necessary to develop ideas and technology that can determine whether a worker is wearing his or her safety helmet properly while working by using data related to the activities of the worker rather than simply attaching a sensor to the chinstrap of the helmet to determine whether or not it is being worn properly.
2.2. Development of Three-Axis Accelerometer Sensing System for Safety Helmet Wearing Management
2.2.1. Platform for Saving and Analyzing Sensing Data
As shown in
Figure 4, the proposed system consists of a three-axis accelerometer sensor module attached to the safety helmet, a smartphone app for the worker wearing the helmet, and an on-site PC-based database platform that stores the data.
The data collected by the three-axis accelerometer sensor attached to the safety helmet are first transmitted to the smartphone of the worker who is wearing the helmet. The data are stored in the developed smartphone app, and Bluetooth is used for communication, the proposed system performs transmission by using Serial Port Profile (SPP) based on Bluetooth V 3.0.
These data are then sent to the on-site PC-based database platform via 3G/LTE and uploaded as shown in
Figure 5, where the X, Y, and Z outputs of the three-axis accelerometer sensor are listed sequentially, and the data collection times and dates are entered.
The worker data are transmitted to the on-site PC-based database platform and analyzed in real time. The data transmission frequency was set up to 4 Hz between smart helmet and PC-based database platform. If the helmet is not being worn or is being worn improperly, a warning is sent to the smartphone app of a designated site manager, such as a task leader.
2.2.2. Three-Axis Accelerometer Safety Helmet Sensing System Hardware
The safety helmet sensor module developed in this study includes a bluetooth low energy (BLE) feature for communication with smartphones, a three-axis accelerometer sensor, and a real-time clock (RTC) time-measuring sensor and is battery-operated.
As specified in
Table 1, A JARDUINO-UNO_BTmini is used in the micro controller unit (MCU) due to its small size. It transmits the three-axis accelerometer and RTC data through Arduino I2C communication with each sensor. The data are transmitted via Bluetooth to the app on the personal smartphone of the worker that is used for data transmission. The three-axis accelerometer sensor uses MMA8452, and the RTC uses DS3231.
Figure 6 shows the three-axis accelerometer sensing helmet employed in the tests in this study. The sensor module is attached to an ABE-type safety helmet, which is the type that is typically used on construction sites. The total weight of the sensing helmet is 0.491 kg including the increased weight owing to the added sensors, i.e., 0.124 kg. This increased weight due to sensors is regarded as very low in terms of subjective degree of inconvenience [
12].
2.2.3. Mobile App for Data Collection and Transmission
Figure 7 shows screenshots of the data transmission app for the sensing safety helmet, which can be used on an Android mobile device. The app is designed so that when the mobile device is connected to the sensing safety helmet via Bluetooth, the data from the three-axis accelerometer sensor are automatically stored in the app database. If the data transmission tab is selected in the app, the data that were first saved in the app are sent to the web page of the on-site PC via 3G/LTE. As shown in
Figure 7, the X, Y, and Z vector values generated by the three-axis accelerometer sensor according to the real-time movements of the worker can be viewed in the app.
3. Results
3.1. 1st Data (SVM) Analysis
The common method of recognizing activities using a three-axis accelerometer sensor involves converting the signal values by applying Equation (1) or a statistical formula or using a mathematical algorithm for activity classification [
13,
14]. Equation (1) can be applied to determine the SVM, by extracting a single representative value from the X, Y, and Z accelerations output by the three-axis accelerometer sensor. This quantity can be used to offset the directional component of the acceleration along each axis that is caused by gravity and to collect fixed pattern information [
15]. Equation (1) can be applied to determine the SVM, by extracting a single representative value from the X, Y, and Z accelerations output by the three-axis accelerometer sensor, where the SVM is an Euclidean Norm and each
,
, and
are the vector magnitude values attained from the three-axis accelerometer sensor [
13,
14,
15].
Figure 8 depicts results obtained by applying Equation (1) to the X, Y, and Z acceleration outputs corresponding to standing, walking, and running when the safety helmet is worn properly with the chinstrap fastened.
The horizontal axis in
Figure 8 is the number of data items listed sequentially, and 100 data items were diagrammed. The vertical axis is an index that shows the SVM. Standing, walking, and running, which are typical activities in activity recognition, clearly exhibit a variety of differences following the application of Equation (1) [
16]. Among the three activities, running, which involves relatively large body movements, has the largest SVM. Standing, which entails relatively little body movement, has the smallest SVM.
Although the data were classified well by activity, there was some uncertainty regarding whether the helmet was worn properly with the chinstrap fastened or worn improperly with the chinstrap incorrectly fastened during each activity, as shown in
Table 2.
Table 2 summarizes the results of tests performed by dividing the three activities in [
Figure 8] into states with the chinstrap fastened (On) and not properly fastened (Off) and then using the RandomTree algorithm of WEKA to classify 100 data samples. RandomTree is a Supervised Classifier; which is an ensemble learning algorithm that a large number of individual learners [
17]. It is a typical decision-making tree data mining algorithm and it forms the basis of RandomForest [
18].
Table 2 shows that the mean accuracy of the decision regarding whether or not the safety helmet is being worn properly during standing, walking, and running is 42.3%. The activity classification accuracy is high, but the accuracy of the classification regarding whether or not the safety helmet was worn properly during each activity is not as high. As an example,
Figure 9 shows the walking activity, for which the determination of whether or not the safety helmet was worn properly has a particularly low accuracy among the activities in
Table 2.
As shown in
Figure 9, the SVM of the walking activity when the safety helmet was worn properly is larger than when the safety helmet was not worn properly. However, it is considered to be difficult to categorize the walking activity data according to whether the safety helmet was properly worn or improperly simply through visual analysis. As such, an F-test was performed (at a significance level of 0.1) using the variance of the data, resulting in
Table 3 below.
In the F-test results in
Table 3 for the walking activity when the safety helmet was worn properly or improperly, the F-rejection value is greater than the F proportion. Therefore, the data could be classified based on whether or not the chinstrap was fastened. However, the data mining results in
Table 2 exhibit markedly low accuracy. The three-axis accelerometer sensor is sensitive and therefore has physical error, and the data obtained when the safety helmet was and was not worn properly during each activity yielded different F-test results. Nevertheless, the data from the two cases were recognized as the same area and could not be represented correctly [
19].
3.2. 2nd Data (FFT) Analysis
To resolve this issue, the SVMs were converted into frequency bands via FFT to classify the data obtained when the safety helmet was worn properly, not worn, and worn improperly. An FFT involves the same formula as a discrete Fourier transformation (DFT) as expressed in Equation (2), but the data size is made
to improve the calculation speed [
20]. Here in,
is the data of SVM values,
is a twiddle factor as a complex exponential function, and j is an imaginary unit. When an FFT is used in analysis, the sizes of the frequency bands for each activity are distributed differently. Therefore, the proper wearing, improper wearing, and not wearing data for each activity can be identified [
21,
22].
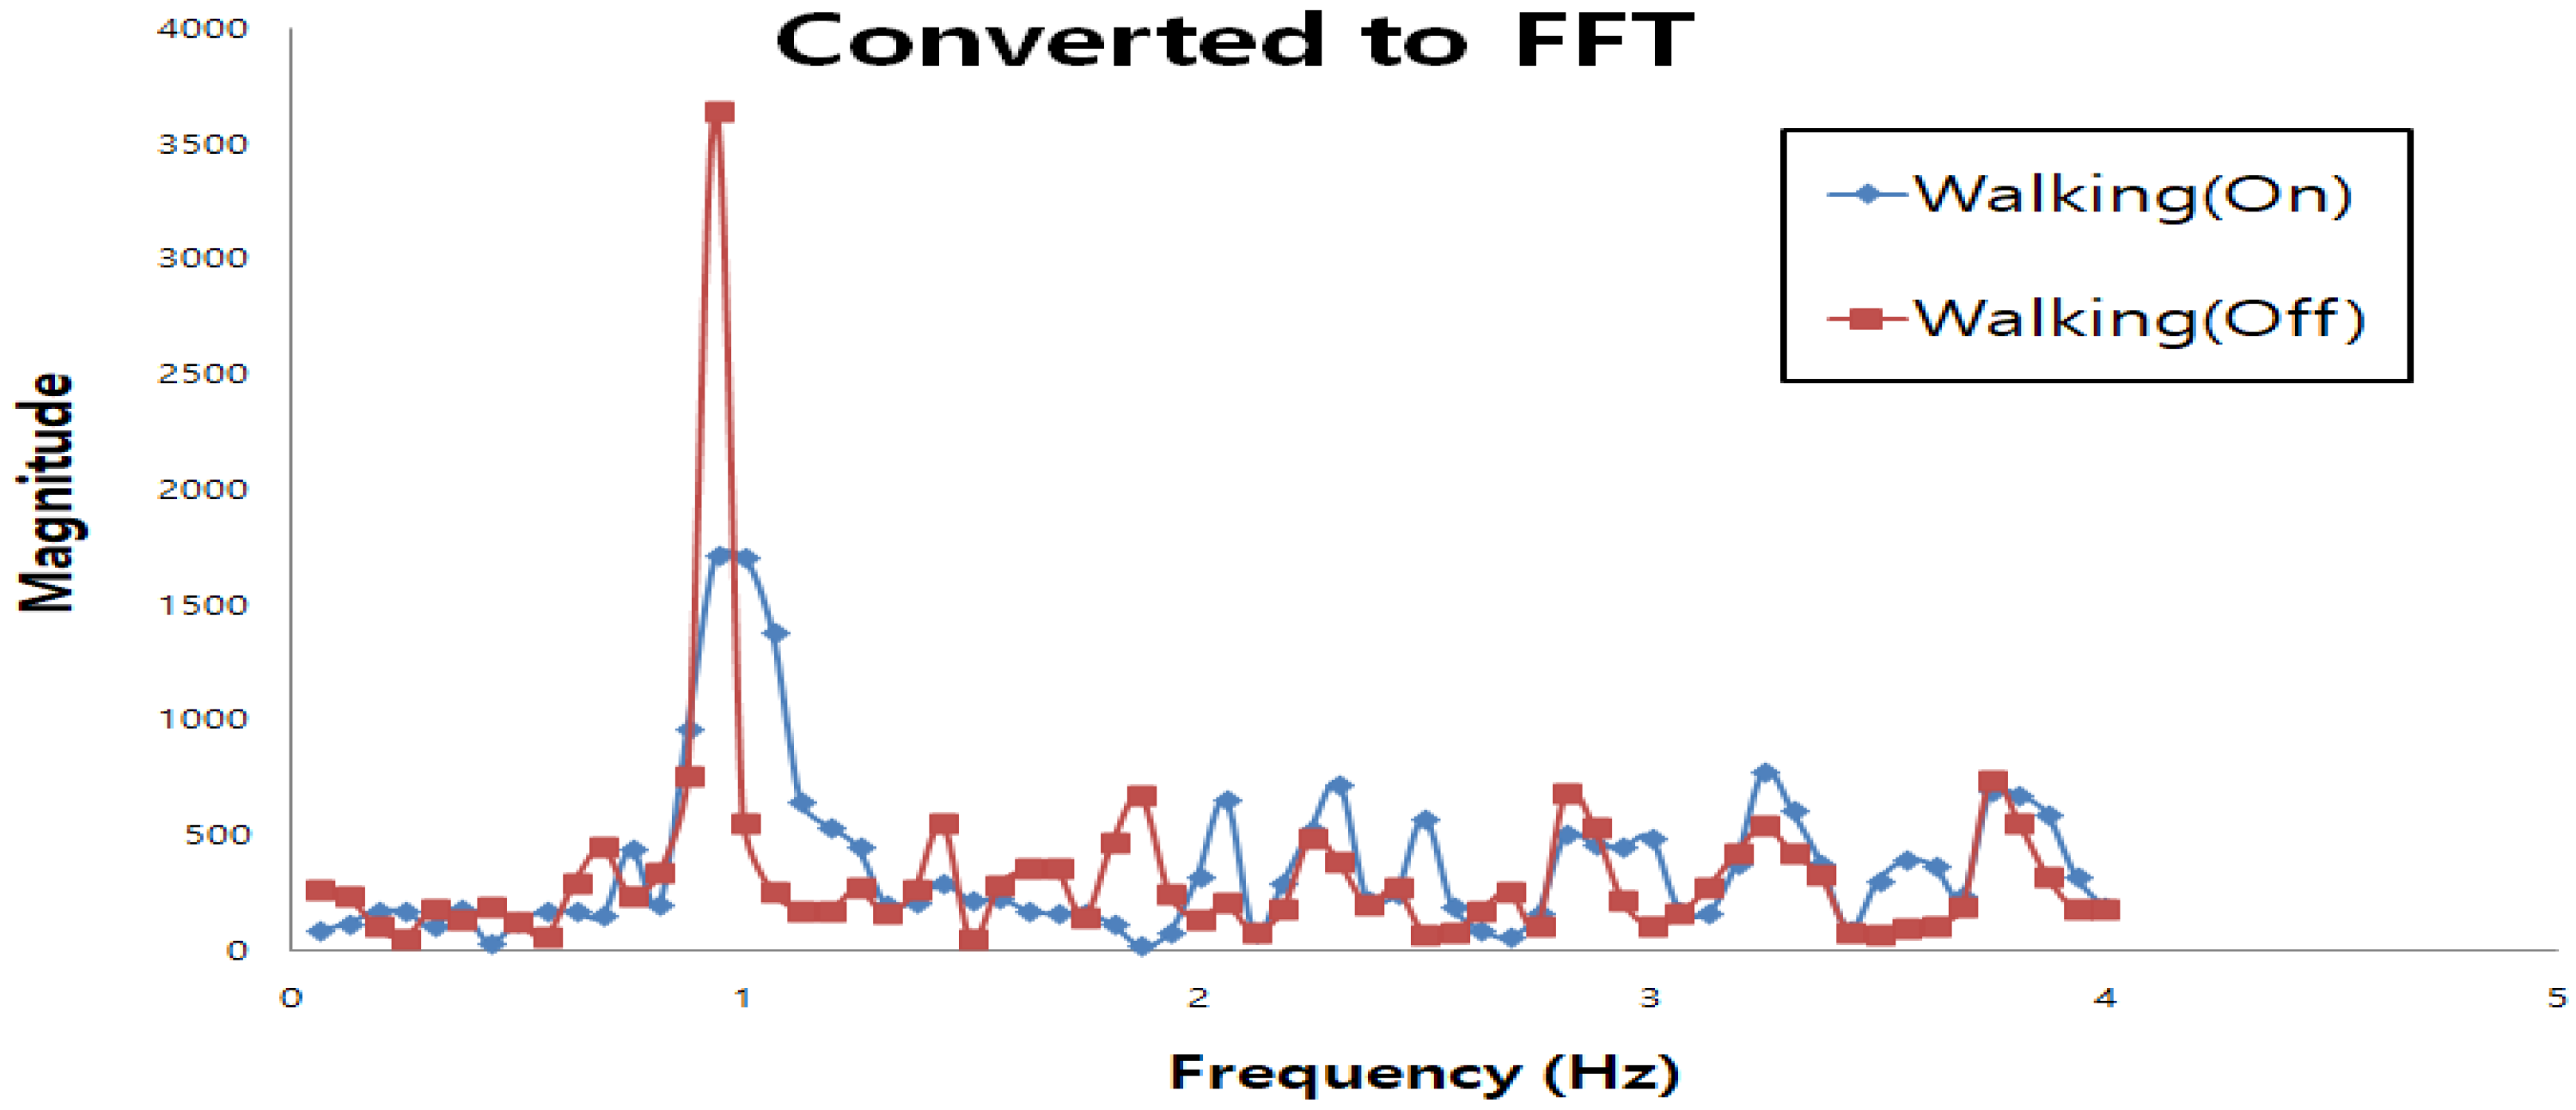
[
Figure 10] shows the results of using Equation (2) on the data in
Figure 9 and conversion via FFT. To perform an FFT,
data are needed, so the walking activity data were separated into On and Off states, and the number of data was set to be the same at 64. In
Figure 10, there is a pattern in which both the On and Off states of the walking activity are prominent in the 0.85–1 Hz range. Near 1 Hz, the slope of the graph changes gradually for the On data but changes rapidly for the Off data.
3.3. Test Scenario for using FFT Data
The focus of this study was the proper wearing of safety helmets at construction sites. To distinguish between wearing and not wearing a helmet and then between properly and improperly wearing the helmet, the test scenario depicted in
Figure 11 was created.
First, a determination is made regarding whether or not the safety helmet is being worn. If the helmet is being worn, it is determined whether the helmet is being worn properly or improperly. For this purpose, it is necessary to classify the worker activities. In existing studies on sensor-based activity recognition, activities such as walking, standing, running, riding a bicycle, going up stairs, and going down stairs have been classified [
23,
24,
25,
26]. Since the focus of this study was on worker activities at a construction site, the test scenarios were classified accordingly, as shown in
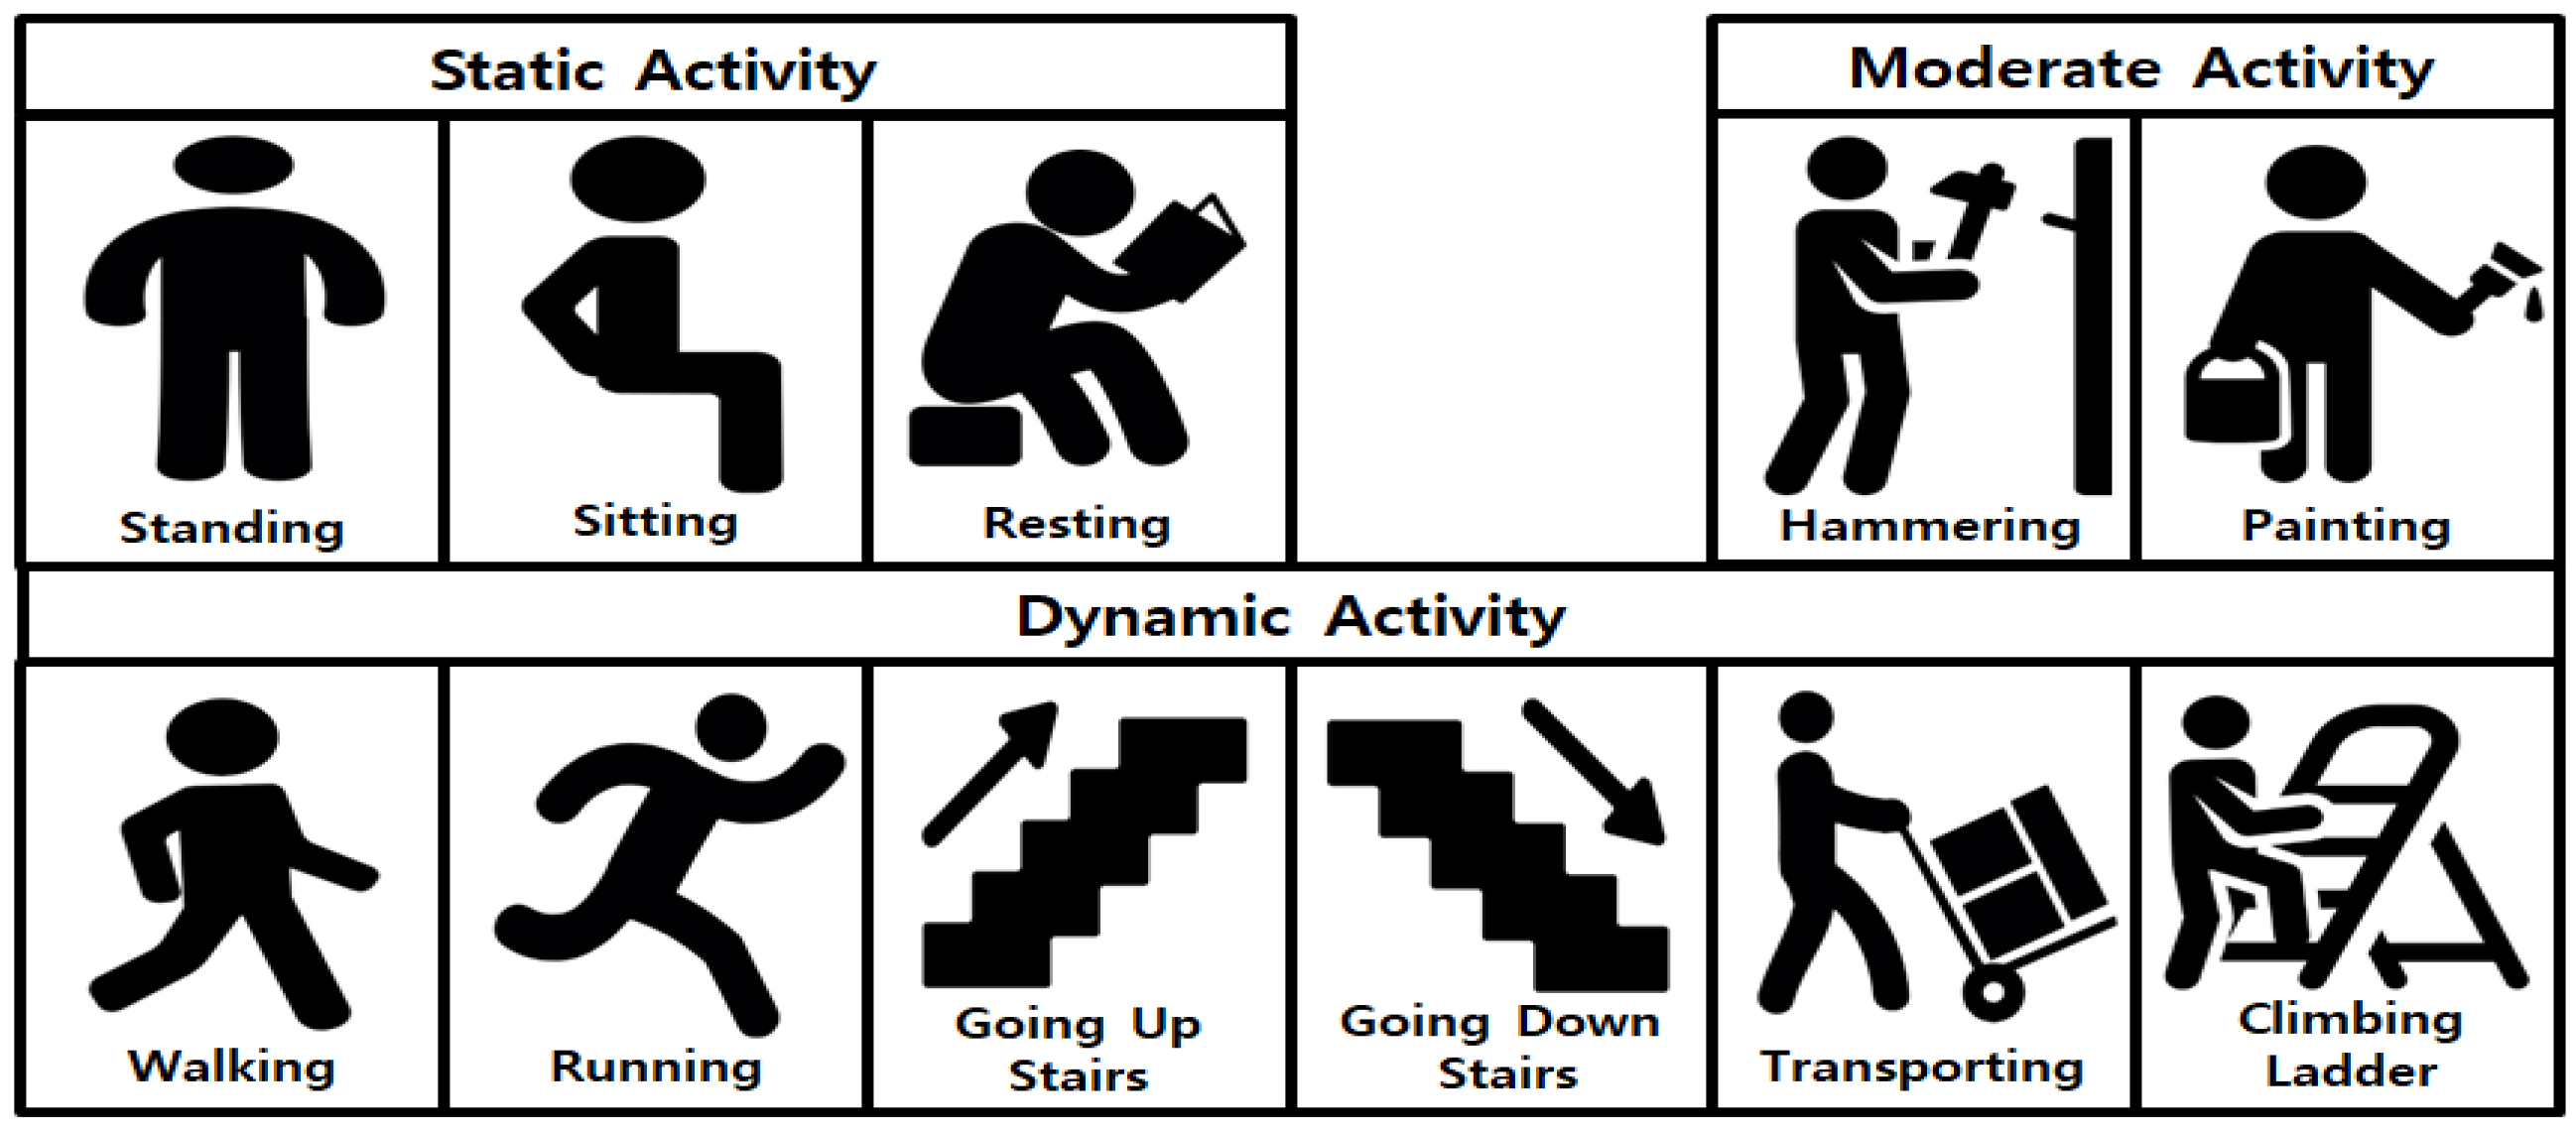
Figure 12.
In this study, 11 typical main activities of workers at a construction site were identified and were divided into static, moderate, and dynamic activities. The static activities include sitting, standing, and resting and generally involve minimal upper and lower body movements. Resting allows the upper body to move more freely than sitting. The moderate activities include hammering and painting. Here, the lower body is generally static, but the upper body is moving to perform a task. Finally, the dynamic activities include walking, running, going up stairs, going down stairs, transporting objects, and climbing ladders.
The data sampling period of the sensor was 8 Hz, and a data frame was created to allow data sampling to occur 128 times every 32 s. Every 128 data items constituted a set, and 100 sets of raw data were collected regarding the proper and improper wearing of safety helmets according to activity. The tests were performed on three men and two women to consider a variety of body conditions. Each subject performed each activity for 2–30 min, depending on whether the chinstrap was fastened or not. When the safety helmet was properly worn (On), the harness was adequately tightened around the head, and the chinstrap was 2 cm vertically from the tip of the chin of the subject. When the safety helmet was improperly worn (Off), the harness was loose, and the chinstrap was not properly fastened.
3.4. Final Test Analysis Results
Table 4 below shows the results of applying the RandomTree algorithm from WEKA to the proper wearing (On), improper wearing (Off), and non-wearing of the safety helmet proposed in this study according to the activities of the workers. The accuracy is the highest when using the RandomTree algorithm.
As shown in
Table 4, the data derived from each activity have a high recognition rate. The good activity recognition indicates high classification performance, i.e., several activities can be classified, and the data can be categorized according to whether or not the safety helmet was worn during each activity. When the safety helmet was not worn, in which case the highest accuracy was found, 12,577 data out of a total of 12,800 data were accurately recognized as having been obtained when the helmet was not worn, yielding the best data verification performance (98.26%).
Table 5 shows the accuracy verification results for properly wearing, improperly wearing, and not wearing the proposed safety helmet, based on the data in
Table 4. The mean recognition rates for the 11 considered typical worker activities at construction sites are 96.89% for properly wearing the safety helmet and 98.26% for not wearing the helmet, which indicate good classification performance. A high accuracy of 96.90% was also achieved for the data obtained when improperly wearing the helmet.
4. Discussion
In previous studies in which three-axis accelerometer sensors were used to recognize activities, the sensors were attached to smartphones, wearable devices, body parts, etc. and the data were analyzed [
27,
28,
29,
30,
31,
32].
In the existing studies on user activity recognition via three-axis accelerometer sensors, the determinations were made using only the size of the data of the three-axis accelerometer sensor; however, it is necessary to classify data by using several statistical methods regarding the sizes of the vertical and horizontal components and the directionality of the smartphone [
27].
However, when activities cannot be accurately identified using only the size of the data of the three-axis accelerometer sensor, the FFT can be used to differentiate clearly between static activities for which the data are confusing such as “sit” and “stand” [
28]. The data acquired in dynamic environments such as vehicles were simultaneously combined with the activity data as they were obtained. The chaotic data with overlapping pattern ranges were reanalyzed by performing an FFT, and the common patterns of specific unique frequencies were used as features to classify activities posture [
29]. FFT analysis, in which points in time with sudden irregular patterns are recognized as state changes, is seen as a very suitable method for analyzing three-axis accelerometer sensor data [
30].
In this study, a safety helmet with a three-axis accelerometer sensor attached was developed for worker activity analysis. The mean recognition rate for properly wearing, improperly wearing, and not wearing the proposed safety helmet is increased from 17.09% to 96.95% between before applying FFT and after applying FFT, when the data classification is made by the RandomTree algorithm of Weka. In the proposed method, data obtained when the helmet is worn properly with the chinstrap correctly fastened, worn improperly with the chinstrap not correctly fastened, and not worn are employed to differentiate among properly wearing, improperly wearing, and not wearing the helmet.
5. Conclusions
Most existing technological approaches for promoting the proper wearing of safety helmets involve attaching a sensor to the chinstrap of the helmet to determine whether or not it is being worn properly using data pertaining to whether or not the chinstrap is fastened, as well as additional sensing data. However, it is not possible to determine whether a safety helmet is being worn improperly solely by using a sensor attached to the chinstrap.
To resolve this problem, a system in which a three-axis accelerometer sensor is attached to the safety helmet was developed in this study. This system can be used to identify not only when the helmet is being properly worn or not worn, but also when it is improperly worn by employing the sensing data generated during work according to the activity of the worker at the construction site. The developed system was verified by performing tests using the RandomTree algorithm from WEKA. The results confirmed that the system can classify when a safety helmet is being worn properly, being worn improperly, and not being worn with mean accuracies of 96.89%, 96.90%, and 98.26%, respectively.
This study is expected to contribute to the prevention of construction accidents by monitoring whether or not construction workers properly wear safety helmets. It is also expected to serve as a first step toward identifying worker activities and whether or not work is occurring by using three-axis accelerometer sensing.
Because a high recognition rate can be achieved when classifying worker activities using a three-axis accelerometer sensor, it is believed that the applications of this method will be expanded in the future through studies on construction work process improvement and productivity management.
Author Contributions
S.H.K. and S.H.L. conceived and performed the conceptualization, the experiment, the~formal data analysis, the validation and the composition of the research paper. C.W. and S.D.M. developed the hardware part of the sensing helmet. Finally all the authors have read, revised and approved the final manuscript.
Funding
This research was supported by Basic Science Research Program through the National Research Foundation of Korea (NRF) funded by the Ministry of Education (NO. 2017R1A2B1011776).
Conflicts of Interest
The authors declare no conflict of interest.
References
- Korea Ministry of Employment and Labor. Measures to Reduce Industrial Accident Deaths—Intensive Management of High Risk Areas and Diffusion of Safety Priority Culture; Korea Ministry of Employment and Labor: Seoul, Korea, 2018.
- Korea Ministry of Employment and Labor. Occupational Accidents in 2017; Korea Ministry of Employment and Labor: Seoul, Korea, 2017.
- Korea Occupational Safety and Health Agency. Industrial Disaster Analysis in 2016. Korea Occupational Safety and Health Agency. 2017. Available online: https://www.kosha.or.kr/www/boardView.do?menuId=554&contentId=373432&boardType=A2.2017 (accessed on 8 December 2018).
- Sim, H.H.; Kang, K.S. A Study on the Death Accident Analysis of Ladder and Prevention Measures for Fall Accidents. J. Korea Saf. Manag. Sci. 2017, 19, 95–104. [Google Scholar]
- Korea Ministry of Employment and Labor. Rules for Industrial Safety and Health Standards; Korea Ministry of Employment and Labor: Seoul, Korea, 2018; Issue 255.
- Kim, J.-H. A Study on Protective Purposes and Intents of Use of Safety Helmets as for Reduction of Falls. J. Korea Soc. Saf. 2013, 28, 83–89. [Google Scholar] [CrossRef]
- Korea Occupational Safety and Health Agency. Proper Wear of Protective Equipment. Available online: https://www.kosha.or.kr/trList.do?medSeq=33309&codeSeq=1100000&medForm=101&menuId=-1100000101 (accessed on 6 December 2018).
- Hong, S.K.; Lee, S.H.; Kim, B.M.; Jang, M.S.; Lee, E.H. Implementation of a Hard hat for Safety of Construction Site. Proc. Summer Conf. J. Korea Inst. Electron. Inf. Eng. 2013, 36, 1639–1642. [Google Scholar]
- Lee, Y.S.; Cho, S.E.; Ahn, J.K. Ubiquitous Sensor Networks(USN), Safety helmet, Monitoring program. J. Korea Inf. Technol. Convergence Soc. 2010, 3, 25–35. [Google Scholar]
- Jang, M.S.; Cho, J.S.; Kim, S.M.; Lee, E.H. A Case Study of Wireless EMC Test in Industrial Worker’s Safety Helmet Wearing System. J. Korea Reliab. Appl. 2014, 1, 471–478. [Google Scholar]
- Lee, C.H.; Kim, K.H.; Kim, J.W.; Choi, S.B. Construction Site Safety Management System Using ZigBee Communication. J. Inst. Electron. Inf. Eng. 2017, 54, 39–51. [Google Scholar]
- Kim, Y.C.; Jeong, H.W.; Jang, S.R. A Study on Evaluation of Neck Muscle Workload in Static Work Using EMG. J. Korean Soc. Saf. 2005, 20, 148–153. [Google Scholar]
- Gjoreski, H.; Gams, M. Activity/Posture recognition using wearable sensors placed on different body locations. In Proceedings of the Signal and Image Processing and Applications, Crete, Greece, 22–24 June 2011. [Google Scholar]
- Kim, D.Y.; Jeon, S.H.; Kang, S.Y.; Kim, N.H. Customized Estimating Algorithm of Physical Activities Energy Expenditure using a Tri-Axial Accelerometer. J. Korean Contents 2011, 11, 103–111. [Google Scholar] [CrossRef]
- Yu, Q.; Jang, J.H.; Jang, J.L.; Jho, Y.C.; Lee, C.H. A Study on the Guide to Emergency Exit by Tracking Location of Smartphone Users. J. Korea Saf. Manag. Sci. 2018, 20, 33–40. [Google Scholar]
- Ha, E.T.; Kim, J.M.; Kwang, R. Ensemble of Nested Dichotomies for Activity Recognition Using Accelerometer Data on Smartphone. Korea Intell. Inf. Syst. Soc. 2013, 19, 123–132. [Google Scholar] [CrossRef]
- Mishra, A.K.; Ratha, B.K. Study of Random Tree and Random Forest Data Mining Algorithms for Microarry Data Analysis. Int. J. Adv. Electr. Comput. Eng. 2016, 3, 5–7. [Google Scholar]
- Park, J.H.; Kim, H.K.; Kim, E.J. Effective Normalization Method for Fraud Detection Using a Decision Tree. J. Korea Inst. Inf. Secur. Cryptol. 2015, 25, 133–146. [Google Scholar] [CrossRef]
- Kim, H.Y.; Min, J.K. Implementation of a Motion Capture System using 3-Axis Accelerometer. J. Korean Inst. Inf. Sci. Eng. Comput. Pract. Lett. 2011, 17, 383–388. [Google Scholar]
- Lee, D.V.; Lee, S.G. The Study on Movement Imagery EEG Classification using GMM and SVM. J. KIIT 2013, 11, 67–75. [Google Scholar] [CrossRef]
- Nam, Y.Y.; Choi, Y.J.; Cho, W.D. Human Activity Recognition using an Image Sensor and a 3-axis Accelerometer Sensor. J. Korea Trans. Internet Inf. Syst. 2010, 11, 129–141. [Google Scholar]
- Lim, Y.B.; Lee, K.Y.; Park, W.G.; Cho, S.W. Pattern Classification Method of Eletrical Loads Using Modified MFCC. Korea J. Fuzzy Logic Intel. Syst. 2017, 27, 543–551. [Google Scholar]
- Kwapisz, J.R.; Weiss, G.M.; Moore, S.A. Activity Recognition using Cell Phone Accelerometers. ACM SigKDD Explor. Newsl. 2010, 12, 74–82. [Google Scholar] [CrossRef]
- Györbíró, N.; Fábián, Á.; Hományi, G. An Activity Recognition System for mobile Phones. Mob. Netw. Appl. 2009, 14, 82–91. [Google Scholar] [CrossRef]
- Miluzzo, E.; Lane, N.D.; Fodor, K.; Peterson, R.; Lu, H.; Musolesi, M.; Eisenman, S.B.; Zheng, X.; Campbell, A.T. Sensing Meets Mobile Social Networks: The Design, Implementation and Evaluation of the CenceMe Application. In Proceedings of the 6th ACM Conference on Embedded Network Sensor Systems, Raleigh, NC, USA, 5–7 November 2008; pp. 337–350. [Google Scholar]
- Kim, J.H.; Kim, I.C. Artificial Intelligence: Design and Implementation of a Two-Phase Activity Recognition System Using Smartphone’s Accelerometers. J. KIPS Trans. Softw. Data Eng. 2014, 3, 87–92. [Google Scholar] [CrossRef]
- Jeon, M.H.; Park, Y.T. Robust User Activity Recognition using Smartphone Accelerometer Sensors. J. Korea Inf. Process. Soc. Trans. Softw. Data Eng. 2013, 2, 629–642. [Google Scholar] [CrossRef]
- Yang, H.K.; Yong, H.S. Real-Time Physical Activity Recognition Using Tri-axis Accelerometer of Smart Phone. J. Korea Multimed. Soc. 2014, 17, 506–513. [Google Scholar] [CrossRef]
- Lee, H.S.; Lee, S.Y. Real-Time Activity and Posture Recognition with Combined Acceleration Sensor Data from Smartphone and Wearable Device. J. Korean Inst. Inf. Sci. Eng. Softw. Appl. 2014, 41, 586–597. [Google Scholar]
- Ryu, C.-K. Abonrmal Step Recognition for Pedestrian Danger Recognition. J. KIECS 2017, 12, 1233–1241. [Google Scholar]
- Lee, Y.D.; Chung, W.Y. Wireless sensor network based wearable smart shirt for ubiquitous health and activity monitoring. Sens. Actuators B Chem. 2009, 140, 390–395. [Google Scholar] [CrossRef]
- Yang, K.; Ahn, C.R.; Vuran, M.C.; Aria, S.S. Semi-supervised near-miss fall detection for ironworkers with a wearable inertial measurement unit. Autom. Constr. 2016, 68, 194–202. [Google Scholar] [CrossRef]
Figure 1.
Distribution of industrial accidents in the construction industry in Korea by cause of accident.
Figure 1.
Distribution of industrial accidents in the construction industry in Korea by cause of accident.
Figure 2.
Distribution of accidents in the construction industry in Korea by injured body part.
Figure 2.
Distribution of accidents in the construction industry in Korea by injured body part.
Figure 3.
Occupational safety and health agency guide to wearing a safety helmet.
Figure 3.
Occupational safety and health agency guide to wearing a safety helmet.
Figure 4.
Data transmission in the three-axis accelerometer safety helmet sensing system.
Figure 4.
Data transmission in the three-axis accelerometer safety helmet sensing system.
Figure 5.
On-site PC web platform for storing data (Acc X, Y, Z—Magnitude).
Figure 5.
On-site PC web platform for storing data (Acc X, Y, Z—Magnitude).
Figure 6.
Prototype of three-axis accelerometer sensing safety helmet: (a) Front side of the Safety Helmet; (b) Back side of the Safety Helmet.
Figure 6.
Prototype of three-axis accelerometer sensing safety helmet: (a) Front side of the Safety Helmet; (b) Back side of the Safety Helmet.
Figure 7.
Screenshots of the personal smartphone app for transmitting data.
Figure 7.
Screenshots of the personal smartphone app for transmitting data.
Figure 8.
Signal vector magnitude (SVM) during standing, walking, and running when the safety helmet is worn properly.
Figure 8.
Signal vector magnitude (SVM) during standing, walking, and running when the safety helmet is worn properly.
Figure 9.
SVM during walking according to whether or not the chinstrap on the safety helmet was fastened.
Figure 9.
SVM during walking according to whether or not the chinstrap on the safety helmet was fastened.
Figure 10.
Results of Fast Fourier Transformation (FFT) conversion of walking activity according to whether or not the safety helmet was worn properly.
Figure 10.
Results of Fast Fourier Transformation (FFT) conversion of walking activity according to whether or not the safety helmet was worn properly.
Figure 11.
Safety helmet state classification chart.
Figure 11.
Safety helmet state classification chart.
Figure 12.
Classification of static, moderate, and dynamic activities of workers in test scenarios.
Figure 12.
Classification of static, moderate, and dynamic activities of workers in test scenarios.
Table 1.
Technical Specification of the Sensing Helmet.
Table 1.
Technical Specification of the Sensing Helmet.
| Sensor | Type | Function |
|---|
| Micro Controller Unit (MCU) | JARDUINO-UNO_BT mini | Transmits data through Arduino I2C communication. |
| Three-Axis-Accelerometer | MMA8452 | Measures raw data of acceleration in the three axes. |
| Real Time Clock (RTC) | DS3231 | Measures real time. |
Table 2.
Accuracy of SVMs for standing, walking, and running according to whether or not the safety helmet is worn properly.
Table 2.
Accuracy of SVMs for standing, walking, and running according to whether or not the safety helmet is worn properly.
| | Standing (On) | Standing (Off) | Walking (On) | Walking (Off) | Running (On) | Running (Off) | Accuracy (%) |
|---|
| Standing (On) | 47 | 39 | 6 | 6 | 2 | 0 | 47 |
| Standing (Off) | 43 | 44 | 5 | 5 | 1 | 2 | 44 |
| Walking (On) | 5 | 5 | 34 | 37 | 15 | 4 | 34 |
| Walking (Off) | 6 | 6 | 35 | 36 | 11 | 6 | 36 |
| Running (On) | 2 | 0 | 14 | 11 | 41 | 32 | 41 |
| Running (Off) | 0 | 1 | 5 | 9 | 33 | 52 | 52 |
| Average | 42.3 |
Table 3.
F-test results for SVM during walking according to whether or not the chinstrap on the safety helmet was fastened.
Table 3.
F-test results for SVM during walking according to whether or not the chinstrap on the safety helmet was fastened.
| | Walking (On) | Walking (Off) |
|---|
| Average variation (Magnitude) | 257.86 | 258.89 |
| Dispersion (Magnitude) | 1865.85 | 2511.79 |
| Observed number | 100 | 100 |
| Degrees of freedom | 99 | 99 |
| F proportion | 0.7428381 | |
| P (F ≤ f) one-sided test | 0.0704417 | |
| F-rejection value one-sided test | 0.7721233 | |
| Result | F-rejection value > F proportion |
Table 4.
Experimental classification results for properly wearing, improperly wearing, and not wearing the safety helmet according to worker activity.
Table 4.
Experimental classification results for properly wearing, improperly wearing, and not wearing the safety helmet according to worker activity.
| | | Predicted Class (Cross-validation Folds 30) |
|---|
| Sitting | Standing | Resting | Hammering | Painting | Walking | Running | Going Up Stairs | Going Down Stairs | Transporting | Climbing Ladder | Not Wearing Helmet | Accuracy (%) |
|---|
| on | off | on | off | on | off | on | off | on | off | on | off | on | off | on | off | on | off | on | off | on | off | | |
|---|
| Actual Class | Sitting | on | 12,389 | 41 | 33 | 50 | 49 | 46 | 25 | 20 | 27 | 34 | 6 | 12 | 0 | 5 | 10 | 8 | 3 | 0 | 12 | 6 | 4 | 4 | 16 | 96.79 |
| off | 34 | 12,388 | 72 | 32 | 72 | 41 | 14 | 13 | 31 | 25 | 2 | 3 | 0 | 1 | 6 | 4 | 2 | 2 | 2 | 0 | 1 | 4 | 51 | 96.78 |
| Standing | on | 42 | 52 | 12,380 | 38 | 62 | 48 | 24 | 15 | 36 | 34 | 0 | 2 | 0 | 2 | 2 | 2 | 5 | 1 | 0 | 0 | 2 | 2 | 51 | 96.72 |
| off | 25 | 44 | 48 | 12,423 | 54 | 62 | 18 | 18 | 25 | 20 | 6 | 2 | 2 | 6 | 3 | 2 | 0 | 0 | 0 | 14 | 2 | 2 | 24 | 96.79 |
| Resting | on | 28 | 54 | 68 | 69 | 12,389 | 43 | 14 | 8 | 34 | 24 | 2 | 2 | 0 | 4 | 0 | 7 | 1 | 0 | 4 | 6 | 0 | 6 | 37 | 96.79 |
| off | 44 | 46 | 34 | 54 | 43 | 12,396 | 23 | 20 | 50 | 30 | 5 | 6 | 4 | 0 | 2 | 4 | 0 | 5 | 2 | 2 | 10 | 2 | 18 | 96.84 |
| Hammering | on | 19 | 8 | 22 | 8 | 2 | 36 | 12,448 | 32 | 26 | 43 | 26 | 18 | 9 | 2 | 16 | 8 | 4 | 8 | 16 | 26 | 6 | 15 | 2 | 97.25 |
| off | 23 | 14 | 21 | 14 | 21 | 12 | 35 | 12,430 | 18 | 20 | 22 | 18 | 11 | 10 | 25 | 12 | 10 | 16 | 6 | 26 | 12 | 22 | 2 | 97.11 |
| Painting | on | 35 | 17 | 29 | 34 | 38 | 27 | 30 | 23 | 12,412 | 38 | 15 | 16 | 8 | 7 | 6 | 6 | 6 | 4 | 16 | 14 | 10 | 4 | 5 | 96.97 |
| off | 32 | 32 | 26 | 32 | 19 | 39 | 26 | 28 | 46 | 12,392 | 14 | 25 | 0 | 0 | 14 | 11 | 0 | 8 | 20 | 16 | 10 | 4 | 6 | 96.81 |
| Walking | on | 10 | 6 | 2 | 2 | 4 | 1 | 20 | 16 | 15 | 12 | 12,444 | 25 | 30 | 25 | 18 | 13 | 30 | 23 | 20 | 22 | 22 | 40 | 0 | 97.22 |
| off | 9 | 0 | 2 | 6 | 4 | 6 | 15 | 16 | 7 | 4 | 40 | 12,419 | 25 | 34 | 19 | 20 | 34 | 8 | 40 | 29 | 26 | 37 | 0 | 97.02 |
| Running | on | 2 | 0 | 0 | 0 | 2 | 2 | 9 | 9 | 4 | 4 | 30 | 13 | 12,413 | 37 | 41 | 48 | 41 | 34 | 26 | 23 | 38 | 24 | 0 | 96.98 |
| off | 7 | 0 | 0 | 2 | 2 | 0 | 4 | 11 | 3 | 2 | 26 | 22 | 52 | 12,414 | 22 | 40 | 40 | 40 | 24 | 20 | 44 | 25 | 0 | 96.47 |
| Going Up Stairs | on | 6 | 6 | 2 | 12 | 0 | 7 | 20 | 16 | 14 | 5 | 30 | 38 | 34 | 38 | 12,348 | 38 | 18 | 28 | 34 | 36 | 40 | 30 | 0 | 96.47 |
| off | 0 | 4 | 7 | 6 | 0 | 4 | 6 | 6 | 8 | 9 | 32 | 28 | 36 | 33 | 34 | 12,388 | 26 | 32 | 35 | 16 | 36 | 54 | 0 | 96.78 |
| Going Down Stairs | on | 2 | 0 | 0 | 2 | 4 | 2 | 4 | 18 | 6 | 4 | 30 | 38 | 50 | 34 | 40 | 40 | 12,370 | 32 | 36 | 18 | 34 | 36 | 0 | 96.64 |
| off | 5 | 0 | 0 | 2 | 4 | 1 | 10 | 12 | 8 | 6 | 34 | 28 | 37 | 29 | 31 | 22 | 25 | 12,423 | 22 | 32 | 30 | 37 | 2 | 97.05 |
| Transporting | on | 4 | 2 | 4 | 4 | 2 | 3 | 22 | 30 | 10 | 14 | 47 | 36 | 28 | 20 | 22 | 12 | 20 | 34 | 12,416 | 30 | 20 | 20 | 0 | 97.0 |
| off | 0 | 4 | 2 | 2 | 2 | 6 | 16 | 22 | 10 | 4 | 35 | 24 | 41 | 30 | 22 | 22 | 24 | 18 | 44 | 12,397 | 34 | 40 | 1 | 96.85 |
| Climbing Ladder | on | 3 | 2 | 6 | 2 | 4 | 1 | 16 | 6 | 4 | 6 | 29 | 32 | 38 | 28 | 26 | 48 | 42 | 34 | 18 | 32 | 12,405 | 16 | 1 | 96.92 |
| off | 11 | 4 | 2 | 4 | 4 | 2 | 13 | 20 | 6 | 6 | 28 | 32 | 24 | 30 | 28 | 38 | 41 | 34 | 27 | 20 | 20 | 12,406 | 0 | 96.92 |
| Not Wearing Helmet | 22 | 50 | 47 | 37 | 36 | 17 | 2 | 0 | 6 | 2 | 0 | 2 | 0 | 0 | 1 | 1 | 0 | 0 | 0 | 0 | 0 | 0 | 12,577 | 98.26 |
| Average | | 96.95 |
Table 5.
Results of analysis of the recognition accuracy and number of data for properly wearing, not wearing, and improperly wearing the safety helmet for each worker activity.
Table 5.
Results of analysis of the recognition accuracy and number of data for properly wearing, not wearing, and improperly wearing the safety helmet for each worker activity.
| | No. of Data | Accuracy (%) |
|---|
| Normally Wearing Helmet | 140,800 | 96.89 |
| Abnormally Wearing Helmet | 140,800 | 96.90 |
| Not Wearing Helmet | 12,800 | 98.26 |
© 2018 by the authors. Licensee MDPI, Basel, Switzerland. This article is an open access article distributed under the terms and conditions of the Creative Commons Attribution (CC BY) license (http://creativecommons.org/licenses/by/4.0/).


