Article

Using the Taguchi-Genetic Algorithm to Improve Lithographic Photoresist Operating Conditions of Touch Panels to Upgrade After-Develop Inspection

1
Department of Industrial Management & Institute of Industrial Engineering and Management, National Formosa University, Huwei, Yunlin 63201, Taiwan
2
Smart Machine and Intelligent Manufacturing Research Center, National Formosa University, Huwei, Yunlin 63201, Taiwan
3
Department of Commerce Automation and Management, National Pingtung University, Pingtung City, Pingtung County 90004, Taiwan
*
Author to whom correspondence should be addressed.
Appl. Sci. 2018, 8(12), 2382; https://doi.org/10.3390/app8122382
Submission received: 12 October 2018 / Revised: 5 November 2018 / Accepted: 21 November 2018 / Published: 25 November 2018
(This article belongs to the Section Materials Science and Engineering)

Abstract

:
In order to use touch control products more conveniently, a general objective is to develop lighter and smaller touch panels. A touch panel using the one glass solution (OGS) is an important development. The black matrix (BM) in an OGS touch panel is used as a black frame. The photoresist is divided into a positive photoresist and a negative photoresist. The BM photoresist is negative. After coating, exposure, and development in the BM process, after-develop inspection is implemented to check if the appearance is abnormal. It is quite difficult to rework the negative photoresist process. There is still room for improving the BM photoresist process capability Cpk. Thus, in order to reduce the customer complaint rate and enhance stability, the photolithography process is improved to enhance Cpk. Among the BM black negative photoresist forming process conditions of OGS products, the pre-baking time is the most important process control factor. The method set up herein improves the original Cpk = 0.90. This study employs the fast messy genetic algorithm (fmGA) to select the optimum orthogonal array of the Taguchi method, so as to implement the decision process of optimum parameter design. The Cpk of the optimum parameter is 2.12.

1. Introduction

Technology products have almost become indispensable in the modern world, as the mobile phone was upgraded to the multi-touch smart phone, the digital photo frame evolved into the tablet PC, the notebook computer evolved into the detachable touch-screen notebook computer, and wearable devices developed into the smart watch. All these consumer electronics products represent extensive applications of touch panels [1]. Panels are divided into touch panels and color filter panels, and many panel processes are identical. The constituent structure is divided into array, cell, and module manufacturing stages. The array process contains thin film, lithography, and etching processes [2]. This study discusses the photolithography process of the array stage.
The one glass solution (OGS) of touch panel technology means that the old combination of multiple functional glasses changes into the solution using one single glass touch panel. The difference from the general touch panel is that the OGS structure is combined with the functions of touch control and LENS/Cover Glass. Therefore, the OGS touch panel is more esthetic and stronger than a simple touch panel, and the combination of LENS/Cover Glass can be reduced, such that overall glass thickness decreases a substantial amount.
The OGS structure has an artistic black matrix (BM) for display frame printing, shading the backlight, and upgrading the overall texture. The BM produces a BM pattern in the color filter panel process to separate the transmission of color resist. The BM is produced through coating and a negative photoresist. The BM is formed by a photoresist in the OGS panel and is used as a black frame of the OGS touch panel, but it is completed before the capacitive circuit process of the touch panel. The LENS/Cover Glass is then replaced when the BM is done. However, the LENS/Cover Glass uses ink universally, and the general BM for OGS is a negative photoresist, so the production is different from LENS/Cover Glass. After coating, exposure, and development in the BM process, after-develop inspection (ADI) is implemented to check if the appearance is abnormal. The width, opening, and line spacing data after BM photoresist development are measured using optical microscopy (OM), and it is determined whether or not the measured data are within the product specification.
In order to use touch control products more conveniently, a general objective is to develop lighter and smaller touch panels. Touch panels using OGS are an important development. The major difference between the OGS touch panel and traditional touch panels is that the artistic appearance and protective function of Cover Glass are integrated into the touch panel, so that the OGS touch panel process can be combined with an artistic appearance. The BM photoresist process influencing the appearance of the OGS touch panel often results in customer complaints about the appearance abnormalities, or in influences on the function. The BM in an OGS touch panel is used as a black frame. The photoresist is divided into positive and negative. The BM photoresist is negative.
It is quite difficult to rework the negative photoresist process. If the product exceeds the specification, the product is rejected, and the production expense is wasted. There is still room for improving the BM photoresist process capability Cpk (Appendix A). The photolithography process is an important step, which must be improved to enhance Cpk [3], in order to decrease customer complaint frequency and increase stability. This study proposes an experimental design method for improving the touch panel industry according to lithographic photoresist operating conditions. Related parameters include temperature, exposure, concentration, vacuum pressure, light rays, and humidity. The purpose is to find and master the optimum parameters, establish stable photoresist operating conditions, and enhance the process capability. This study set up a demonstration and used the hybrid Taguchi-genetic algorithm to solve the quality stability problems in BM black negative photoresist forming and size of the OGS product [4,5,6,7]. The performance was measured in a flow chart and improved by Taguchi quality engineering [8,9,10]. The BM black negative photoresist build-up dimension of the OGS product was taken as the experimental subject, in order to find a development model for a BM black negative photoresist forming stability for OGS products. The optimized experimental level combination of the BM black negative photoresist build-up dimension of the OGS product in the process was found to produce the optimum parameters meeting a satisfactory level, thus reducing the wasted expenses of additional defects, and improving the process.

2. Literature Review

Among the important issues of the multiple-stage manufacturing process, developing a robust parameter design (RPD) in good time is a difficult research task [11]. As the random processing principle cannot be precisely implemented in the experimental design, noise factors have adverse effects on experiments. This phenomenon occurs in different places at different stages in this document. After this document is improved, by considering only a single set of noise factors, the optimum design method can be developed, the system optimization process can be effectively designed, and the key issue proposed by this document can be solved by the modified minimum aberration criterion [9]. A hybrid system is utilized as a potential tool to deal with construction engineering and management problems [12].
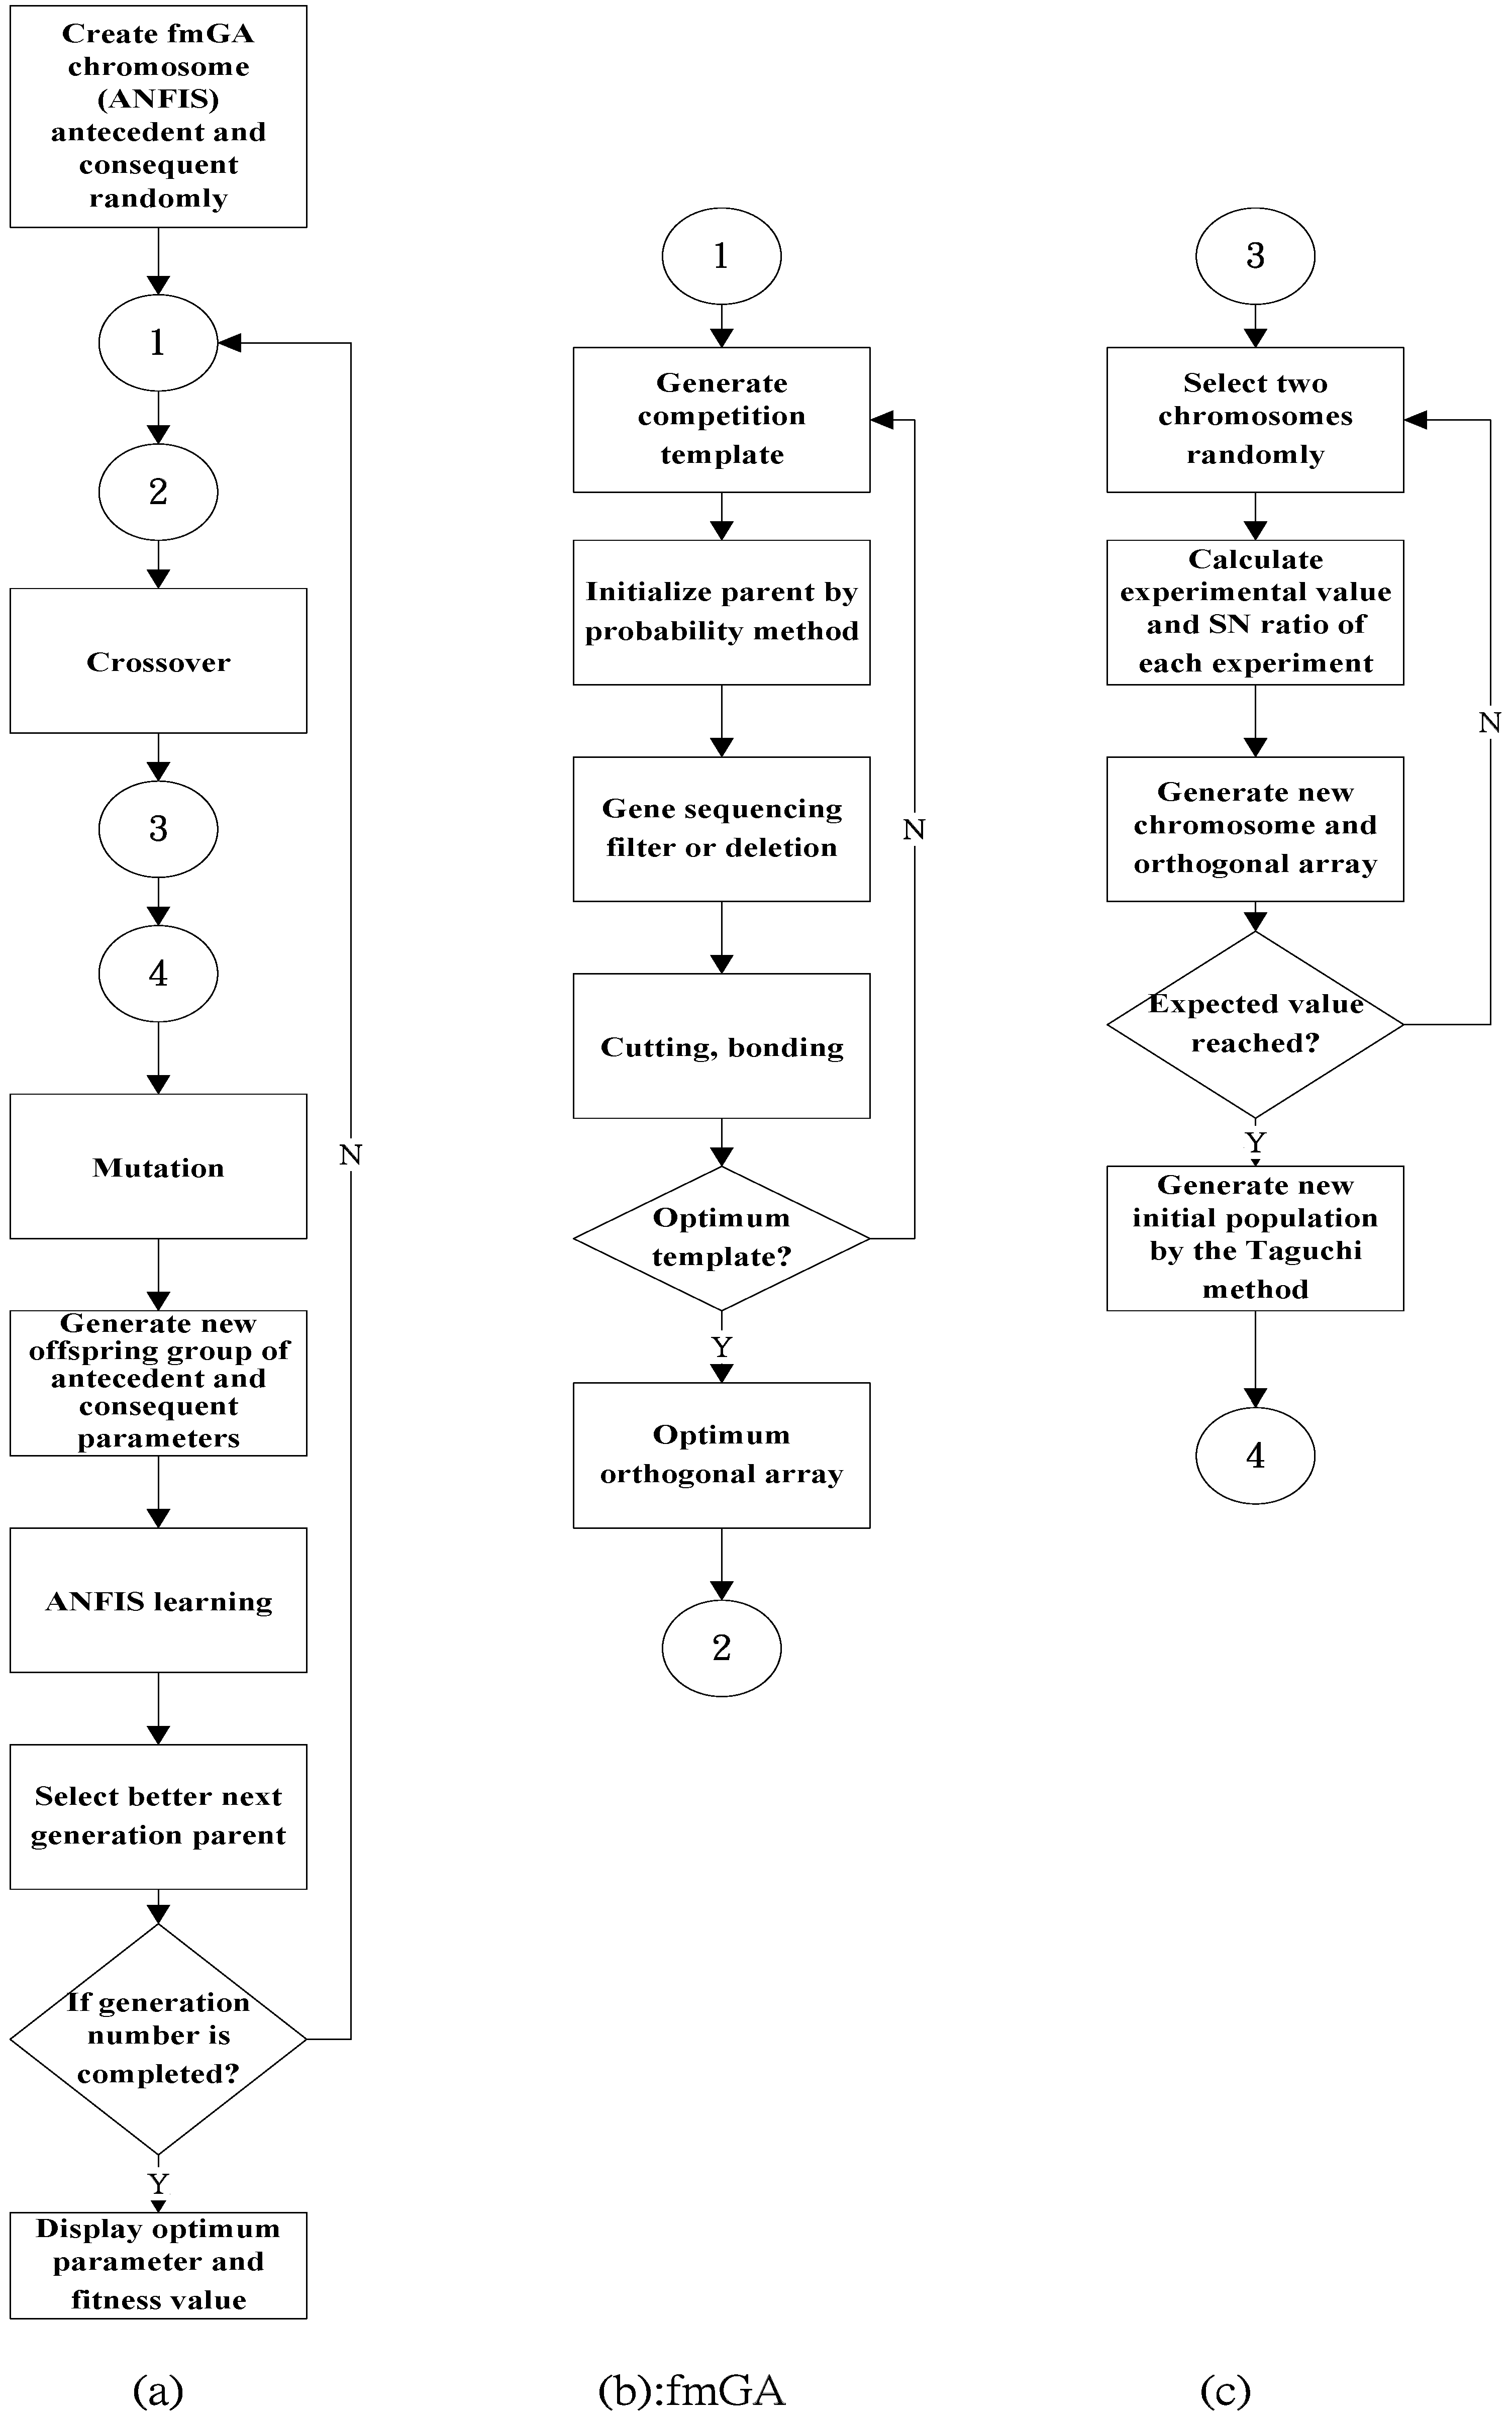
This study integrates a rapid fuzzy genetic algorithm (fmGA) [12] with a support vector machine (SVM) and develops an innovation artificial intelligence model. The early prediction of dispute propensity is used in the initial stage of calculation for public-private partnership projects, and is one of the key concepts of fmGA-based SVM (GASVM) [12]. While the fmGA optimizes the SVM parameters, the main value of SVM is the optimization application of the learning rate and curve. The curve and synthesis indices are employed for performance evaluation of the proposed hybrid intelligence classification model. The overall performance of the method developed by this document is different from other references, as it has better evaluation. Line balancing and scheduling are complex problems, and while there are several methods to solve related problems, they may not be effective [13]. An improved hybrid genetic algorithm (GA) is proposed in this document, and an effective solution can be proposed for this type of subject. This type of problem addresses how to assign the work and schedule the work station. Use of the hybridized dynamic programming optimization process can attain better schemes. Within a specific time, the chromosome can be transformed to implement a better solution. This document proposes a partial diversity maintaining method to avoid the algorithm falling into local optimum solutions [14].
This reference indicates that the optimal design process of electrical discharge machining (EDM) processes will be implemented by integrating physical and neural networks [15]. Related important studies seldom mentioned the classification of parameters or the model building process. This document integrates a fuzzy neural network with mathematical model building to solve problems.
The method proposed in this study is compared with other methods; previous studies have not compared this type of method. The optimal design of water-cooled condensers is the subject of optimization in this study, which integrates nonlinear programming with multiple inputs and outputs [16]. This document applies the Taguchi method and an inverse-model to implement the critical steps of optimal design. In this experimental process, the full factorial design for the minimum number of experiments with the optimum orthogonal table of key factors are found by the Taguchi method. Afterwards, an inverse model, as developed in this document, is put into an artificial neural network system with multiple inputs and outputs, in order to implement the critical steps of optimal design.
It is very complex to correctly predict the various parameters of the Taiwan Stock Exchange Capitalization Weighted Stock Index (TAIEX) and Hang Seng Stock Index (HSI). This document integrates time series, fuzzy theory, and an artificial neural network [17] to implement better predictive validity. The result shows that different data types will significantly improve different prediction methods. The Vapor Assisted Petroleum Extraction (VAPEX) process is an important and complex work, as fractures that increase recovery are among the important issues that must be discussed [18]. This document integrates fuzzy theory with an adaptive neural network to analyze the chain effect, resulting from the geometric fracture parameters in VAPEX, and develops the optimum parameter design process for decision makers.

3. Research Method and Process Architecture

This study’s experiment measures the lithography BM negative photoresist build-up dimension on the OGS touch panel and uses the pattern hole size measurement data as a response value, i.e., the nominal-the-best characteristic, hoping to make the measured data meet the quality standard, in which the quality characteristic has a nominal-the-best characteristic [19]. The photoresist build-up dimension is taken as the target characteristic. There are many types of factors influencing the BM photoresist build-up dimension, which vary with the customer requirement or operation specification. If the selected operating conditions are inappropriate, then the photoresist build-up dimension will be impacted.
The execution steps herein were designed according to the research method, and the controllable factors in the photolithography process proposed by previous scholars and experts were applied to the BM photoresist build-up dimension influencing factors. The better decision effect was validated, and the key method to be improved first was then selected according to the requirement. The results were compared comprehensively, so that the process capability was more enhanced. This study analyzed the lithographic photoresist production operation conditions of touch panel plants, so the subjects of expert interviews were photolithography process engineers and process integration engineers in the touch panel industry. The engineers’ experiences and the photoresist manufacturer’s product operating conditions are discussed. All of the factors that may influence the BM negative photoresist build-up dimension ADI are drawn into a characteristic diagram. The photolithography process engineers and process integration engineers were interviewed to determine factors influencing the BM negative photoresist build-up dimension ADI, so as to remove the unnecessary factors for analyzing the hybrid Taguchi-genetic algorithm.

3.1. Hybrid Taguchi-Genetic Algorithm

This study integrated a genetic algorithm and the Taguchi experimental solution [8,9]. The Taguchi experimental solution was used to improve the crossover steps of the genetic algorithm, because the Taguchi experimental design method has a systematic inference capability [20]. It replaces the traditional random crossover and effectively generates excellent offspring [21]. The traditional genetic algorithm often gets into a local optimum [22]. The method can remedy the defects in GA [23], and this study employs an optimum orthogonal array of the Taguchi method [22], so as to implement the decision process of optimum parameter design [24,25]. Figure 1 illustrates the research process.

3.2. fmGA—Determining the Process Control Factors

The traditional genetic algorithm generates many calculation points randomly. Each iterative process takes the relatively optimum point, usually finding the local optimum, and the searched optimal solution may be different each time. Getting into the local optimum instead of searching out the actual global optimum is a defect in the traditional genetic algorithm, which should be remedied. The encoding mode is improved from binary coding to real number coding [21]. The Taguchi method can simultaneously enhance robustness and convergence efficiency.

4. Generation of Initial Chromosomes

The procedure of generating M initial chromosome groups is described below. A set of chromosomes ( v 1 , v 2 , , v i , , v N ) represents a set of N parameters to be determined [13]:
Procedure:
(1)
Generate a random number β , where β [ 0 , 1 ] .
(2)
v i = q i + β ( s i q i ) , where q i is the lower bound values of v i , and s i is the upper bound values of v i [8].
(3)
Duplicate the aforesaid two steps N times, so as to generate a set of chromosomes ( v 1 , v 2 , , v i , , v N ) [20].
(4)
Repeat Steps (1) to (3) M times, so as to generate the group containing M initial chromosomes [23].

5. Selection and Reproduction

The fmGA is based on messy genetic algorithms (mGAs). The chromosome of the fmGA is divided into allelelocus and allele values. The allelelocus represents the allele number, and the allele value is the numerical value of the allele number. Figure 2a shows the chromosome complement of fmGA. In addition, the fmGA does not fix the chromosome length, as it can handle the over-specified chromosome after the cut-splice operation [12]. If a chromogene is over-specified (Chromosome A2), then the fmGA uses the first-come-first-serve rule of browsing from left to right to screen the repeated allele value (final allele value of Chromosome A2 is 111100), as shown in Figure 2b. The major difference between fmGA and the traditional genetic algorithm is that fmGA uses a variable string length, and the allelelocus and allele values can evolve simultaneously, which is suitable for handling high netting variability. The Taguchi analysis sheet of different level factors is optional.
As the class interval of numerical magnitude distribution of the factor data is very large, it is normalized to 0 to 1 before it is imported into fmGA. Normalization is expressed as Equation (1). The purpose of normalization is to convert the influence factors of different numerical values and performance objective ground acceleration to the same interval, so as to increase the accuracy of analysis.
v i * ( k ) = v i ( k ) min [ v i ( k ) ] max [ v i ( k ) ] min [ v i ( k ) ]
where
  • v i * ( k ) : numerical value after variable normalization;
  • v i ( k ) : initial value before variable normalization.

5.1. Crossover

The crossover operation selects two chromosomes from the population randomly, and the bits exchanged mutually form another two chromosomes. The simplest crossover operation is one-point crossover. The crossover point of two chromosomes is selected randomly, and all the bits after this crossover point of the two chromosomes are exchanged. This paper utilizes the linear interpolation method. First, the crossover rate is set. If the random value is smaller than the crossover rate, then the crossover operation begins. A crossover point is selected randomly from the selected two chromosomes. The linear interpolation method of convex set theory is then employed for the randomly selected two different chromosomes v and y , expressed as Equations (2) and (3) [12].
v = ( v 1 , v 2 , , v i , v j , v k , , v N )
y = ( y 1 , y 2 , , y i , y j , y k , , y N )
The linear interpolation crossover is implemented mutually. When the genetic codes v i and y i decide on a crossover, the generation of new genetic codes is expressed as Equations (4) and (5):
v i = v i + β ( y i v i )
y i = q i + β ( s i q i )
where β is the random number value of [ 0 , 1 ] , q i is the lower bound values of y i , s i is the upper bound values of y i , and the new chromosomes v and y after crossover are expressed as Equations (6) and (7) [20].
v = ( v 1 , v 2 , , v i , v j , v k , , v N )
y = ( y 1 , y 2 , , y i , y j , y k , , y N )

5.2. Mutation

The mutation generates a diversified chromosome population. The procedure of the chromosomal mutation is as follows [20].
(1)
Select a chromosome v = ( v 1 , v 2 , , v i , v j , v k , , v N ) ; it is mutated if the mutation rate is reached.
(2)
Select a gene of a chromosome randomly for mutation, assuming v i is the gene mutation.
(3)
Generate a random number α in the range of [ 0 , 1 ] .
If α 0.5 , then execute v i = v i + β ( s i v i ) .
If α < 0.5 , then execute v i = v i + β ( v i s i ) .
where β is the random number value of [ 0 , 1 ] , q i is the lower bound values of v i , and s i is the upper bound values of v i [20].
(4)
The new offspring x after the chromosomal mutation is expressed as v = ( v 1 , v 2 , , v i , v j , v k , , v N ) .

5.3. Architecture of ANFIS

The Sugeno fuzzy model is represented by the Adaptive Network-Based Fuzzy Inference System (ANFIS) architecture. The antecedent and consequent parameters of Sugeno fuzzy rules can be determined by using a neural network learning algorithm. In other words, the Sugeno fuzzy model can be provided with a self-learning ability to adjust the optimum fuzzy rules by itself [15].

5.3.1. Layer 1 Input Layer

On Layer 1, the input variable is mapped into the fuzzy set, expressed as Equation (8), where μ j ( v i ) represents the membership function of the i input variable in the j set. The membership function is assumed to be a bell-shaped function. There are three parameters a j i , b j i , c j i [16].
O 1 , j i = μ j ( v i ) = 1 1 + | v i c j i a j i | 2 b j i , i = 1 , 2 , , N ; j = 1 , 2 , , M

5.3.2. Layer 2 Rule Layer

The neuron of Layer 2 calculates the fitness of fuzzy rules. The fuzzy sets of input variables are combined and paired before fuzzy logic operation, expressed as Equation (9). This layer uses T-norm for fuzzy AND operation, where the AND or product operation is represented by symbol Π [17].
O 2 , z = w z = Π i = 1 N μ j ( v i ) , j = 1 , 2 , , M ; z = 1 , 2 , , Z

5.3.3. Layer 3 Normalization Layer

The neuron of Layer 3 normalizes the fitness, expressed as Equation (10). The node of this layer is represented by symbol N [18]. The output result of No. i rule is divided by the total output result of all rules, so that the output value is 0 to 1 [18].
O 3 , z = w z ¯ = w z z = 1 Z w z

5.3.4. Layer 4 Conclusion Inference Layer

The neuron of Layer 4 executes an inference operation of each fuzzy rule, expressed as Equation (11) [17]. The upper normalization result is multiplied by the Sugeno fuzzy model, expressed as Equation (10), where r z i is the correlation coefficient of the primary Sugeno fuzzy model. The consequent parameter is the parameter generated by this layer [16].
O 4 , z = w z ¯ f z = w z ¯ ( i = 0 N r z i v i + r z o ) ,   v 0 = 1

5.3.5. Layer 5 Output Layer

Layer 5 has only one neuron, by calculating the sum of the neuron output values in the upper layer, expressed as Equation (12), as the final output value of the network [15].
O 5 , 1 = z = 1 z w z ¯ f z = z = 1 z w z f z z = 1 z w z

6. ANFIS Learning Parameters

When the Sugeno fuzzy model is replaced by ANFIS, the neural network learning algorithm can be used to adjust the parameters of the Sougrno fuzzy rules. The antecedent parameters a j i , b j i , c j i have to be determined, as well as the consequent parameters. The determination of these parameters is obtained through a learning algorithm from the input data and output data. In other words, we can build an ANFIS network, so that all the parameters in the Sugeno fuzzy rules receive learning. The ANFIS network after learning can represent or approximate the input–output data relationship. The ANFIS parameters use a hybrid learning method [15,16].
(1)
The antecedent parameter is fixed—namely, the antecedent parameter is assumed to be given.
(2)
All input data are imported into the network. The optimum consequent parameter is estimated by the least-square estimator (LSE), and the approximate output value is obtained.
(3)
The ANFIS network output value is compared with the target output value, thus obtaining the output error.
(4)
The antecedent parameter adjustment is deduced by the steepest descent method.
(5)
Return to Equation (1) and continue learning until the output error is small enough.

7. Case Analysis and Discussion

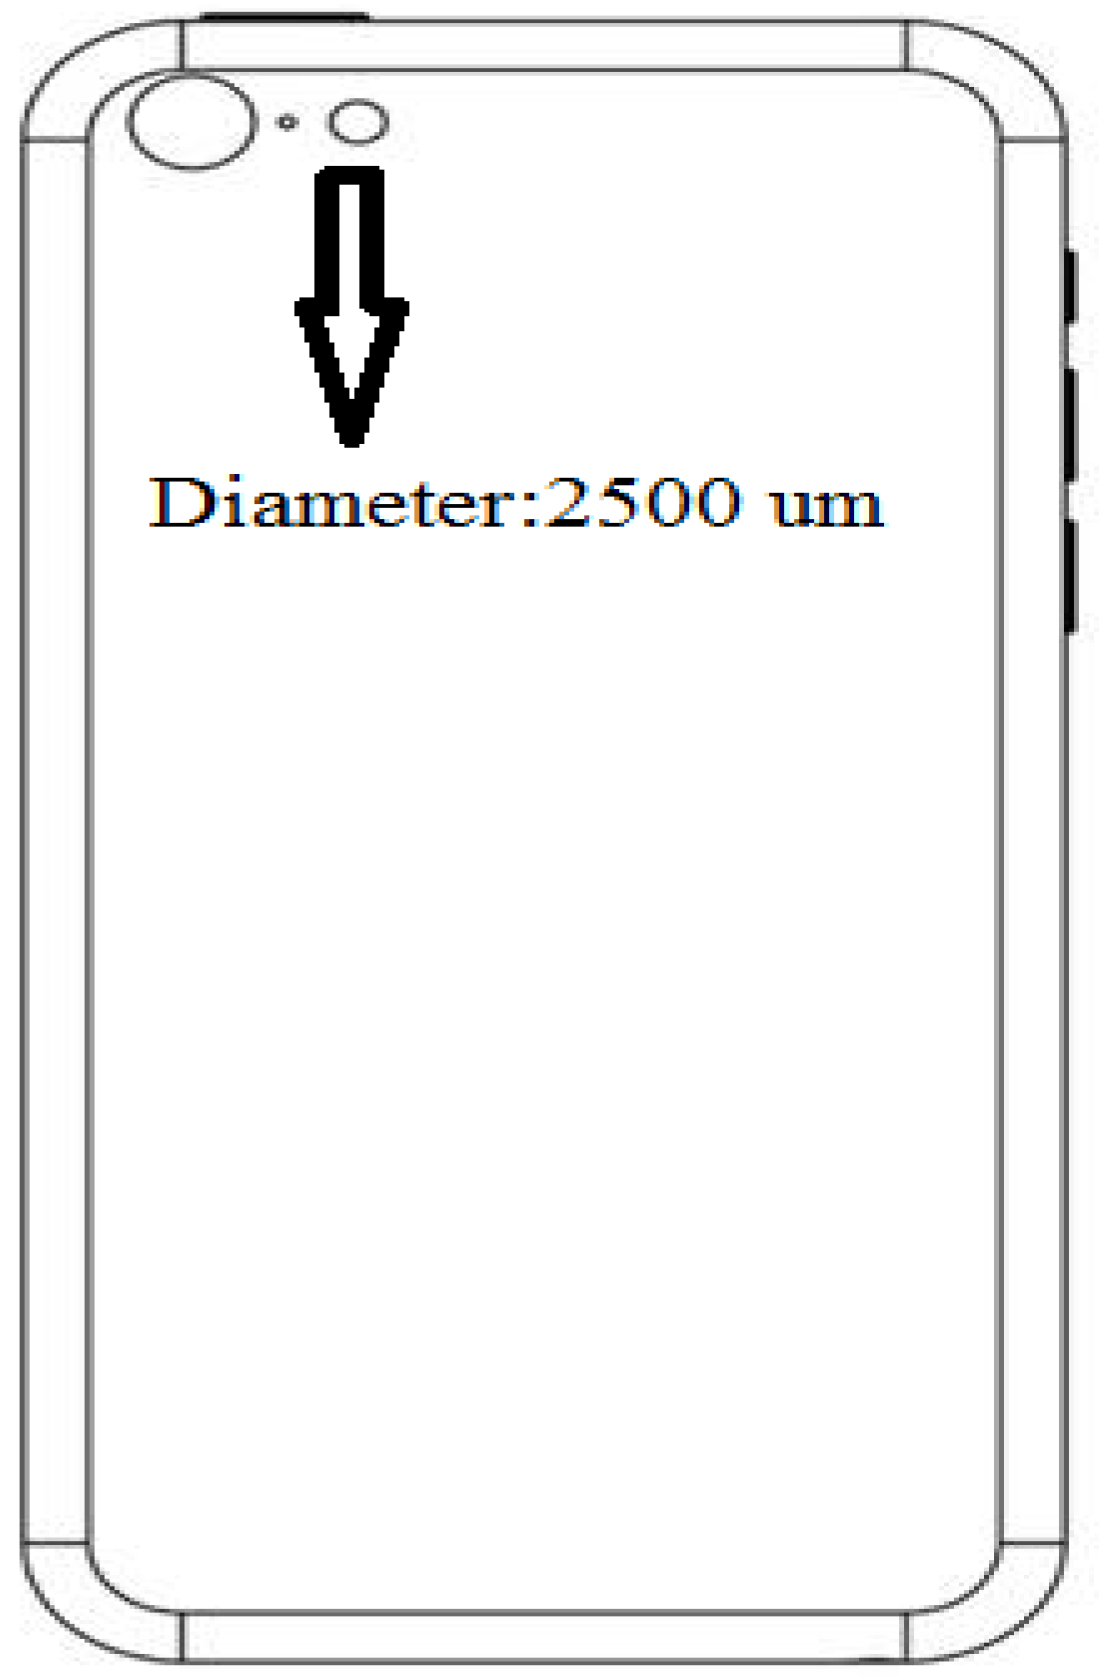
An Optical Measuring Machines (OMM) dimensional measurement precision microscope was used at 2500 μm for the BM photoresist ADI, as shown in Figure 3.
Current condition measurement: The present Cpk process capability of BM photoresist build-up dimension was analyzed. The key success factors shown are the study design and the results, as shown in Table 1.
The dimension process capability index Cpk = 0.9 < 1.33, meaning the process is unstable. Because the process capability is insufficient, there is large room for improvement.
In this study, human factors include immature skill, insufficient training, and misoperation; environmental factors include temperature, humidity, and light rays; material factors include exposure, overtime, concentration, and temperature; method factors include exposure, development rate, and pre-baking time; machine factors include feed rate, part failure, and vacuum pressure. All of these factors may cause problems in the lithography BM photoresist operation build-up dimension.
Data analysis: The factors were analyzed and confirmed by interviews with experts, and the factors that influence the BM negative photoresist build-up dimension ADI were determined by interviewing photolithography process engineers and process integration engineers, so as to remove the unnecessary factors in implementing the analysis of the hybrid Taguchi-genetic algorithm. The factors and levels influencing the BM photoresist build-up dimension were analyzed according to the lithographic photoresist operating conditions influencing ADI, as shown in Table 1.
After fmGA analysis, the two-level and three-level factors were collected simultaneously, while the experimental data were collected by an orthogonal array of mixed level L 18 ( 2 1 × 3 7 ) . According to the results in Table 2, the root mean square error (RMSE) [11] value of training examples ranges from 0.039 to 0.058, as the input variable and output variable were normalized to 0 to 1. This result is fairly good. The RMSE of the test examples ranges from 0.012 to 0.031, which is a better result than that of the training examples.
The experiment was conducted and the data were collected according to the orthogonal array configuration, with limited samples used for the experiment. This experiment hopes to optimize the BM photoresist build-up dimension, but the quality characteristic of Toor is in percentage form in this study. If the quality characteristic is in percentage form, then, when the value approaches 0 or 100, the additivity is very bad, so the deficiency is remedied. The Taguchi method implements Ω transformation (Omega transformation) for the quality characteristics in percentage form. The experimental data with additivity are obtained by Ω transformation, and the signal/noise (SN) ratio was worked out of these data.
When the experimental control factor and level table were completed, the orthogonal array was created. The two-level and three-level factors were collected simultaneously in this experiment. The experimental data were collected by a mixed-level orthogonal array, and the table shows the factor level setting for control factors.
The experimental process employs finite authentic specimens to simulate the normal operating conditions. The correct detected number in Table 3 was converted into percentage form, and the SN ratio of each experiment was obtained after Ω transformation of the Taguchi method, as shown in Table 3. As this experiment employed the nominal-the-best characteristic, the SN ratio of each experiment was calculated by Ω transformation of the Taguchi method.
The factorial effect was calculated by subtracting the minimum value from the maximum value of various levels; the larger the figure, the more important the factor, as shown in Table 4.
“Others” in Table 5 are regarded as errors. The variance of Factors A and B is smaller than that of Others, so they are considered as factors without influence. In other words, the variation caused by Factors A and B is regarded as an occasional phenomenon caused by experimental error, so these variations can be regarded as errors. The variation caused by Factors A and B is pooled to errors. The table shows the analysis result of variance after the Others term and Factors A and B are pooled to the error term.
“Others” in Table 6 are regarded as errors. The variance of Factors A and B is smaller than Others, so they are considered as factors without influence. In other words, the variation caused by Factors A and B is regarded as an occasional phenomenon caused by experimental error, so these variations can be regarded as errors. The variation caused by Factors A and B is pooled to errors. The table shows the analysis result of variance after the Others term and Factors A and B are pooled to the error term.
When the influence of factors reaches 90% confidence level, the table shows that those factors with enough influence are C, D, E, F, G, and H. The contribution of various control factors to the detection yield is also presented in the table. The contribution of various factors is thus validated. The contribution of a control factor represents the proportion of total quality loss caused by the variation of a factor, and it can be regarded as a simple index representing the influence of the change in a factor on total quality loss. It can be considered an index for judging the importance of factors.
According to the factor response table of the SN ratio, the optimum parameter combination is A1, B3, C1, D2, E2, F3, G2, and H1. Considering the influencing factors C1, D2, E2, F3, G2, and H1, the SN ratio of the original parameter combination was compared with the SN ratio of the optimum parameter combination, as shown in Table 7.
According to the table, when the original parameter combination is changed to the optimum parameter combination, the SN ratio increases from 21.36 to 28.39, or a rise of 7.03, which is expressed by Equation (13).
Δ S N = E C 1 1 + E D 3 2 + E E 2 2 + E F 2 3 + E G 2 2 + E H 2 1 = 7.03
If there is no interaction between factors, then the SN ratio in a factor combination is predicted by the following two equations below. This is the additive model—namely, when there is no interaction between factors, this additive model can be used to predict the relationship between response value and factor, expressed as Equations (14) and (15).
η o r i g i n a l = η ¯ + ( η ¯ C 1 η ¯ ) + ( η ¯ D 3 η ¯ ) + ( η ¯ E 2 η ¯ ) + ( η ¯ F 2 η ¯ ) + ( η ¯ G 2 η ¯ ) + ( η ¯ H 2 η ¯ )
η o p t i m a l = η ¯ + ( η ¯ C 1 η ¯ ) + ( η ¯ D 2 η ¯ ) + ( η ¯ E 2 η ¯ ) + ( η ¯ F 3 η ¯ ) + ( η ¯ G 2 η ¯ ) + ( η ¯ H 1 η ¯ )
where η ¯ is the general average of SN, where η o r i g i n a l = 21.36 , η o p t i m a l = 28.39 , and Δ S N = 28.39 21.36 = 7.03 .
After the calculation of the aforesaid equations, ΔSN is 7.03. Therefore, there is no interaction between factors, and this conclusion is reliable. The optimum parameter combination is obtained by the aforesaid analysis of variance (ANOVA) and factorial interaction validation, so that the appearance detection yield is increased. There is no interaction between factors as validated. The factors can be considered independently, so this conclusion is reliable. The factorial response value is also confirmed. The confirmation experiment is conducted again, two cycles are implemented, and each cycle has 7 data. Therefore, m r = 2 , expressed as Equations (16)–(18).
C L p e r d i t = η p e r d i t ± S m e × T I N V ( 1 α % , d o f )
C L p e r d i t = 23.81 ± 3.82 1.6 × T I N V ( 10 % , 8 ) = 23.81 ± 4.28
C L c o n f i r m = η c o n f i r m ± S m r × T I N V ( 1 α % , d o f )
C L c o n f i r m = 17.23 ± 3.82 1.2 × T I N V ( 10 % , 8 ) = 17.23 ± 4.16
C L = ± S 2 m e + S 2 m r × T I N V ( 1 α % , 1 , d o f )
C L = ± 4.28 2 + 4.16 2 = 4.29 .
In this reproducibility experiment, the difference between prediction value and confirmation experiment value is 4.28dB, and the 90% allowable error value is 4.29 dB. The difference value is within the permissible range, so this experiment is reliable. The optimum parameter combination is A1, B3, C1, D2, E2, F3, G2, and H1, and Cpk is 2.12. Considering the influencing factors C1, D2, E2, F3, G2, and H1, Cpk is 2.09.

8. Conclusions and Suggestions

8.1. Conclusions

This study imports items from a touch panel plant of Taiwan for a demonstration experiment in order to solve the problems in the BM black negative photoresist forming of OGS products and Cpk quality stability of the ADI size. The present performance in a flow chart is measured and improved using the Taguchi method.
This study takes the BM black negative photoresist build-up dimension of OGS products as the experimental subject, hoping to find a development model for the BM black negative photoresist forming stability of the OGS product. The optimum experimental level combination of the BM black negative photoresist build-up dimension of OGS products in the process was found. The optimum parameter combination is A1, B3, C1, D2, E2, F3, G2, and H1, and Cpk is 2.12; considering the influencing factors C1, D2, E2, F3, G2, and H1, Cpk is 2.09. Thus, the waste expense of additional defective units was reduced, and the process was improved.
The findings of the preliminary, readjusted, and final process condition analyses are presented below.
(1)
The BM black negative photoresist forming of OGS products is highly correlated with the photolithography process conditions’ pre-baking time, exposure, and development rate.
(2)
Among the BM black negative photoresist forming process conditions of OGS products, the pre-baking time is the most important control factor.
The method set up herein improves the original Cpk = 0.90. The Cpk of the optimum parameter is 2.12, meaning the process capability was enhanced very strongly. Therefore, the optimum BM black negative photoresist process parameter combination was indeed found by the Taguchi experiment analysis, the quality of products is guaranteed, and industrial competitiveness is greatly improved.

8.2. Suggestions

In future, different engineering designs can be analyzed and optimized using this decision-making technique.

Conflicts of Interest

The author confirms that this article content has no conflict of interest.

Appendix A

Process capability index (Cpk) (see Appendix) is generally regarded as evaluation indicator. Cpk < 1 denotes a defect, 1 Cpk < 1.33 denotes warning, and Cpk 1.33 denotes acceptance [31,32].
C p k = min ( C p u , C p l ) = ( 1 | C a | ) × C p
C p u = U S L μ 3 σ   ( Upper   specification   only )
C p l = μ L S L 3 σ   ( Lower   specification   only )
C a = | μ T arg e t | ( U S L L S L ) / 2
C p = U S L L S L 6 σ
where, USL is the upper limit of the specifications, μ is the process average value, LSL is the lower limit of the specifications, target is the median value of the specifications, and σ : is the standard deviation [31,32].

References

  1. Su, Y.T. Wireless charging/energy collection enhancement, easier power supply for wearable devices. Microelectronics 2015, 347. Available online: http://www.mem.com.tw/article_content.asp?sn=1501300001 (accessed on 10 December 2017).
  2. Chuang, T.R. VLSI Manufacturing Technology; Gau Lih Books: Taiwan, China, 2005. [Google Scholar]
  3. Chen, P.L.; Huang, Y.H.; Chen, Y.T. Build light touch control module, OGS/In-Cell simplified sensitive layer structure. Microelectronics 2012, 303. Available online: http://www.mem.com.tw/article_content.asp?sn=1203140011 (accessed on 9 December 2017).
  4. Huang, Y.; Wu, D.; Zhan, Z.; Chen, H.; Chen, S. EMD-based pulsed TIG welding process porosity defect detection and defect diagnosis using GA-SVM. J. Mater. Process. Technol. 2017, 239, 92–102. [Google Scholar] [CrossRef]
  5. Lan, T.S.; Chuang, K.C.; Chen, Y.M. Optimization of Machining Parameters Using Fuzzy Taguchi Method for Reducing Tool Wear. Appl. Sci. 2018, 8, 1011. [Google Scholar] [CrossRef]
  6. Makowski, K.; Matusiak, K.; Borowski, S.; Bielnicki, J.; Tarazewicz, A.; Maroszyńska, M.; Leszczewicz, M.; Powałowski, S.; Gutarowska, B. Optimization of a Culture Medium Using the Taguchi Approach for the Production of Microorganisms Active in Odorous Compound Removal. Appl. Sci. 2017, 7, 756. [Google Scholar] [CrossRef]
  7. Tan, T.H.; Chen, B.A.; Huang, Y.F. Performance of Resource Allocation in Device-to-Device Communication Systems Based on Evolutionally Optimization Algorithms. Appl. Sci. 2018, 8, 1271. [Google Scholar] [CrossRef]
  8. Yücel, E.; Saruhan, H. Design optimization of rotor-bearing system considering critical speed using Taguchi method. Proc. Inst. Mech. Eng. Part E J. Process. Mech. Eng. 2015, 231, 138–146. [Google Scholar] [CrossRef]
  9. Khalkhali, A.; Noraie, H.; Sarmadi, M. Sensitivity analysis and optimization of hot-stamping process of automotive components using analysis of variance and Taguchi technique. Proc. Inst. Mech. Eng. Part E J. Process. Mech. Eng. 2016, 231, 732–746. [Google Scholar] [CrossRef]
  10. Kuo, C.; Kao, H.; Wang, H. Novel design and characterisation of surface modification in wire electrical discharge machining using assisting electrodes. J. Mater. Process. Technol. 2017, 244, 136–149. [Google Scholar] [CrossRef]
  11. Neseli, S. Optimization of Process Parameters with Minimum Thrust Force and Torque in Drilling Operation Using Taguchi Method. Adv. Mech. Eng. 2014, 6, 925382. [Google Scholar] [CrossRef]
  12. Chou, J.S.; Cheng, M.Y.; Wu, Y.W.; Pham, A.D. Optimizing parameters of support vector machine using fast messy genetic algorithm for dispute classification. Expert Syst. Appl. 2014, 41, 3955–3964. [Google Scholar] [CrossRef]
  13. Yolmeh, A.; Kianfar, F. An efficient hybrid genetic algorithm to solve assembly line balancing problem with sequence-dependent setup times. Comp. Ind. Eng. 2012, 62, 936–945. [Google Scholar] [CrossRef]
  14. Faris, H.; Sheta, A.; Öznergiz, E. Modelling hot rolling manufacturing process using soft computing techniques. Int. J. Comput. Integr. Manuf. 2013, 26, 762–771. [Google Scholar] [CrossRef]
  15. Al-Ghamdi, K.; Taylan, O. A comparative study on modeling material removal rate by ANFIS and polynomial methods in electrical discharge machining process. Comput. Ind. Eng. 2015, 79, 27–41. [Google Scholar] [CrossRef]
  16. Huang, C.N.; Yu, C.C. Integration of Taguchi’s method and multiple-input, multiple-output ANFIS inverse model for the optimal design of a water-cooled condenser. Appl. Therm. Eng. 2016, 98, 605–609. [Google Scholar] [CrossRef]
  17. Wei, L.Y. A hybrid ANFIS model based on empirical mode decomposition for stock time series forecasting. Appl. Soft Comput. 2016, 42, 368–376. [Google Scholar] [CrossRef]
  18. Pendar, H.; Salehi, M.M.; Kharrat, R.; Zarezadeh, S. Numerical and ANFIS modeling of the effect of fracture parameters on the performance of VAPEX process. J. Petrol. Sci. Eng. 2016, 143, 128–140. [Google Scholar] [CrossRef]
  19. Luangpaiboon, P.; Chinda, K. Computer-based management of interactive data transformation systems using Taguchi’s robust parameter design. Int. J. Comput. Integr. Manuf. 2015, 28, 1030–1045. [Google Scholar] [CrossRef]
  20. Lee, Y.C.; Hsiao, Y.C.; Peng, C.F.; Tsai, S.B.; Wu, C.H.; Chen, Q. Using Mahalanobis–Taguchi system, logistic regression, and neural network method to evaluate purchasing audit quality. Proc. Inst. Mech. Eng. Part E J. Process. Mech. Eng. 2015, 229, 3–12. [Google Scholar] [CrossRef]
  21. Tsai, J.T.; Liu, T.K.; Chou, J.H. Hybrid Taguchi-genetic algorithm for global numerical optimization. IEEE Trans. Evol. Comput. 2004, 8, 365–377. [Google Scholar] [CrossRef]
  22. Fazlelahi, F.Z.; Pournader, M.; Gharakhani, M.; Sadjadi, S.J. A robust approach to design a single facility layout plan in dynamic manufacturing environments using a permutation-based genetic algorithm. Proc. Inst. Mech. Eng. Part E J. Process. Mech. Eng. 2015, 230, 2264–2274. [Google Scholar]
  23. Su, Y.; Chu, X.; Zhang, Z.; Chen, D. Process planning optimization on turning machine tool using a hybrid genetic algorithm with local search approach. Adv. Manuf. Eng. 2015, 7. [Google Scholar] [CrossRef] [Green Version]
  24. Chen, R.C.; Chen, J.; Chen, T.S.; Huang, C.C.; Chen, L.C. Synergy of Genetic Algorithm with Extensive Neighborhood Search for the Permutation Flowshop Scheduling Problem. Math. Probl. Eng. 2017. [Google Scholar] [CrossRef]
  25. Adhikary, D.D.; Bose, G.K.; Jana, D.K.; Bose, D.; Mitra, S. Availability and cost-centered preventive maintenance scheduling of continuous operating series systems using multi-objective genetic algorithm: A case study. Qual. Eng. 2016, 28, 352–357. [Google Scholar] [CrossRef]
  26. Barghash, M.A.; Alkaabneh, F.A. Shrinkage and Warpage Detailed Analysis and Optimization for the Injection Molding Process Using Multistage Experimental Design. Qual. Eng. 2014, 26, 319–334. [Google Scholar] [CrossRef]
  27. Qi, D.; Zhang, S.; Liu, M.; Lei, Y. An improved hierarchical genetic algorithm for collaborative optimization of manufacturing processes in metal structure manufacturing systems. Adv. Mech. Eng. 2017, 9. [Google Scholar] [CrossRef] [Green Version]
  28. Huang, H.C.; Xu, S.S.D.; Wu, C.H. A hybrid swarm intelligence of artificial immune system tuned with Taguchi–genetic algorithm and its field-programmable gate array realization to optimal inverse kinematics for an articulated industrial robotic manipulator. Adv. Mech. Eng. 2016, 8. [Google Scholar] [CrossRef] [Green Version]
  29. Jawahar, N.; Subhaa, R. An adjustable grouping genetic algorithm for the design of cellular manufacturing system integrating structural and operational parameters. J. Manuf. Syst. 2017, 44, 115–142. [Google Scholar] [CrossRef]
  30. Hiassat, A.; Diabat, A.; Rahwan, I. A genetic algorithm approach for location-inventory-routing problem with perishable products. J. Manuf. Syst. 2017, 42, 93–103. [Google Scholar] [CrossRef]
  31. Kane, V.E. Process capability indices. J. Qual. Technol. 1986, 18, 41–52. [Google Scholar] [CrossRef]
  32. Dudek-Burlikowska, M. Quality Estimation of Process with Usage Control Charts Type X-R and Quality Capability of Process Cp, CPK. J. Mater. Process. Technol. 2005, 162, 736–743. [Google Scholar] [CrossRef]
Figure 1. The research process [26,27,28,29,30].
Applsci 08 02382 g001
Figure 2. Over-specified chromosome of fmGA.
Applsci 08 02382 g002
Figure 3. The BM photoresist build-up dimension (nominal-the-best; diameter: 2500 μm).
Applsci 08 02382 g003
Table 1. Factor level setting for control factors.
Control FactorRangeCurrent LevelLevel 1Level 2Level 3
A. Target material temperature (°C)40~350170150170-
B. Toor (%) 10 1 ~ 10 8 0.00010.010.0010.000001
C. Prebaking time (S)100~350120120130140
D. Exposure (mj)100~450400360380400
E. Rate of development (M/min)2.5~42.82.72.82.9
F. Post-baking time (S)73001800170018001900
G. Post-baking temperature (°C)350240230240250
H. Exposure GAP (μm)20~400150140150160
Table 2. Fast messy genetic algorithm (fmGA) training and test results.
GroupABCDEFGHRMSE
LevelTraining exampleTest example
1111111110.0510.012
2112222220.0620.023
3113333330.0420.029
4121122330.0390.031
5122233110.0480.019
6123311220.0520.022
7131213230.0580.028
8132321310.0480.018
9133132120.0460.013
10211332210.0410.026
11212113320.0510.028
12213221130.0480.027
13221231320.0520.016
14222312130.0490.019
15223123210.0530.022
16231323120.0460.026
17232131230.0580.021
18233212310.0510.023
Table 3. Experimental data.
GroupA1A2A3A4A5A6A7MeanSDSN
10.940.940.930.940.920.950.940.940.0111.6
20.910.920.920.930.930.890.870.910.02210
30.930.930.930.930.940.920.950.930.0111.4
40.970.940.930.930.930.940.970.940.01812.3
50.900.900.900.890.910.890.900.900.0079.5
60.920.900.890.940.930.920.890.910.0210.2
70.910.920.860.910.920.900.890.900.0219.6
80.870.840.870.850.870.860.870.860.0127.9
90.770.720.720.750.750.750.760.750.0194.7
100.740.790.760.760.750.750.770.760.0165.0
110.760.740.760.760.740.760.750.750.014.8
120.950.940.930.940.920.940.940.940.0111.6
130.640.640.630.620.660.650.660.640.0152.6
140.930.930.890.870.910.920.920.910.02210
150.710.730.700.700.750.720.710.720.0184.0
160.930.930.940.970.970.940.930.940.01812.3
170.640.640.630.620.660.650.660.640.0152.6
180.920.900.890.910.920.860.910.900.0219.6
Table 4. Factor response table of the signal/noise (SN) ratio.
ABCDEFGH
Level 17.265.118.291.232.252.414.318.82
Level 24.246.211.089.979.343.566.894.81
Level 38.383.423.254.217.692.55.21
Range3.023.277.218.747.095.284.394.01
Rank78213546
Table 5. Preliminary analysis of variance.
FactorsSSDOFVar.
A1.6211.62
B0.4820.24
C301.282150.64
D326.932163.465
E255.232127.615
F189.87294.935
G209.232104.615
H168.32284.16
Others63.21231.605
Total1516.1717-
Table 6. SN error pooling.
FactorsSSDOEVar.FConfidenceSignificanceContribution
APooled0.001%
BPooled0.0003%
C301.282150.649.2100%Yes19.28%
D326.932163.479.6100%Yes21.56%
E255.232127.628.298.6%Yes17.71%
F189.87294.946.297.2%Yes13.51%
G209.232104.626.998.1%Yes15.81%
H168.32284.165.896.9%Yes11.28%
OthersPooled0.002%
Error65.31513.06S = 3.780.85%
Total1516.1717At least 90% confidence
Table 7. SN ratios of the original parameter combination and the optimum parameter combination.
FactorsOriginal DesignOptimum Design
SettingEffect (dB)SettingEffect (dB)
AA2--A1--
BB2--B3--
CC13.73C13.73
DD32.84D23.98
EE21.92E21.92
FF21.21F31.32
GG21.68G21.68
HH21.08H11.16
Average4.364.36
Predicted by Additive Model21.3628.39

