Abstract
The objective of this study is to examine the effect of the poor anchorage length of glass fiber reinforced polymer (GFRP) bars used for longitudinal reinforcement on the flexural and shear performances of beam elements in exterior beam–column connections made using high-strength materials. Six exterior beam–column connection specimens were tested under reversal cyclic loads applied at the free-end of the beam. The selected strength categories of materials in the beam element were as follows: 35 MPa and 70 MPa for the design compressive strength of concrete, 400 MPa and 600 MPa for the yield strength of conventional longitudinal steel bars, and 800 MPa for the tensile strength of the GFRP bar. All the longitudinal steel bars of the beams satisfied the minimum requirements of the provisions of ACI 318–14, whereas all the longitudinal GFRP bars of the beam were linearly anchored into the column section, resulting in poor anchorage length, especially for the beam with the concrete compressive strength of 35 MPa. The flexure-governed beams with GFRP bars exhibited a greater increasing rate in displacement at the pre-peak state and did not display the plastic flow characteristic after the peak load when compared with companion beams with steel bars. The beams with GFRP bars possessed lower diagonal cracking strengths and shear capacities than the companion beams with steel bars although the shear capacities of the beams with GFRP bars could be conservatively predicted using the design equation of ACI 440.1R–15 provision. The low elastic modulus and elongation capacity of GFRP bars resulted in large displacements and brittle post-peak beam performances. Furthermore, the lack of anchorage length of GFRP bars in exterior beam–column connection significantly reduced the flexural strength and ductility of the beam element.
1. Introduction
The use of high-strength materials permits the structural reinforced concrete (RC) elements to have smaller and lighter members through the enhancement of their capacities. In particular, the fiber reinforced polymer (FRP) bar possesses non-electrochemical corrosion performance and a higher strength–weight ratio when compared with the common properties of conventional steel bars [1,2,3,4]. As a result, a large part of the building and infra structures are displaying considerable interest in practical applications of high-strength FRP bars as an alternative for the conventional mild steel bar used for longitudinal reinforcement of flexural members [1,2,3,4]. Meanwhile, use of FRP bars as a longitudinal reinforcement of flexural members requires several precautions for the reduced bond capacity with surrounding concrete and brittle fracture potential of the bars at the large deformation of the members. The reduced bond capacity of FRP bars can require a longer anchorage length to prevent the splitting failure and/or pull-out failure of the longitudinal reinforcement in RC members. However, there are very limited available test data and reports on the effect of the poor anchorage on the flexural strength and ductility of concrete members.
For reinforced concrete members subjected to flexure, the resultant compressive forces are mostly resisted by concrete whereas the resultant tensile forces are transferred to a support through the longitudinal reinforcing bars in tension. Thus, the bond resistance capacity of longitudinal reinforcing bars significantly influences their anchorage length within the support [2,4,5,6] to resist the applied tensile forces. ACI 318–14 provisions [5] specify the required anchorage length of the conventional mild longitudinal reinforcement as a basic function of the compressive strength of concrete, and the yield strength and diameter of the bar on the basis of regression analysis using comprehensive databanks, including pull-out bond tests. Thus, the ACI 318–14 provision provides no details for the anchorage length of FRP bars. The ACI 440.1R–15 guideline [6] specifies the required anchorage length of the FRP bar as a function of the area, tensile strength, and diameter of the bar, and the bond capacity with the surrounding concrete in accordance to the approach that was employed in the ACI 318–14 provision to determine the anchorage length of conventional steel bars. The required anchorage length of FRP bars in beams calculated using the design equations of the ACI 440.1R–15 is commonly shorter than that of the conventional steel bars determined using the ACI 318–14 equations, although the FRP bars potentially possesses a lower bond capacity when compared with the deformed steel bars. This implies that the reliability of the code equations needs to be further examined for flexural members that have insufficient space for anchorage of longitudinal reinforcement, such as exterior beam–column connections.
Recently, there is increasing attention [1,2,3,4,7,8] on the development of glass fiber reinforced polymer (GFRP) bars with good bond capacity on the grounds of high-tensile strength and economic efficiency. Ashour [3] revealed that the flexural behavior of beams reinforced with the GFRP bar was typically governed by the excessive deflection and crack propagation under the service load, rather than the flexural moment capacity, because of the low modulus of elasticity and poor bond capacity of GFRP bars. Issa et al. [7] reported that the ductility of beams with GFRP bars does not satisfy the minimum requirement recommended by CSA–S6–00 [9]. In addition, Ashour [3] and Deitz et al. [8] showed that beams with GFRP bars have a lower shear transfer capacity of concrete than the predictions obtained from the design equations of ACI 318–14 because of the reduced dowel actions of the GFRP bars used for longitudinal reinforcements. Previous tests [1,2,3,4,7,8] were mostly conducted on simply supported beams that are readily capable of achieving a sufficient anchorage length of GFRP bars. Thus, the bond characteristic and anchorage length of GFRP bars have been overlooked in evaluating the flexural strength and ductility of beams. On the other hand, it is frequently observed that the sufficient anchorage of FRP bars is hardly achieved in the exterior beam–column connections because of the limited column width. In addition, the exorbitant bending resistance feature of the hardened polymer blocks the hook fabrication for the anchorage of FRP bars. Overall, it is not an easy task to achieve the required anchorage length of FRP bars used for longitudinal reinforcement of beams in the exterior beam–column connections. However, there is still a lack of test data on the flexural performance of beams with GFRP bars in the beam-column connections, although the anchorage of longitudinal reinforcement significantly influences the flexural strength and ductility of such an element. Furthermore, it is extremely rare to examine the reliability of the code design equations for the effective stiffness and moment capacity of beams with insufficient anchorage length of GFRP bars.
This study aims to examine the effect of poor anchorage length of GFRP bars used for a longitudinal reinforcement on the flexural and shear performances of high-strength concrete beams in the exterior beam–column connection. Three beam–column connection specimens with GFRP bars and three companion specimens with conventional steel reinforcing bars were tested under reversal cyclic loads applied at the free-end of the beam. For beam–column specimens governed by flexure, the effective inertia of the moment under service load, moment capacity, and ductility of the beam were evaluated and compared with the design equations of the code provision [5,6], wherever feasible. In particular, the displacement ductility ratios of beams with GFRP bars were compared with those measured in the companion beams with steel bars with respect to the longitudinal reinforcement index. The initial inclined cracking strength and the ultimate strength of the beam governed by shear were compared with the predictions calculated using design equations [5,6].
2. Experimental Program
2.1. Specimen Details
Six exterior beam–column connection specimens were prepared to examine the effect of the anchorage deficiency of GFRP bars on the flexural and shear performances of the beam. Thus, all the beam–column connections were designed to fail along the beam element. The specimens were classified into two-series according to the governing failure mechanism of the beam element as follows: F-series governed by flexure and S-series by shear, as given in Table 1. Note that the governing failure mechanism was designed in accordance with the design procedure for flexural and shear capacities of the beam specified in the ACI 318–14 [5] and ACI 440.1R–15 [6] provisions. The design compressive strength () of concrete was selected to be 35 MPa and 70 MPa for the F-series specimens and it was fixed to 70 MPa for the S-series specimens. The main variables investigated in each series were the type and strength of longitudinal reinforcement. The amount of GFRP bars was determined to have the same longitudinal reinforcement index as the companion beams with conventional steel bars. Two types of yield strength () of steel bars were used in longitudinal reinforcement of the beams according to ; a 400 MPa-grade (SD 400) steel bar for the beam with a of 35 MPa and a 600 MPa-grade (SD 600) steel bar for the beam with of 70 MPa. Thus, the specimen notation listed in Table 1 is composed of three parts. The first and second parts in the notation refer to the governing failure mechanism of the beam and design compressive strength of concrete, respectively. The third part indicates the type of the longitudinal reinforcement of the beam: C for the conventional steel bar and G for the GFRP bar. For example, specimen F–N–C indicates a beam–column connection governed by flexure with a of 35 MPa and conventional steel bar as a longitudinal reinforcement of the beam; and specimen S–H–G indicates a beam–column connection governed by shear with a of 70 MPa and GFRP bar as a longitudinal reinforcement of the beam.

Table 1.
Details of beam in beam–column connection specimens.
All specimens had the same geometrical dimensions and arrangement of reinforcing bars in columns, as shown in Figure 1. The section size and span of the square column were 500 mm and 1600 mm, respectively. Eight deformed steel bars with a diameter of 25 mm were arranged for the longitudinal reinforcement of the column. For the hoop of the column, steel bars with a diameter of 10 mm were arranged at a spacing of 50 mm in the connection and support zones, and 100 mm in the intermediate areas between the connection and support zones. The beam connected into the column had a width () of 412 mm and an overall depth () of 500 mm. The beam spans () in the F-series and S-series specimens were 2200 mm and 800 mm, respectively. The amount of the longitudinal reinforcement of the beams varied according to the test parameters. To derive the flexure failure of the beam in the F-series specimens, the following longitudinal reinforcement details were designed: Five steel bars (SD 400) with a diameter () of 13 mm for the specimen F–N–C; the combination SD 600 steel reinforcement of two bars with of 16 mm and three bars with of 19 mm for the specimen F–H–C; three GFRP bars with of 12 mm for the specimen F–N–G; and eight GFRP bars with of 12 mm for the specimen F–H–G. Thus, the longitudinal reinforcement ratios of the beam in these specimens were 0.003, 0.007, 0.002, and 0.005, respectively. For the longitudinal reinforcement of the beam in the S-series specimens, the SD 600 steel reinforcing bars (three bars with of 16 mm and three bars with of 19 mm) were used for the specimen S–H–C; and 10 GFRP bars with of 12 mm were used for the specimen S–H–G. For the shear reinforcement, deformed steel bars with of 10 mm were arranged at an interval of 200 mm and 300 mm for the F-series and S-series specimens, respectively.
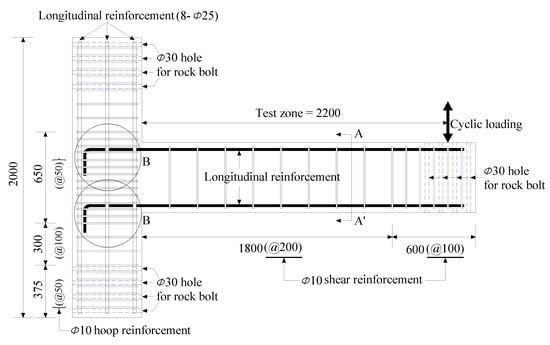
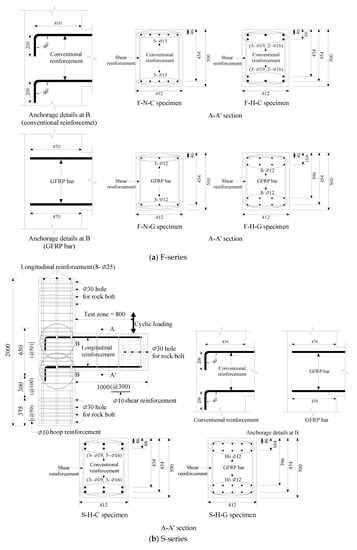
Figure 1.
Details of specimens (all dimensions are in mm).
The reinforcing bars were arranged over the full length of the beam. The longitudinal steel bars of the beam were anchored using a 90-degree hook at the column section in accordance with the design recommendation of the ACI 318–14 provision. Thus, all the longitudinal steel bars satisfied the minimum anchorage length that is required in the ACI 318–14 provision. Meanwhile, the longitudinal GFRP bars of the beam were linearly anchored into the column section, producing an anchorage length () of 470 mm. This value was considerably lower than the minimum requirements for the longitudinal steel bars calculated using ACI 318–14 equations, as presented in Table 1. In addition, the specimen F–N–G did not satisfy the minimum requirement for calculated using the design equations of ACI 440.1R–15.
2.2. Materials
The mechanical properties of concrete were determined from three cylinders with a dimension of 100 mm diameter × 200 mm height at the corresponding age of the beam–column connection tests. The compressive strength () and the modulus of elasticity () of concrete were tested in accordance with ASTM C 39 [10] and ASTM C 469 [11]. The measured and were 35 MPa and 28224 MPa, respectively, for the mixture proportioned for of 35 MPa. The corresponding values measured for of 70 MP were 71 MPa and 40203 MPa for high-strength concrete.
The mechanical properties of reinforcing bars used in the beam–column specimens are summarized in Table 2. Figure 2 also showed stress–strain curves recorded in the reinforcing bars. All the steel bars exhibited a clear yield plateau and strain hardening phenomenon. The yield strengths () ranged between 462 MPa and 484 MPa for the SD 400 steel bars and between 608 MPa and 674 MPa for the SD 600 steel bars. The GFRP bar possessed spiral ribs with the height and spacing of 1 mm and 6.5 mm, respectively, as shown in Figure 3. The GFRP bar did not exhibit a yield plateau and possessed a high-tensile strength of 806 MPa whereas it exhibited a considerably low elastic modulus corresponding to approximately 15% of the common value of the steel reinforcing bars. The elongation strain at the fracture of the GFRP bars reached only 3%, indicating an extremely low ductile property.
Table 2.
Mechanical properties of reinforcements used.
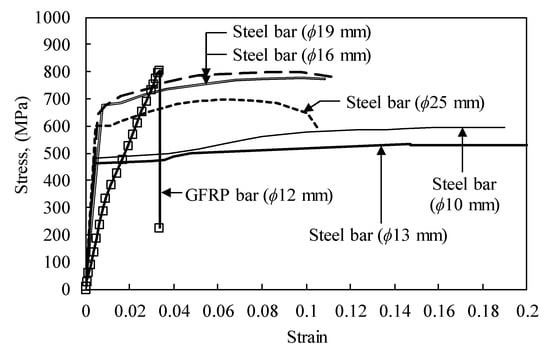
Figure 2.
Stress–strain relationship of longitudinal reinforcements used.
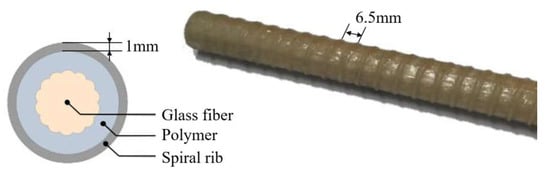
Figure 3.
Surface aspect of the glass fiber reinforced polymer (GFRP) bar.
2.3. Test Prodcedure
All the specimens were tested to failure under reversed cyclic one-point concentrated top loads in the free-end of the beam, as shown in Figure 4. Both ends of the column were supported using eight steel rock bolts penetrating the column at the hinge assemblies to simulate inflection points at the rigid-frame system. Each hinge assembly was fixed to the strong wall using eight steel rock bolts of 25 mm in diameter. To apply load reversals at the free-end of the beam, a 2000 kN capacity actuator was connected to the beam using eight bolts 25 mm in diameter and a steel plate. The free-end displacement of the beam was recorded using a linear variable differential transducer (LVDT) with a capacity of 300 mm. Strains in the longitudinal reinforcement at various locations along the beam length were recorded using 5-mm electrical resistance strain (ERS) gauges.
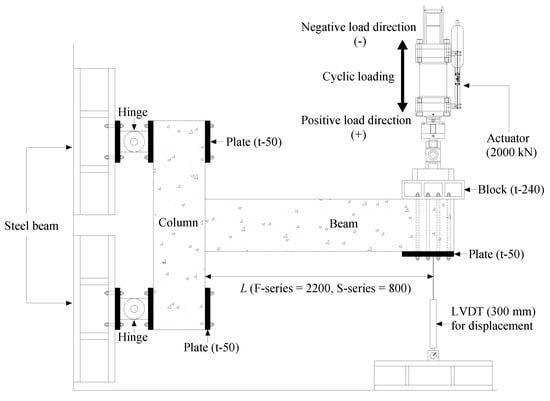
Figure 4.
Test setup for beam–column connection specimen (all dimensions are in mm).
The specimens were subjected to the predetermined displacement history as shown in Figure 5. The positive and negative loading directions produced hogging and sagging moments, respectively, at the rigid-connection area of the beam. The magnitude of the free-end displacement at each cycle was determined in accordance with cyclic test procedures for beam–column connections specified in KBC 2016 [12]. The number of loading reversals was six cycles up to the beam drift ratio ( = ) of 0.75%, and then four cycles up to of 1% beyond which two loading cycles to the failure of the beam, where is the displacement measured at the line of the action of the applied load. The loading was controlled at a displacement rate of 2 mm/min for the F-series specimens and 0.6 mm/min for the S-series specimens.
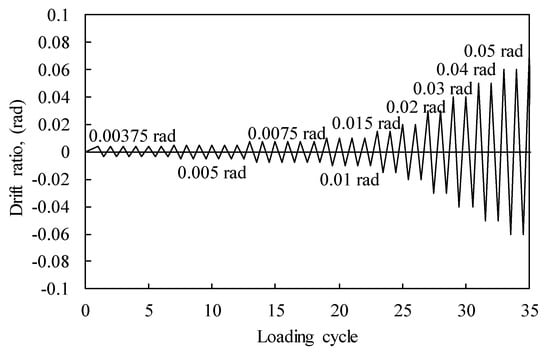
Figure 5.
History of displacement for load reversals.
3. Test Results and Discussions
3.1. Crack Propagation and Failure Mode
Figure 6 shows the crack propagation behavior of the specimens at different load levels. The crack propagations generated in the negative direction are plotted using dotted lines. The first flexural cracks occurred at the first cycle of = 0.375% within the sagging and hogging moment zones of the beam in each loading direction, irrespective of the governing failure mode of the beam. With the increase in the applied load, different crack propagation in the beam was observed in both the F-series and S-series specimens. Except for the F–N–G specimen, the failure mode for the rest of the F-series beams was dominated by the flexure with the crushing of concrete in compression at the interface between the beam and column, and no shear cracks or diagonal tensile cracks were observed in any of the beam elements. Table 3 also summarizes the flexural strength and ductility measured in the beam of the F-series specimens. The yielding displacement () in the beams with GFRP bars was determined from the intersection of the secant line at 75% of the peak load and the horizontal line at the peak load [13]. For the H–N–C specimen, the flexural crack zone in the beam extended up to 0.41 from the maximum moment zone until the failure of the beam. At the first cycle of = 0.75%, several diagonal cracks occurred in the column; however, no concrete crush in the column was developed until the beam failure. The spalling of the concrete cover in compression started with severe flexural cracks at = 3.3%, which corresponded approximately to the peak load, beyond which the applied loads gradually decreased with the increasing displacement history. The loss of the concrete cover was expanded and longitudinal steel bars were then buckled with the opening of a 90-deg hook of the shear reinforcement at = 5%, as shown in Figure 7a. The crack pattern in the beam of the specimen F–N–G was similar to that of the companion specimen F–N–C, but the splitting crack that was observed along the GFRP bars and not any diagonal cracks in the column were an exception. At = 3.4%, the pull-out failure of GFRP bars was observed with the spalling of concrete cover at the interface between the beam and column, as shown in Figure 7b. Because of the premature failure of the beam by the pull-out of GFRP bars, no diagonal cracks occurred in the column. The specimen F–H–C exhibited more severe crack propagation and concrete crushing areas when compared with those observed in the specimen F–N–C. This implies that the cover spalling in compression occurs more rapidly in concrete with higher strengths. The buckling of the longitudinal steel bars in this specimen was observed at = 4%, but no splitting cracks along the longitudinal reinforcement were observed until the end of the tests. The specimen F–H–G exhibited a similar trend in relation to the crack propagation observed in the companion specimen F–H–C. However, the post-peak behavior of the specimen F–H–G was governed by the tensile rupture of GFRP bars at the column interface, as shown in Figure 7b.
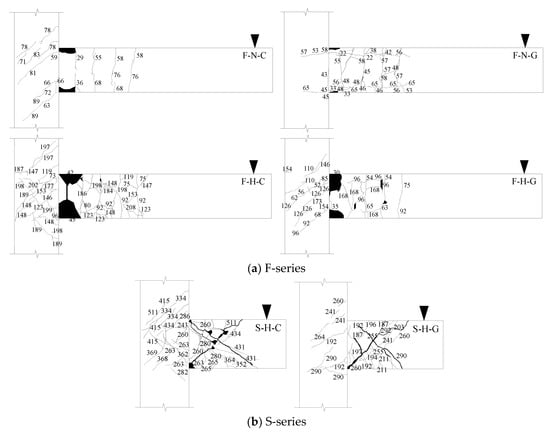
Figure 6.
Crack propagation and failure mode of specimens. (Numbers shown in figures indicate the applied load (in kN) at which crack occurred).
Table 3.
Summary of test results measured in the beam of F-series specimens.
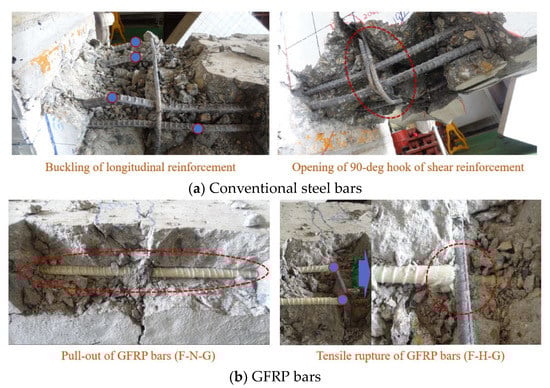
Figure 7.
Typical failure characteristics of longitudinal reinforcement at the interface between the beam and column in F-series specimens.
The S-series specimens exhibited similar crack propagation to the common observation in the specimen F–H–C with respect to the initial flexural crack development at the maximum moment zone and the diagonal cracks in the column. However, these specimens were governed by shear with the occurrence of the diagonal cracks in the web of the beam. After the first cycle of = 0.75%, a couple of diagonal shear cracks suddenly developed in the web of each beam and then rapidly propagated toward loading points and the corner of the column interface as the beam displacement increased. The web of each beam was eventually mostly covered by intersecting diagonal cracks, as shown in Figure 6b. Overall, almost identical crack distributions in the beam were observed in both specimens S–H–C and S–H–G. Meanwhile, the GFRP bars underwent tensile rupture near the column interface of the specimen S–H–G with the increase in the width of the diagonal crack after the peak load. This may be attributed to the fact that the low elongation capacity of the GFRP bars is not capable of affording the extensive width of the diagonal crack. Overall, the testing of the specimen S–H–G was terminated at = 3.2%.
3.2. Cyclic Load–Displacement Relationship
Figure 8 shows the applied cyclic load–displacement relationships measured in the beam element. For F-series specimens, the initial stiffness was significantly affected by the type of longitudinal reinforcement rather than . The specimens F–N–G and F–H–G exhibited approximately 70% lower initial stiffness before cracking when compared with the companion specimens F–N–C and F–H–C. In addition, the former specimens possessed a lower initial flexural cracking strength than the latter specimens. The beam displacement increased sharply with the occurrence of the initial flexural cracks, indicating a greater increasing rate in the displacement in the specimens F–N–G and F–H–G than the companion specimens with conventional steel reinforcements. The longitudinal steel reinforcement in the specimens F–N–C and F–H–C reached its yield strain at approximately 75 to 90% of the peak load. The specimen F–N–C exhibited near plastic flow performance after the yielding of the longitudinal steel bars and reached failure with the buckling of such bars and the opening of the 90-deg hook of the shear reinforcement, as shown in Figure 8a. Thus, the flexural behavior of the specimen F–N–C was almost similar to the typical trend observed in the conventional RC beams [14,15,16]. The specimen F–N–G exhibited a similar pre-peak behavior to the companion specimen F–N–C, as shown in Figure 8b; however, the former possessed a 21% lower flexural capacity of the beam and displayed a rapid decrease of the applied load after the peak load because of the pull-out failure of the GFRP bars, when compared with those observed in the latter. The specimen F–H–C exhibited a very similar trend to the load–displacement curve recorded in the specimen F–N–C, as shown in Figure 8c. Thus, a rapid decrease in the applied load at the post-peak state was not observed in the specimen F–H–C despite the use of high-strength materials. Meanwhile, the initial flexural cracking strength and flexural capacity of the beam element of the specimen F–H–C were, respectively, 1.34 and 2.68 times higher than those measured in the specimen F–N–C because of the use of high-strength materials in the former. The specimen F–H–G exhibited a greater increasing rate in displacement at the pre-peak state when compared with the companion specimen F–H–C, as shown in Figure 8d. In addition, the specimen F–H–G did not display the plastic flow characteristic after the peak load, resulting in a rapid decrease in the applied load due to the tensile rupture of GFRP bars. Overall, the low elastic modulus and elongation capacity of GFRP bars resulted in large displacement and brittle post-peak performance of beams.
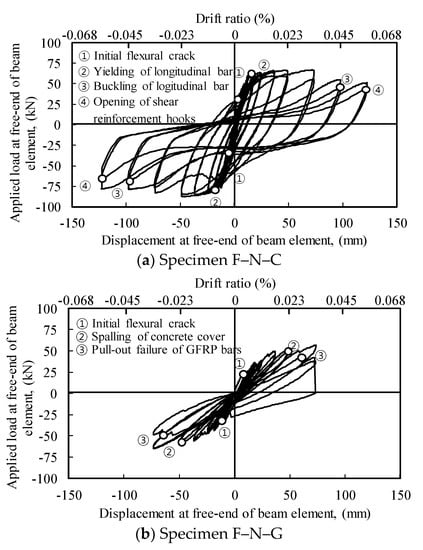
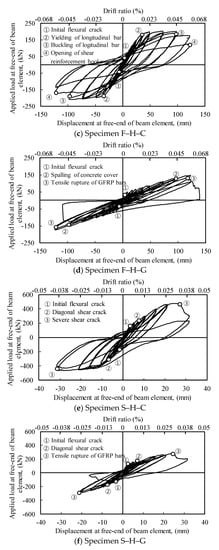
Figure 8.
Applied load–displacement relationship of beam element.
S-series specimens exhibited a great increasing rate in the beam displacement with the occurrence of the diagonal cracks and no plastic flow behavior after the peak load due to the severe diagonal cracks in the beam web, as shown in Figure 8e,f. The diagonal shear crack stresses were 0.18 and 0.14 for the specimen S–H–C and S–H–G, respectively, indicating a lower diagonal shear crack resistance in the latter beam, as given in Table 4. This may be attributed to the fact that the lower flexural crack strength and faster propagation of flexural cracks in the beam web due to the low elastic modulus of GFRP bars reduce the diagonal tensile transfer capacity of concrete [6]. In addition, the specimen S–H–G exhibited as much as 41% lower shear capacity and a smaller area of the envelop load–displacement curve when compared with the companion specimen S–H–C. Overall, the reduced diagonal tensile transfer capacity of concrete in the beam reinforced with longitudinal GFRP bars decreases the ultimate shear capacity of the beam.
Table 4.
Summary of test results in the beam of S-series specimens.
3.3. Flexural Ductility
To examine the flexural ductility of beams in the F-series specimens subjected to a reversal cyclic load, this study calculated the member displacement ductility ratio () [14] and the work damage indicator () [17], where is the displacement upon the peak load of the beam. Figure 9 shows the variation of values determined from the envelope curve at each loading cycle. In general, the specimens reinforced with longitudinal GFRP bars possessed lower values at each cycle when compared with the companion specimens with steel bars, resulting in that the differences gradually increased with the increase in the loading cycle. Thus, values calculated up to the peak load () and ultimate failure () were lower by 93% and 97%, respectively, for the specimen F–N–G when compared with the companion specimen F–N–C, as listed in Table 3. The corresponding values calculated from the comparison of and for both specimens F–H–G and F–H–C were 29% and 84%, respectively. Overall, the low elastic modulus and limited elongation capacity of GFRP bars are unfavorable for the flexural ductility of beams. Furthermore, the lack of an anchorage length of GFRP bars in the exterior beam–column connection can significantly reduce the flexural ductility of the beam element.
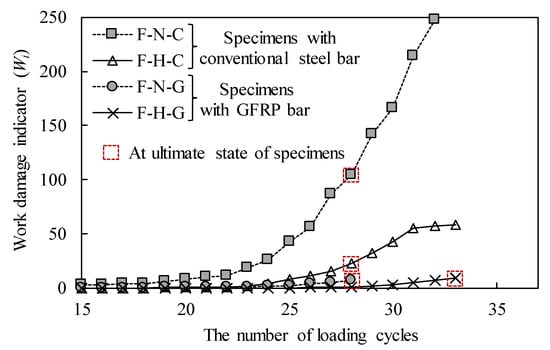
Figure 9.
Work damage indicator at each loading cycle in the beam element.
It is also interesting that both specimens F–N–G and F–H–G exhibited a similar increasing rate of up to the beam failure whereas the specimen F–N–C had higher values than the specimen F–H–C, indicating a 7.91 times higher value of in the specimen F–N–C. This trend was also observed for values. The value of determined in specimen F–N–C was 1.89 times higher than that of specimen F–H–C. The flexural ductility of beams significantly depends on the longitudinal reinforcement index (). Yang et al. [18] showed that the values decrease was proportional to the exponential function with the increase in . Two specimens with longitudinal GFRP bars had similar values whereas the value determined for the specimen F–H–C had 1.47 times higher than that for the specimen F–N–C, as given in Table 1. Although the specimen F–H–G had a lower value than the companion specimen F–H–C, the former possessed a 15% lower than the latter. This implies that beams with longitudinal GFRP bars would possess a potential with lower ductility than beams with conventional steel bars at the same value.
4. Comparisons of Test Results and Code Predictions
4.1. Effective Moment of Inertia of Beam Section
The deflection of RC beams with a cracked section can be calculated using the effective moment of inertia () along the beam length. The ACI 318–14 [5] considers that the values vary with the ratios between the flexural cracking moment capacity () of the beam section and applied moment (), indicating that significantly decreases with the propagation of the flexural crack. Meanwhile, the ACI 440.1R–15 [6] introduces a reduction factor () to explain the tension stiffening of GFRP bars for the calculation of . The values of increase with the increase in . The values of in both code provisions range between the moment of inertias calculated from the gross section () and cracked section (). Figure 10 shows the comparisons of values calculated at each loading cycle up to the yielding of longitudinal reinforcement and predictions using design equations of code provisions. Note that the predictions of were calculated using the ACI 318–14 equations for the beams with conventional steel bars and the ACI 440.1R–15 equations for the beams with GFRP bars. The figure also includes the details of the design equations. The ACI 318–14 equations tended to overestimate the variation in values of the high-strength concrete beams with longitudinal steel bars, indicating that the overestimation was mostly independent of the magnitude of . This trend was not considerably affected by the yield strength of the longitudinal steel bars and/or . The ACI 440.1R–15 equations also overestimated the variation in values of the beams with GFRP bars, whereas the overestimation decreased with the increase in irrespective of . In particular, the beam element of the specimens with GFRP bars exhibited considerably lower values than the predictions at the initial flexural crack. It is also found that the ACI 440.1R–15 equations give lower values than the ACI 318–14 equations.
Figure 10.
Comparison between experimental values and predictions calculated from Ie specified in code provisions.
4.2. Moment Capacities
Table 5 shows the comparisons of the flexural cracking moment capacity () and ultimate moment capacity () of the beams in the F-series specimens with nominal predictions obtained using the flexural design approach specified in code provisions. The beams with steel bars possessed higher moment capacities than the predictions by the ACI 318–14 procedure, yielding ratios between experiments and predictions that exceeded 1.06 for and 1.31 for . However, the beams with GFRP bars also had a lower flexural crack resistance than the predictions calculated by the ACI 440.1R–15 equations, as ACI 440.1R–15 specifications for are identical to ACI 318–14. Meanwhile, the beam element of the specimen F–N–G exhibited non-conservative results when predicting using the ACI 440.1R–15 procedure. This may be attributed to the fact that the beam did not reach its own moment capacity owing to the anchorage failure of longitudinal GFRP bars. The beam element of the specimen F–H–G had higher than the predictions by the ACI 440.1R–15 procedure.
Table 5.
Comparisons of measured moment capacities and predictions by code provisions.
4.3. Shear Capacity
Table 6 shows the comparisons of the shear capacity () of the beams in the S-series specimens with nominal predictions obtained using code equations. The ACI 318–14 equation for the shear transfer capacity of concrete was formulated from the regression analysis of extensive shear data compiled from the slender beam specimens without shear reinforcement. The ACI 440.1R–15 equation considers the reduced shear transfer capacity of concrete in the beams with longitudinal GFRP bars to account for the effect of the decreased compression zone owing to the low elastic modulus of GFRP bars on the shear resistances by compressive concrete and aggregate interlock across the diagonal cracks. The ACI 440.1R–15 equation introduces the ratio of the neutral axis depth to the effective section depth into the shear transfer capacity equation specified in the ACI 318–14 provision. Thus, the shear transfer capacity calculated by the ACI 440.1R–15 equation is lower than that of ACI 318–14 equation, indicating that the reduced values increase with the decrease in the amount of longitudinal GFRP bars. The beam elements of the specimens S–H–C and S–H–G exhibited higher than the predictions calculated by code equations. The ratios between experiments and predictions were similar in both specimens. Although further comparisons have to be conducted, the present beam elements of the exterior beam-column connections made using high-strength materials possessed conservative shear transfer capacities when compared with the code equations.
Table 6.
Comparisons of measured shear capacity and predictions.
5. Conclusions
Based on the reversal cyclic tests used to examine the flexural and shear performances of the beam elements of exterior beam–column connections made using high-strength materials, including the longitudinal GFRP bars, the following conclusions were drawn:
- (1)
- The specimen prematurely failed by the pull-out of GFRP bars exhibited no diagonal cracks in the column element. Meanwhile, the specimen accompanied by tensile rapture of GFRP bars showed a similar trend to the crack propagation and concrete crushing observed in the beams reinforced with longitudinal steel bars.
- (2)
- The beams with GFRP bars possessed lower diagonal cracking strengths and shear capacities than the companion beams with steel bars. However, the shear capacity of the beams with GFRP bars could be conservatively predicted using the design equation of the ACI 440.1R–15 provision.
- (3)
- The specimens with GFRP bars possessed lower values of the work damage indicator at each loading cycle when compared with the companion specimens with steel bars, indicating that the lack of anchorage length of GFRP bars in the exterior beam–column connections significantly reduced the flexural ductility of the beam elements.
- (4)
- The ACI 318–14 equations tended to overestimate the variation in the effective moment of inertia (Ie) of all the beams, irrespective of the type of longitudinal bars and and/or compressive strength of concrete.
- (5)
- The flexural capacity of the beam with the poor anchorage length of GFRP bars was lower than the nominal moment capacity predicted using the ACI 440.1R–15 procedure.
Author Contributions
J.-H.M. conducted the analysis of test results obtained this study. K.-H.Y. designed project. All authors contributed to the comprehensive analysis and conclusion.
Funding
This research funded by Ministry of Science, ICT & Futuer Planning of the Korean government.
Acknowledgments
This research was supported by Basic Science Research Program through the National Research Foundation of Korea (NRF) funded by the Ministry of Science, ICT & Future Planning (No. 2015R1A5A1037548).
Conflicts of Interest
The author declares that there is no conflict of interests regarding the publication of this paper.
References
- Yoo, D.Y.; Banthia, N.; Yoon, Y.S. Flexural behavior of ultra-high-performance fiber-reinforced concrete beams reinforced with GFRP and steel rebars. Eng. Struct. 2016, 111, 246–262. [Google Scholar] [CrossRef]
- Qin, R.; Zhou, A.; Lau, D. Effect of reinforcement ratio on the flexural performance of hybrid FRP reinforced concrete beams. Compos. Part B Eng. 2017, 108, 200–209. [Google Scholar] [CrossRef]
- Ashour, A.F. Flexural and shear capacities of concrete beam reinforced with GFRP bars. Constr. Build. Mater. 2006, 20, 1005–1015. [Google Scholar] [CrossRef]
- Ehsani, M.R.; Saadatmanesh, H.; Tao, S. Design recommendations for bond of GFRP rebars to concrete. J. Struct. Eng. 1996, 122, 247–254. [Google Scholar] [CrossRef]
- ACI Committee 318. Building Code Requirements for Structural Concrete (ACI 318–14) and Commentary; American Concrete Institute: Farmington Hills, MI, USA, 2014. [Google Scholar]
- ACI Committee 440.1R-15. Guide for the Design and Construction of structural Concrete Reinforced with Fiber-Reinforced Polymer (FRP) Bars; American Concrete Institute: Farmington Hills, MI, USA, 2015. [Google Scholar]
- Issa, M.S.; Metwally, I.M.; Elzeiny, S.M. Influence of fibers on flexural behavior and ductility of concrete beams reinforced with GFRP rebars. Eng. Struct. 2011, 33, 1754–1763. [Google Scholar] [CrossRef]
- Deitz, D.H.; Harik, I.E.; Gesund, H. One-way slabs reinforced with glass fiber reinforced polymer reinforcing bars. In Proceedings of the ACI Proceedings of the Fourth International Symposium, Detroit, MI, USA, 1 August 1999; pp. 279–286. [Google Scholar]
- Canadian Highway Bridge Design Code (CHBDC). Section 16. Fiber Reinforced Structures; CSA-S6-00; Canadian Standards Association: Rexdale, ON, Canada, 2000.
- Standard Test Method for Compressive Strength of Cylindrical Concrete Specimens; ASTM C39/C39M-18; ASTM International: West Conshohoken, PA, USA, 2014.
- Standard Test Method for Static Modulus of Elasticity and Poisson’s Ratio of Concrete in Compression; ASTM C 469; ASTM International: West Conshohoken, PA, USA, 2014.
- Architectural Institute of Korea. Korea Building Code; KBC 2016; Architectural Institute of Korea: Seoul, Korea, 2016. (In Korean) [Google Scholar]
- Bae, S.J. Seismic Performance of Full-Scale Reinforced Concrete Columns. Ph.D. Dissertation, University of Texas at Austin, Austin, TX, USA, 2005. [Google Scholar]
- Park, R.; Paulay, T. Reinforced Concrete Structures; Wiley Inter-Science Publication: Toronto, ON, Canada, 1975. [Google Scholar]
- Sin, L.H.; Huan, W.T.; Islam, M.R.; Mansur, M.A. Reinforced lightweight concrete beams in flexure. ACI Struct. J. 2011, 108, 3–12. [Google Scholar]
- Corley, W.G. Rotational capacity of reinforced concrete beams. J. Struct. Div. ASCE 1966, 92, 121–146. [Google Scholar]
- Sheikh, S.A.; Khoury, S.S. Confined concrete columns with stubs. ACI Struct. J. 1993, 90, 414–431. [Google Scholar]
- Yang, K.H.; Seo, E.A.; Hong, S.H. Cyclic flexural tests of hybrid steel–precast concrete beams with simple connection elements. Eng. Strut. 2016, 118, 344–356. [Google Scholar] [CrossRef]
© 2018 by the authors. Licensee MDPI, Basel, Switzerland. This article is an open access article distributed under the terms and conditions of the Creative Commons Attribution (CC BY) license (http://creativecommons.org/licenses/by/4.0/).