Article

Changes in Phonation and Their Relations with Progress of Parkinson’s Disease

1
Department of Telecommunications, Brno University of Technology, Technicka 10, 616 00 Brno, Czech Republic
2
First Department of Neurology, St. Anne’s University Hospital, Pekarska 53, 656 91 Brno, Czech Republic
3
Applied Neuroscience Research Group, Central European Institute of Technology, Masaryk University, Kamenice 5, 625 00 Brno, Czech Republic
4
Department of Neurology, Faculty Hospital and Masaryk University, Jihlavska 20, 639 00 Brno, Czech Republic
5
Escola Superior Politecnica, Tecnocampus, Avda. Ernest Lluch 32, 083 02 Mataro, Barcelona, Spain
6
Institute for Technological Development and Innovation in Communications (IDeTIC), University of Las Palmas de Gran Canaria, 35001 Las Palmas de Gran Canaria, Spain
7
Neuromorphic Processing Laboratory (NeuVox Lab), Center for Biomedical Technology, Universidad Politecnica de Madrid, Campus de Montegancedo, s/n, Pozuelo de Alarcon, 28223 Madrid, Spain
*
Author to whom correspondence should be addressed.
Appl. Sci. 2018, 8(12), 2339; https://doi.org/10.3390/app8122339
Submission received: 17 October 2018 / Revised: 13 November 2018 / Accepted: 19 November 2018 / Published: 22 November 2018

Abstract

:
Hypokinetic dysarthria, which is associated with Parkinson’s disease (PD), affects several speech dimensions, including phonation. Although the scientific community has dealt with a quantitative analysis of phonation in PD patients, a complex research revealing probable relations between phonatory features and progress of PD is missing. Therefore, the aim of this study is to explore these relations and model them mathematically to be able to estimate progress of PD during a two-year follow-up. We enrolled 51 PD patients who were assessed by three commonly used clinical scales. In addition, we quantified eight possible phonatory disorders in five vowels. To identify the relationship between baseline phonatory features and changes in clinical scores, we performed a partial correlation analysis. Finally, we trained XGBoost models to predict the changes in clinical scores during a two-year follow-up. For two years, the patients’ voices became more aperiodic with increased microperturbations of frequency and amplitude. Next, the XGBoost models were able to predict changes in clinical scores with an error in range 11–26%. Although we identified some significant correlations between changes in phonatory features and clinical scores, they are less interpretable. This study suggests that it is possible to predict the progress of PD based on the acoustic analysis of phonation. Moreover, it recommends utilizing the sustained vowel /i/ instead of /a/.

Graphical Abstract

1. Introduction

Parkinson’s disease (PD) is a frequent neurodegenerative disorder that is associated with a substantial reduction of dopaminergic neurons especially in substancia nigra pars compacta [1]. The primary motor symptoms of PD comprise tremor at rest, muscular rigidity, bradykinesia, and postural instability [1]. Patients with PD also develop a variety of non-motor symptoms [2] such as sleep disturbances, depression, cognitive impairment, etc. To diagnose, rate and monitor motor and non-motor symptoms of PD, various clinical rating scales such as Unified Parkinson’s Disease Rating Scale (UPDRS) [3], Freezing Of Gait Questionnaire (FOG-Q) [4], or Addenbrooke’s Cognitive Examination-Revised (ACE – R) [5] have been developed. Nevertheless, reliability of the assessment is often reduced by inter-rater variability [6].
Up to 90% [7] of patients with PD develop a multi-dimensional speech disorder named hypokinetic dysarthria (HD) [8], which is manifested in phonation, articulation, and prosody [9,10,11]. In the area of phonation, insufficient breath support, reduction in phonation time, increased acoustic noise, instability of articulatory organs, microperturbations of frequency/amplitude, and harsh breathy voice quality has been observed [9,12]. HD leads to serious complications in daily communication of patients with PD [13]. Generally, HD was found to be more severe in the advanced stages of PD [14].
As reported by the recent studies, acoustic analysis of HD can provide clinicians with non-invasive and reliable methodology of PD diagnosis, assessment and monitoring [9,15]. Moreover, this methodology has also been used to monitor the efficiency of PD treatment [10,16,17,18]. In the field of acoustic analysis of PD phonation, the authors mostly focused on the sustained vowel /a/ [9]. Conventional phonatory features such as jitter, shimmer, harmonic-to-noise ratio, degree of unvoiced segments, and formant-based parameters extracted from this vowel have been widely used to diagnose PD [12,19,20,21,22,23]. Although Hazan et al. [24] employed analysis of sustained phonation for diagnosis of PD even in its early stage, based on the recent review [9], most of the researchers find relevant applications of the phonatory analysis especially in moderate or severe stages of this disorder.
For example, the analysis of sustained phonation has been utilized during PD severity assessment. In 2010, Tsanas et al. [15] enrolled 42 PD patients and parameterized their sustained phonation of vowel /a/ by a set of conventional features that were consequently mapped to UPDRS, part III (motor examination) and the total score of this scale. Using classification and regression trees, they estimated the UPDRS III score with MAE (mean absolute error) equal to 5.95. The total UPDRS score was estimated with MAE = 7.52 . A parametric version of this dataset has been made available for research purposes and other research teams further decreased the estimation error [25,26,27]. Another work that deals with the automatic clinical scores estimation was published by Mekyska et al. [21]. In this study, they acquired sustained phonation of vowels /a/, /e/, /i/, /o/, /u/ in 84 PD patients. Modeling conventional and advanced features by random forests provided the estimation of UPDRS III with MAE = 5.70 . In addition, the authors estimated several other clinical scores such as UPDRS, part IV (complications of therapy) with MAE = 1.30 or Beck depression inventory (BDI) with MAE = 3.12 .
Even though HD is one of the most problematic aspects of PD, the number of longitudinal studies investigating the evolution of HD in PD over time (based on the acoustic analysis) is very limited [28,29,30,31]. If we focus specifically on longitudinal monitoring of sustained phonation, then, in fact, we can identify only one study, which is published by Skodda et al. [31]. In this work, the authors repeatedly (with average time interval 32.50 months) acquired sustained vowel /a/ in 32 female and 48 male PD patients (age in session 1: 66.28 ± 8.11 years; PD duration in session 1: 6.10 ± 4.63 years; UPDRS III in session 1: 20.16 ± 10.96; UPDRS III in session 2: 19.58 ± 8.29). The voice was quantified by jitter, shimmer, noise-to-harmonic ratio, and mean fundamental frequency. Based on the paired t-test, the authors identified significant changes in shimmer and noise-to-harmonic ratio. In both cases, the values of these parameters increased. Another interesting finding is that, although some phonatory features significantly changed, UPDRS III was held widely stable over time. The authors provide two possible explanations: (1) voice impairment could be the result of an escalation of axial dysfunction too subtle to be mirrored by UPDRS III; (2) alterations of speech parameters could be completely independent of motor performance that may be based upon non-dopaminergic mechanisms. Inconsistencies in terms of the L-dopa effect on HD are further discussed in Brabenec et al. [9].
To sum it up, although the scientific community frequently addresses phonation in association with HD (especially when diagnosing or assessing PD), to the best of our knowledge, there is only one study that focuses on HD phonatory disorders from a longitudinal perspective. Moreover, the work deals with the analysis of phonation just partially, it considers only the sustained vowel /a/, and it does not explore a possibility of PD progress prediction based on a combination of acoustic analysis and machine learning. Therefore, in the frame of our two-year follow-up study, we are going much further with the following aims:
  • to identify phonatory acoustic features at baseline that are significantly correlated with changes in various clinical rating scales,
  • to investigate relationship between changes in the phonatory acoustic features and the clinical rating scales after the two-year follow-up,
  • to establish mathematical models that will estimate the change in clinical rating scales based on the change in acoustic measures,
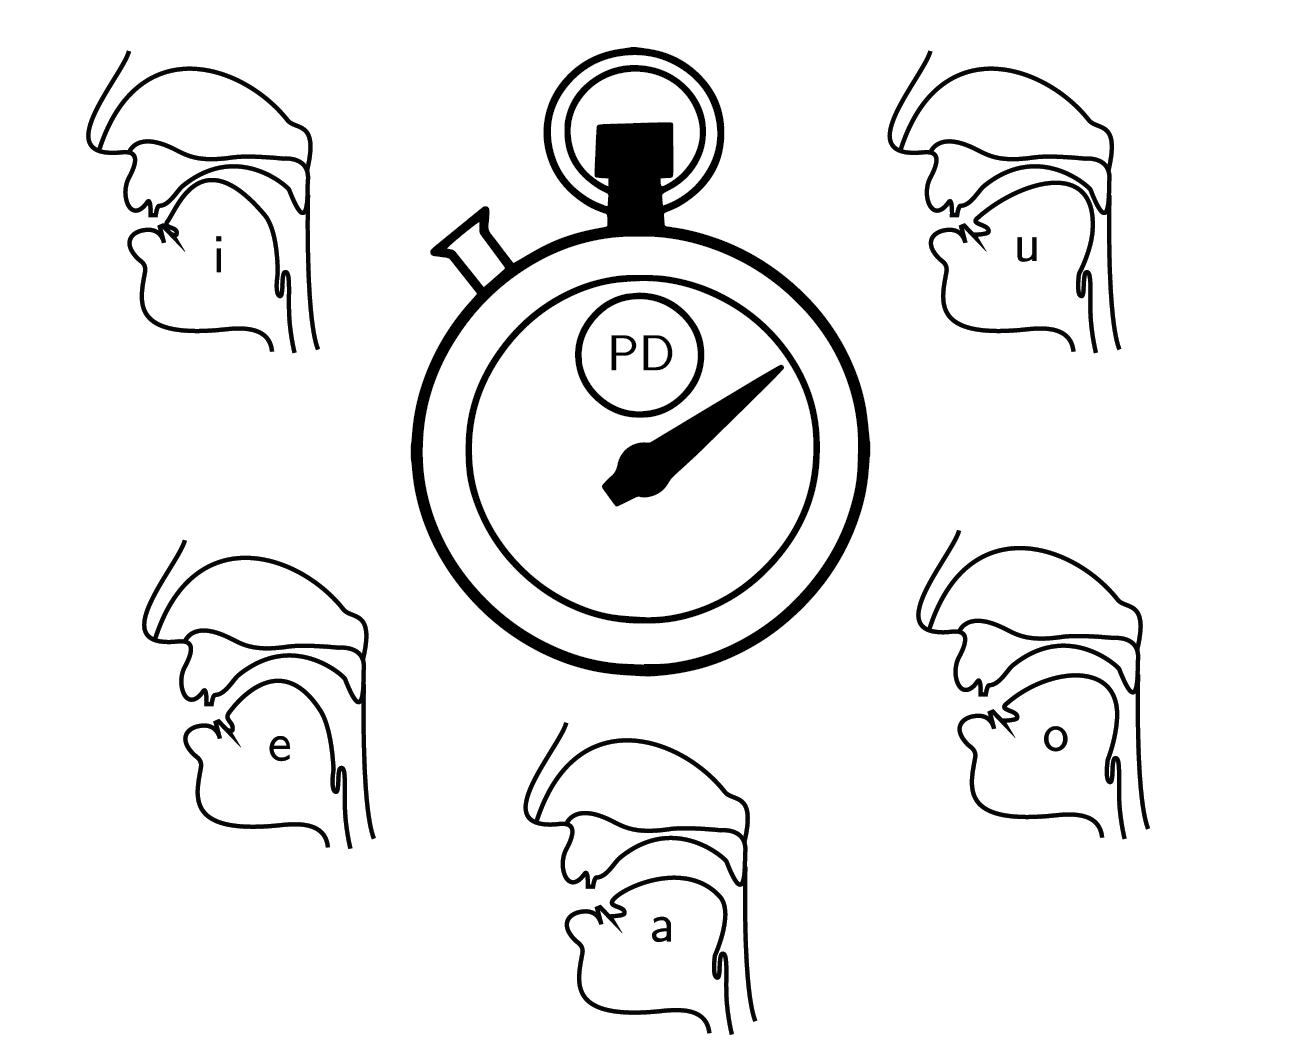
  • to compare results based on five vowels: /a/, /e/, /i/, /o/, /u/.
The rest of this article is organized as follows: Section 2 describes a dataset of PD patients as well as methodology in terms of acoustic analysis, statistical analysis and machine learning. Results are reported in Section 3 and consequently discussed in Section 5. Finally, conclusions are given in Section 4.

2. Materials and Methods

2.1. Dataset

In this work, we enrolled 51 patients with idiopathic PD. All of them are Czech native speakers (17 females and 34 males; age: 65.47 ± 7.46 years; PD duration: 7.61 ± 4.01 years; mean LED (L-dopa equivalent daily dose) [32]: 1033.67 ± 567.96 mg/day) at the First Department of Neurology, St. Anne’s University Hospital in Brno, Czech Republic. After two years, the patients were re-examined (age: 67.61 ± 7.38 years; PD duration: 9.57 ± 4.50 years; mean LED: 1115.11 ± 484.38 mg/day). All patients signed an informed consent form that has been approved (including the study) in 14 March 2016 by the Research Ethics Committee of Masaryk University (ref. no.: EKV-2016-004, project title: Effects of non-invasive brain stimulation on hypokinetic dysarthria, micrographia, and brain plasticity in patients with Parkinson’s disease, investigator: Prof. MD. Irena Rektorova, PhD.).
None of the patients had a disease affecting the central nervous system other than PD. All patients were examined on their regular dopaminergic medication approximately 1 h after the L-dopa [32] dose. The following rating scales were used to evaluate the clinical symptoms of PD: UPDRS III and UPDRS IV [3], FOG-Q [4], REM sleep behavior disorder screening questionnaire (RBDSQ) [33], and ACE-R [5]. The full clinical characteristics of the dataset, i e., mean ± sd values for the clinical rating scales in session 1, session 2, and session Δ ( session 2 session 1 ) can be seen in Table 1. Moreover, to identify statistically significant differences, the table reports p-values of the Wilcoxon signed-rank test between the data acquired in session 1 (baseline examination) and session 2 (two-year follow-up examination) too.
The clinical data from the Δ session were also used to generate descriptive visualizations (i.e., histograms, regression and residual plots) for the change in selected clinical rating scales, more specifically: LED, UPDRS III, UPDRS IV, FOG-Q, RBDSQ, ACE-R, see Figure 1. With this approach, it is possible to assess the improvement and/or decline in motor and non-motor deficits associated with PD in the horizon of two years as well as a relationship between the change in each of the scales relative to other scales in the selected set.

2.2. Vocal Tasks

To quantify the deterioration of phonation in patients with PD, we used a sustained phonation of vowels: /a/, /e/, /i/, /o/, /u/ as a basis for our experiments. The reason behind using all of the five vowels is to employ the analysis with the emphasis on quantifying all positions of a tongue during phonation. For more information, see the Hellwag (vowel) triangle [34]. In our view, using only a sustained phonation of the vowel /a/ is not fully justified as there is very little or no reason to assume that this particular position of the tongue can provide more information about phonatory disorders. In fact, as shown by previous studies, the analysis of other vowels is important for a more robust description of HD [19,20,21,23,24,35,36,37].
Sustained phonation of a vowel is a standard measure used to assess quality of phonation [9]. During this particular vocal task, a speaker is asked to sustain phonation of a vowel, attempting to maintain steady frequency and amplitude at a comfortable level [38]. The advantage of this task in comparison with other commonly used vocal tasks is its independence of articulatory and other linguistic confounds [38]. Moreover, it is also present in most of the databases and therefore the experiments proposed in our work are comparable with other commonly used databases [39,40].
The sustained phonation task used in this study is a part of a speech acquisition protocol derived from the standardized 3F Dysarthria Profile [41]. During the data acquisition, a large capsule cardioid microphone M-AUDIO Nova (Cumberland, RI, United States) mounted to a boom arm RODE PSA1 (Silverwater, Australia) and positioned at a distance of approximately 20 cm from the patient’s mouth was used for the recording. Consequently, the signals were digitized by audio interface M-AUDIO Fast Track Pro (Cumberland, RI, United States) with the sampling frequency of 48 kHz (16-bit resolution) and checked by a trained acoustic engineer without having seen the patient’s clinical data. Finally, the signals were parameterized using Praat [42] software as well as a set of MATLAB (MATLAB 9.4, MathWorks, Natick, MA, United States) parametrization functions [43] developed at the Brno University of Technology.

2.3. Acoustic Features

To describe a variety of phonatory disorders associated with HD, we quantified the following: (a) microperturbations in frequency of voice using period perturbation quotient (PPQ); (b) microperturbations in intensity of voice using amplitude perturbation quotient (APQ); (c) irregular pitch fluctuations using coefficient of variation of fundamental frequency (F0 (CV)); (d) irregular amplitude fluctuations using coefficient of variation of Teager–Kaiser operator (TKEO (CV)); (e) tremor of articulatory organs (such as jaw, tongue and lips), coefficient of variation of 1st formant (F1 (CV)), coefficient of variation of 2nd formant (F2 (CV)), coefficient of variation of 3rd formant (F3 (CV)); (f) increased acoustic noise using median of harmonic-to-noise ratio (HNR (Q2)), median of energy ratio (ER (Q2), energy ratio of bands 2000–4000 Hz and 70–900 Hz)), median of glottal-to-noise excitation ratio (GNE (Q2)), median of normalized noise energy (NNE (Q2)); (g) irregular acoustic noise fluctuations using standard deviation of harmonic-to-noise ratio (HNR (SD)), coefficient of variation of energy ratio (ER (CV)), standard deviation of glottal-to-noise excitation ratio (GNE (SD)), standard deviation of normalized noise energy (NNE (SD)); and (h) aperiodicity of voice using fraction of locally unvoiced frames (FLUF). All of these features are standard and clinically interpretable dysphonic measures and were selected based on a recommendation given in our recent review on acoustic analysis of voice/speech signals in patients suffering from HD [9]. For more information about the voice/speech parametrization, see [43].

2.4. Statistical Analysis

Before describing the analytical setup applied in this work, it is important to mention that the dataset did not contain any missing values, and therefore all data samples were used. Furthermore, even though we used six clinical rating scales when describing the dataset (see Section 2.1), only four of these scales were used for the analysis, specifically: UPDRS III, UPDRS IV, RBDSQ, and FOG-Q. The reason is that previous studies have already shown that non-motor manifestations of PD are not linked with the phonatory aspects of HD, but rather with the impairments of prosody and articulation [44] that are commonly being quantified using a sentence reading task, free speech (monologue), etc. Since this study is focused on the phonatory aspects of HD, clinical rating scales describing only motor symptoms of PD were used.
To reveal and assess the strength of a relationship between the computed acoustic features and patients’ clinical data (UPDRS III, UPDRS IV, RBDSQ, and FOG-Q), Spearman’s correlation coefficient was computed (the statistical assumptions for Spearman’s correlation coefficient were satisfied as: (a) the acoustic features as well as the the clinical data are both variables that are measured on at least an ordinal scale, and (b) there is a monotonic relationship between the two variables). Since age, gender, and probably L-dopa, are manifested in a voice of PD patients [9], for the purpose of this work, we employed partial Spearman’s correlation controlling for the effect of the following confounding factors (also known as covariates): patients’ age, gender [29,45], and dopaminergic medication [32,46]. The significance level of correlation was set to 0.05. More specifically, two correlation scenarios were considered: (a) correlation between the acoustic features at the baseline and the change in values of the selected clinical rating scales, and (b) correlation between the change in the acoustic features and the change in the values of the selected clinical rating scales. With this approach, we aimed at identifying those acoustic features that are significantly correlated with the specific motor and non-motor symptoms assessed by the selected clinical rating scales in both scenarios.
Next, to evaluate the power of the acoustic features at the baseline to predict the change of the patients’ clinical data in the horizon of two years, we used the acoustic features computed for the recordings acquired in session 1 (baseline examination) and built mathematical models predicting the change in the selected clinical rating scales ( Δ ). For this purpose, we employed Gradient Boosted Trees (more specifically, the famous XGBoost algorithm [47]) in a supervised learning setup: 10-fold cross-validation with 20 repetitions [48]. The XGBoost algorithm belongs to the state-of-the-art in machine learning, which is supported by the fact that it has been recently used to win competitions on Kaggle. It works well even on small datasets (where it outperforms deep learning approaches), it is robust to outliers and it is able to model complex interdependencies. For these reasons, it has been used by many researchers in various biomedical fields, e.g., [49,50,51], etc.
The performance of the models (precision of the predictions) was evaluated by MAE and estimation error rate (EER). These measures are defined as:
MAE = 1 n i = 1 n | y i y i ^ | , EER = 1 n · r i = 1 n | y i y i ^ | · 100 [ % ] ,
where y i stands for the true label of i-th observation, y i ^ represents the predicted label of the i-th observation, n denotes the number of observations, and finally r stands for the range of values in the predicted clinical rating scale (not the range that can be theoretically reached, but the actual range of the values in the dataset). As can be seen, EER therefore describes a percentage of error predictions with respect to statistical properties of the dataset, which is particularly useful for easy interpretation of the results.

3. Results

The values of 16 acoustic features extracted from both sessions, as well as values of their differences (session 2 − session 1), are reported in Table 2. Based on the Wilcoxon signed-rank test, we can observe that none of the features extracted from vowel /a/ significantly changed after two years. Regarding vowel /e/, we identified significantly increased microperturbations in intensity of voice and also increased aperiodicity. The same significant changes were identified in vowel /i/ and /u/. In the case of vowel /u/, in addition, we monitored the increase of microperturbations in frequency of voice. The repeated acquisition of vowel /o/ was associated with increased aperiodicity and more dominant microperturbations in frequency of voice.
The results of Spearman’s partial correlation between the baseline acoustic features (session 1) and change in clinical data ( Δ ) can be seen in Table 3. None of the features significantly correlated with UPDRS, part III. On the other hand, in the case of part IV, we can observe negative correlation with aperiodicity (FLUF, vowels /e/, /i/, /o/, /u/), i.e., low aperiodicity at the baseline resulted in increased complications with therapy. Similarly, we identified negative correlation with tremor of jaw (F2 (CV), vowel /a/), but positive correlation with the tremor of lips (F3 (CV), vowel /o/). Another positive correlations were observed with median of energy ratio (vowels /o/, /u/), irregular pitch fluctuations (F0 (CV), vowel /a/), and variability of voice quality (GNE (SD), vowel /a/). Change in UPDRS IV negatively correlated with irregular amplitude fluctuations (TEO (CV), vowel /u/), acoustic noise (NNE (Q2), vowel /u/) and its variation (NNE (SD), vowel /a/). Results linked with the acoustic noise quantified by the median GNE are not consistent.
RBDSQ significantly and positively correlated with microperturbations in frequency of voice (PPQ, vowel /u/) and microperturbations of its intensity (APQ, vowel /a/), i.e., increased microperturbations in frequency/amplitude at the baseline resulted in deterioration of sleep. In addition, RBDSQ negatively correlated with the variation of voice quality (HNR (SD), vowel /o/).
Regarding gait difficulties, as assessed by FOG-Q, we can observe two positive correlations with tremor of jaw (F1 (CV), vowel /i/) and irregular pitch fluctuations (F0 (CV), vowel /a/). The total score of this questionnaire negatively correlates with variation of acoustic noise (NNE (SD), vowel /o/).
The results of Spearman’s partial correlation between the change of baseline acoustic features ( Δ ) and the change in clinical data ( Δ ) can be seen in Table 4. Regarding the change of UPDRS III, it negatively correlated with the change of microperturbations in frequency of voice (PPQ, vowel /i/), aperiodicity (FLUF, vowels /e/, /o/), tremor of tongue (F1 (CV), vowels /a/, /u/), tremor of jaw (F2 (CV), vowel /e/), irregular pitch fluctuations (F0 (CV), vowels /a/, /u/), and variation of acoustic noise (NNE (SD), vowel /i/). Significant positive correlations were identified with the change of lips tremor (F3 (CV), vowel /a/), acoustic noise (ER (Q2), vowel /a/), and variation of voice quality (GNE (SD), vowel /e/).
In the case of UPDRS IV, we identified seven significant positive correlations with the change of microperturbations in frequency of voice (PPQ, vowel /e/), tremor of jaw (F2 (CV), vowel /a/), irregular amplitude fluctuations (TEO (CV), vowels /a/, /u/), and acoustic noise (NNE (Q2), vowels /o/, /u/). The change in UPDRS IV significantly negatively correlated with the change of acoustic noise (ER (Q2), vowel /u/), and its variation (ER (CV), vowel /e/).
Changes in RBDSQ significantly negatively correlated with the change of microperturbations in frequency of voice (PPQ, vowel /u/), microperturbations of its intensity (APQ, vowels /e/, /i/, /u/), tremor of lips (F3 (CV), vowel /o/), acoustic noise (NNE (Q2), vowel /e/), and its variation (ER (CV), vowel /e/). Positive correlations were identified with the change in voice quality (HNR (Q2), all vowels) and its variability (HNR (SD), vowels /e/, /o/, /u/). The similar results can be observed when assessing the quality by GNE (vowel /e/).
Finally, in terms of changes in FOG-Q, we identified significant negative correlations with the change in aperiodicity (FLUF, vowels /a/, /e/, /o/, /u/), tremor of jaw (F1 (CV), vowel /i/), tremor of tongue (F2 (CV), vowel /u/), and variation of acoustic noise (ER (CV), vowels /e/, /i/). One significant positive correlation can be observed with the change in acoustic noise variation (NNE (SD), vowel /o/). The results based on irregular amplitude fluctuations (TEO (CV)) are not consistent.
The results of the clinical scales’ estimation are reported in Table 5. Using the acoustic analysis of sustained phonation of the baseline vowel /e/ in combination with mathematically modeling based on the XGBoost algorithm, we estimated the change in UPDRS III score with 25.7% error ( MAE = 7.3 , range ( UPDRS III Δ ) = 29 ). The change in UPDRS IV was estimated with the lowest error equal to 11.3% ( MAE = 1.7 , range ( UPDRS IV Δ ) = 15 ) when employing acoustic analysis of the baseline vowel /o/. The change in RBDSQ was estimated with 16.3% error ( MAE = 2.0 , range ( RBDSQ Δ ) = 13 ) based on phonatory analysis of vowel /i/. Finally, the lowest error of FOG-Q change estimation is 13.2% ( MAE = 2.8 , range ( FOG - Q Δ ) = 22 ). In this case, the acoustic analysis of vowel /u/ outperformed the other ones.
Due to inter-rater variability as well as intra-rater variability [52,53,54], consistent scoring of PD using the commonly used clinical rating scales is not an easy task. Automatic scoring, i.e., the estimation of the values of the clinical rating scales must be viewed as a tool that can provide clinicians with an additional, unbiased, and objective information that can help them with their decision-making, not as a tool that will substitute the work of clinicians. With this in mind, the predictions made by the trained XGBoost models can be considered rather reasonable as the error of 10–20% is comparable with a deviation caused by inter/intra-rater variability. Moreover, each clinical rating scale is different. On one hand, there are complex scales such as UPDRS III describing various motor aspects of PD, and, on the other hand, there are scales specifically focusing on a subset of its symptoms, e.g., FOG-Q (gait difficulties), RBDSQ (sleep disorders), etc. This information must be taken into account when evaluating the prediction errors because, the more complex the scale is, the more difficult it becomes to predict its values. This can be seen in our results as well. The most complex of the scales was predicted with the largest prediction error.
Feature importances of the SGBoost models are visualized in Figure 2. The figure shows the feature importances for all of the trained models. Feature importances quantify a relative importance of the features in the ensemble of the trained XGBoost model [47]. Therefore, the higher the value of the feature importance, the more important the feature is for the prediction of the dependent variable. With this in mind, the rationale behind this visualization is to show which features are important, and how strong that importance is, for the trained models in direction of predicting the change in the particular clinical rating scales in the horizon of two years given the acoustic features at the baseline.
Based on these graphs, we can conclude that the estimation of UPDRS III change requires a complex parametrization because, in all scenarios, at least 13 acoustic features were employed. In this case, especially median NNE was not frequently used. Although the models estimate the change of UPDRS IV with the lowest error, they usually use just a few phonatory parameters. In fact, in the case of vowel /o/, we observed 11.3% estimation error based on the following three phonatory features: GNE (Q2), ER (Q2), and FLUF. Generally, these features quantify quality of voicing. The best estimation of the RBDSQ change is based on eight phonatory parameters extracted from vowel /i/. The most important features quantify tremor of jaw (F1 (CV)), aperiodicity (FLUF), and microperturbations in intensity (APQ). Finally, based on the feature importances, we can observe that the most important role in FOG-Q change estimation was played by formant frequencies quantifying tremor of the articulatory organs.

4. Discussion

Although the only existing longitudinal study [31] is different in the interval between sessions (32.5 vs. 24.0 months), we are going to compare our findings with the results reported by these authors. In contrary to Skodda et al., who observed significant change in shimmer of the sustained phonation of vowel /a/, we have not identified any significant differences in this vowel. Nevertheless, we identified significant changes in the same feature extracted from vowels /e/, /i/, /u/. In addition, we monitored some significant changes in jitter and FLUF. Based on these results, we can conclude that, for two years, patients’ voices became more aperiodic with increased microperturbations of frequency and amplitude.
None of the acoustic features at baseline significantly correlated with a change in UPDRS III, which supports the results of the clinical scales’ estimation where the lowest estimation error was above 25%. However, we identified some significant correlations between changes of phonatory features and the clinical scale. Surprisingly, except tremor of lips (F3 (CV)), acoustic noise (ER (Q2)), and variation of voice quality (GNE (SD)), worsening in UPDRS III (motor performance) was associated with improvement in phonatory characteristics. This could be explained by the fact that HD belongs to axial symptoms [9,31] that do not play significant part in UPDRS III. In other words, although several significant correlations were identified, we hypothesize that some underlying pathophysiological mechanism are involved and a direct interpretation is not possible.
Regarding the change in complications of therapy (as assessed by UPDRS IV), although the most significant correlations were observed with baseline features extracted from the vowel /a/, the lowest estimation error (11%) was based on vowel /o/. In this case, low aperiodicity, but increased lips tremor and increased acoustic noise at baseline, was associated with increased complications in the follow-up examination.
Only three significant correlations are reported between baseline acoustic parameters (quantifying microperturbations of frequency/amplitude and variation in voice quality) and change in RBDSQ. Although we have not identified any significant correlations based on vowel /i/, the XGBoost algorithm reached the lowest error (16%) including features calculated from this vowel. This result could originate from the ability of XGBoost to model complex interdependencies that are not evident at first sight [47]. Regarding the partial correlations between changes in RBDSQ and phonatory features, we can conclude that mainly changes in voice aperiodicity and voice quality are linked with changes in sleep disorders.
HD and freezing of gait (FOG) are both axial symptoms of PD [55]. In our recent work, we have found out that these symptoms share some pathophysiological mechanism [56]. More specifically, we proved that FOG is mainly linked with improper articulation, disturbed speech rate and with intelligibility. We did not identify any significant relations between FOG and phonatory features. On the other hand, we analyzed only the sustained vowel /a/ and partial correlations were calculated only with some baseline FOG-Q sub-scores. The current study provides deeper and more complex results in terms of FOG and phonatory features relations. The first correlation analysis (baseline features vs. Δ FOG-Q) identified just a few significant correlations. However, based on mainly formant frequencies extracted from vowel /u/, the XGBoost model estimated the change in FOG-Q with 13% error. Generally, the significant impact of formants in this specific task is in line with our previous study [56]. The second correlation analysis ( Δ of the baseline features vs. Δ FOG-Q) revealed some relations between changes in FOG and changes in aperiodicity, tremor of jaw/tongue, and acoustic noise.
Although most of the studies dealing with the acoustic analysis of phonation in PD patients focus on sustained vowel /a/, it is not sufficiently explained why this corner vowel is more important than the other two, i.e., /i/ or /u/. Looking at the Hellwag (vowel) triangle [34], we can see that, during phonation of vowel /a/, the tongue is in its lowest position from a vertical point of view, and in its central position from a horizontal one. In other words, a speaker does not have to make an effort to keep the tongue in a limit position (the tongue is almost relaxed). Therefore, some phonatory disorders could not be accented. This limitation is not present in vowels /i/ or /o/, where the speaker has to exert a force in both directions. On the other hand, the lowest limit position of jaw is reached during the phonation of vowel /a/. In summary, although some research teams employed a more complex set of vowels in their experiments [19,20,21,23,24,35,36,37], the vowel /a/ is still the most frequently used one. However, this choice should be supported by a complex, robust, and multilingual study (theoretically, the effect of culture and language plays no role here, but this should be proven as well). Based on these assumptions, we have decided to explore significance of all five Czech vowels. In addition, the results suggest that the progress of PD is reflected in each vowel differently. Moreover, each vowel differently correlates with changes in scores of clinical scales. Finally, in our case, the best prediction of the change in the clinical rating scales under the focus have never been based on phonatory parameters of the vowel /a/. If we have to choose one optimal candidate for considered clinical scores changes prediction (see Table 5), it would be the corner vowel /i/, where the tongue is in limit position in both directions.
In our previous works, we proved that HD shares some pathophysiological mechanisms with other motor/non-motor features of PD. For instance, based on a combination of acoustic analysis and machine learning approaches, it is possible to predict cognitive deficits or gait disorders [44,56]. Although in the frame of this research we explored only the field of phonation, our results confirm the ability of acoustic HD analysis to predict the progress of PD. These findings and conclusions could have practical applications in eHealth, mHealth and generally Health 4.0 systems that could be used to remotely monitor and assess motor/non-motor deficits in PD patients.

5. Conclusions

This study deals with a quantitative analysis of changes in sustained phonation that has been acquired twice (with a two-year interval) in 51 PD patients. These changes are linked with progress of PD as assessed by three commonly used clinical scales. Finally, it explores a possibility of PD progress prediction based on a combination of acoustic analysis and machine learning modeling.
Based on the reported results, we conclude that, for two years, patients’ voices became more aperiodic with increased microperturbations of frequency and amplitude. Although we did not identify many significant correlations between baseline values of phonatory features and changes in clinical scores, the XGBoost algorithm was able to predict these changes with errors ranging from 11% (in the case of UPDRS IV) to 26% (in the case of UPDRS III). These results accent the impact of acoustic HD analysis in Health 4.0 systems. Next, we identified significant correlations between changes in phonatory features and changes in clinical scores; however, probably due to some underlying pathophysiological mechanisms and complex interdependencies, these relations are less interpretable. Finally, our results suggest that the researchers should consider acoustic analysis of corner vowel /i/ instead of the corner vowel /a/.
Admittedly, the main limitation of this study is the small size of patient cohort. On the other hand, longitudinal studies of PD patients are very time-consuming (the patients are usually examined by several experts such as neurologists, clinical psychologists, and clinical speech therapists), physically demanding (PD is a movement disorder, therefore it requires patients to make significant effort to get into a hospital), and it is difficult to assess a large number of patients due to a low prevalence which is estimated to 1.5% for people aged over 65 years [57]. In fact, as far as we know, this is the first complex study analyzing changes in phonation and their relations with progress of PD based on such a big dataset. Moreover, it is the first study employing acoustic analysis of phonation in combination with machine learning modeling in order to predict the progress of PD. Nevertheless, our findings should be confirmed by further scientific research that will include bigger cohorts.

Author Contributions

Conceptualization, Z.G., J.M. and I.R.; Methodology, Z.G. and J.M.; Software, Z.G. and J.M.; Validation, Z.G.; Formal Analysis, Z.G.; Investigation, Z.G., J.M., i. e., M.M., M.K. and I.R.; Resources, Z.S., i. e., M.M., M.K. and I.R.; Data Curation, J.M., T.K., i. e., M.M., M.K., I.R.; Writing—Original Draft Preparation, Z.G., J.M., V.Z., J.M., T.K.; Visualization, Z.G.; Supervision, J.M., Z.S., I.R., M.F.-Z., JB.A.-H. and P.G.-V.; Project Administration, J.M. and I.R.; Funding Acquisition, J.M., I.R., M.F.-Z., JB.A.-H. and P.G.-V.

Funding

This research was funded by the grant of the Czech Ministry of Health 16-30805A (Effects of non-invasive brain stimulation on hypokinetic dysarthria, micrographia, and brain plasticity in patients with Parkinson’s disease) and the following projects: LO1401, FEDER and MEC, TEC2016-77791-C4-2-R, TEC2016-77791-C4-1-R, CENIE_TECA-PARK_55_02 INTERREG V-A Spain—Portugal (POCTEP), and TEC2016-77791-C4-4-R from the Ministry of Economic Affairs and Competitiveness of Spain. For the research, infrastructure of the SIX Center was used.

Conflicts of Interest

The authors declare no conflict of interest.

Abbreviations

The following abbreviations are used in this manuscript:
ACE-RAddenbrooke’s cognitive examination-revised
APQamplitude perturbation quotient
CVcoefficient of variation
EERestimation error rate
ERenergy ratio
F0fundamental frequency
Fiith formant
FLUFfraction of locally unvoiced frames
FOGfreezing of gait
FOG-Qfreezing of gait questionnaire
GNEglottal-to-noise excitation ratio
HDhypokinetic dysarthria
HNRharmonic-to-noise ratio
LEDL-dopa equivalent daily dose
MAEmean absolute error
NNEnormalized noise energy
PDParkinson’s disease
PPQperiod perturbation quotient
Q2second quartile (median)
RBDSQREM sleep behavior disorder screening questionnaire
SDstandard deviation
TKEOTeager–Kaiser energy operator
UPDRS IIIUnified Parkinson’s disease rating scale, part III: evaluation of motor functions
UPDRS IVUnified Parkinson’s disease rating scale, part IV: evaluation of complications of therapy

References

  1. Hornykiewicz, O. Biochemical aspects of Parkinson’s disease. Neurology 1998, 51, S2–S9. [Google Scholar] [CrossRef] [PubMed]
  2. Hoehn, M.M.; Yahr, M.D. Parkinsonism: Onset, Progression, and Mortality. Neurology 1967, 17, 427–442. [Google Scholar] [CrossRef] [PubMed]
  3. Fahn, S.; Elton, R.L. UPDRS Development Committee (1987) Unified Parkinson’s Disease Rating Scale; Recent Developments in Parkinson’s Disease; Macmillan: Florham Park, NJ, USA, 1987. [Google Scholar]
  4. Giladi, N.; Shabtai, H.; Simon, E.S.; Biran, S.; Tal, J.; Korczyn, S.D. Construction of freezing of gait questionnaire for patients with Parkinsonism. Parkinsonism Relat. Disord. 2000, 6, 165–170. [Google Scholar] [CrossRef]
  5. Larner, A.J. Addenbrooke’s cognitive examination-revised (ACE-R) in day-to-day clinical practice. Age Ageing 2007, 36, 685–686. [Google Scholar] [CrossRef] [PubMed]
  6. Ramaker, C.; Marinus, J.; Stiggelbout, A.M.; Van Hilten, B.J. Systematic evaluation of rating scales for impairment and disability in Parkinson’s disease. Mov. Disord. 2002, 17, 867–876. [Google Scholar] [CrossRef] [PubMed]
  7. Ramig, L.O.; Fox, C.; Sapir, S. Speech treatment for Parkinson’s disease. Expert Rev. Neurother. 2008, 8, 297–309. [Google Scholar] [CrossRef] [PubMed]
  8. Darley, F.L.; Aronson, A.E.; Brown, J.R. Differential Diagnostic Patterns of Dysarthria. J. Speech Lang. Hear. Res. 1969, 12, 246–269. [Google Scholar] [CrossRef]
  9. Brabenec, L.; Mekyska, J.; Galaz, Z.; Rektorova, I. Speech disorders in Parkinson’s disease: Early diagnostics and effects of medication and brain stimulation. J. Neural Transm. 2017, 124, 303–334. [Google Scholar] [CrossRef] [PubMed]
  10. Eliasova, I.; Mekyska, J.; Kostalova, M.; Marecek, R.; Smekal, Z.; Rektorova, I. Acoustic evaluation of short-term effects of repetitive transcranial magnetic stimulation on motor aspects of speech in Parkinson’s disease. J. Neural Transm. 2013, 120, 597–605. [Google Scholar] [CrossRef] [PubMed]
  11. Elfmarkova, N.; Gajdos, M.; Mrackova, M.; Mekyska, J.; Mikl, M.; Rektorova, I. Impact of Parkinson’s disease and levodopa on resting state functional connectivity related to speech prosody control. Parkinsonism Relat. Disord. 2016, 22 (Suppl. 1), S52–S55. [Google Scholar] [CrossRef] [PubMed]
  12. Gómez-Vilda, P.; Mekyska, J.; Ferrández, J.M.; Palacios-Alonso, D.; Gómez-Rodellar, A.; Rodellar-Biarge, V.; Galaz, Z.; Smekal, D.; Rektorova, I.; Eliasova, I.; et al. Parkinson Disease Detection from Speech Articulation Neuromechanics. Front. Neuroinform. 2017, 11, 56. [Google Scholar] [CrossRef] [PubMed]
  13. Lirani-Silva, C.; Mourão, L.F.; Gobbi, L.T.B. Dysarthria and Quality of Life in neurologically healthy elderly and patients with Parkinson’s disease. CoDAS 2015, 27, 248–254. [Google Scholar] [CrossRef] [PubMed]
  14. Ho, A.K.; Iansek, R.; Marigliani, C.; Bradshaw, J.L.; Gates, S. Speech Impairment in a Large Sample of Patients with Parkinson’s disease. J. Behav. Neurol. 1999, 11, 131–137. [Google Scholar] [CrossRef]
  15. Tsanas, A.; Little, M.; McSharry, P.; Ramig, L. Accurate telemonitoring of Parkinson’s Disease progression by noninvasive speech tests. IEEE Trans. Bio-Med. Eng. 2010, 57, 884–893. [Google Scholar] [CrossRef] [PubMed]
  16. Harel, B.T.; Cannizzaro, M.S.; Cohen, H.; Reilly, N.; Snyder, P.J. Acoustic characteristics of Parkinsonian speech: A potential biomarker of early disease progression and treatment. J. Neurolinguist. 2004, 17, 439–453. [Google Scholar] [CrossRef]
  17. Rusz, J.; Cmejla, R.; Ruzickova, H.; Klempir, J.; Majerova, V.; Picmausova, J.; Roth, J.; Ruzicka, E. Evaluation of speech impairment in early stages of Parkinson’s disease: A prospective study with the role of pharmacotherapy. J. Neural Transm. 2013, 120, 319–329. [Google Scholar] [CrossRef] [PubMed]
  18. Skodda, S.; Grönheit, W.; Schlegel, U.; Südmeyer, M.; Schnitzler, A.; Wojtecki, L. Effect of subthalamic stimulation on voice and speech in Parkinson’s disease: For the better or worse? Front. Neurol. 2014, 4, 218. [Google Scholar] [CrossRef] [PubMed]
  19. Orozco-Arroyave, J.R.; Hönig, F.; Arias-Londoño, J.D.; Vargas-Bonilla, J.F.; Daqrouq, K.; Skodda, S.; Rusz, J.; Nöth, E. Automatic detection of Parkinson’s disease in running speech spoken in three different languages. J. Acoust. Soc. Am. 2016, 139, 481–500. [Google Scholar] [CrossRef] [PubMed]
  20. Mekyska, J.; Smekal, Z.; Galaz, Z.; Mzourek, Z.; Rektorova, I.; Faundez-Zanuy, M.; López-de Ipiña, K. Perceptual features as markers of Parkinson’s Disease: the issue of clinical interpretability. In Recent Advances in Nonlinear Speech Processing; Springer: New York, NY, USA, 2016; pp. 83–91. [Google Scholar]
  21. Mekyska, J.; Galaz, Z.; Mzourek, Z.; Smekal, Z.; Rektorova, I.; Eliasova, I.; Kostalova, M.; Mrackova, M.; Berankova, D.; Faundez-Zanuy, M.; et al. Assessing progress of Parkinson’s disease using acoustic analysis of phonation. In Proceedings of the 2015 4th International Work Conference on Bioinspired Intelligence (IWOBI), San Sebastian, Spain, 10–12 June 2015; pp. 111–118. [Google Scholar]
  22. Arora, S.; Venkataraman, V.; Zhan, A.; Donohue, S.; Biglan, K.; Dorsey, E.; Little, M. Detecting and monitoring the symptoms of Parkinson’s disease using smartphones: A pilot study. Parkinsonism Relat. Disord. 2015, 21, 650–653. [Google Scholar] [CrossRef] [PubMed]
  23. Villa-Cañas, T.; Orozco-Arroyave, J.; Vargas-Bonilla, J.; Arias-Londoño, J. Modulation spectra for automatic detection of Parkinson’s disease. In Proceedings of the 2014 XIX Symposium on Image, Signal Processing and Artificial Vision (STSIVA), Armenia, Colombia, 17–19 September 2014; pp. 1–5. [Google Scholar]
  24. Hazan, H.; Hilu, D.; Manevitz, L.; Ramig, L.O.; Sapir, S. Early diagnosis of Parkinson’s disease via machine learning on speech data. In Proceedings of the 2012 IEEE 27th Convention of Electrical & Electronics Engineers in Israel (IEEEI), Eilat, Israel, 14–17 November 2012; pp. 1–4. [Google Scholar]
  25. Eskidere, Ö.; Ertaş, F.; Hanilçi, C. A comparison of regression methods for remote tracking of Parkinson’s disease progression. Expert Syst. Appl. 2012, 39, 5523–5528. [Google Scholar] [CrossRef]
  26. Castelli, M.; Vanneschi, L.; Silva, S. Prediction of the Unified Parkinson’s Disease Rating Scale assessment using a genetic programming system with geometric semantic genetic operators. Expert Syst. Appl. 2014, 41, 4608–4616. [Google Scholar] [CrossRef] [Green Version]
  27. Naranjo, L.; Pérez, C.J.; Martín, J. Addressing voice recording replications for tracking Parkinson’s disease progression. Med. Biol. Eng. Comput. 2017, 55, 365–373. [Google Scholar] [CrossRef] [PubMed]
  28. Skodda, S.; Rinsche, H.; Schlegel, U. Progression of dysprosody in Parkinson’s disease over time—A longitudinal study. Mov. Disord. 2009, 24, 716–722. [Google Scholar] [CrossRef] [PubMed]
  29. Skodda, S.; Flasskamp, A.; Schlegel, U. Instability of syllable repetition as a marker of disease progression in Parkinson’s disease: A longitudinal study. Mov. Disord. 2011, 26, 59–64. [Google Scholar] [CrossRef] [PubMed]
  30. Skodda, S.; Grönheit, W.; Schlegel, U. Impairment of vowel articulation as a possible marker of disease progression in Parkinson’s disease. PLoS ONE 2012, 7, e32132. [Google Scholar] [CrossRef] [PubMed]
  31. Skodda, S.; Gronheit, W.; Mancinelli, N.; Schlegel, U. Progression of Voice and Speech Impairment in the Course of Parkinson’s Disease: A Longitudinal Study. Parkinson’s Dis. 2013, 2013, 389195. [Google Scholar] [CrossRef] [PubMed]
  32. Lee, J.Y.; Kim, J.W.; Lee, W.Y.; Kim, J.M.; Ahn, T.B.; Kim, H.J.; Cho, J.; Jeon, B.S. Daily dose of dopaminergic medications in Parkinson’s disease: clinical correlates and a posteriori equation. Neurol. Asia 2010, 15, 137–143. [Google Scholar]
  33. Stiasny-Kolster, K.; Mayer, G.; Schafer, S.; Muller, J.C.; Heinzel-Gutenbrunner, M.; Oertel, W.H. The REM sleep behavior disorder screening questionnaire—A new diagnostic instrument. Mov. Disord. 2007, 22, 2386–2393. [Google Scholar] [CrossRef] [PubMed]
  34. Mol, H. Lossfree Twin-Tube Resonator and the Vowel Triangle of Hellwag. J. Acoust. Soc. Am. 1965, 37, 1186. [Google Scholar] [CrossRef] [Green Version]
  35. Orozco-Arroyave, J.R.; Hönig, F.; Arias-Londoño, J.D.; Vargas-Bonilla, J.; Skodda, S.; Rusz, J.; Nöth, E. Automatic detection of Parkinson’s disease from words uttered in three different languages. In Proceedings of the Fifteenth Annual Conference of the International Speech Communication Association, Singapore, 14–18 September 2014; pp. 1573–1577. [Google Scholar]
  36. Rusz, J.; Cmejla, R.; Tykalova, T.; Ruzickova, H.; Klempir, J.; Majerova, V.; Picmausova, J.; Roth, J.; Ruzicka, E. Imprecise vowel articulation as a potential early marker of Parkinson’s disease: Effect of speaking task. J. Acoust. Soc. Am. 2013, 134, 2171–2181. [Google Scholar] [CrossRef] [PubMed]
  37. Rusz, J.; Cmejla, R.; Ruzickova, H.; Ruzicka, E. Quantitative acoustic measurements for characterization of speech and voice disorders in early untreated Parkinson’s disease. J. Acoust. Soc. Am. 2011, 129, 350–367. [Google Scholar] [CrossRef] [PubMed]
  38. Titze, I.R. Principles of Voice Production; Prentice Hall: Englewood Cliffs, NJ, USA, 1994. [Google Scholar]
  39. Harar, P.; Alonso-Hernandezy, J.B.; Mekyska, J.; Galaz, Z.; Burget, R.; Smekal, Z. Voice Pathology Detection Using Deep Learning: A Preliminary Study. In Proceedings of the 2017 International Conference and Workshop on Bioinspired Intelligence (IWOBI), Funchal, Portugal, 10–12 July 2017; pp. 45–48. [Google Scholar]
  40. Harar, P.; Galaz, Z.; Alonso-Hernandez, J.B.; Mekyska, J.; Burget, R.; Smekal, Z. Towards robust voice pathology detection. Neural Comput. Appl. 2018. [Google Scholar] [CrossRef]
  41. Kostalova, M.; Mrackova, M.; Marecek, R.; Berankova, D.; Eliasova, I.; Janousova, E.; Roubickova, J.; Bednarik, J.; Rektorova, I. The 3F Test Dysarthric Profile—Normative Speach Values in Czech. Ceska Slovenska Neurologie Neurochirurgie 2013, 76, 614–618. [Google Scholar]
  42. Boersma, P.; Weenink, D. Praat, a system for doing phonetics by computer. Glot Int. 2002, 5, 341–345. [Google Scholar]
  43. Mekyska, J.; Janousova, E.; Gomez-Vilda, P.; Smekal, Z.; Rektorova, I.; Eliasova, I.; Kostalova, M.; Mrackova, M.; Alonso-Hernandez, J.B.; Faundez-Zanuy, M.; et al. Robust and complex approach of pathological speech signal analysis. Neurocomputing 2015, 167, 94–111. [Google Scholar] [CrossRef]
  44. Rektorova, I.; Mekyska, J.; Janousova, E.; Kostalova, M.; Eliasova, I.; Mrackova, M.; Berankova, D.; Necasova, T.; Smekal, Z.; Marecek, R. Speech prosody impairment predicts cognitive decline in Parkinson’s disease. Parkinsonism Relat. Disord. 2016, 29, 90–95. [Google Scholar] [CrossRef] [PubMed]
  45. Arias-Vergara, T.; Vásquez-Correa, J.C.; Orozco-Arroyave, J.R. Parkinson’s Disease and Aging: Analysis of Their Effect in Phonation and Articulation of Speech. Cogn. Comput. 2017, 9, 731–748. [Google Scholar] [CrossRef]
  46. Rusz, J.; Tykalova, T.; Klempir, J.; Cmejla, R.; Ruzicka, E. Effects of dopaminergic replacement therapy on motor speech disorders in Parkinson’s disease: Longitudinal follow-up study on previously untreated patients. J. Neural Transm. 2016, 123, 379–387. [Google Scholar] [CrossRef] [PubMed]
  47. Chen, T.; Guestrin, C. Xgboost: A scalable tree boosting system. In Proceedings of the 22nd ACM SIGKDD International Conference on Knowledge Discovery and Data Mining, San Francisco, CA, USA, 13–17 August 2016; pp. 785–794. [Google Scholar]
  48. Breiman, L.; Friedman, J.H.; Olshen, R.A.; Stone, C.J. Classification and Regression Trees; Wadsworth and Brooks: Monterey, CA, USA, 1984. [Google Scholar]
  49. Torlay, L.; Perrone-Bertolotti, M.; Thomas, E.; Baciu, M. Machine learning—XGBoost analysis of language networks to classify patients with epilepsy. Brain Inform. 2017, 4, 159. [Google Scholar] [CrossRef] [PubMed]
  50. Chen, Y.; Wang, X.; Jung, Y.; Abedi, V.; Zand, R.; Bikak, M.; Adibuzzaman, M. Classification of short single lead electrocardiograms (ECGs) for atrial fibrillation detection using piecewise linear spline and XGBoost. Physiol. Meas. 2018, 39, 104006. [Google Scholar] [CrossRef] [PubMed]
  51. Zhong, J.; Sun, Y.; Peng, W.; Xie, M.; Yang, J.; Tang, X. XGBFEMF: An XGBoost-based Framework for Essential Protein Prediction. IEEE Trans. NanoBiosci. 2018, 17, 243–250. [Google Scholar] [CrossRef] [PubMed]
  52. Palmer, J.L.; Coats, M.A.; Roe, C.M.; Hanko, S.M.; Xiong, C.; Morris, J.C. Unified Parkinson’s Disease Rating Scale-Motor Exam: Inter-rater reliability of advanced practice nurse and neurologist assessments. J. Adv. Nurs. 2010, 66, 1382–1387. [Google Scholar] [CrossRef] [PubMed]
  53. Baggio, J.A.O.; Curtarelli, M.B.; Rodrigues, G.R.; Tumas, V. Validity of the Brazilian version of the freezing of gait questionnaire. Arquivos de Neuro-Psiquiatria 2012, 70, 599–603. [Google Scholar] [CrossRef] [PubMed] [Green Version]
  54. Santos, D.G.; Macías, M.A. Inter-rater variability in motor function assessment in Parkinson’s disease between experts in movement disorders and nurses specialising in PD management. Neurologia 2017. [Google Scholar] [CrossRef]
  55. Jankovic, J. Parkinson’s disease: Clinical features and diagnosis. J. Neurol. Neurosurg. Psychiatry 2008, 79, 368–376. [Google Scholar] [CrossRef] [PubMed]
  56. Mekyska, J.; Galaz, Z.; Kiska, T.; Zvoncak, V.; Mucha, J.; Smekal, Z.; Eliasova, I.; Kostalova, M.; Mrackova, M.; Fiedorova, D.; et al. Quantitative Analysis of Relationship Between Hypokinetic Dysarthria and the Freezing of Gait in Parkinson’s Disease. Cogn. Comput. 2018. [Google Scholar] [CrossRef]
  57. Berg, D.; Postuma, R.B.; Adler, C.H.; Bloem, B.R.; Chan, P.; Dubois, B.; Gasser, T.; Goetz, C.G.; Halliday, G.; Joseph, L.; et al. MDS research criteria for prodromal Parkinson’s disease. Mov. Dis. 2015, 30, 1600–1611. [Google Scholar] [CrossRef] [PubMed]
Figure 1. Descriptive statistical graphs of clinical characteristics of the PD patient dataset: on the main diagonal, histograms are visualized. Next, the upper triangular part of the graph-grid shows scatter plots with the fitted lines of linear regression models. Finally, the lower triangular part of the graph-grid is used to display residuals for the models shown in the upper grid. Color notation: the blue color represents data for session 1, and the green color represents data for session 2.
Applsci 08 02339 g001
Figure 2. Feature importance graphs for trained XGBoost models. Each column shows graphs for the models trained to estimate the change ( Δ ) in values of a particular clinical rating scale (UPDRS III, UPDRS IV, RBDSQ, FOG-G). Each row shows graphs for the models trained using the features extracted from the recordings of a particular vowel phonation (/a/, /e/, /i/, /o/, /u/). The scale of the graphs is unified so that it is easier to compare the values among the models.
Applsci 08 02339 g002
Table 1. Clinical characteristics of the patients.
ScaleMean ± sd (s1)Mean ± sd (s2)Mean ± sd ( Δ )p (Wilcoxon)
LED917.61 ± 544.781129.92 ± 477.50212.31 ± −67.280.188
UPDRS III22.49 ± 13.4727.45 ± 12.684.96 ± −0.790.000
UPDRS IV2.82 ± 2.583.44 ± 2.940.62 ± 0.360.632
FOG-Q6.57 ± 5.408.33 ± 5.971.76 ± 0.570.000
RBDSQ3.98 ± 3.253.78 ± 2.28−0.2 ±−0.980.522
ACE-R87.92 ± 7.6285.89 ± 9.48−2.03 ± 1.860.000
s1—first session; s2—second session; Δ —delta session ( session 2 session 1 ); p (Wilcoxon) — p-value for Wilcoxon signed-rank test (paired samples); LED—L-dopa equivalent daily dose (mg/day) [32]; UPDRS III—Unified Parkinson’s Disease Rating Scale, part III: evaluation of motor function [3], UPDRS IV—Unified Parkinson’s Disease Rating Scale, part IV: evaluation of complications of therapy [3]; FOG-Q—Freezing of gait questionnaire [4]; RBDSQ—The REM sleep behavior disorder screening questionnaire [33]; ACE-R—Addenbrooke’s Cognitive Examination-Revised [5].
Table 2. Statistical description of acoustic features for all vocal tasks.
FeatureMean ± sd (s1)Mean ± sd (s2)Mean ± sd ( Δ )p (Wilcoxon)
vowel /a/
PPQ1.31 ± 1.281.89 ± 2.520.58 ± 1.240.069
APQ10.69 ± 4.2312.81 ± 6.662.12 ± 2.420.063
FLUF3.87 ± 5.284.77 ± 5.610.90 ± 0.320.386
HNR (Q2)13.35 ± 2.9012.81 ± 3.73−0.54 ± 0.830.390
HNR (SD)4.17 ± 0.864.18 ± 0.890.02 ± 0.030.928
F1 (CV)0.15 ± 0.060.18 ± 0.100.02 ± 0.040.180
F2 (CV)0.22 ± 0.150.23 ± 0.150.00 ± 0.000.913
F3 (CV)8.25 ± 40.444.50 ± 21.67−3.75 ± −18.770.575
ER (Q2)6.98 ± 33.977.40 ± 36.430.42 ± 2.460.954
ER (CV)0.57 ± 0.260.57 ± 0.300.01 ± 0.050.880
F0 (CV)0.30 ± 0.740.36 ± 1.150.06 ± 0.410.763
GNE (Q2)−0.46 ± 1.85−0.46 ± 1.850.00 ± −0.000.997
GNE (SD)0.23 ± 0.740.30 ± 0.970.07 ± 0.230.679
TEO (CV)−0.34 ± 1.71−0.31 ± 1.750.03 ± 0.040.931
NNE (Q2)−1.45 ± 7.41−1.33 ± 7.080.13 ± −0.340.932
NNE (SD)1.80 ± 0.761.79 ± 0.78−0.01 ± 0.020.955
vowel /e/
PPQ1.31 ± 1.171.80 ± 3.060.50 ± 1.890.269
APQ11.21 ± 6.8215.05 ± 9.953.84 ± 3.130.036
FLUF2.62 ± 3.585.31 ± 6.022.69 ± 2.440.007
HNR (Q2)14.36 ± 3.9213.75 ± 4.40−0.61 ± 0.480.394
HNR (SD)4.19 ± 0.964.32 ± 1.180.13 ± 0.210.533
F1 (CV)0.62 ± 0.230.56 ± 0.24−0.05 ± 0.010.173
F2 (CV)0.19 ± 0.070.19 ± 0.09−0.00 ± 0.020.965
F3 (CV)12.41 ± 86.287.06 ± 48.94−5.36 ± −37.340.709
ER (Q2)3.46 ± 23.303.39 ± 22.83−0.07 ± −0.470.989
ER (CV)0.59 ± 0.280.61 ± 0.370.02 ± 0.100.702
F0 (CV)0.42 ± 1.470.19 ± 0.50−0.24 ± −0.970.293
GNE (Q2)−0.36 ± 1.77−0.17 ± 1.180.19 ± −0.590.536
GNE (SD)0.08 ± 0.360.06 ± 0.30−0.02 ± −0.070.726
TEO (CV)−0.07 ± 0.50−0.19 ± 1.31−0.11 ± 0.800.571
NNE (Q2)−0.19 ± 1.35−0.21 ± 1.44−0.01 ± 0.100.961
NNE (SD)1.67 ± 0.561.83 ± 0.610.17 ± 0.050.055
vowel /i/
PPQ1.26 ± 1.681.92 ± 3.080.66 ± 1.400.196
APQ10.49 ± 5.3114.83 ± 9.654.35 ± 4.340.005
FLUF2.13 ± 3.734.60 ± 6.892.46 ± 3.150.013
HNR (Q2)17.16 ± 3.3816.17 ± 5.32−0.98 ± 1.950.212
HNR (SD)4.51 ± 1.124.53 ± 1.400.02 ± 0.280.921
F1 (CV)0.67 ± 0.480.58 ± 0.40−0.09 ± −0.080.170
F2 (CV)0.14 ± 0.070.16 ± 0.080.02 ± 0.000.088
F3 (CV)0.09 ± 0.2138.22 ± 207.8238.14 ± 207.610.205
ER (Q2)0.09 ± 0.088.35 ± 33.158.27 ± 33.070.087
ER (CV)0.61 ± 0.370.56 ± 0.44−0.05 ± 0.070.490
F0 (CV)0.36 ± 1.390.35 ± 1.17−0.01 ± −0.220.961
GNE (Q2)−0.30 ± 1.49−0.30 ± 1.480.01 ± −0.010.980
GNE (SD)0.07 ± 0.320.12 ± 0.400.06 ± 0.080.449
TEO (CV)0.78 ± 0.550.36 ± 2.47−0.42 ± 2.470.238
NNE (Q2)−0.01 ± 0.18−0.20 ± 11.53−0.19 ± 1.150.228
NNE (SD)1.44 ± 0.551.40 ± 0.70−0.05 ± 0.150.727
vowel /o/
PPQ1.14 ± 1.061.68 ± 2.060.54 ± 0.990.047
APQ11.09 ± 4.4114.16 ± 9.943.06 ± 5.530.051
FLUF2.64 ± 4.325.63 ± 7.242.99 ± 2.910.008
HNR (Q2)15.49 ± 3.3015.28 ± 4.79−0.22 ± 1.490.773
HNR (SD)4.93 ± 1.144.57 ± 1.36−0.36 ± 0.210.149
F1 (CV)0.24 ± 0.190.31 ± 0.220.06 ± 0.030.091
F2 (CV)0.14 ± 0.100.14 ± 0.100.00 ± 0.010.867
F3 (CV)8.75 ± 35.3623.86 ± 96.3415.11 ± 60.970.317
ER (Q2)8.17 ± 32.528.07 ± 32.42−0.10 ±−0.100.989
ER (CV)0.64 ± 0.390.61 ± 0.36−0.03 ±−0.020.705
F0 (CV)0.40 ± 0.910.63 ± 1.810.24 ± 0.890.434
GNE (Q2)−0.91 ± 2.72−1.25 ± 3.11−0.35 ± 0.390.582
GNE (SD)0.30 ± 0.750.39 ± 0.900.09 ± 0.150.580
TEO (CV)−0.74 ± 3.27−0.28 ± 1.300.46 ± −1.970.376
NNE (Q2)−0.19 ± 0.79−0.11 ± 0.470.09 ± −0.310.530
NNE (SD)1.62 ± 0.831.58 ± 0.91−0.04 ± 0.080.843
vowel /u/
PPQ1.35 ± 1.172.60 ± 3.071.26 ± 1.900.009
APQ12.66 ± 5.6017.03 ± 9.504.37 ± 3.910.007
FLUF2.77 ± 5.138.52 ± 9.835.75 ± 4.690.001
HNR (Q2)15.28 ± 4.2314.32 ± 5.22−0.96 ± 0.990.270
HNR (SD)5.40 ± 1.565.08 ± 1.46−0.32 ±−0.100.252
F1 (CV)0.69 ± 0.440.71 ± 0.340.03 ± −0.100.667
F2 (CV)0.17 ± 0.090.18 ± 0.090.01 ± −0.000.468
F3 (CV)10.28 ± 52.2115.04 ± 104.804.76 ± 52.580.779
ER (Q2)8.27 ± 33.823.63 ± 25.29−4.64 ±−8.530.453
ER (CV)0.67 ± 0.390.74 ± 0.430.06 ± 0.040.431
F0 (CV)0.23 ± 0.670.18 ± 0.10−0.05 ±−0.570.586
GNE (Q2)−0.19 ± 1.310.00 ± 0.000.19 ± −1.310.323
GNE (SD)0.09 ± 0.400.10 ± 0.700.01 ± 0.300.966
TEO (CV)−0.51 ± 2.69−0.07 ± 0.510.43 ± −2.180.275
NNE (Q2)−1.27 ± 7.09−0.31 ± 2.1900.96 ± −4.910.373
NNE (SD)1.57 ± 0.731.68 ± 0.490.11 ± −0.240.379
Table 3. Spearman’s correlation coefficients between baseline acoustic features and Δ of clinical data.
Feature/a//e//i//o//u//a//e//i//o//u/
UPDRS IIIUPDRS IV
PPQ−0.07−0.080.26−0.09−0.10−0.11−0.26−0.08−0.17−0.08
APQ−0.06−0.050.17−0.10−0.090.080.12−0.010.06−0.09
FLUF0.100.080.110.100.16−0.23−0.47 **−0.33 *−0.34 *−0.32 *
HNR (Q2)0.160.07−0.050.170.09−0.02−0.080.070.110.16
HNR (SD)0.100.11−0.04−0.05−0.150.07−0.020.20−0.22−0.09
F1 (CV)0.040.10−0.17−0.020.19−0.27−0.070.08−0.32 *0.08
F2 (CV)−0.150.20−0.10−0.110.11−0.37 *−0.11−0.12−0.230.04
F3 (CV)−0.240.25−0.23−0.170.110.220.280.100.32 *0.10
ER (Q2)−0.250.25−0.14−0.170.170.160.280.120.34 *0.32 *
ER (CV)0.12−0.090.22−0.030.11−0.17−0.14−0.22−0.18−0.06
F0 (CV)0.28−0.120.04−0.080.170.33 *−0.04−0.24−0.16−0.21
GNE (Q2)−0.140.11−0.150.06−0.17−0.35 *0.250.150.270.33 *
GNE (SD)−0.16−0.08−0.12−0.220.240.30 *−0.01−0.040.220.11
TEO (CV)0.28−0.250.110.15−0.25−0.23−0.28−0.28−0.23−0.30 *
NNE (Q2)0.28−0.25−0.090.14−0.23−0.15−0.28−0.22−0.26−0.31 *
NNE (SD)0.09−0.250.120.11−0.26−0.43 **−0.17−0.28−0.12−0.12
RBDSQFOG-Q
PPQ0.150.110.21−0.130.33 *−0.20−0.090.15−0.090.08
APQ0.29 *0.270.210.270.20−0.18−0.14−0.16−0.16−0.12
FLUF−0.060.06−0.22−0.17−0.240.200.150.130.170.23
HNR (Q2)−0.20−0.17−0.19−0.27−0.200.090.03−0.030.09−0.05
HNR (SD)−0.17−0.160.21−0.36 *−0.270.070.240.210.180.12
F1 (CV)0.08−0.020.240.090.110.16−0.220.33 *−0.20−0.20
F2 (CV)−0.08−0.09−0.26−0.17−0.270.18−0.09−0.03−0.130.26
F3 (CV)−0.10−0.04−0.110.07−0.080.030.220.140.08−0.11
ER (Q2)−0.19−0.21−0.26−0.12−0.16−0.130.040.250.10−0.05
ER (CV)0.080.280.20−0.28−0.110.04−0.13−0.110.100.06
F0 (CV)0.210.130.190.250.100.37 *0.20−0.03−0.100.19
GNE (Q2)−0.16−0.17−0.28−0.18−0.16−0.29−0.250.05−0.19−0.19
GNE (SD)−0.05−0.09−0.250.09−0.200.080.14−0.050.120.15
TEO (CV)0.050.040.27−0.170.15−0.05−0.22−0.07−0.25−0.01
NNE (Q2)0.240.280.180.200.21−0.040.210.170.160.20
NNE (SD)−0.27−0.05−0.19−0.160.11−0.23−0.120.16−0.22 **0.05
*—p-value of Spearman’s correlation coefficient <0.05; **—p-value of Spearman’s correlation coefficient <0.01.
Table 4. Spearman’s correlation coefficients between Δ of acoustic features and Δ of clinical data.
Feature/a//e//i//o//u//a//e//i//o//u/
UPDRS IIIUPDRS IV
PPQ−0.12−0.20−0.31 *0.10−0.130.090.40 **0.250.210.10
APQ−0.17−0.14−0.26−0.06−0.150.060.080.100.060.03
FLUF−0.27−0.30 *−0.15−0.40 **−0.250.170.210.280.040.21
HNR (Q2)−0.040.080.22−0.070.09−0.02−0.03−0.14−0.14−0.17
HNR (SD)0.12−0.18−0.25−0.050.19−0.100.08−0.21−0.080.13
F1 (CV)−0.35 *−0.26−0.04−0.28−0.38 **0.05−0.04−0.07−0.02−0.11
F2 (CV)0.13−0.34 *−0.22−0.07−0.230.39 **0.07−0.070.280.21
F3 (CV)0.29 *−0.190.220.24−0.09−0.16−0.12−0.21−0.21−0.10
ER (Q2)0.31 *−0.150.040.26−0.13−0.11−0.07−0.16−0.27−0.29 *
ER (CV)−0.23−0.05−0.16−0.170.05−0.08−0.33 *0.12−0.040.14
F0 (CV)−0.32 *0.180.21−0.19−0.30 *−0.150.120.15−0.130.15
GNE (Q2)0.27−0.22−0.220.200.170.17−0.18−0.150.11−0.27
GNE (SD)0.160.32 *0.230.14−0.25−0.180.10−0.07−0.25−0.05
TEO (CV)−0.23−0.18−0.11−0.130.230.29 *−0.130.280.280.30 *
NNE (Q2)−0.250.14−0.12−0.190.200.100.160.240.30 *0.31 *
NNE (SD)−0.120.05−0.42 **−0.060.110.29 *0.150.160.240.16
RBDSQFOG-Q
PPQ−0.23−0.19−0.16−0.17−0.37 *0.15−0.17−0.180.12−0.10
APQ−0.28−0.37 *−0.38 **−0.29−0.32 *0.080.080.060.140.09
FLUF0.05−0.060.060.10−0.18−0.41 **−0.29 *−0.10−0.35 *−0.40 **
HNR (Q2)0.29 *0.35 *0.31 *0.36 *0.41 **0.150.110.120.020.04
HNR (SD)0.230.36 *0.100.40 **0.30 *−0.060.07−0.18−0.200.01
F1 (CV)−0.230.04−0.120.06−0.16−0.29−0.04−0.42 **0.120.13
F2 (CV)−0.060.080.160.170.06−0.27−0.08−0.20−0.09−0.37 *
F3 (CV)0.070.15−0.25−0.40 **−0.10−0.070.180.09−0.080.20
ER (Q2)0.170.23−0.27−0.270.090.120.26−0.06−0.210.17
ER (CV)−0.10−0.46 **0.060.28−0.11−0.00−0.30 *−0.34 *0.08−0.19
F0 (CV)−0.17−0.14−0.17−0.12−0.11−0.23−0.170.20−0.05−0.23
GNE (Q2)0.130.30 *0.250.130.150.200.17−0.210.070.27
GNE (SD)0.040.40 **−0.23−0.230.25−0.070.140.24−0.030.14
TEO (CV)−0.06−0.250.240.25−0.180.06−0.37 *−0.170.34 *−0.20
NNE (Q2)−0.15−0.42 **0.240.27−0.23−0.20−0.28−0.050.25−0.13
NNE (SD)0.250.020.200.24−0.150.180.10−0.250.06 **−0.15
*—p-value of Spearman’s correlation coefficient <0.05; **—p-value of Spearman’s correlation coefficient <0.01.
Table 5. Results of the clinical scales’ estimation.
VTMAEEER [%]MAEEER [%]MAEEER [%]MAEEER [%]
UPDRS IIIUPDRS IVRBDSQFOG-Q
/a/8.2 ± 2.629.1 ± 9.21.9 ± 0.612.9 ± 4.12.2 ± 1.017.6 ± 8.13.1 ± 0.814.7 ± 3.8
/e/7.3 ± 2.025.7 ± 7.01.8 ± 0.712.2 ± 4.82.0 ± 0.816.4 ± 6.93.4 ± 1.016.1 ± 5.0
/i/7.4 ± 2.726.3 ± 9.41.9 ± 0.812.9 ± 5.52.0 ± 0.716.3 ± 6.32.9 ± 0.713.6 ± 3.6
/o/7.9 ± 2.128.2 ± 7.71.7 ± 0.711.3 ± 4.82.1 ± 0.816.8 ± 6.33.3 ± 0.515.4 ± 2.6
/u/7.7 ± 2.527.2 ± 8.82.0 ± 0.813.8 ± 5.52.1 ± 0.917.3 ± 7.22.8 ± 0.913.2 ± 4.5
VT—vocal task; MAE—mean absolute error; EER—estimation error rate.

