1. Introduction
In connection with the recent sharp increase in the complexity of microelectronic devices caused by the need to combine various technologies for recording, storing, and processing information, attention has been paid to multifunctional materials with ferroelectric, ferroelastic, ferromagnetic, and other properties—multiferroics. A special place among them is occupied by materials based on bismuth ferrite (BiFeO
3) due to the combination of magnetic and ferroelectric orderings in them, coexisting in a rather wide temperature range (
TN ≈ 643 K,
TC ≈ 1083 K) [
1]. The crystal structure of bismuth ferrite at room temperature is characterized by rhombohedrally distorted perovskite cell with R3c space group, very close to cubic one. In the area of temperatures below the
ТN bismuth ferrite has a complex spatially modulated magnetic structure of cycloid type, which suppress ferromagnetic properties [
2]. One of the possible ways to destroy this modulated structure and thus to enhance the magnetic properties is substitution of bismuth by rare-earth elements (REE). Guided by the abovementioned considerations, in continuation of earlier studies [
3,
4], this work aims to identify the general patterns of formation of the crystal structure, microstructure, thermal and electrical properties of ceramic samples of bismuth ferrite, replaced by Er of various concentrations.
2. Materials and Methods
Objects of the present study were Bi1-хErхFeO3 type SS with 0.00 ≤ x ≤ 0.20, Δх = 0.05, obtained by two-stage solid-phase synthesis followed by sintering, by conventional ceramic technology at T1sint = 1073 K, T2sint = 1093 K, τ1,2 sint = 10 h, Tsynt = 1183 K, τ = 2 h.
The phase composition of SS Bi
1−xEr
xFeO3 was determined by X-ray powder diffraction (CoKα radiation) with use of DRON-3 diffractometer (Bourevestnik, St. Petersburg, Russia). The parameters,
a,
α, and volume
Vexp, of the rhombohedral perovskite cell were calculated from the reflections (200)
с and (220)
с using the corresponding quadratic forms [
5]. Theoretical volume,
Vth, was calculated by the formula [
5]:
where
n is the valency of cations,
L is the length of the unstressed cation–oxygen bond, taking into account the coordination number of the cation in oxygen (the ionic radii on Belov-Bokiy [
6]).
Investigation of surface morphology of the samples performed in reflected light on an optical microscope Neophot 21 (Carl Zeiss Jena GmbH, Jena, Germany) and on the inverted high-precision microscope Leica DMI 5000M (Leica Microsystems, Wetzlar, Germany).
Dependencies of relative dielectric permittivity, ε/ε0, were carried out in the range of frequencies from 25 to 2 × 10⁶ Hz and in the 300–900 K temperature range with use of precision LCR meter Agilent E4980A (Agilent Technologies, Santa-Clara, CA, USA).
Thermal diffusivity (χ) was investigated at the LFA-457 “MicroFlash” facility (NETZSCH-Gerätebau GmbH, Selb, Germany), heat capacity (Ср)—by means of the differential scanning calorimeter DSC-204 F1 (NETZSCH-Gerätebau GmbH, Selb, Germany).
3. Results
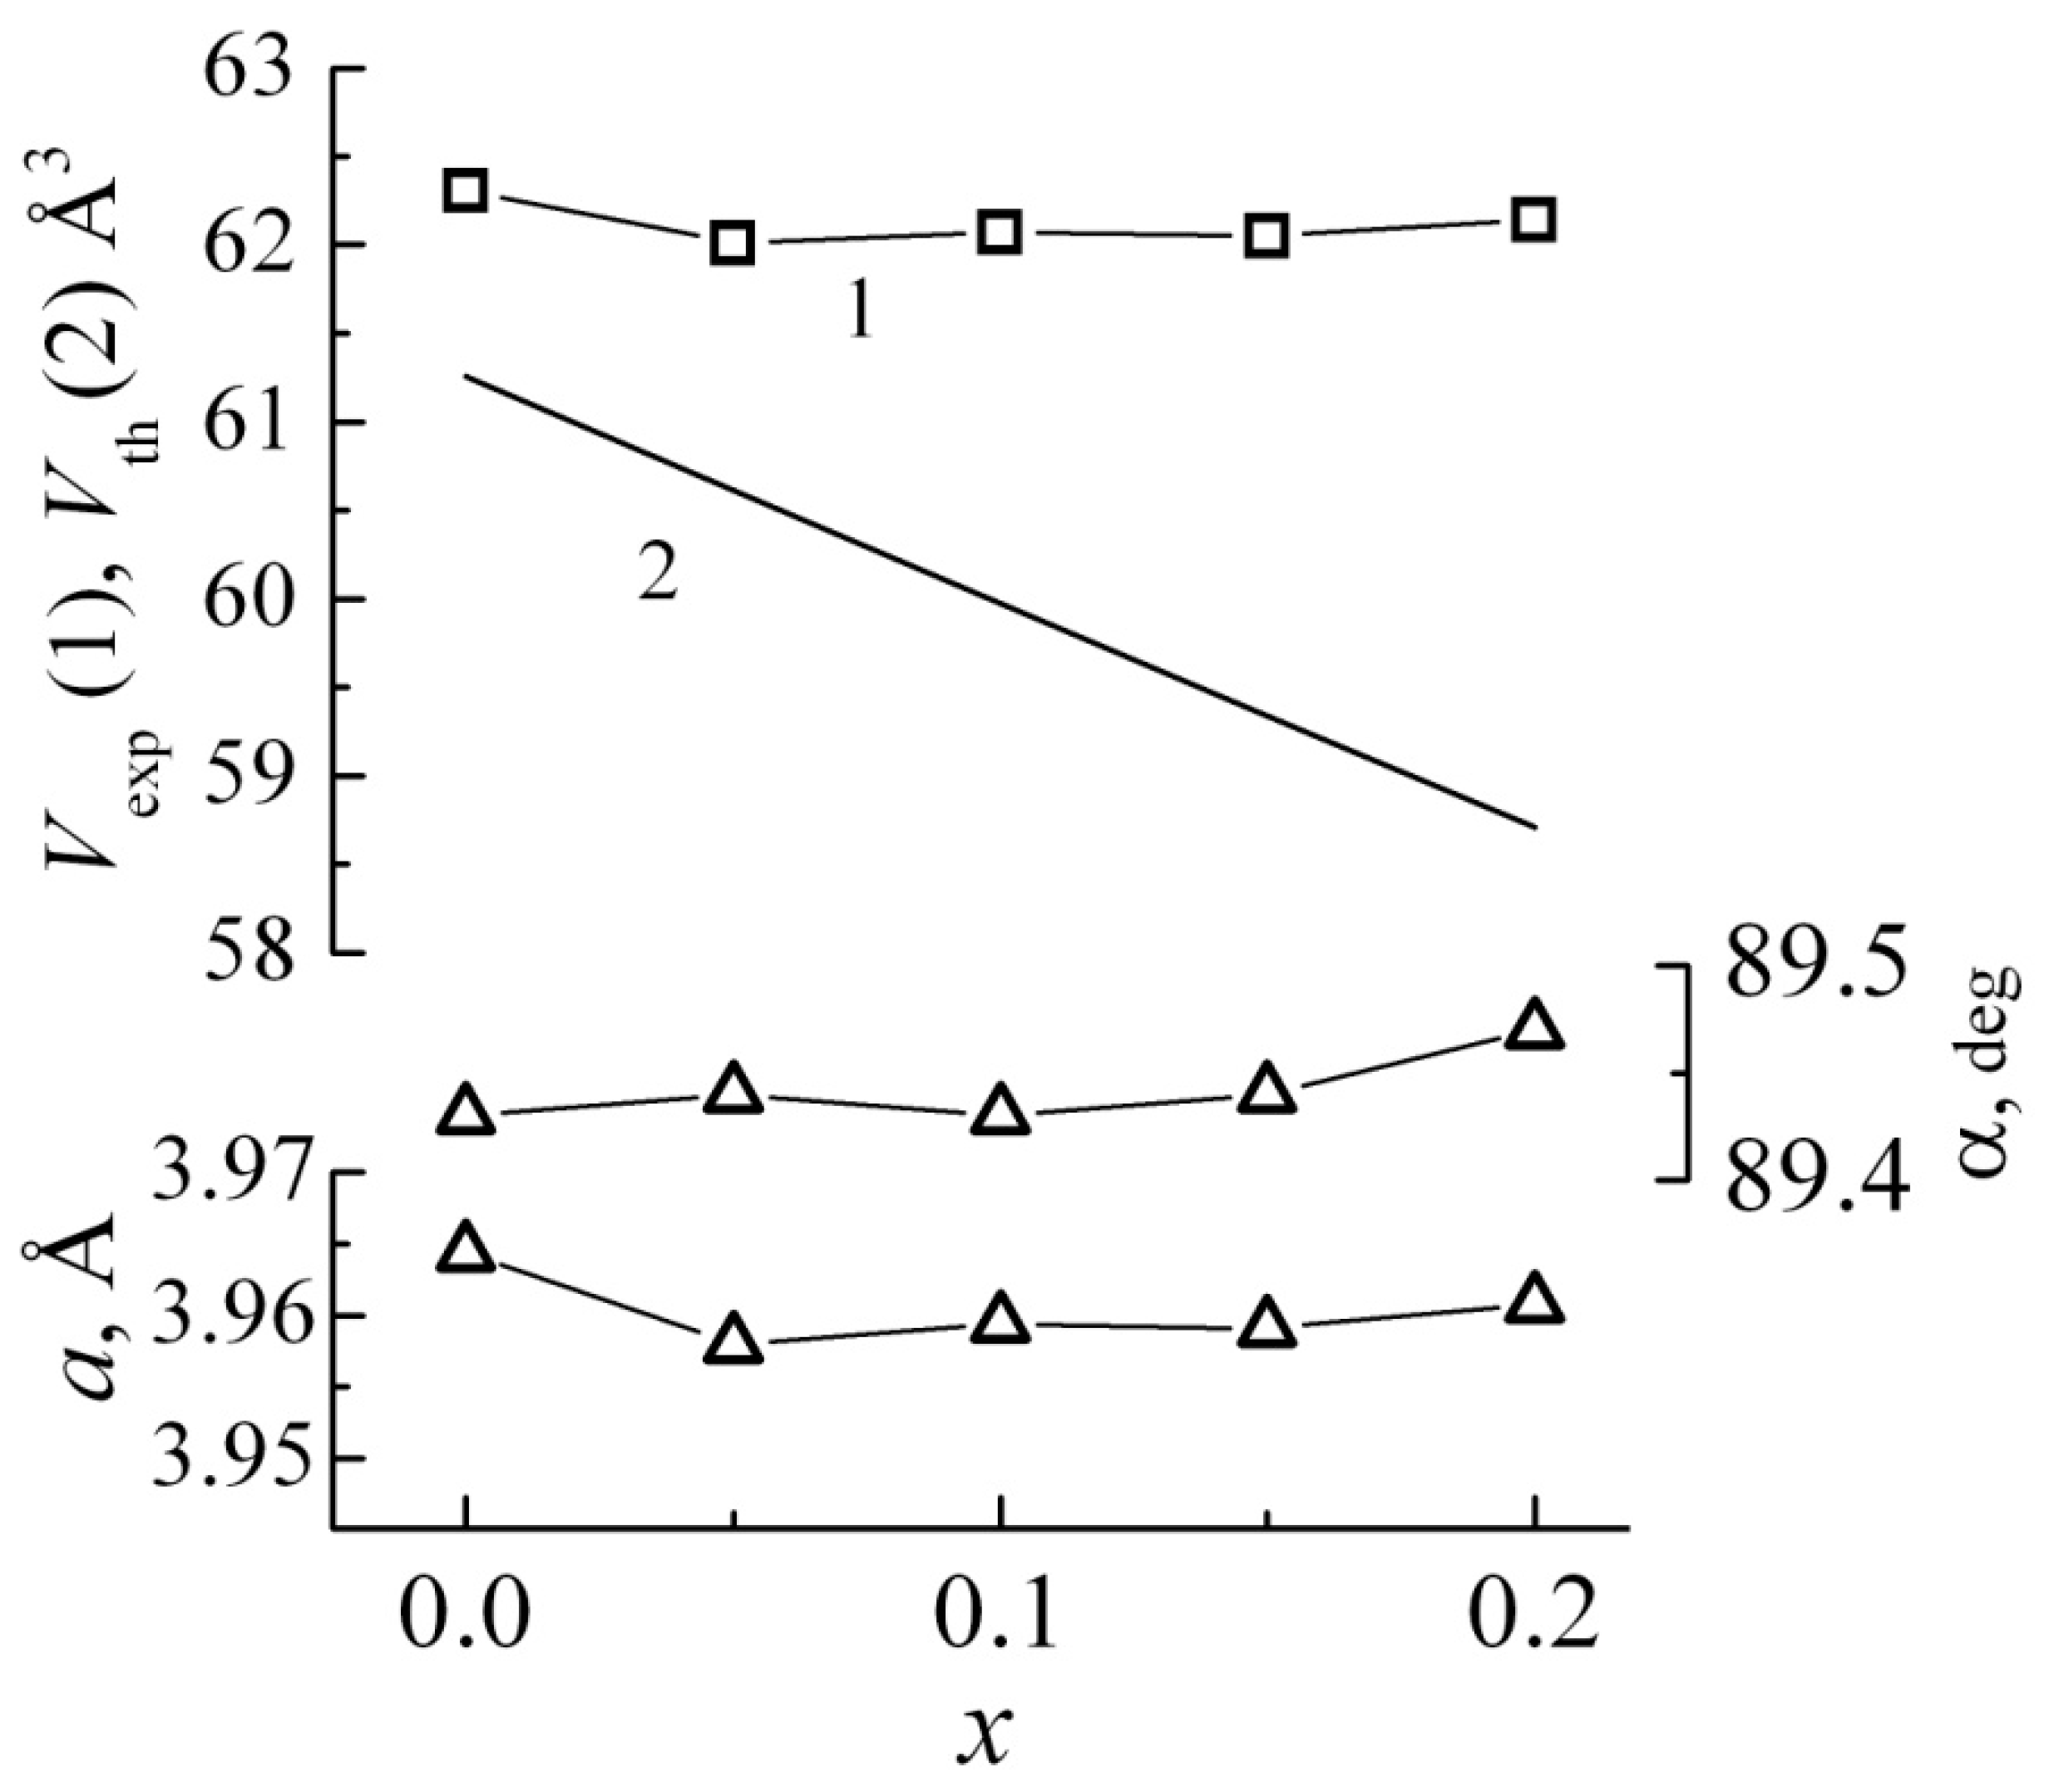
Figure 1 demonstrates dependences of structural parameters SS on concentration of the modifiers.
The results showed that, along with SS, the compounds Bi2Fe4O9, Bi25FeO40, and Er3Fe5O12 are formed in the samples under study, whose content increases with x. The intensity of the strong lines of these compounds at x = 0.15 and 0.20 reaches 50%.
The rhombohedral symmetry of the perovskite cell in SS is retained for all
x. In
Figure 1, it can be seen that
Vexp (
x) does not correspond to the dependence
Vth (
x) calculated for the Er → Bi substitution SS, a slight drop in
Vexp (
x) is observed only in the range 0.00 <
x ≤ 0.05, with
x > 0. 05
Vexp practically unchanged. From this it follows that in the structure of BiFeO
3 under selected conditions for the manufacture of ceramics can dissolve less than 5 mol % Er. Therefore, in Bi
1−xEr
xFeO
3 SS, an impurity compound with the garnet structure Er
3Fe
5O
12 is formed already at
x = 0.05. The other two compounds are routine impurity phases, which cannot be eliminated during the synthesis of bismuth ferrite.
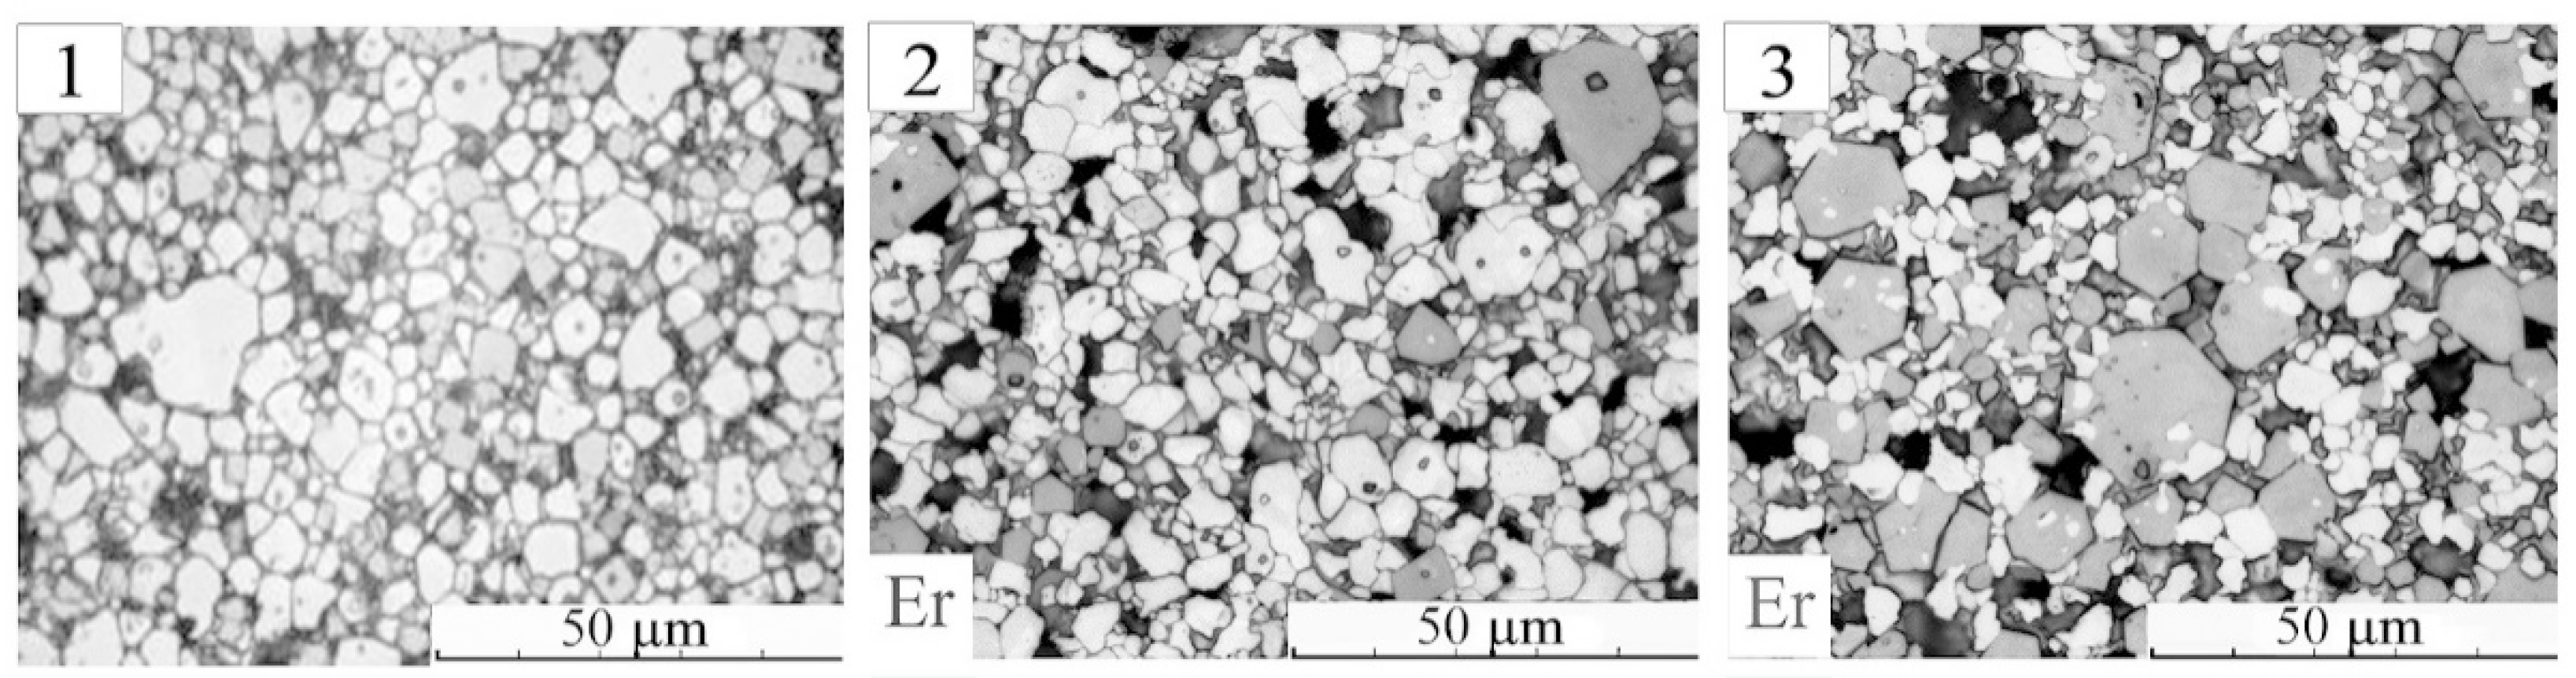
Figure 2 demonstrates microstructure elements of BiFeO
3 ceramic samples before and after modifying with Er (
x = 0.10; 0.20).
Black regions with roundish or curvilinear boundaries are pores. They are localized over the surface non-uniformly. Ceramic grains (crystallites) were detected by etching their boundaries. It led to the formation of etching grooves, observed as dark lines along the boundaries of the crystallites.
Both BiFeO3 and Bi1−xErxFeO3 ceramics are polycrystalline structures with non-phase grained components. The brightest “light” crystallites represent the main phase. Gray grains are a fraction of minor phases. The average, as well as the maximum sizes of crystallites of the main “light” phase in the bismuth ferrite ceramics exceed the analogous parameters of the non-main “gray” phase. The interval of their values is also wider. When modifying, the maximum size of the crystallites of the “light” phase is somewhat reduced in the same way as their average size.
Unlike the main phase, where the formation of large crystallites is suppressed, the introduction of a modifier leads to the growth of large grains of minor phases. In addition, with an increase in the Er content, a characteristic hexagonal shape of a part of such crystallites arises, which corresponds to the garnet structure (
Figure 2 and
Figure 3). Thus, in the form of grains, we observe the appearance of an additional non-basic phase. The percentage of minor phases is also increasing.
The interphase boundaries in the obtained multiphase objects are realized as boundary contacts in mixtures of crystallites of different phases, and at the level of substructures formed by the smallest grains of one phase inside the grains of another. Usually it leads to weakening of the dielectric properties by increasing the internal electromechanical loss, space charge accumulation at the interfaces, micro and mesoscopic areas having different electrical properties.
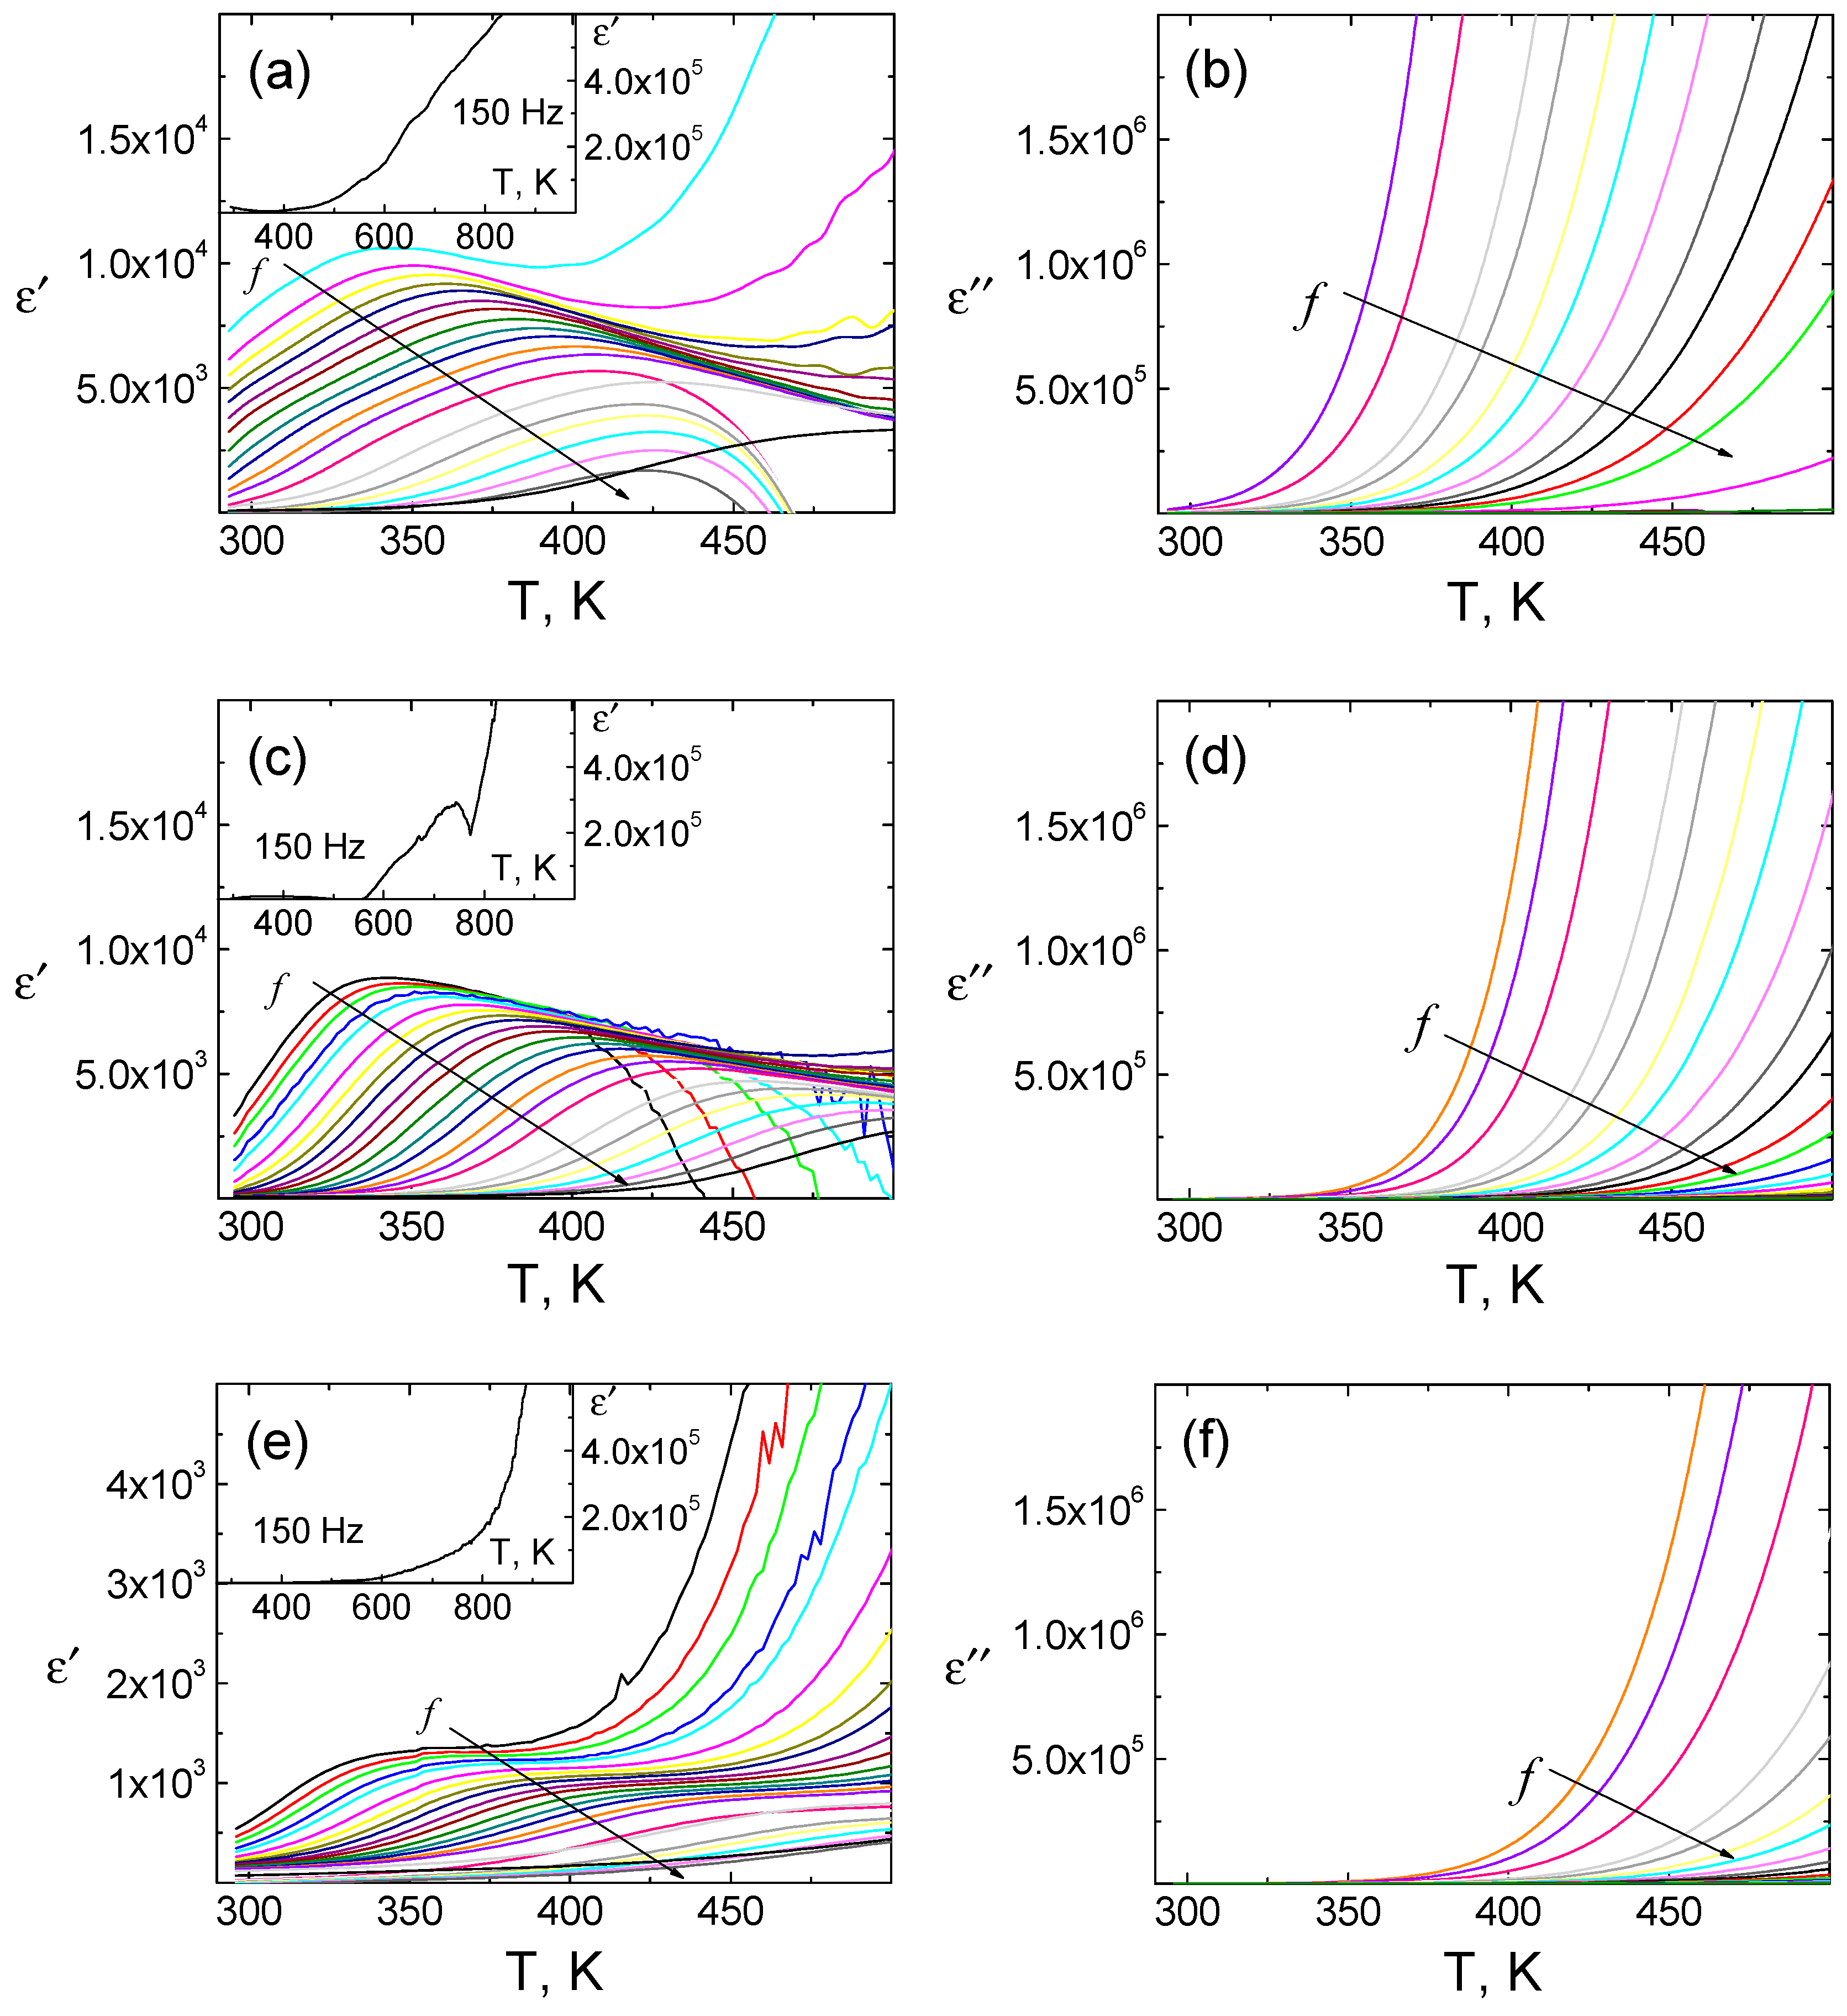
The results of the dielectric dispersion study of objects are shown in
Figure 3. As can be seen from the figures, in the temperature range of 300–500 K, the considered dependences experience anomalies in the form of strongly dispersion maxima of ε/ε
0, which have a relaxation character. The observed phenomena are usually associated with the formation of the Maxwell-Wagner polarization [
4], which occurs in heterogeneous media at the interface of volume elements with different electrical properties.
The increase in Er concentrations leads to complication of the registered dielectric spectra (their shift, enhancing the dispersion and formation of additional anomalies—ill-defined peaks in the ε/ε
0(
T) curves at
T = 600 K (
Figure 3c). A further increase in Er concentration leads to a significant decrease in the dielectric constant (
Figure 3e).
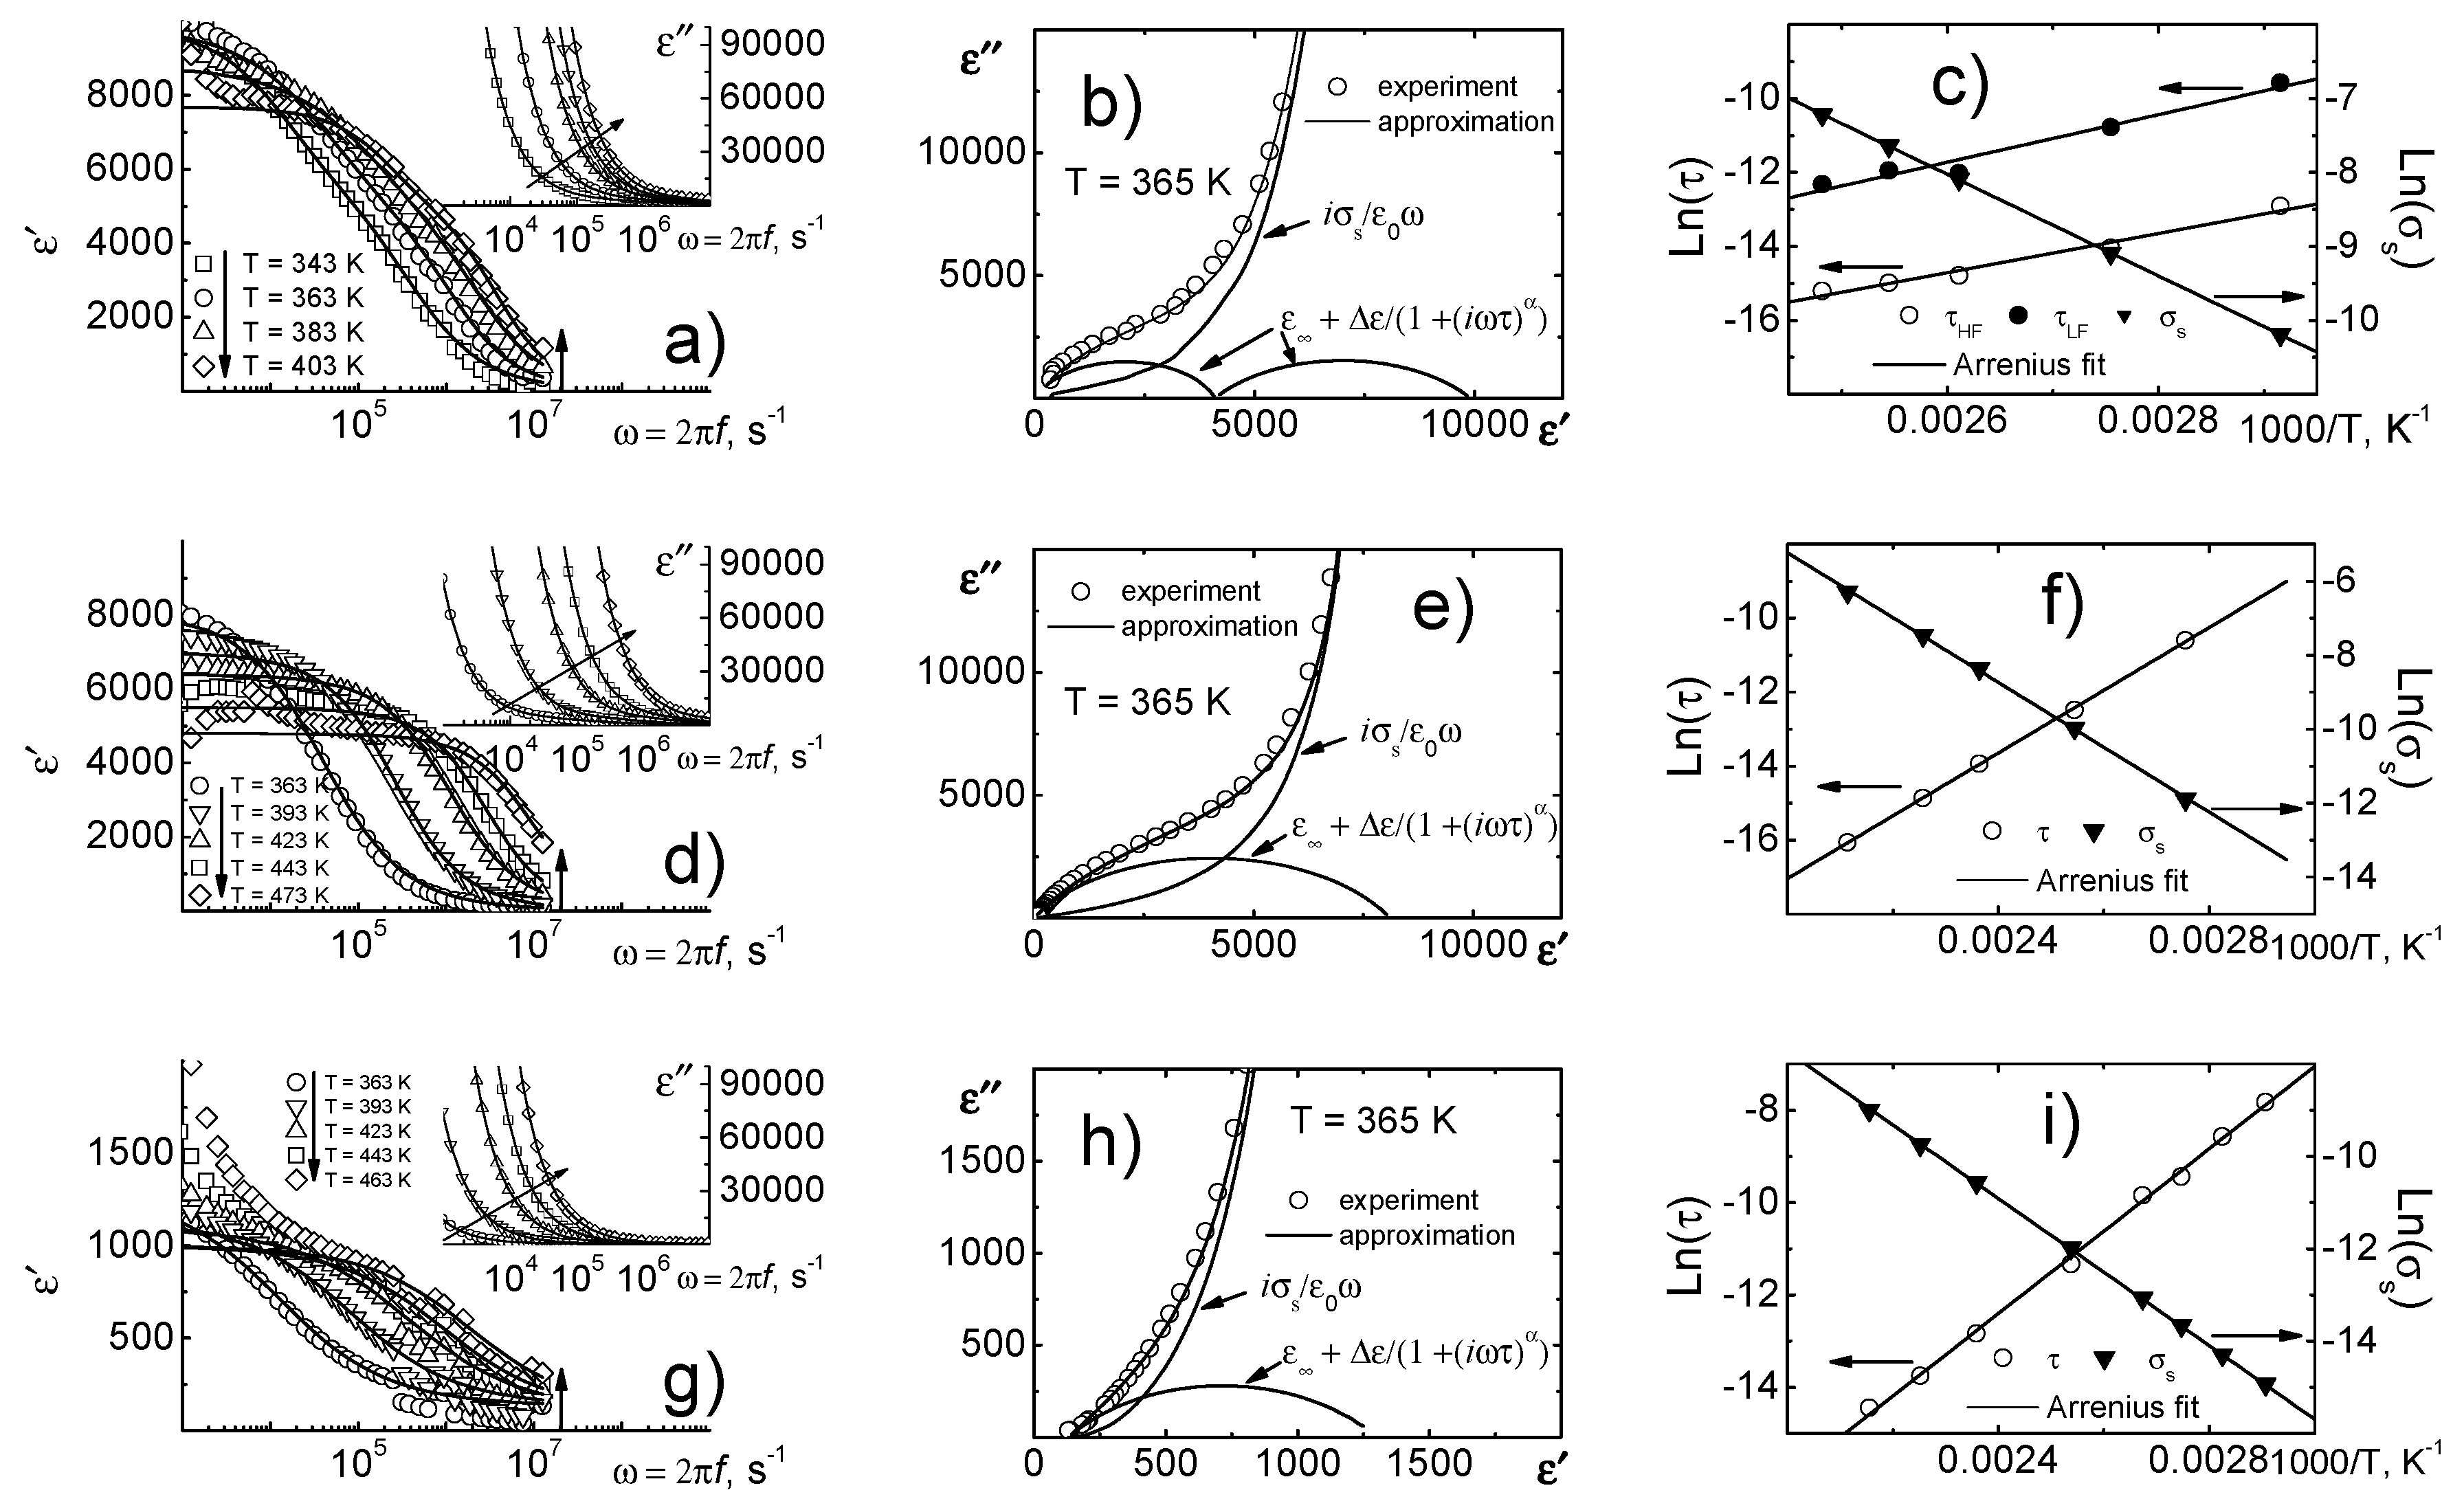
The relaxation analysis, performed using the Cole-Cole relation (
Figure 4), made it possible to take into account the effect of reach-through conductivity. From
Figure 4b it is clearly seen that at least two relaxation processes take place in the object. When erbium is added, the relaxation spectrum of objects is simplified and described by a single process. The calculations by the Cole–Cole relation allowed us to calculate the activation energy of both relaxation processes and reach-through conductivity (see
Table 1).
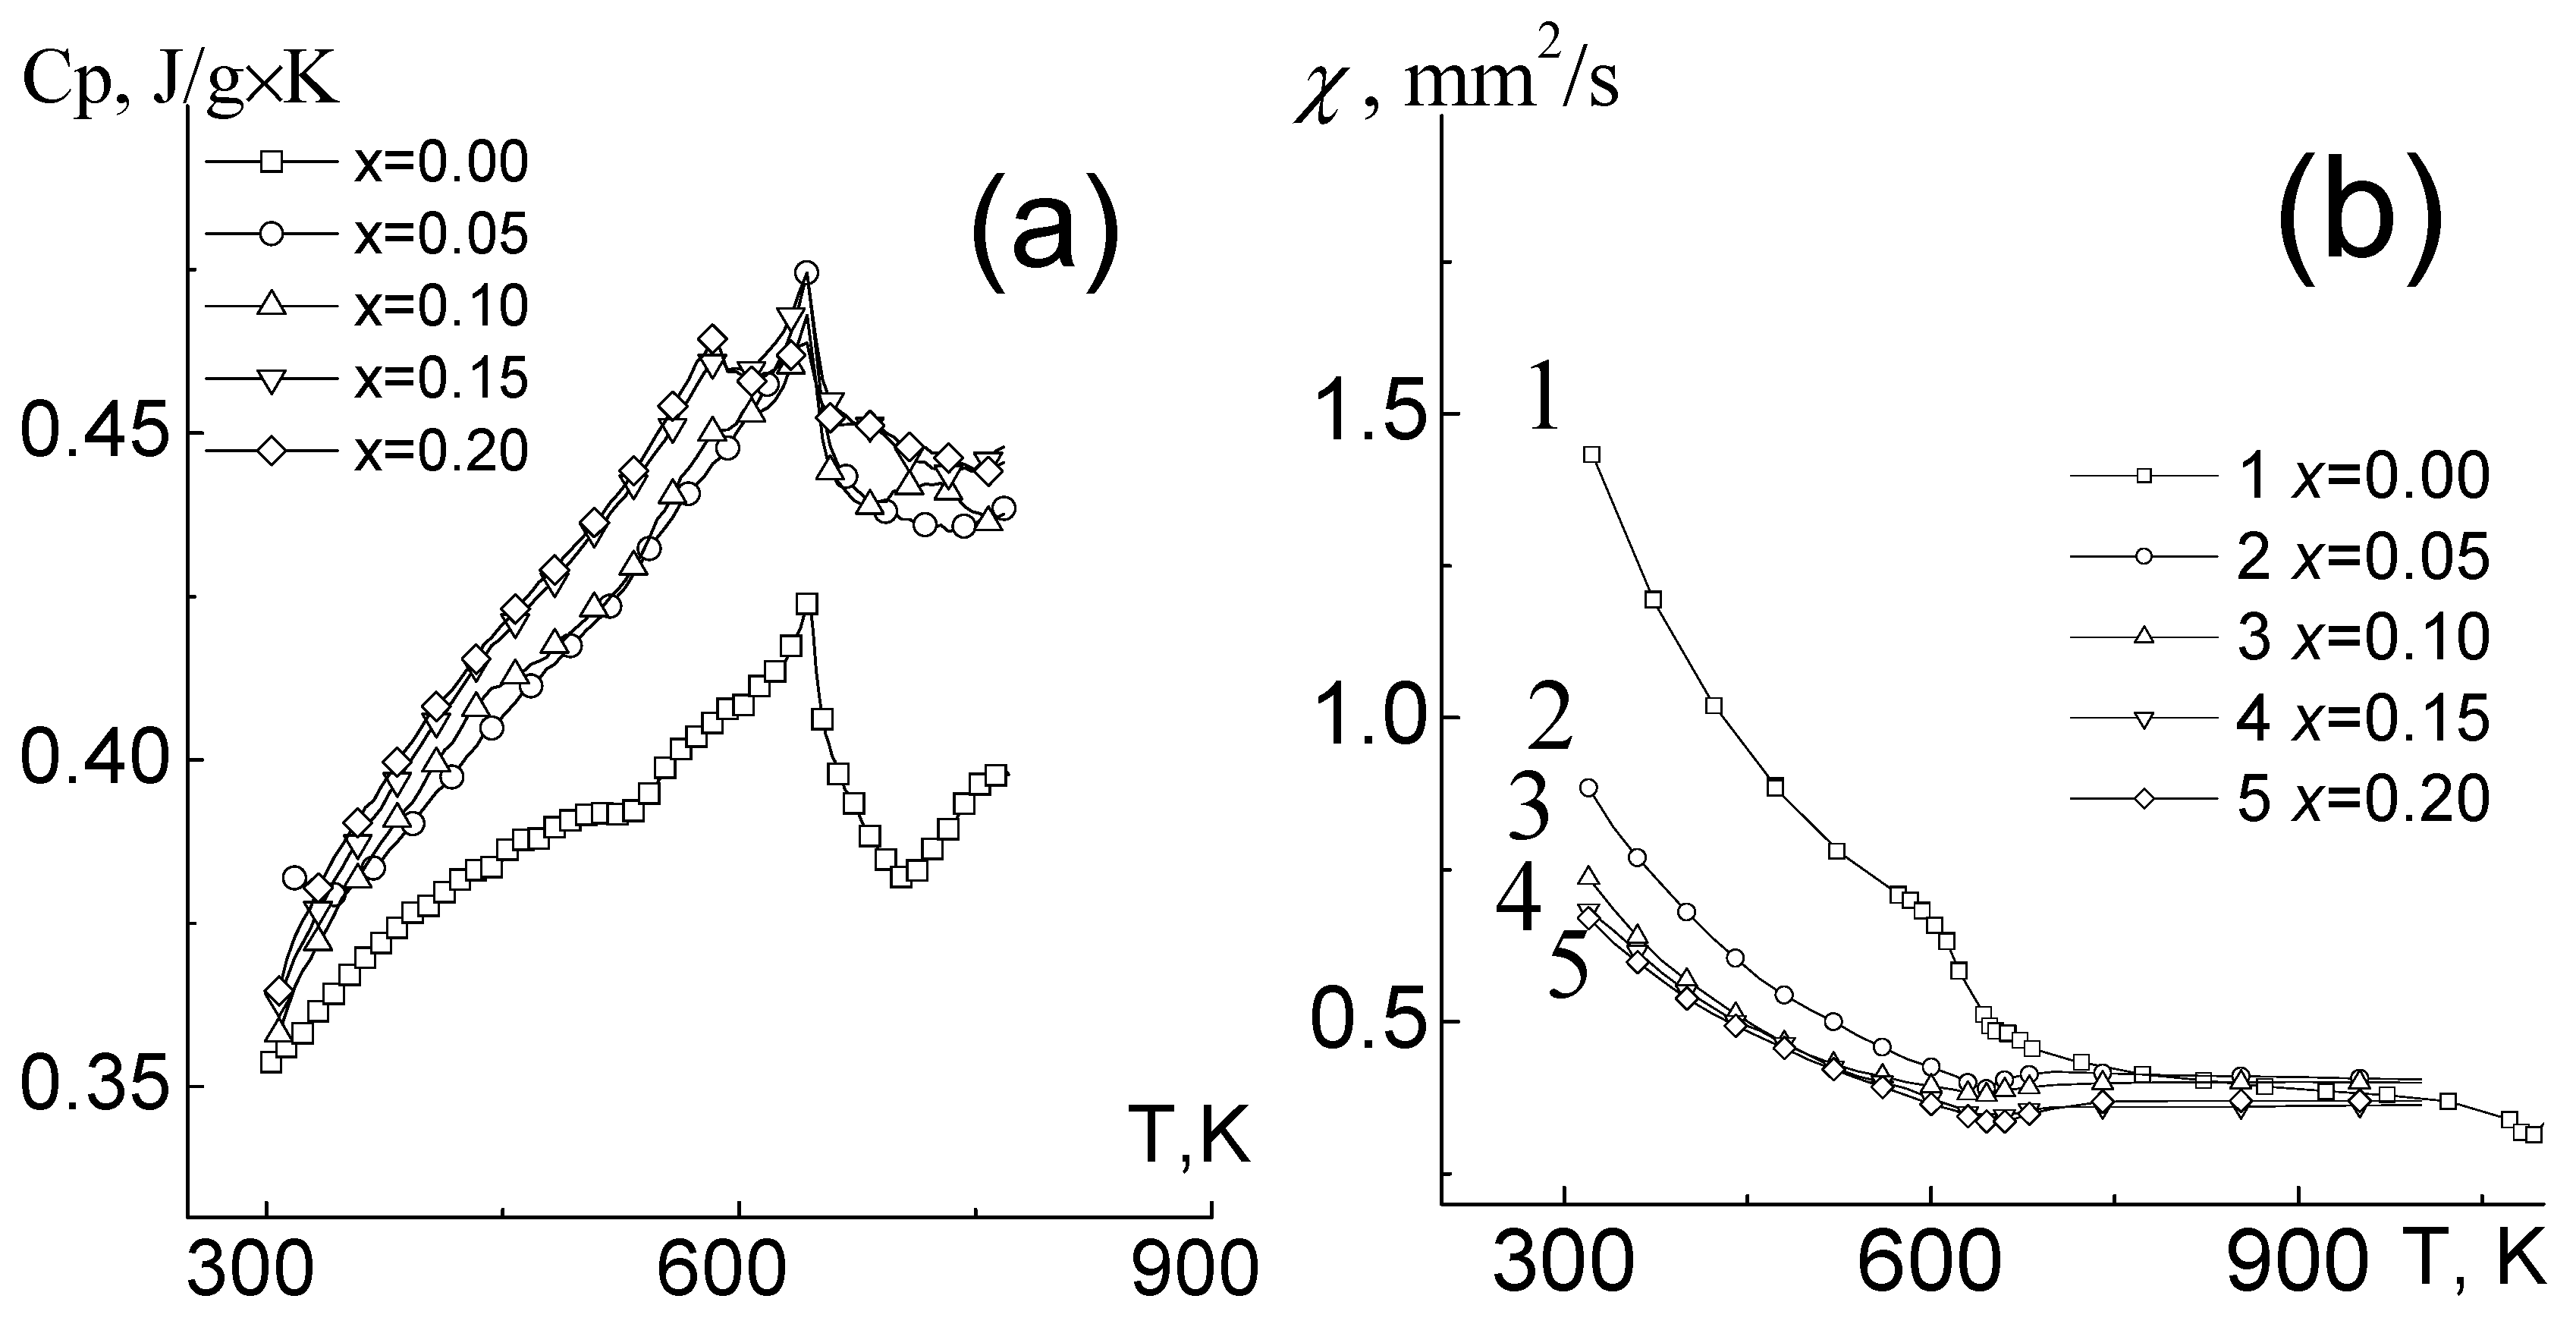
Figure 5 shows the temperature dependences of thermal diffusivity (
χ) and specific heat (
Cp) of studied ceramic samples. The heat capacity of objects increases and up to 600 K, the experimental data are in satisfactory agreement with those calculated using the Meer–Kelly formula:
Cp(
T) = a + b
T − c
T−2, where a, b, and c are constant, which are determined from the temperature dependence of the heat capacity at temperatures of 290–320 K. In the temperature range of 640–670 K, covering the region of the antiferromagnetic transition, the behavior of thermophysical characteristics is extreme with a minimum of
χ and a maximum of
Cp. The observed effects are in good agreement with the literature data for similar objects [
7,
8]. It should be noted that in solid solutions with large amount of Er temperature dependencies of
Cp experience at least two maxima, one of which can be referred to antiferromagnetic phase transitions and another one can be associated with the formation of internal stresses due to the ordering of structural defects (
Figure 5a).
4. Discussion
It is well known that the introduction of large-sized rare-earth elements (REE) (with ionic radius ≥ 0.99 Å) leads to the stabilization of the Rh phase, which is probably due to the creation of the most favorable (dimensional) conditions for the existence of BiFeO
3, which is known [
5] as a boundary position in the perovskite family.
In the solid solutions under consideration, the Rh phase, characteristic of BiFeO
3, coexists with the emerging R phase. The observed, apparently, is due to the presence of a large amount of Bi- and Fe-containing impurities, usually accompanying the formation of BiFeO
3, and the ballast phases of the non-perovskite structure with the participation of REE, the number of which increases as the ionic radius of the REE decreases, as is clearly seen in
Figure 2 with microphotographs of the grain structures of the studied objects. Accumulation of such phases (“gray” grains) leads to loosening of the microstructure, thickening of the boundaries of crystallites, and deformation of the habitus of grains of the main phase.
To describe the process of low-temperature dielectric relaxation, the curves ln
τ(1/
T) (
τ—relaxation time from Cole-Cole plot) and ln
σs(1/
T) (
σs—reach-through conductivity) were constructed (
Figure 4c,f,i). All the obtained dependences satisfy the Arrhenius law with the activation energy,
Ea, in the range of 0.5–0.7 eV (see
Table 1), which is characteristic of Maxwell–Wagner relaxation [
9] process associated with accumulation of free charges on the interface of components in spatially inhomogeneous media against the background of interlayer, interphase and intraphase rearrangements, inter alia, by the accumulation of charge in the near-electrode layer. It is clearly seen that in the case of each object the values of
Ea are almost identical. One can suggest that dielectric relaxation is caused by the accumulation of free charges, which is consistent with the Maxwell–Wagner model. This assumption is also confirmed by a sharp increase in the dielectric constant and dielectric loss above the temperatures at which the described relaxation processes take place.
The reason for its development is the natural-composite structure of BiFeO3 and BiFeO3 with REE, which is formed on the basis of at least four Bi-, Fe-containing compounds (Bi2O3, Fe2O3, Bi25FeO40, Bi2Fe4O9) that practically always accompany the formation of BiFeO3 remaining in it (in different amounts) in the form of ballast phases and undergoing a series of bifurcations in the above-mentioned temperature ranges.

 ,
, 


