Stability Prediction Model of Roadway Surrounding Rock Based on Concept Lattice Reduction and a Symmetric Alpha Stable Distribution Probability Neural Network

Abstract
1. Introduction
- (1)
- To combat the uncertainty and concealment of the correlation between the prediction indexes of surrounding rock stability, a model based on grid multi-layer attribute reduction is established to reduce the attributes of the evaluation index, optimize the index, and improve model efficiency.
- (2)
- The synthetic minority over-sampling technique (SMOTE) is used to synthesize new training samples, so that the numbers of training samples are balanced. Introduction of symmetrical alpha stable distribution instead of Gaussian distribution as the basis function of the probabilistic neural network model gives the model a broader meaning of expression.
- (3)
- Concept lattice multi-level attribute reduction involves more efficient index optimization, however its promotion ability and anti-noise ability are poor. Since the probabilistic neural network has advantages in data training, a concept lattice and symmetrical alpha stable distribution probability neural network model for roadway surrounding rock stability prediction should be superior.
2. Reduced Concept Lattice
2.1. Basic Notion of the Concept Lattice
2.2. Attribute Reduction Based on the Concept Lattice
3. Probabilistic Neural Network Model Based on Symmetric Alpha Stable Distribution
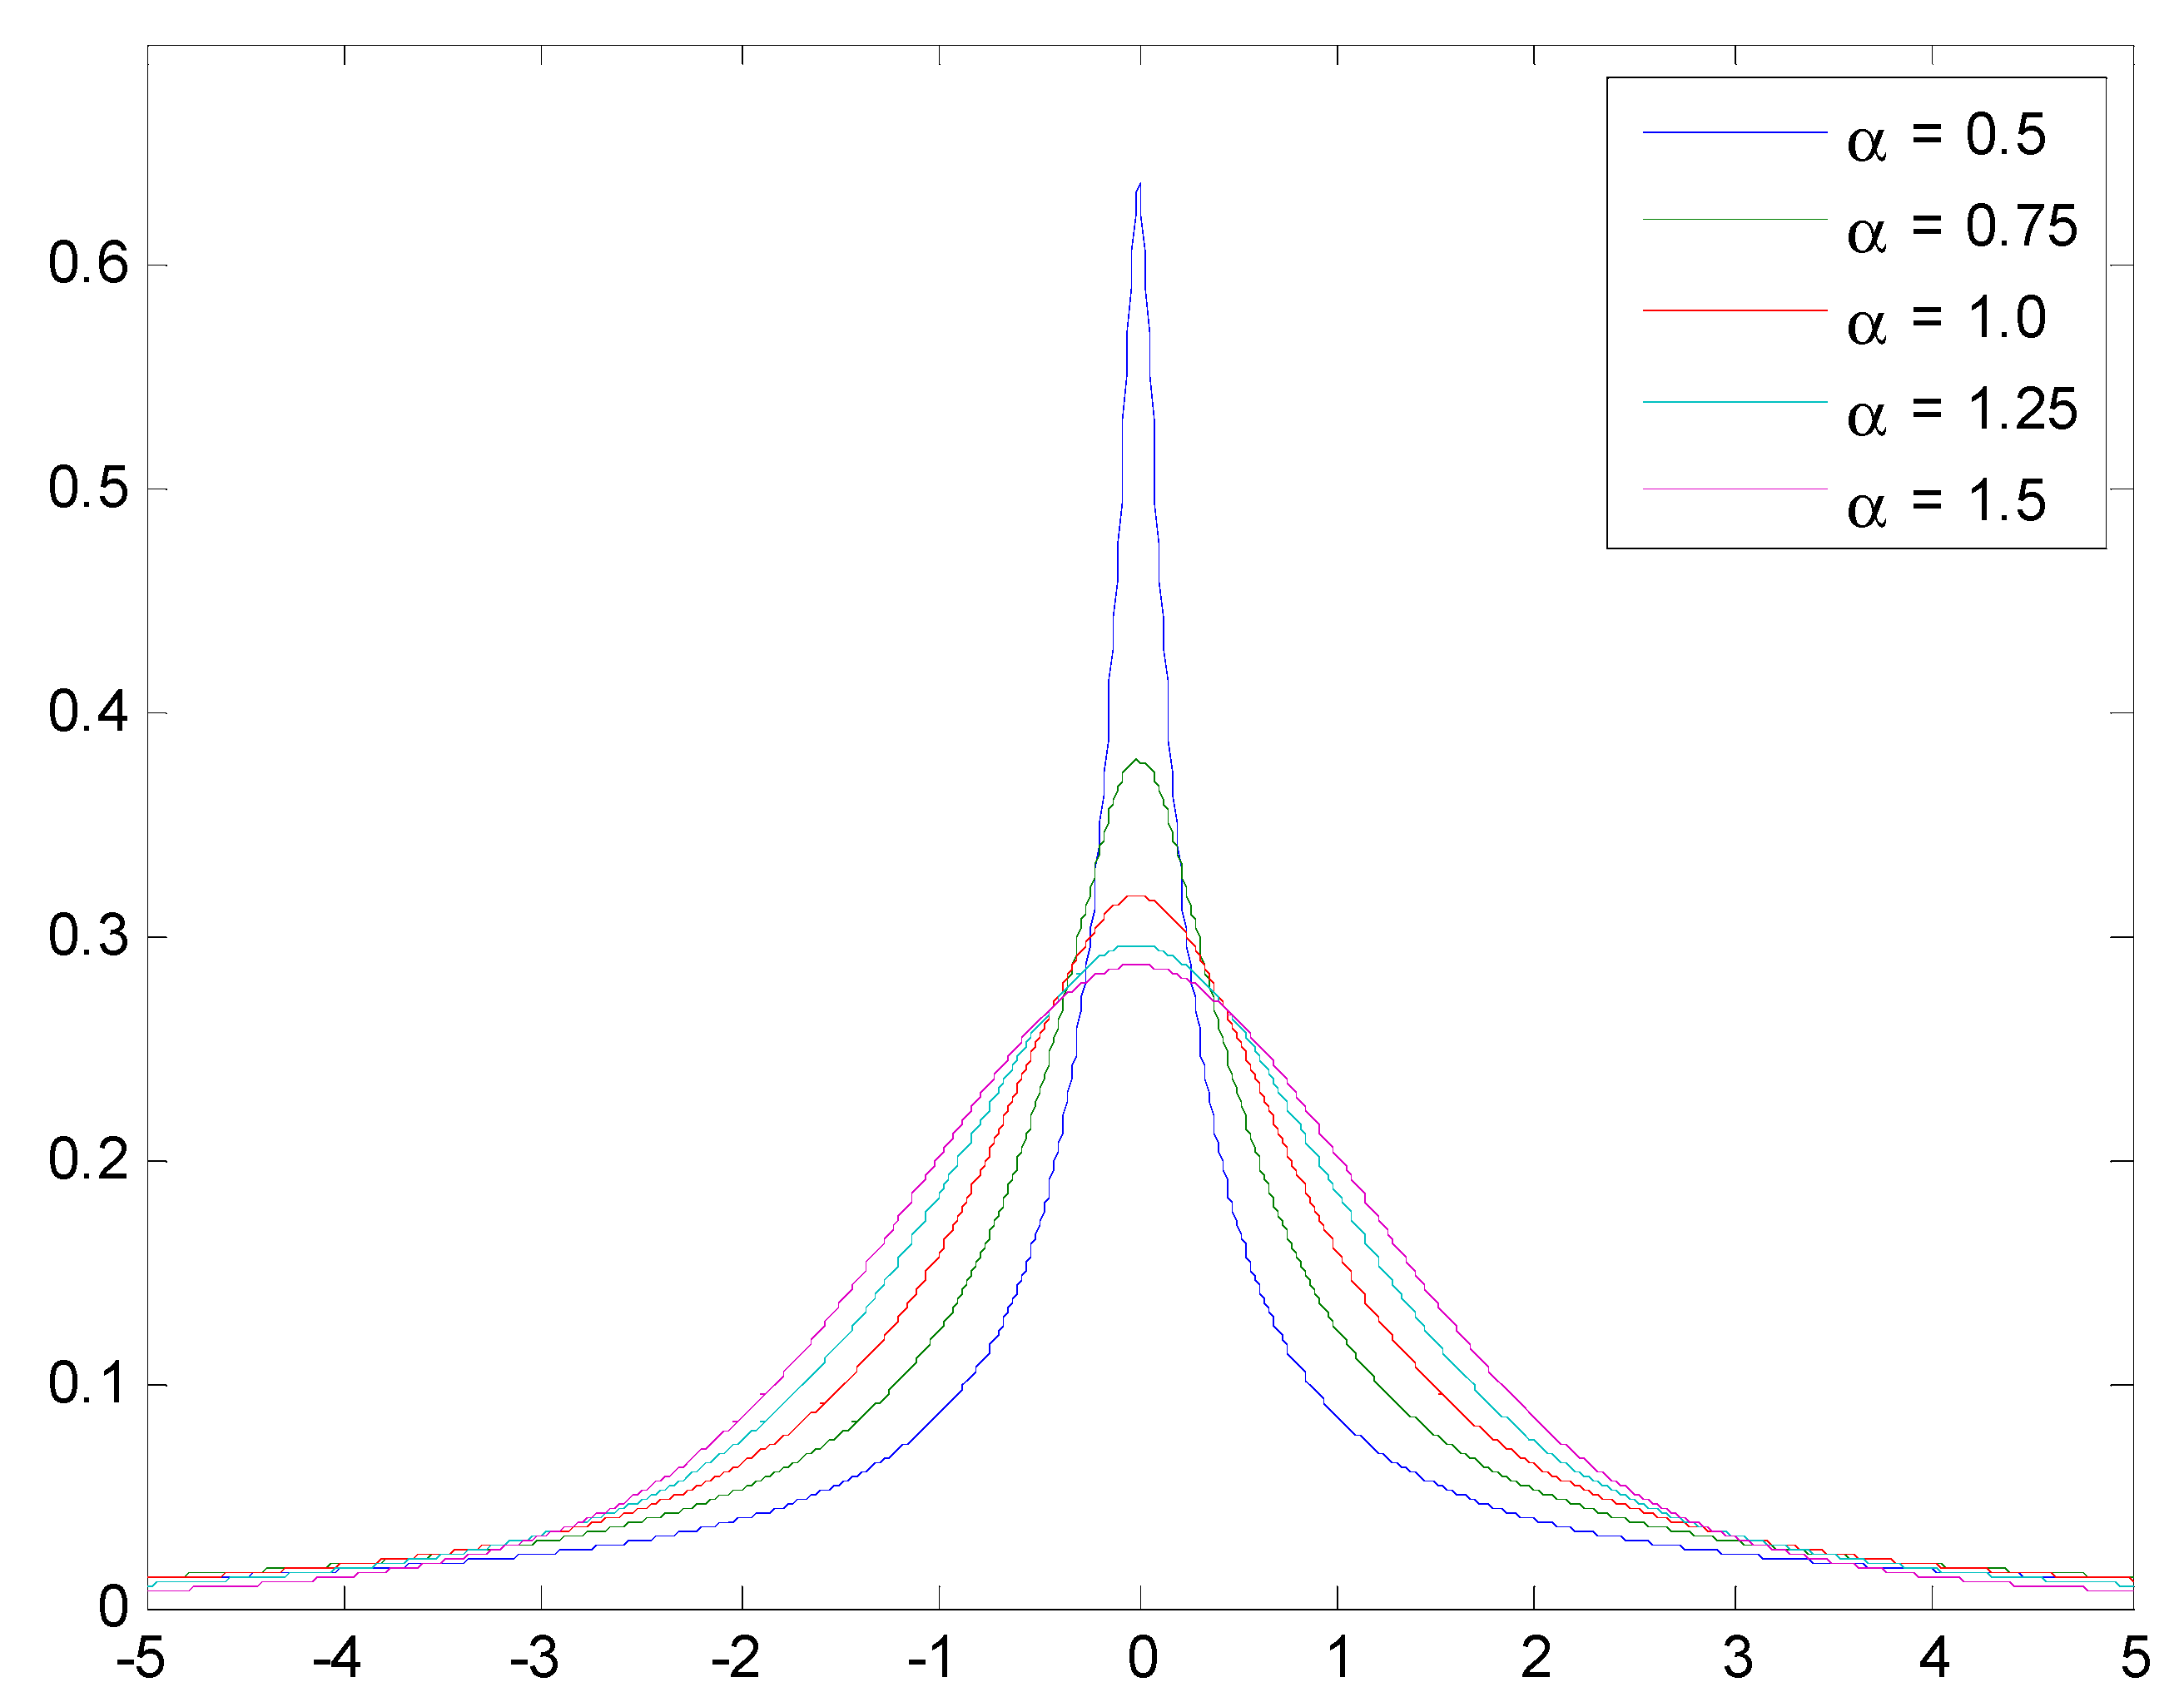
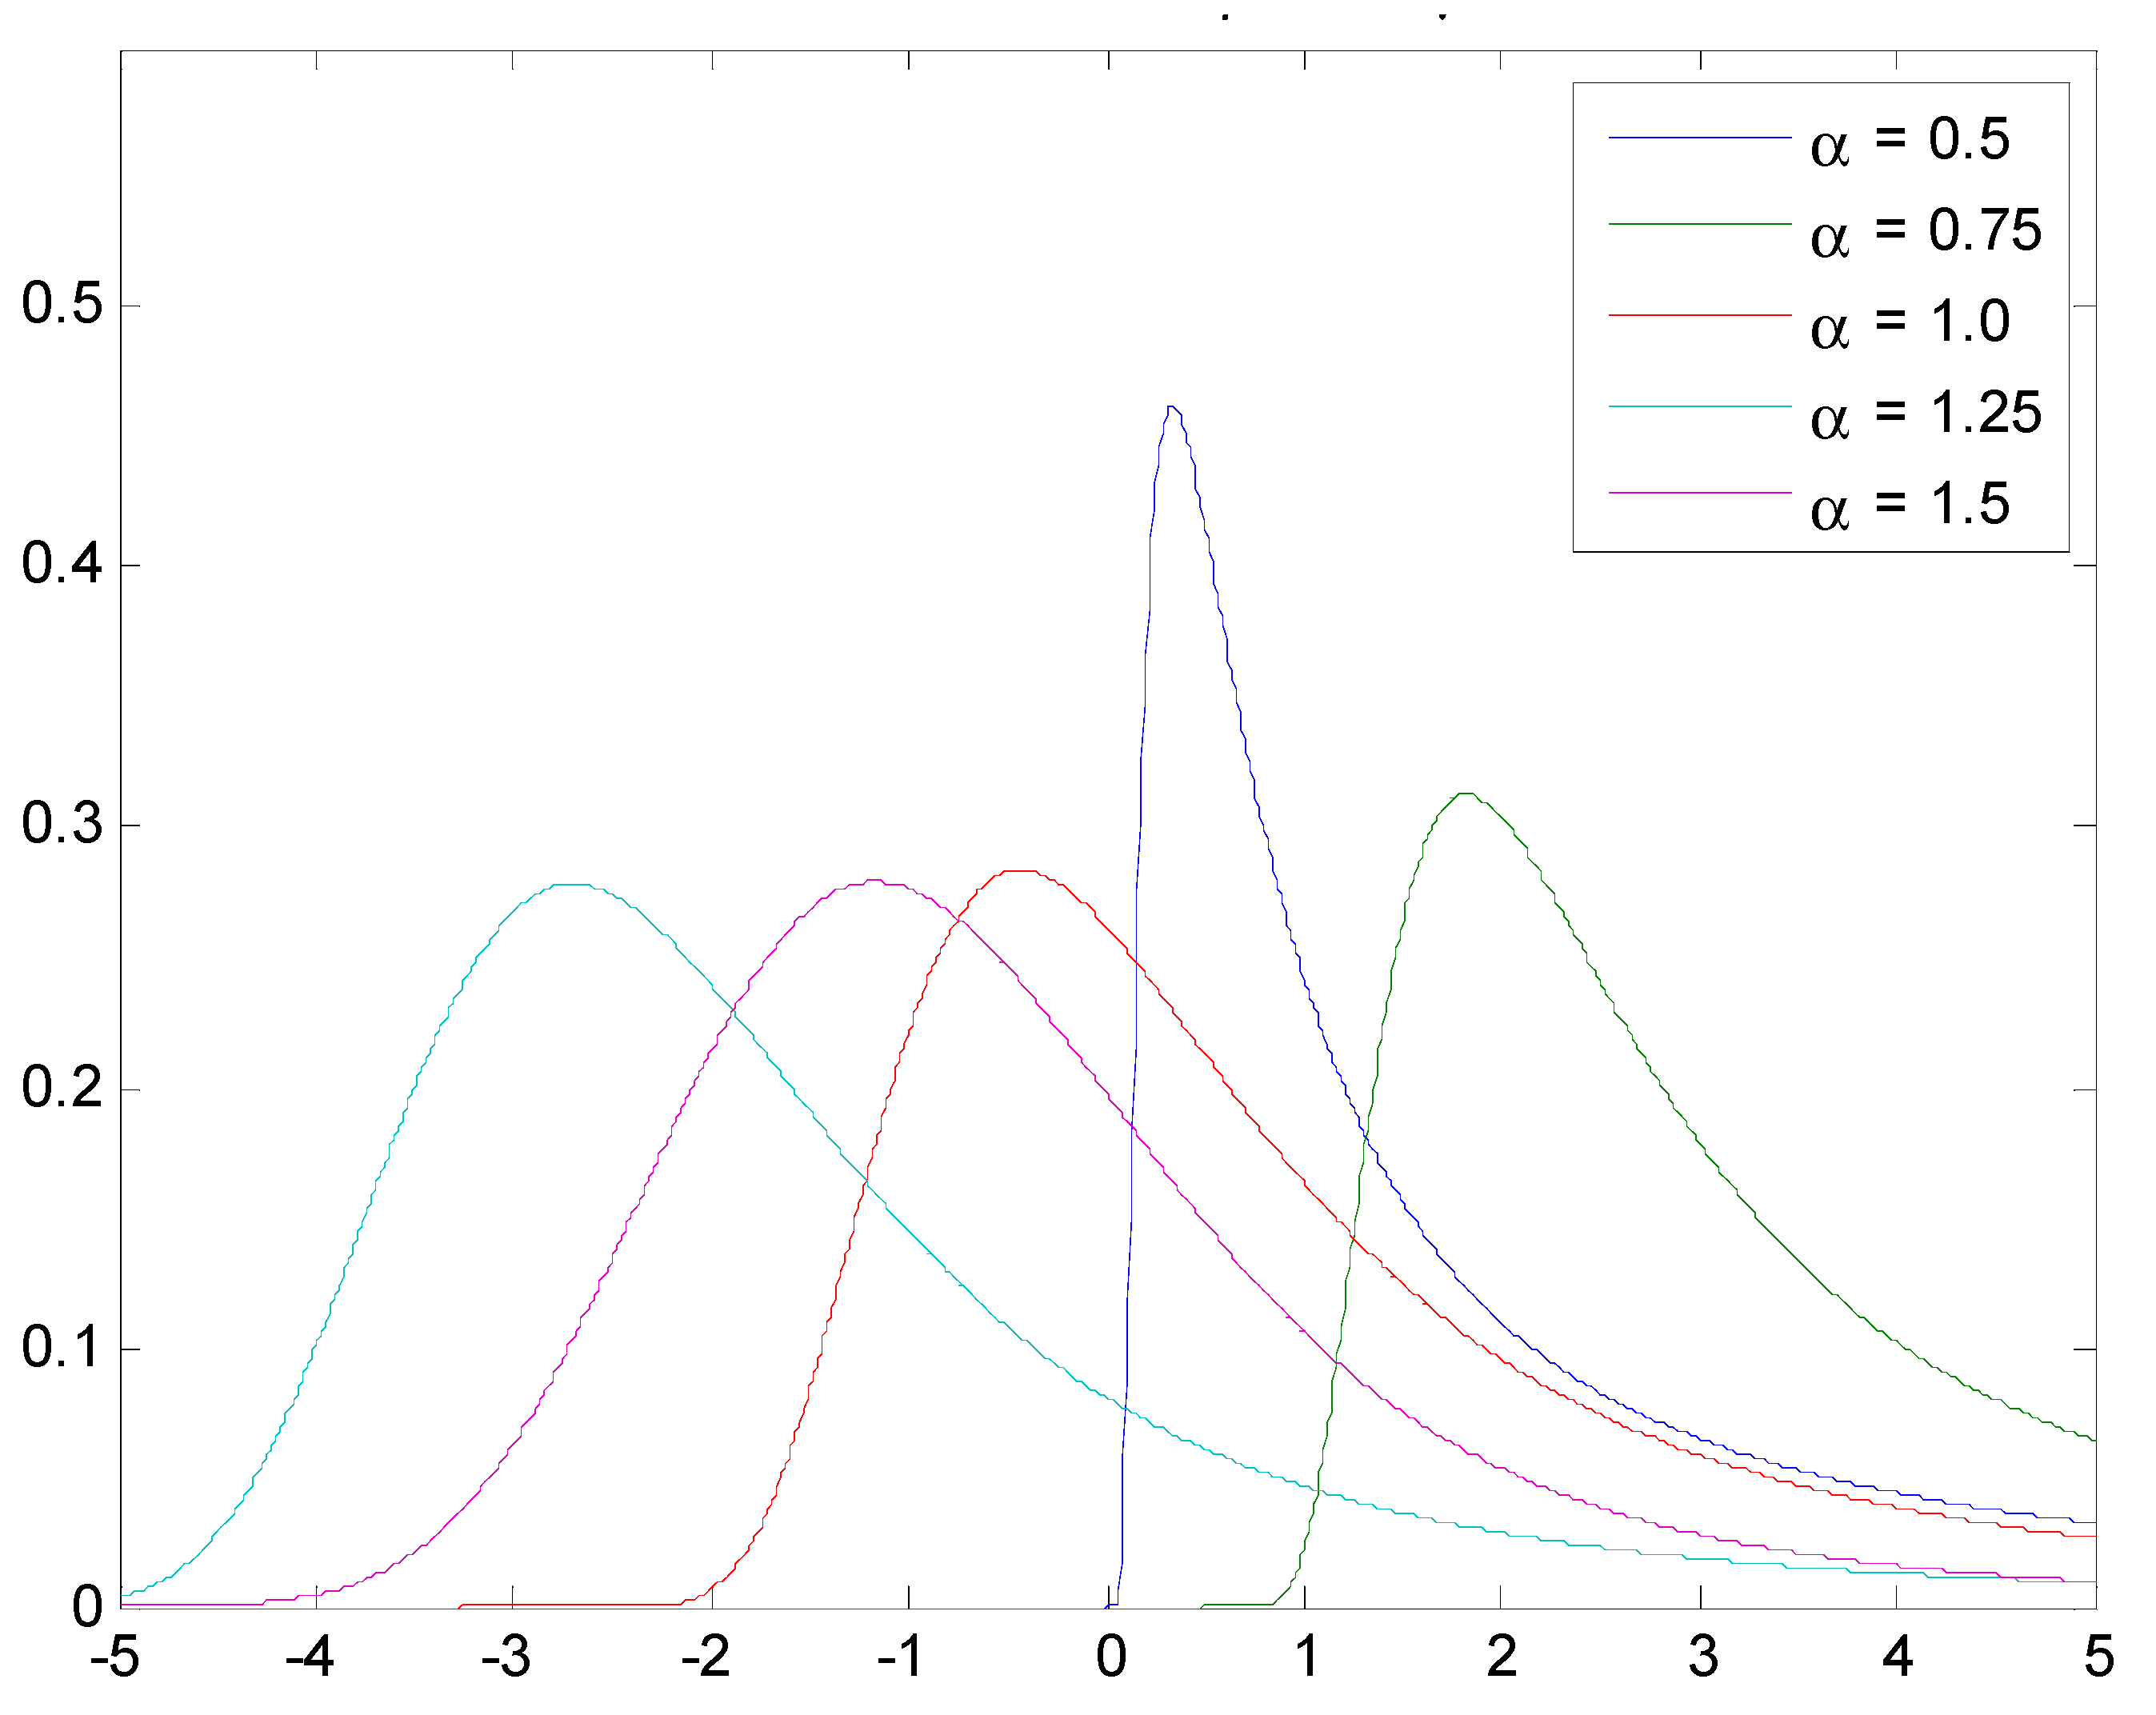
3.1. Alpha Stable Distribution
3.2. Probabilistic Neural Network
3.3. Improved Probabilistic Neural Network
4. Prediction Model for Roadway Surrounding Rock Stability
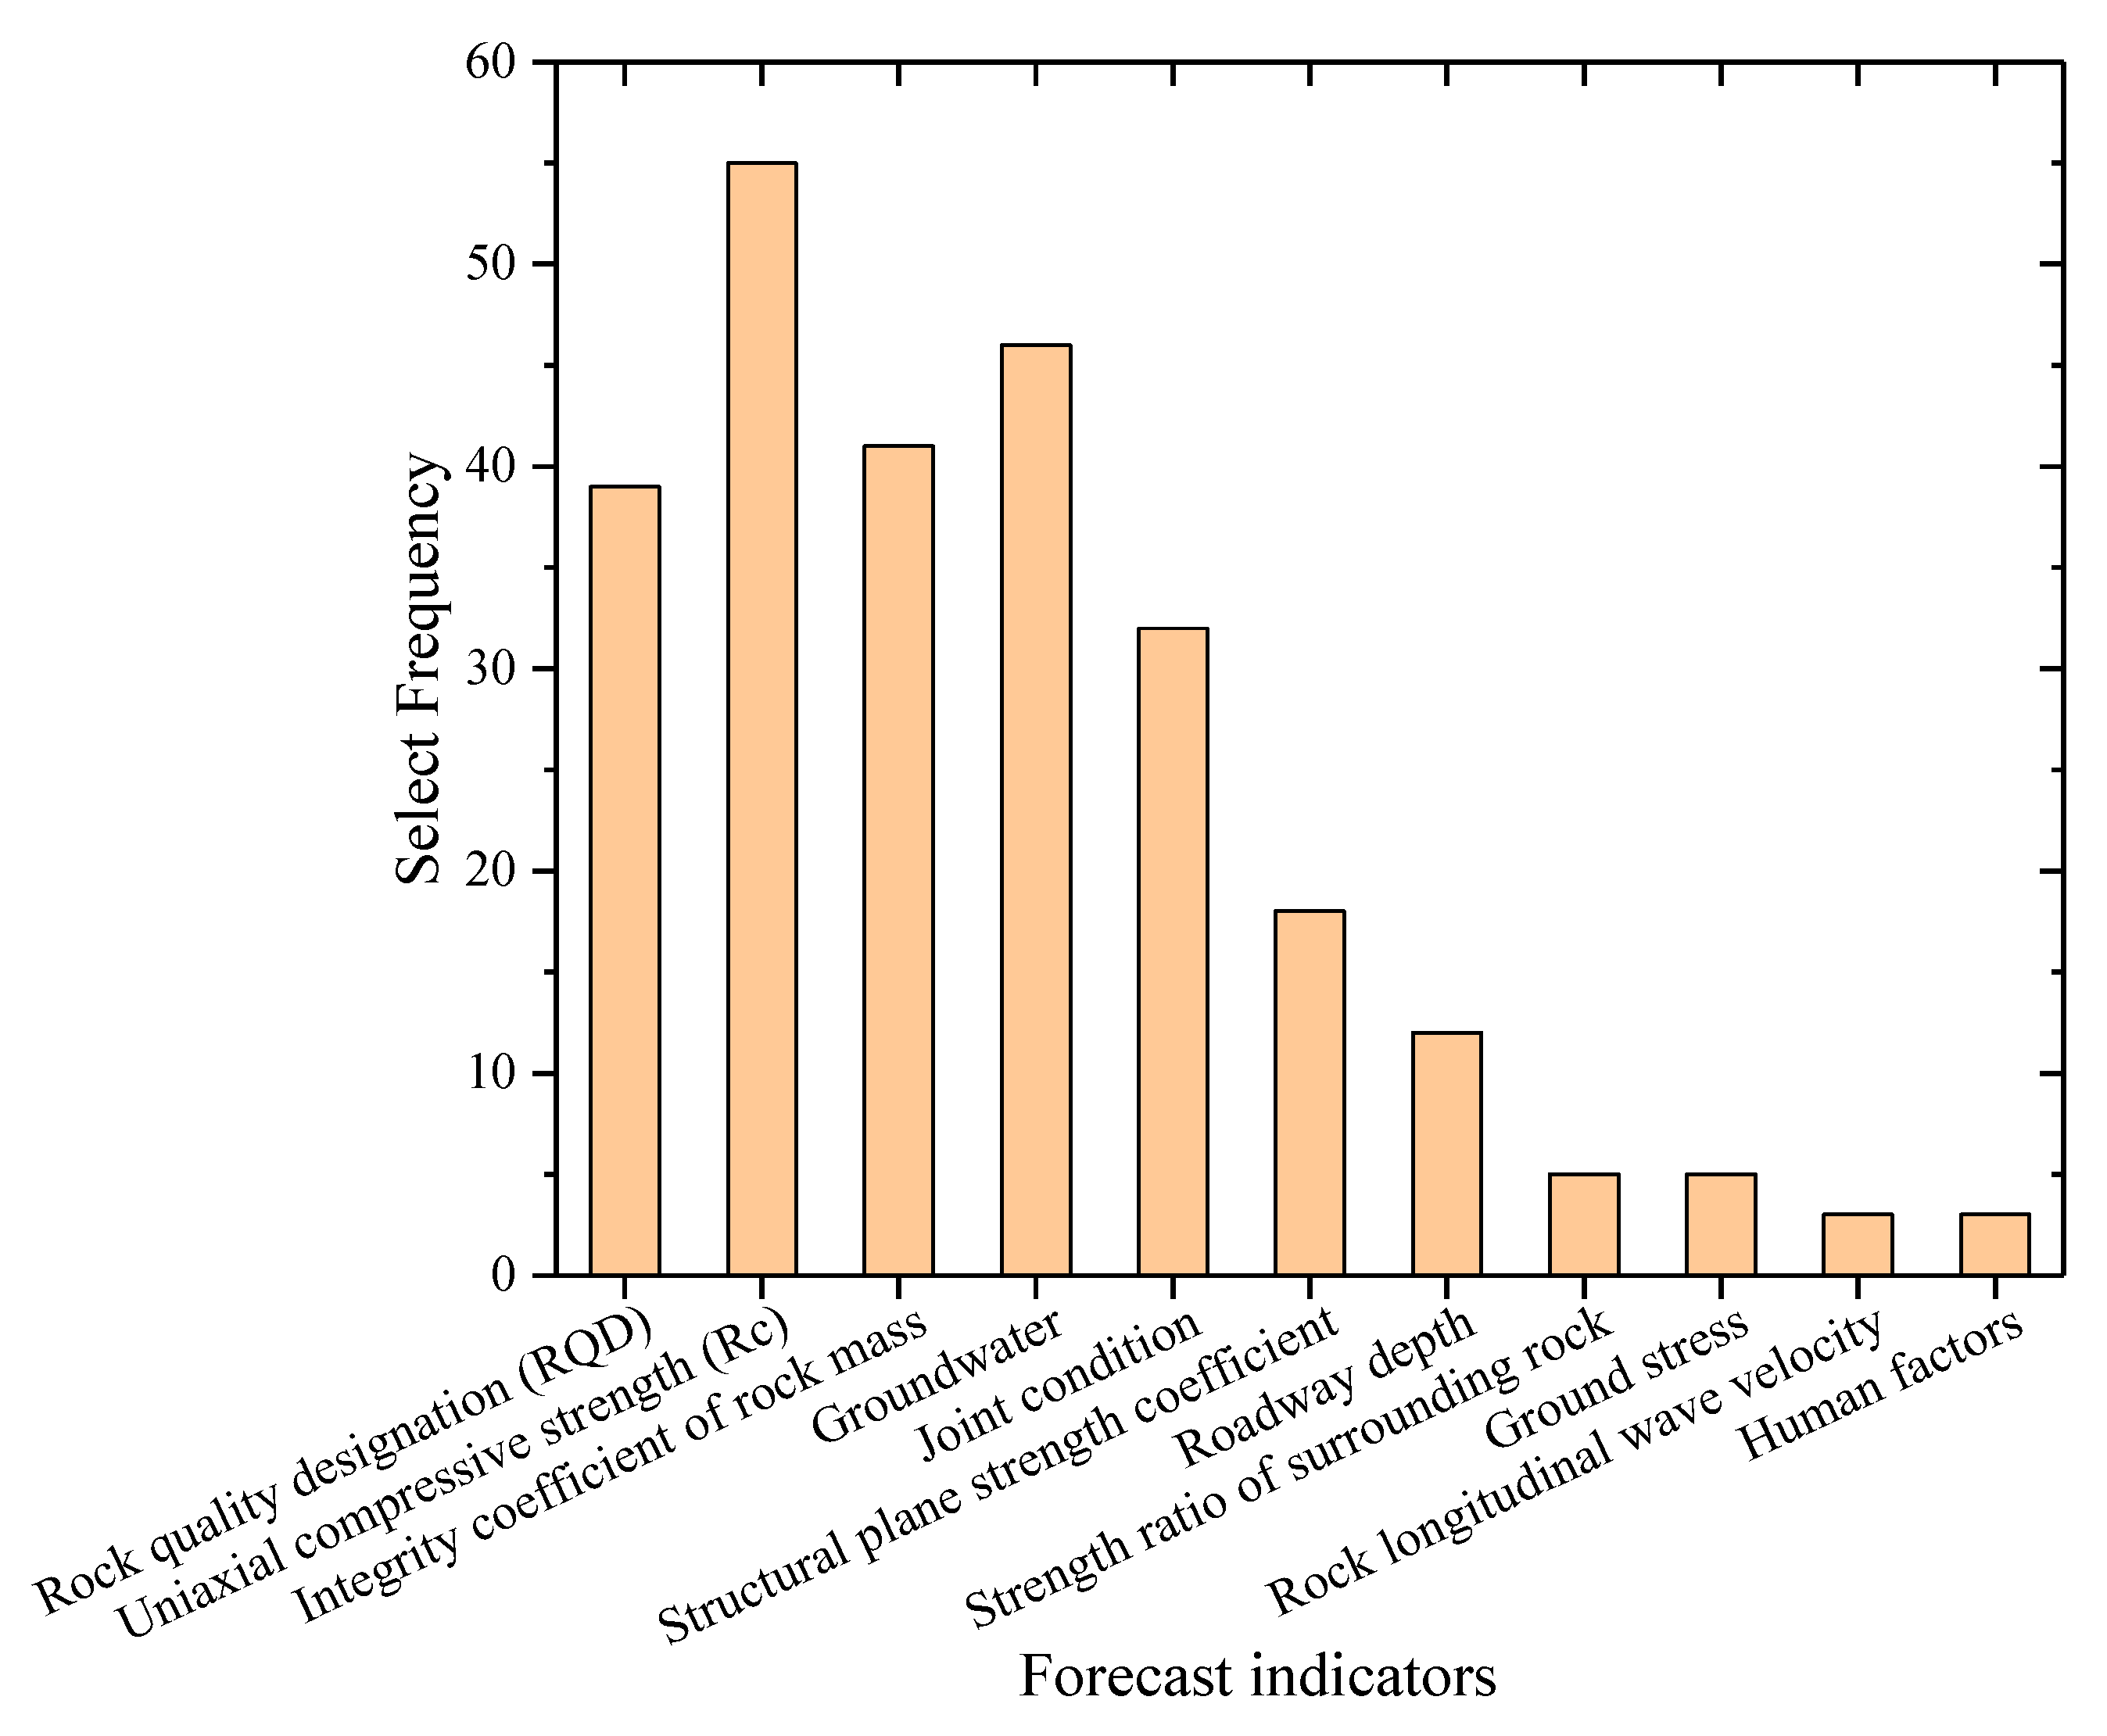
4.1. Selection of Evaluation Indexes for Roadway Surrounding Rock Stability
4.2. Data Discretization
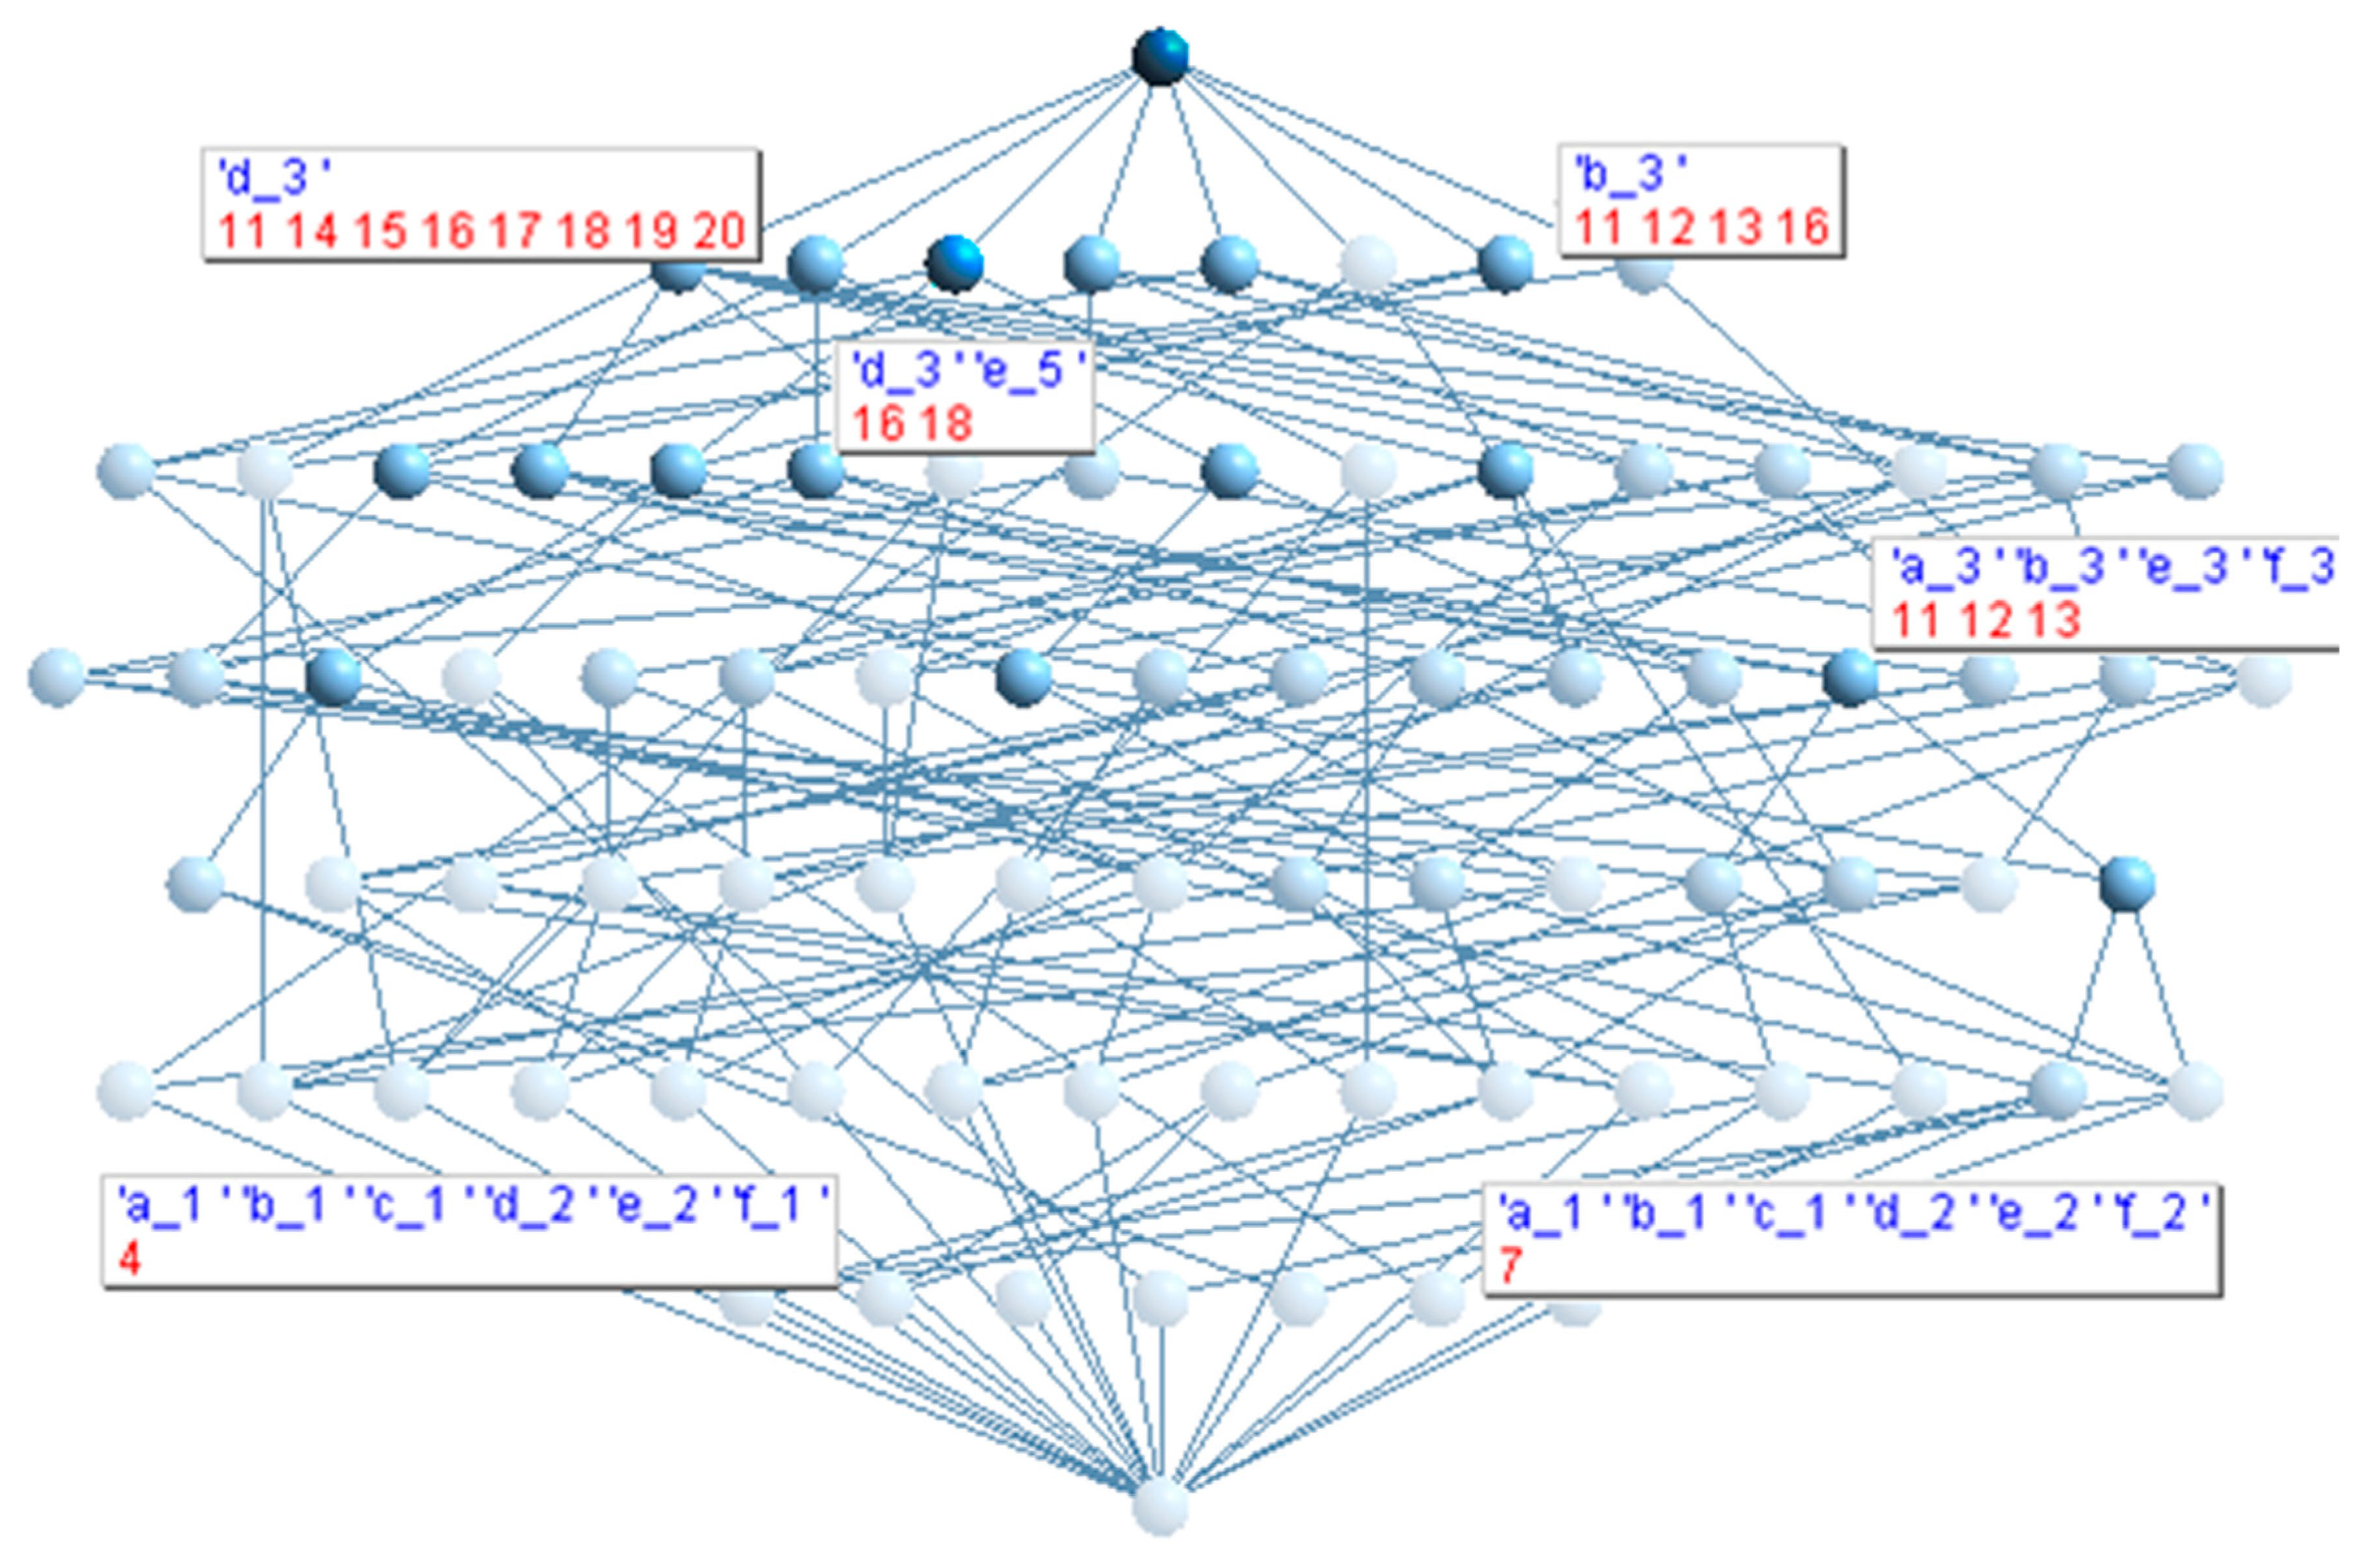
4.3. Construction of Concept Lattice
4.4. Reduction Indexes
4.5. Establishment of Improved Probabilistic Neural Networks Model
5. Practical Engineering Applications
6. Conclusions
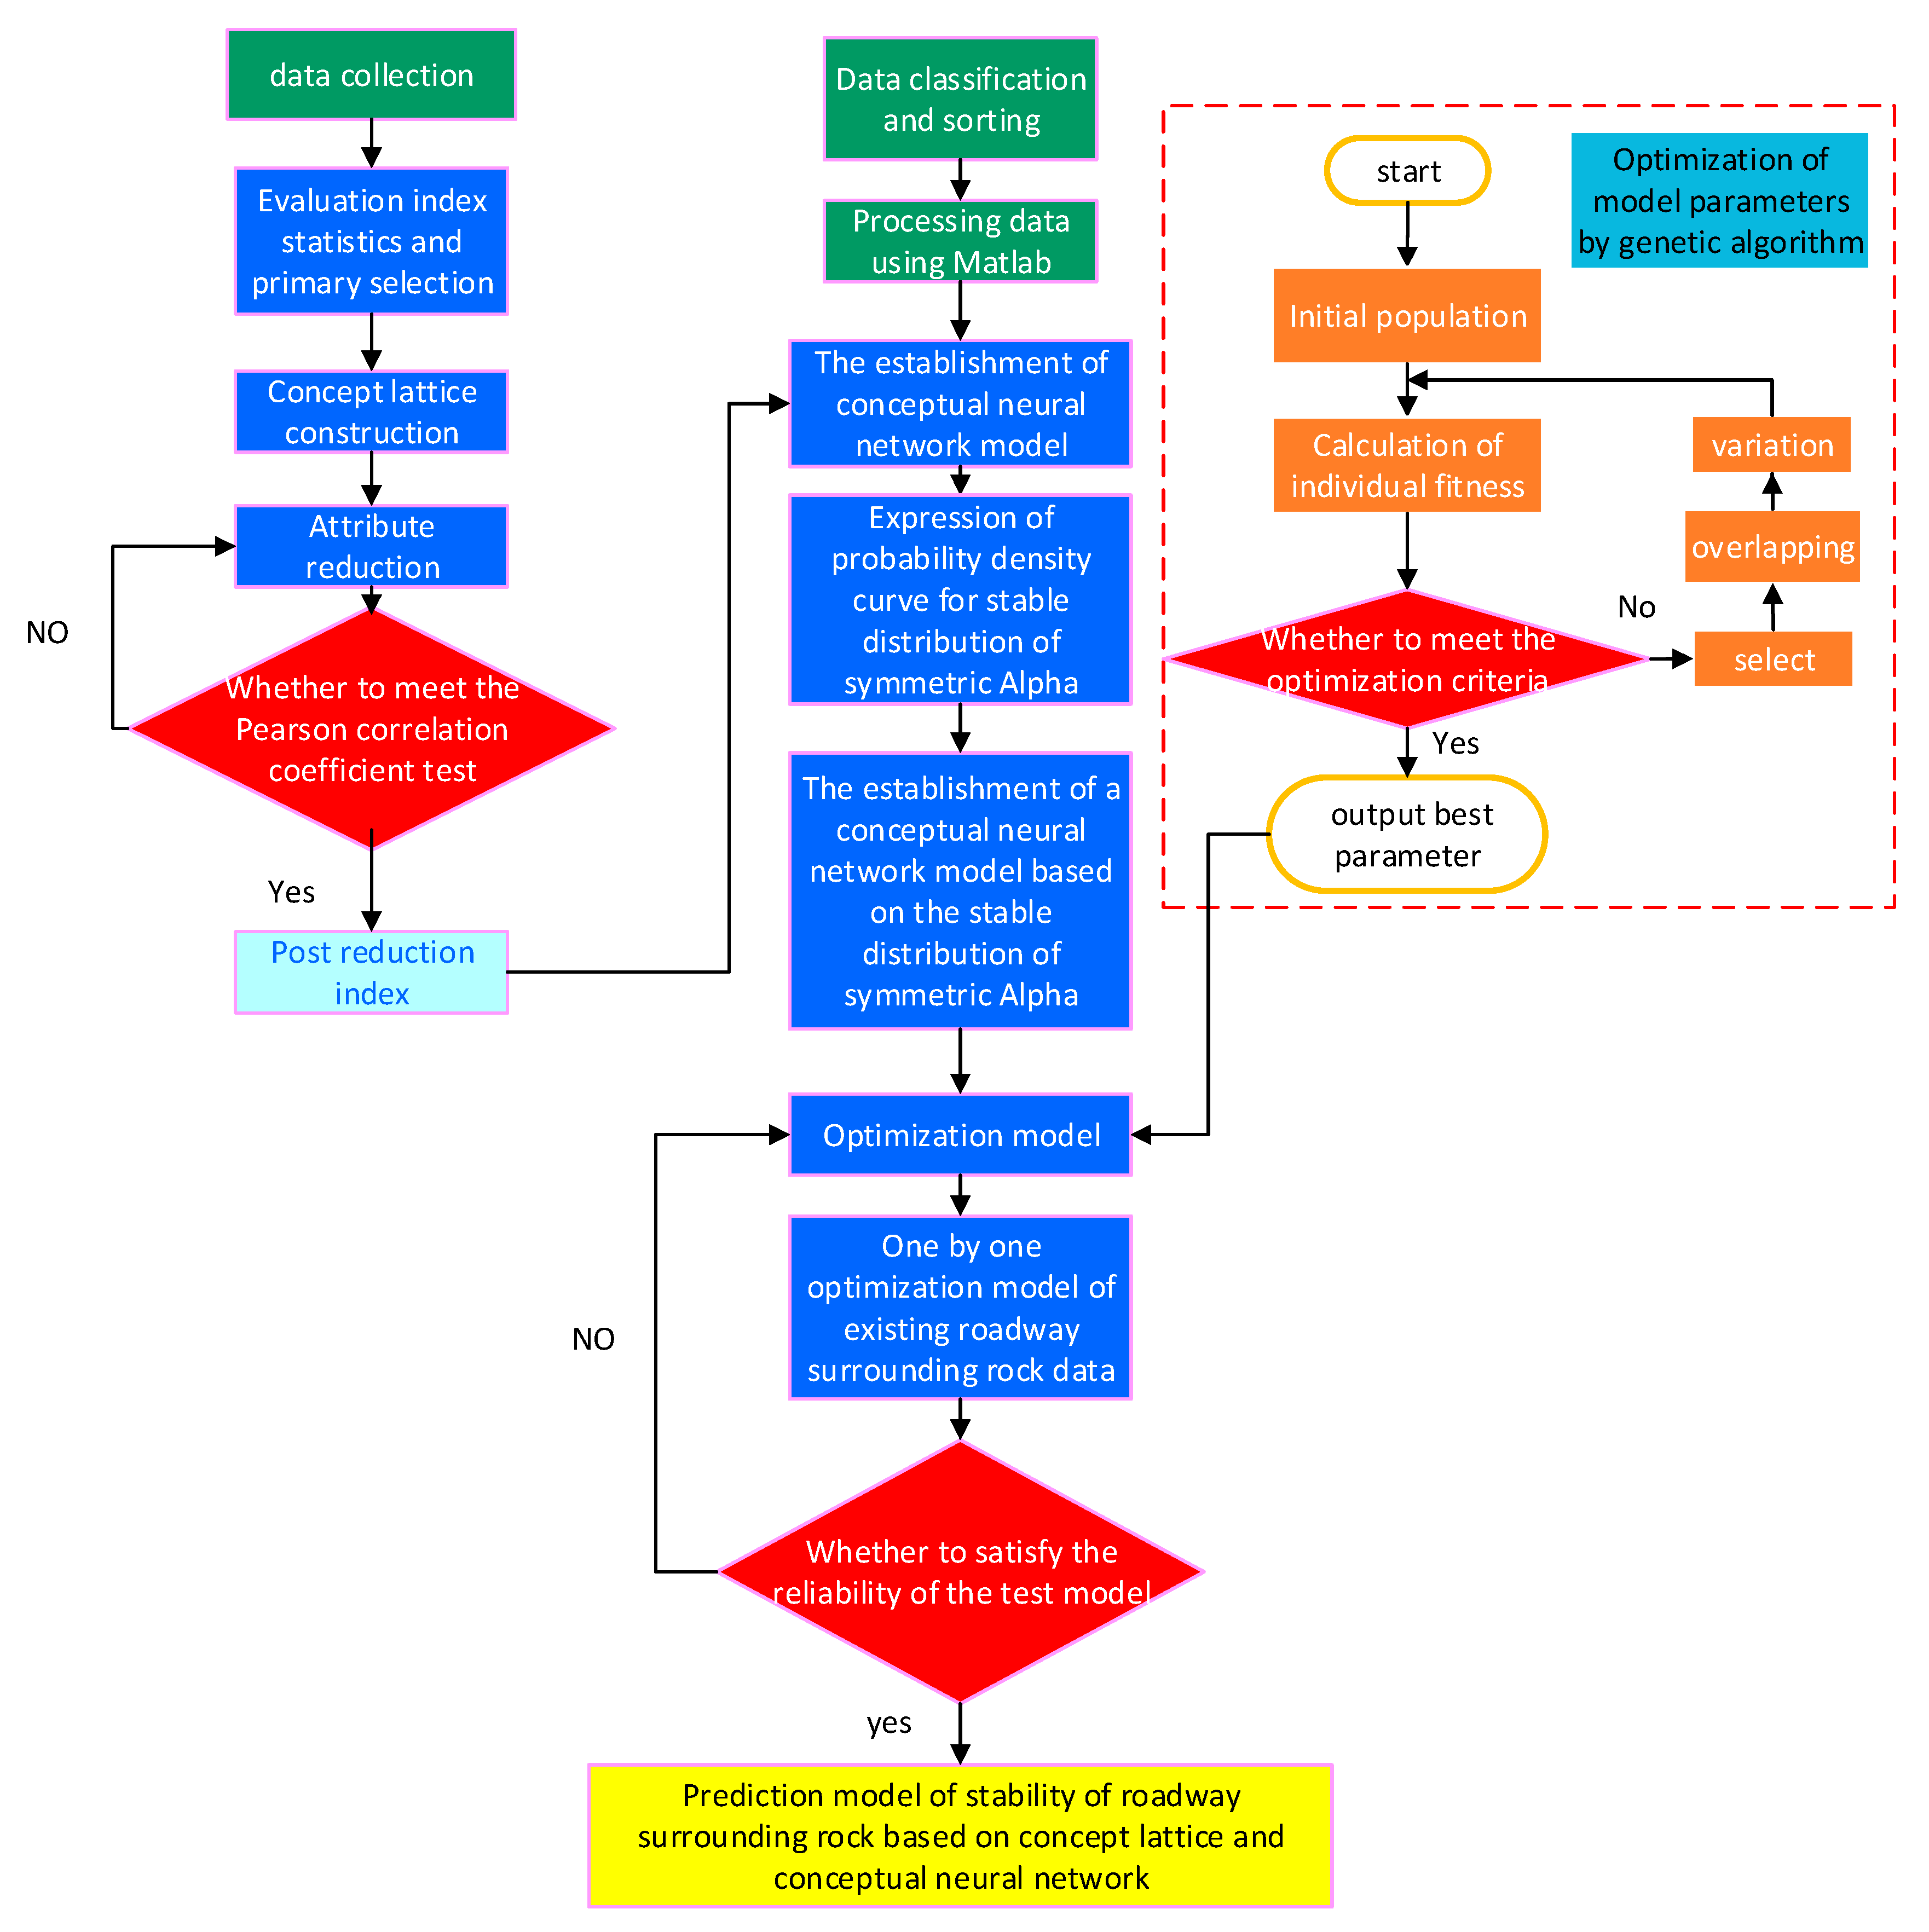
- (1)
- The proposed method uses five indexes: rock quality designation (RQD), uniaxial compressive strength (Rc), the integrity coefficient of rock mass, groundwater seepage, and joint condition as initial evaluation indexes, constructs a concept lattice according to training samples, generates a corresponding Hasse diagram, then uses concept lattice reduction to reduce the initial evaluation indexes. The reduced indexes are RQD, Rc, and groundwater seepage. By calculating correlation coefficients between the evaluation indexes, we prove the effectiveness of reduction.
- (2)
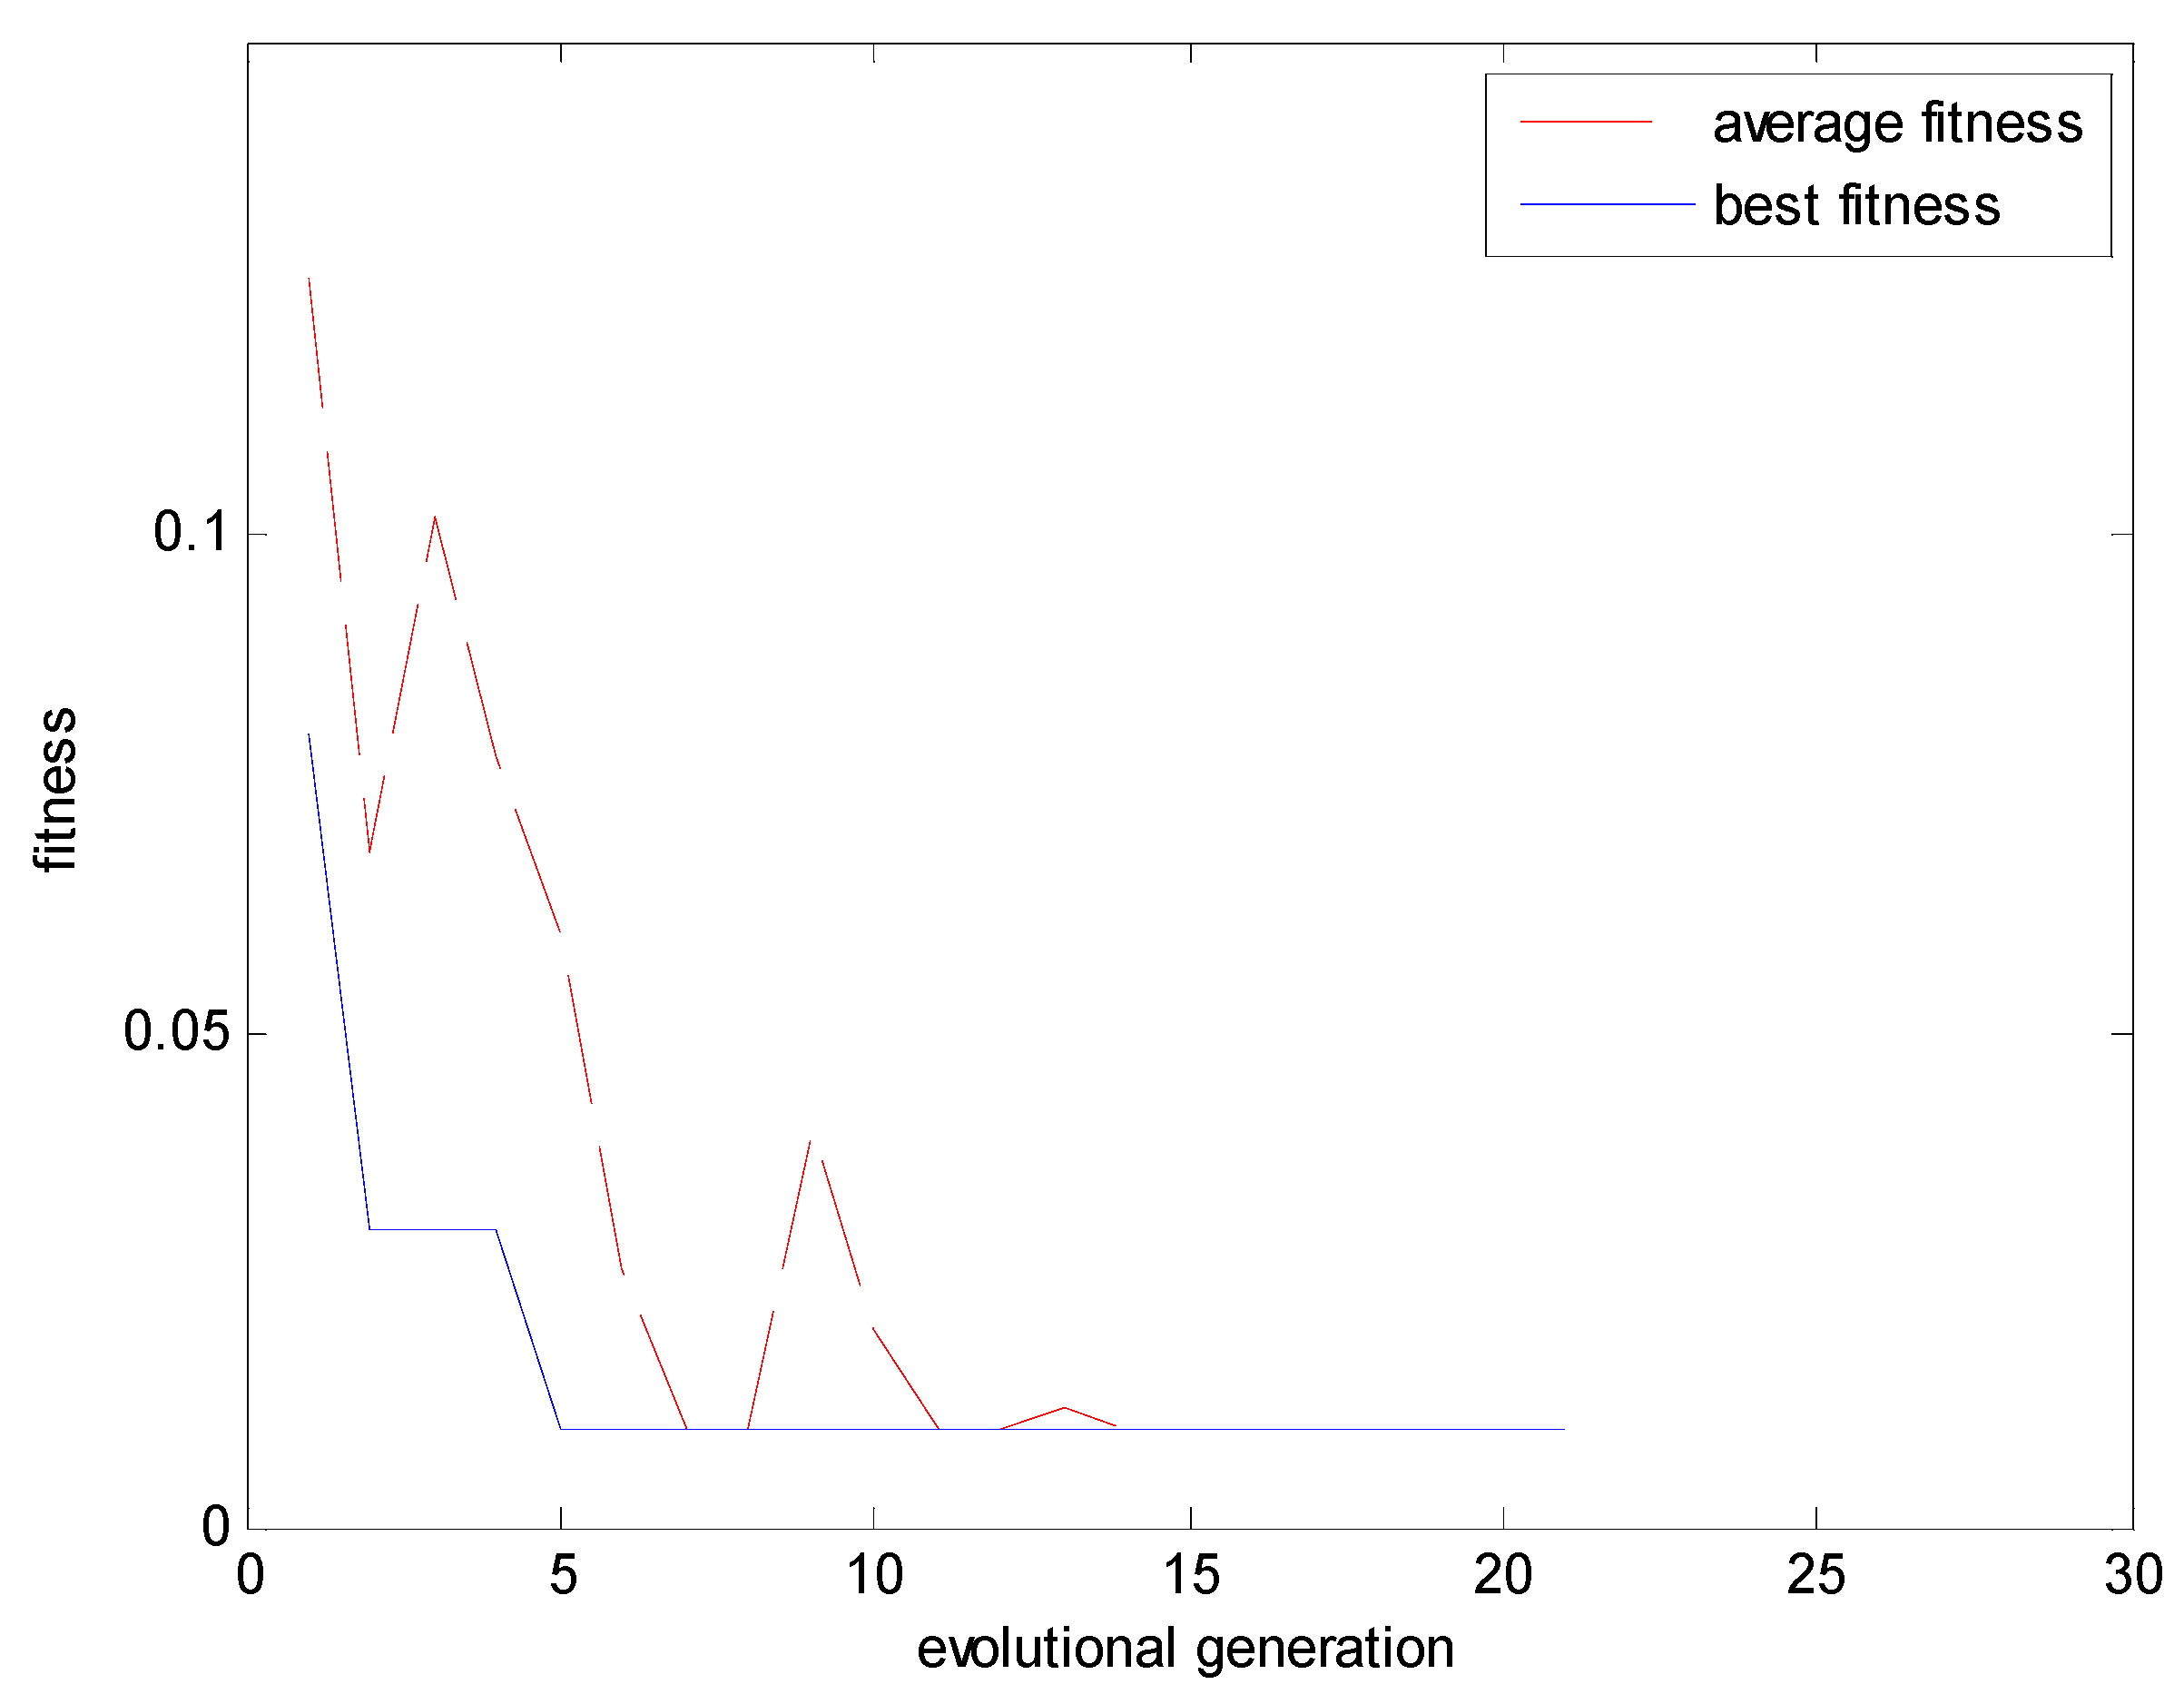
- Our method uses a symmetrical alpha stable distribution to replace the commonly used Gauss distribution in the probabilistic neural network and optimize parameter α, γ of the alpha stable distribution with a genetic algorithm, resulting in α and γ values of 0.2848 and 1.5963. This makes the enhanced probabilistic neural network more adaptable and improves the accuracy rate of the model prediction result.
- (3)
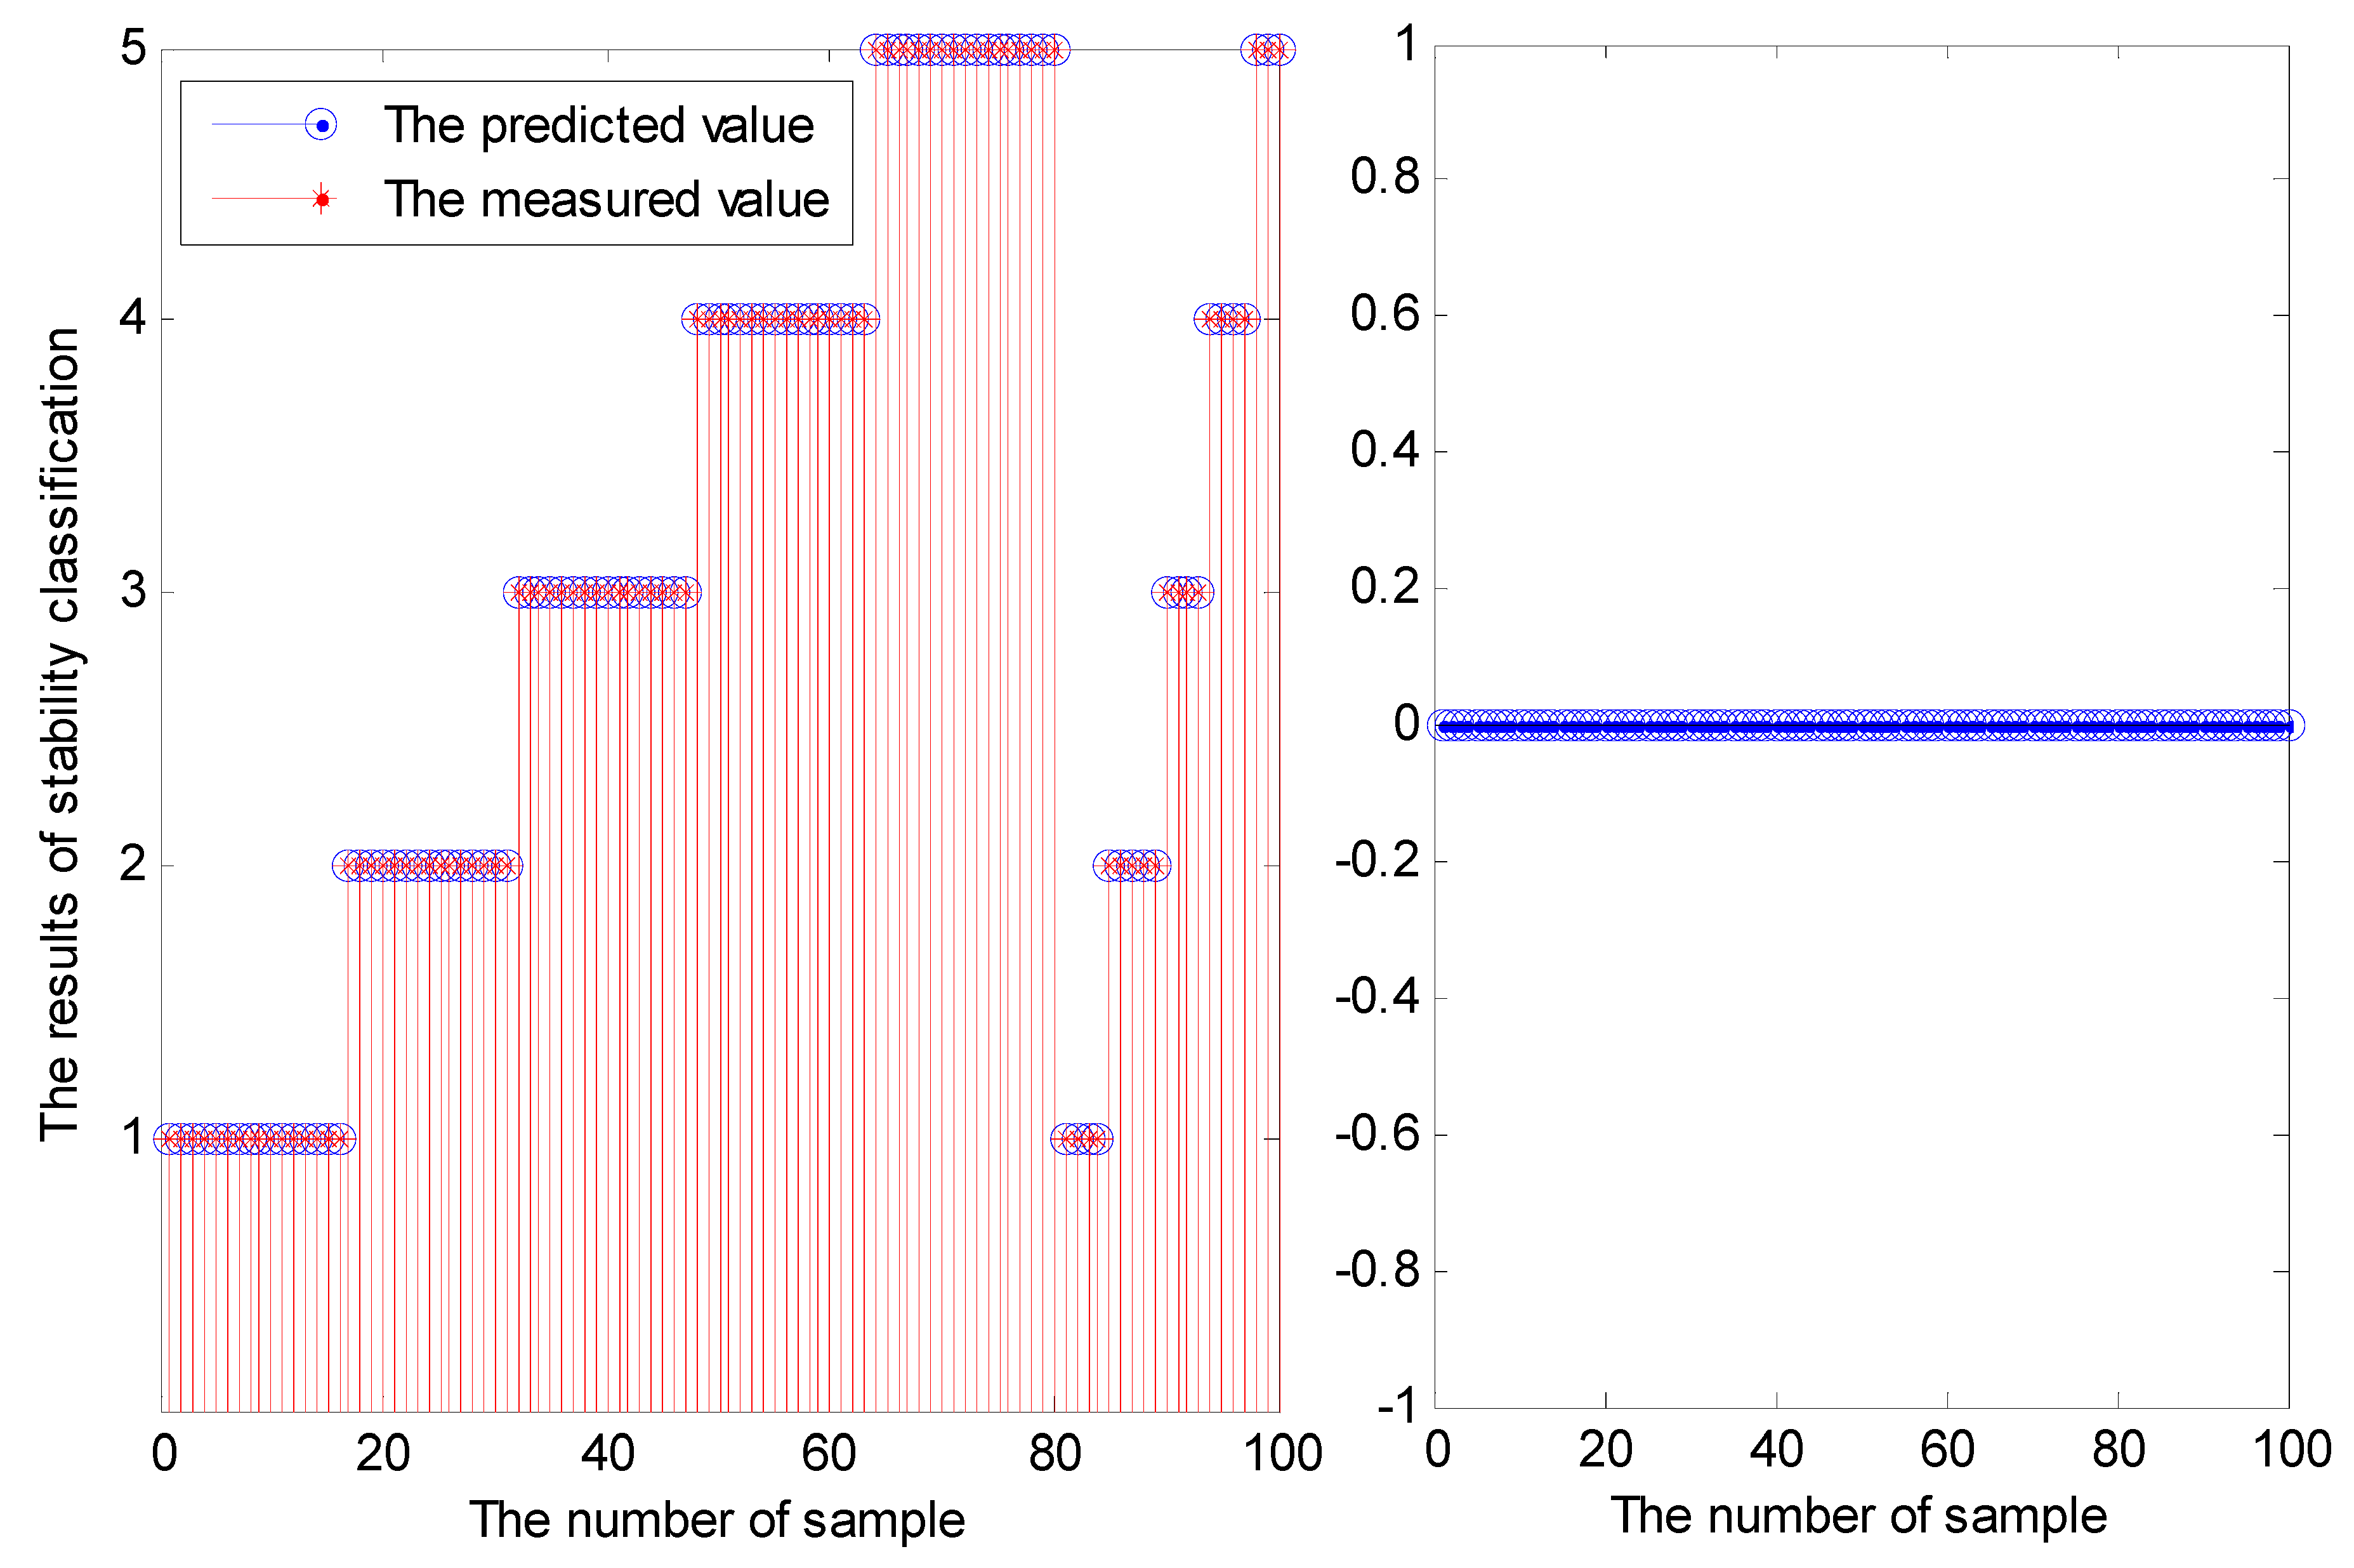
- Taking the roadway of the Jianlinshan mining area in the Daye iron mine as an example, we applied the prediction model for roadway surrounding rock stability based on the concept lattice and improved probabilistic neural network. The accuracy rate was up to 90%, which is 20% higher than the accuracy rate of the prediction model based on the original probabilistic neural network. In other words, the proposed prediction model can meet the demands of practical engineering and provides a new method for predicting the stability of roadway surrounding rock.
Author Contributions
Funding
Acknowledgments
Conflicts of Interest
References
- Gavin, M.M.; Simon, M.J.; Timothy, T.W. The world’s lead-zinc mineral resources: Scarcity, data, issues and opportunities. Ore Geol. Rev. 2017, 80, 1160–1190. [Google Scholar]
- Qi, W.; Bei, J.; Rui, P.; Li, S.C.; He, M.C.; Sun, H.B.; Qin, Q.; Yu, H.C.; Luan, Y.C. Failure mechanism of surrounding rock with high stress and confined concrete support system. Int. J. Rock Mech. Min. Sci. 2018, 102, 89–100. [Google Scholar]
- Sun, X.M.; Chen, F.; Miao, C.Y.; Song, P.; Li, G.; Zhao, C.W.; Xia, X. Physical modeling of deformation failure mechanism of surrounding rocks for the deep-buried tunnel in soft rock strata during the excavation. Tunn. Undergr. Space Technol. 2018, 74, 247–261. [Google Scholar] [CrossRef]
- Liu, B.; Malekian, R.; Xu, J.P. Groundwater Mixing Process Identification in Deep Mines Based on Hydrogeochemical Property Analysis. Appl. Sci. 2017, 7, 42. [Google Scholar] [CrossRef]
- Li, H.; Lin, B.Q.; Hong, Y.D.; Gao, Y.B.; Yang, W.; Liu, T.; Wang, R.; Huang, Z.B. Effects of in-situ stress on the stability of a roadway excavated through a coal seam. Int. J. Min. Sci. Technol. 2017, 27, 917–927. [Google Scholar] [CrossRef]
- Huang, X.; Liu, Q.S.; Shi, K.; Pan, Y.C.; Liu, J.P. Application and prospect of hard rock TBM for deep roadway Construction in coal mines. Tunn. Undergr. Space Technol. 2018, 73, 105–126. [Google Scholar] [CrossRef]
- Ho, S.C.M.; Li, W.; Wang, B.; Song, G. A load measuring anchor plate for rock bolt using fiber optic sensor. Smart Mater. Struct. 2017, 26, 057003. [Google Scholar] [CrossRef]
- Wang, B.; Huo, L.; Chen, D.; Li, W.; Song, G. Impedance-based pre-stress monitoring of rock bolts using a piezoceramic-based smart washer—A feasibility study. Sensors 2017, 17, 250. [Google Scholar] [CrossRef] [PubMed]
- Song, G.; Li, W.; Wang, B.; Ho, S.C.M. A review of rock bolt monitoring using smart sensors. Sensors 2017, 17, 776. [Google Scholar] [CrossRef] [PubMed]
- Li, C.H.; Bu, L.; Wei, X.M.; Wang, P.F.; Shi, Y.Q.; Chen, L.G. Current status and future trends of deep mining safety mechanism and disaster prevention and control. Chin. J. Eng. 2017, 39, 1129–1140. [Google Scholar]
- Wang, Q.; Pan, R.; Jiang, B.; Li, S.C.; He, M.C.; Sun, H.B.; Wang, L.; Qin, Q.; Yu, H.C.; Luan, Y.C. Study on failure mechanism of roadway with soft rock in deep coal mine and confined concrete support system. Eng. Fail. Anal. 2017, 81, 155–177. [Google Scholar] [CrossRef]
- Song, G.; Wang, C.; Wang, B. Structural health monitoring (SHM) of civil structures. Appl. Sci. 2017, 789. [Google Scholar] [CrossRef]
- Kong, Q.; Robert, R.H.; Silva, P.; Mo, Y.L. Cyclic crack monitoring of a reinforced concrete column under simulated pseudo-dynamic loading using piezoceramic-based smart aggregates. Appl. Sci. 2016, 6, 341. [Google Scholar] [CrossRef]
- Yi, C.; Lv, Y.; Xiao, H.; Huang, T.; You, G. Multisensor signal denoising based on matching synchrosqueezing wavelet transform for mechanical fault condition assessment. Meas. Sci. Technol. 2018, 29, 045104. [Google Scholar] [CrossRef]
- Zhang, H.L.; Wang, L.G.; Gao, F.; Yang, H.B. Numerical simulation study on the influence of the ground stress field on the stability of roadways. Min. Sci. Technol. 2010, 20, 707–711. [Google Scholar] [CrossRef]
- Wang, B.; Mo, C.C.; He, C.; Yan, Q.X. Fuzzy Synthetic Evaluation of the Long-Term Health of Tunnel Structures. Appl. Sci. 2017, 7, 203. [Google Scholar] [CrossRef]
- Ye, Y.C.; Yao, N.; Wang, Q.Z.; Wang, Q.H. A method of ranking interval numbers based on degrees for multiple attribute decision making. J. Intell. Fuzzy Syst. 2014, 30, 211–221. [Google Scholar] [CrossRef]
- Shi, S.S.; Li, S.C.; Li, L.P.; Zhou, Z.Q.; Wang, J. Advance optimized classification and application of surrounding rock based on fuzzy analytic hierarchy process and Tunnel Seismic Prediction. Autom. Constr. 2014, 37, 217–222. [Google Scholar] [CrossRef]
- Qiu, D.H.; Li, S.C.; Zhang, L.W.; Xue, Y.G. Application of GA-SVM in classification of surrounding rock based on model reliability examination. Min. Sci. Technol. 2010, 20, 428–433. [Google Scholar] [CrossRef]
- Kulatilake, P.H.S.W.; Wu, Q.; Hudaverdi, T.; Kuzu, C. Mean particle size prediction in rock blast fragmentation using neural networks. Eng. Geol. 2015, 114, 298–311. [Google Scholar] [CrossRef]
- Sérgio, M.D.; Newton, J.V. Concept lattices reduction: Definition, analysis and classification. Expert Syst. Appl. 2015, 42, 7084–7097. [Google Scholar]
- Ling, W.; Jun, J.Q. Relation between concept lattice reduction and rough set reduction. Knowl. Based Syst. 2010, 23, 934–938. [Google Scholar]
- Jan, K.; Petr, K. On attribute reduction in concept lattices: Experimental evaluation shows discernibility matrix based methods inefficient. Inf. Sci. 2018, 467, 431–445. [Google Scholar]
- Ashok, K.P.; Snehamoy, C. Computer vision-based limestone rock-type classification using probabilistic neural network. Geosci. Front. 2016, 7, 53–60. [Google Scholar]
- Jiao, X.X.; Jing, B.; Huang, Y.F.; Li, J.; Xu, G.Y. Research on fault diagnosis of airborne fuel pump based on EMD and probabilistic neural networks. Microelectron. Reliab. 2017, 75, 296–308. [Google Scholar] [CrossRef]
- Huang, X.B.; Liu, X.L.; Ren, Y.Q. Enterprise credit risk evaluation based on neural network algorithm. Cogn. Syst. Res. 2018, 52, 317–324. [Google Scholar] [CrossRef]
- Khairul, H.P.; Norhisham, B.; Hong, H. The use of a non-probabilistic artificial neural network to consider uncertainties in vibration-based-damage detection. Mech. Syst. Signal Process. 2017, 83, 194–209. [Google Scholar]
- Li, P. Structural damage localization using probabilistic neural networks. Math. Comput. Model. 2011, 54, 965–969. [Google Scholar] [CrossRef]
- Syyed, A.R.S.; Tom, B.; Naveed, A.; Ali, P.; Shen, Y.J.; Muhammad, A.B. Road Safety Risk Evaluation Using GIS-Based Data Envelopment Analysis—Artificial Neural Networks Approach. Appl. Sci. 2017, 7, 886. [Google Scholar]
- Maher, I.S.; Biswajeet, P. Severity Prediction of Traffic Accidents with Recurrent Neural Networks. Appl. Sci. 2017, 7, 476. [Google Scholar]
- Zhao, N.B.; Li, Z.M. Viscosity prediction of different ethylene glycol/water based nanofluids using a RBF neural network. Appl. Sci. 2017, 7, 409. [Google Scholar] [CrossRef]
- Sérgio, M.D.; Newton, J.V. A methodology for analysis of concept lattice reduction. Inf. Sci. 2017, 396, 202–217. [Google Scholar]
- Jan, K. On attribute reduction in concept lattices: Methods based on discernibility matrix are outperformed by basic clarification and reduction. Inf. Sci. 2017, 415, 199–212. [Google Scholar]
- Cornejo, M.E.; Jesús, M.; Eloisa, R.P. Attribute reduction in multi-adjoint concept lattices. Inf. Sci. 2015, 294, 41–56. [Google Scholar] [CrossRef]
- Min, L.; Wen, M.S.; Xiu, W.Z.; Cheng, W. Reduction method for concept lattices based on rough set theory and its application. Comput. Math. Appl. 2007, 53, 1390–1410. [Google Scholar]
- Gabriel, C.; Cristian, V. A note on similarity relations between fuzzy attribute-oriented concept lattices. Inf. Sci. 2018, 460, 254–263. [Google Scholar]
- Bibalan, M.H.; Amindavar, H.; Amirmazlaghani, M. Characteristic function based parameter estimation of skewed alpha-stable distribution: An analytical approach. Signal Process. 2017, 130, 323–336. [Google Scholar] [CrossRef]
- Liang, Y.J.; Chen, W. A survey on computing Lévy stable distributions and a new MATLAB toolbox. Signal Process. 2013, 93, 242–251. [Google Scholar] [CrossRef]
- Kumari, A.C. Feature selection optimization in SPL using genetic algorithm. Procedia Comput. Sci. 2018, 132, 1477–1486. [Google Scholar]
- Wang, M.W.; Zhu, Q.K.; Zhao, K.Y.; Jiang, H.; Jin, J.L. A novel cloud model coupled with connection number based on finite intervals for evaluation of surrounding rock stability. Chin. Rock Soil Mech. 2016, 37, 140–144. [Google Scholar]
- Stumme, G.; Taouil, R.; Bastide, Y.; Pasquier, N.; Lakhal, L. Computing iceberg concept lattices with Titanic. Data Knowl. Eng. 2002, 42, 189–222. [Google Scholar] [CrossRef]
- Nguyen, T.T.; Hui, S.C.; Chang, K.Y. A lattice-based approach for mathematical search using formal concept analysis. Expert Syst. Appl. 2012, 39, 5820–5828. [Google Scholar] [CrossRef]


| Number | Article | Journal |
|---|---|---|
| 1 | Stability classification of adjoining rock of underground engineering based on Hopfield network | Chinese Journal of Geotechnical Engineering |
| 2 | Research on surrounding rock evaluation of underground engineering based on extension method | Chinese Journal of Rock Mechanics and Engineering |
| 3 | Set pair analysis—variable fuzzy set model for evaluation of stability of surrounding rock | Chinese Journal of Geotechnical Engineering |
| 4 | A novel extension evaluation model of surrounding rock stability based on connection cloud | Chinese Journal of Geotechnical Engineering |
| 5 | Classification of stability of surrounding rock using cloud model | Chinese Journal of Geotechnical Engineering |
| 6 | A fuzzy comprehensive evaluation methodology for rock burst forecasting using microseismic monitoring | Tunnelling and Underground Space Technology |
| 7 | Stability and availability evaluation of underground strategic petroleum reserve (SPR) caverns in bedded rock salt of Jintan, China | Energy |
| 8 | Decoupled explosion in an underground opening and dynamic responses of surrounding rock masses and structures and induced ground motions: A FEM-DEM numerical study | Tunnelling and Underground Space Technology |
| …… | ||
| Category | Rock Quality Designation (RQD) | Uniaxial Compressive Strength (Rc/MPa) | Integrity Coefficient of Rock Mass | Groundwater Seepage/(L/(min·10 m)) | Joint Condition |
|---|---|---|---|---|---|
| Stable, I | [90, 100] | [150, 200] | [0.75, 1.00] | [0, 5) | [9, 10] |
| Relatively stable, II | [75, 90) | [100, 150) | [0.55, 0.75) | [5, 10) | [7, 9) |
| Basically stable, III | [50, 75) | [60, 100) | [0.30, 0.55) | [10, 25) | [4, 7) |
| Unstable, IV | [25, 50) | [30, 60) | [0.15, 0.30) | [25, 125) | [2, 4) |
| Extremely unstable, V | [0, 25) | [0, 30) | [0.00, 0.15) | [125, 250] | [0, 2) |
| Sequence Number | Rock Quality Designation (Grade) | Uniaxial Compressive Strength (Grade) | Integrity Coefficient of Rock Mass (Grade) | Groundwater Seepage (Grade) | Joint Condition (Grade) | Grade |
|---|---|---|---|---|---|---|
| 1 | 96 (1) | 200.0 (1) | 0.97 (1) | 5 (1) | 9 (1) | I |
| 2 | 93 (1) | 152.0 (1) | 0.99 (1) | 3 (1) | 8.3 (2) | I |
| 3 | 98 (1) | 140.0 (2) | 0.95 (1) | 9 (2) | 8 (2) | I |
| 4 | 90 (1) | 170.0 (1) | 0.96 (1) | 9 (2) | 7.5 (2) | I |
| 5 | 88 (2) | 185.5 (1) | 0.89 (1) | 6 (2) | 8 (2) | II |
| 6 | 73 (3) | 176.4 (1) | 0.80 (1) | 8 (2) | 7 (2) | II |
| 7 | 92 (1) | 158.2 (1) | 0.94 (1) | 6 (2) | 7 (2) | II |
| 8 | 76 (2) | 181.9 (1) | 0.92(1) | 9 (2) | 8 (2) | II |
| 9 | 79 (2) | 126.0 (2) | 0.67 (2) | 7 (2) | 7.5 (2) | II |
| 10 | 74 (3) | 40.0 (4) | 0.38 (3) | 10 (2) | 6 (3) | III |
| 11 | 59 (3) | 97.0 (3) | 0.43 (3) | 15 (3) | 6.7 (3) | III |
| 12 | 65 (3) | 70.0 (3) | 0.60 (2) | 9 (2) | 6 (3) | III |
| 13 | 69 (3) | 65.0 (3) | 0.50 (3) | 9 (2) | 5 (3) | III |
| 14 | 48 (4) | 25.0 (5) | 0.22 (4) | 20 (3) | 4 (4) | IV |
| 15 | 74 (3) | 25.0 (5) | 0.15(4) | 20 (3) | 3 (4) | IV |
| 16 | 33 (4) | 78.0 (3) | 0.27 (4) | 20 (3) | 1.6 (4) | IV |
| 17 | 35 (4) | 25.0 (5) | 0.40 (3) | 12 (3) | 5 (4) | IV |
| 18 | 18 (5) | 20.0 (5) | 0.03 (5) | 20 (3) | 1 (5) | V |
| 19 | 20 (5) | 20.0 (5) | 0.20 (4) | 12 (3) | 3 (5) | V |
| 20 | 14 (5) | 35.0 (4) | 0.20 (4) | 15 (3) | 3 (5) | V |
| Object | a_1 | a_2 | a_3 | a_4 | a_5 | b_1 | b_2 | b_3 | … | f_1 | f_2 | f_3 | f_4 | f_5 |
|---|---|---|---|---|---|---|---|---|---|---|---|---|---|---|
| 1 | × | × | × | |||||||||||
| 2 | × | × | × | |||||||||||
| 3 | × | × | × | |||||||||||
| 4 | × | × | × | |||||||||||
| 5 | × | × | × | |||||||||||
| 6 | × | × | × | |||||||||||
| 7 | × | × | × | |||||||||||
| 8 | × | × | × | |||||||||||
| 9 | × | × | × | |||||||||||
| 10 | × | × | ||||||||||||
| 11 | × | × | × | |||||||||||
| 12 | × | × | × | |||||||||||
| 13 | × | × | × | |||||||||||
| 14 | × | × | ||||||||||||
| 15 | × | × | ||||||||||||
| 16 | × | × | × | |||||||||||
| 17 | × | × | ||||||||||||
| 18 | × | × | ||||||||||||
| 19 | × | × | ||||||||||||
| 20 | × | × |
| Sequence Number | Discriminable Concept | Corresponding Loss Attribute |
|---|---|---|
| 1 | ({1,2, …, 20}, Ø) | abcde |
| 2 | ({11,14,15,16,17,18,19,20}, {d_3}) | abce |
| 3 | ({10,11,12,13,14,17}, {e_3}) | abcd |
| 4 | ({6,10,11,12,13,15}, {a_3}) | bcde |
| 5 | ({10,20}, {b_4}) | acde |
| 6 | ({11,12,13,16}, {b_3}) | acde |
| 7 | ({9,12}, {c_2, d_2}) | abe |
| 8 | ({10,11,13,17}, {c_3,e_3}) | abd |
| 9 | ({16,18}, {d_3,e_5}) | abc |
| 10 | ({11,14,17}, {d_3,e_3}) | abc |
| 11 | ({3,4,5,6,7,8,9}, {d_2,e_2}) | abc |
| 12 | ({1,2,3,4,7}, {a_1,c_1}) | bde |
| 13 | ({11,15}, {a_3,d_3}) | cbe |
| 14 | ({6,10,12,13}, {a_3,d_2}) | bce |
| 15 | ({14,15,17,18,19}, {b_5,d_3}) | ace |
| 16 | ({11,16}, {b_3,d_3}) | ace |
| 17 | ({14,15,16,19,20}, {c_4,d_3}) | abe |
| 18 | ({3,9}, {b_2,d_2,e_2}) | ac |
| 19 | ({15,19,20}, {c_4,d_3,e_4}) | ab |
| 20 | ({11,17}, {c_3,d_3,e_3}) | ab |
| 21 | ({1,2,4,7}, {a_1,b_1,c_1}) | de |
| 22 | ({14,15,19}, {b_5,c_4,d_3}) | ae |
| 23 | ({2,3,4,7}, {a_1,c_1,e_2}) | bd |
| 24 | ({4,5,6,7,8}, {a_1,c_1,d_2,e_2}) | b |
| 25 | ({2,4,7}, {a_1,b_1,c_1,e_2}) | d |
| 26 | ({3,4,7}, {a_1,c_1,d_2,e_2}) | b |
| 27 | ({15,19}, {b_5,c_4,d_3,e_4}) | a |
| 28 | ({4,7}, {a_1,b_1,c_1,d_2,e_2}) | Ø |
| Number of Roadway | Rock Quality Designation (RQD) | Uniaxial Compressive Strength (Rc/MPa) | Integrity Coefficient of Rock Mass | Groundwater Seepage/(L/(min·10 m) | Joint Condition | Grade |
|---|---|---|---|---|---|---|
| 1 | 55 | 98 | 0.5 | 10 | 5 | III |
| 2 | 40 | 60 | 0.3 | 12 | 5 | IV |
| 3 | 20 | 20 | 0.3 | 12 | 3 | V |
| 4 | 96 | 135 | 0.8 | 9 | 9 | I |
| 5 | 50 | 100 | 0.5 | 10 | 6 | III |
| 6 | 42 | 63 | 0.5 | 10 | 3 | III |
| 7 | 100 | 150 | 0.7 | 10 | 8 | I |
| 8 | 78 | 125 | 0.6 | 10 | 5 | II |
| 9 | 30 | 80 | 0.6 | 20 | 6 | IV |
| 10 | 25 | 35 | 0.3 | 20 | 2 | V |
| Name of Prediction Model | Concept Lattice Reduction and Symmetric Alpha Stable Distribution Probability Neural Network | Symmetric Alpha Stable Distribution Probability Neural Network | Probabilistic Neural Network | Mean Value Method |
|---|---|---|---|---|
| Accuracy of prediction results | 90% | 80% | 70% | 50% |
© 2018 by the authors. Licensee MDPI, Basel, Switzerland. This article is an open access article distributed under the terms and conditions of the Creative Commons Attribution (CC BY) license (http://creativecommons.org/licenses/by/4.0/).
Share and Cite
Liu, Y.; Ye, Y.; Wang, Q.; Liu, X. Stability Prediction Model of Roadway Surrounding Rock Based on Concept Lattice Reduction and a Symmetric Alpha Stable Distribution Probability Neural Network. Appl. Sci. 2018, 8, 2164. https://doi.org/10.3390/app8112164
Liu Y, Ye Y, Wang Q, Liu X. Stability Prediction Model of Roadway Surrounding Rock Based on Concept Lattice Reduction and a Symmetric Alpha Stable Distribution Probability Neural Network. Applied Sciences. 2018; 8(11):2164. https://doi.org/10.3390/app8112164
Chicago/Turabian StyleLiu, Yang, Yicheng Ye, Qihu Wang, and Xiaoyun Liu. 2018. "Stability Prediction Model of Roadway Surrounding Rock Based on Concept Lattice Reduction and a Symmetric Alpha Stable Distribution Probability Neural Network" Applied Sciences 8, no. 11: 2164. https://doi.org/10.3390/app8112164
APA StyleLiu, Y., Ye, Y., Wang, Q., & Liu, X. (2018). Stability Prediction Model of Roadway Surrounding Rock Based on Concept Lattice Reduction and a Symmetric Alpha Stable Distribution Probability Neural Network. Applied Sciences, 8(11), 2164. https://doi.org/10.3390/app8112164