Abstract
This paper deals with the use of genetic algorithms for the determination of the optimal set-point signals for the control of the temperature in a residential building for which the use of the rooms, that is, the user requirements, are different throughout the day. In particular, the optimization procedure aims at minimizing the overall energy consumption by satisfying, at the same time, the comfort constraints set by the user. Both the case of radiators and fan-coil units are considered. The presence of unoccupied rooms is also addressed. Finally, a comparison between this approach and a Model Predictive Control based one is presented. Simulation results obtained by using TRNSYS software tool demonstrate the effectiveness of the method.
1. Introduction
It is well known that the building sector uses more than 40% of world energy to maintain appropriate levels of comfort for people. Indeed, the resulting carbon emission is actually greater than that of the transportation sector [1]. In fact, this energy is mainly consumed to ensure an adequate thermal comfort level by acting on Heating, Ventilation and Air-Conditioning (HVAC) systems. Thus, energy-efficient solutions should be developed in order to decrease the total amount of carbon and emissions to help the fulfillment of the targets in the global climate change context [2]. A significant research effort has been provided by engineers and architects to influence the energy use of the new buildings through the design of the envelope and the HVAC systems selection [3,4]. However, when a building has been finished or it already exists and can be just retrofitted, the consumption of energy is determined mainly by the HVAC control [5], maintenance and by the requirements of its occupants. In any case, as renovations and isolations have high costs and are time demanding, the use of an advanced control systems can be a good trade-off between costs and benefits. Hence, it is necessary to design HVAC control systems that guarantee a high comfort level and energy saving at the same time.
Regarding residential buildings, which represent the most significant case in many parts of the world, most of the control systems in rooms typically consist of thermostatic valves applied to radiators or thermostats. Often, inhabitants fail to use them optimally, by possibly overheating the room and, thus, wasting energy [6]. To improve the performance of these (low-level) control systems, proportional-integral-derivative (PID) controllers can be used with thermostatic valves. Obviously, they need to be properly tuned and, for this purpose, automatic tuning methodologies have been proposed in the literature [7,8]. Other kinds of controllers such as fuzzy logic [9] or neural networks-based controllers [10,11] have also been proposed.
In any case, even if the low-level controllers guarantee a satisfactory performance in tracking the required temperature and in rejecting disturbances, the overall performance in terms of comfort and energy consumption mainly depends on the reference signals (one for each room) whose selection is indeed a critical issue if the requirements of the occupants change during the day, as it is typical in residential buildings. For example, a different temperature might be required in living rooms and in bedrooms during the day and during the night, or (during the winter) a relatively low value of the temperature can be acceptable if the room is used only for a few minutes in a time interval of a few hours. In this case, considering for simplicity a heating system (the same reasoning can be applied to a cooling system), the user selects a minimum required temperature value in a given time interval for each room and the control system must ensure that this value is always attained by taking into account the transient response of the overall system and the couplings between the rooms. The problem can be actually formulated as obtaining appropriate transient responses to track the set-point values to minimize the overall energy consumption. It is worth stressing that, in manual control, the user typically tends to waste energy for this task (for example by switching on the heating system earlier than necessary in a room to have the required temperature at a certain hour), but it is very difficult to take into account all the coupling effects simultaneously, as well as the effects of the exogenous inputs.
It is clear that, to solve this problem, high-performance low-level controllers are not sufficient and an effective high-level control system is necessary to plan the set-point signals for each room to minimize the overall energy consumption by satisfying the user requirements at the same time.
In the context of optimal thermal comfort, during the last two decades a lot of effort has been devoted to investigating Model Predictive Control (MPC) strategies [12]. The main advantage provided by MPC is that it is possible to take into account the set-point scheduling and the weather forecasts and it is easier to deal with linear and nonlinear constraints. Thus, because of its flexibility, MPC has been widely used in the building sector to manage the trade-off between, typically, energy usage and comfort level [13,14,15,16]. In other works, the use of MPC is proposed to minimize the energy consumption while maintaining the indoor thermal comfort at an adequate value by constraining the temperature value between two bounds [17]. In any case, it must be considered that a centralized MPC strategy could have problems when the size of the system increases, as the time interval and the computational effort required to solve the optimization problem might become too large.
To address this issue, the application of a distributed or decentralized MPC has been proposed, but the main drawback in this case is that the overall optimization problem is decomposed in many smaller problems and it is likely that a local minimum is found. For example, a decentralized predictive control strategy to perform a temperature set-point following in a nine rooms building has been applied in [18]. The methodology is quite complex because, firstly, a partition scheme of the building needs to be done and therefore many different lumped parameters models need to be evaluated. Secondly, an order reduction of the model is applied to all the different partitions.
An improvement to this kind of decentralized control strategy comes from the distributed predictive control approach where the partitioned controllers exchange information between each other to obtain the minimum of their own objective function by also knowing the status of the other subsystems. The different performance obtained by centralized, decentralized and distributed predictive control applied on a small building has been investigated in [19,20]. It has been concluded that the distributed control strategy reduces the computational burden with respect to the centralized one by obtaining in any case a satisfactory performance.
In general, the MPC strategy has many advantages and for this reason it has been widely used in many different applications. However, a predictive controller needs to solve the optimization problem at each sampling period and, in the case of a thermal system such as a building, due to its big time constant, it should consider a quite long prediction horizon to be effective. Furthermore, if the size of the problem increases it can be difficult to find the optimal solution in a single sampling period.
In this paper, which is an extended version of [21], we consider the previously described situation where different set-point values are imposed by the user for the different rooms and for different time intervals of the day and we propose a different approach, based on genetic algorithms [22], to the problem of determining the optimal reference signals for the rooms of a residential building to satisfy the user requirements (in terms of a given temperature for each period of a day) by minimizing the energy consumption. The genetic algorithms (GA) approach has been widely used in the building sector; however, it has been mainly applied for the optimization of building design. In this case, a multi-objective approach is used to design the building thermal parameters to obtain a significant energy consumption reduction, or to place and choose the correct HVAC equipment [23,24]. A more interesting case is when derivative-free algorithms, such as GA or particle swarm algorithms, are used to minimize the energy consumption of HVAC systems by optimizing their operations. For instance, in [25] a multi-objective approach is employed to control an air-handling unit, so that a potential energy saving up to 30% is obtained. A similar strategy has been used in [26], where a particle swarm algorithm is employed to optimize the control settings of air-handling units in an office building to obtain a good trade-off between energy consumption and thermal comfort.
However, in case of residential buildings, the most important aspect is to satisfy the inhabitants requirements and then try to reduce as much as possible the total energy consumption. In [27] authors propose a methodology that, thanks to the usage of GA, identifies the building thermal parameters subject to multi-objective cost functions and constraints. In this case, the optimization also considers the control of the employed HVAC systems and the occupants comfort requirements to obtain optimal building thermal parameters. However, this methodology is quite complex and computationally heavy and, furthermore, it must be applied to new buildings.
The methodology proposed here exploits a recently developed temperature modelling technique that provides a sufficiently accurate model of the temperature of each room (by also considering the heat exchange between adjacent rooms) without any prior knowledge of the structure of the building [28], which can be already existent. Based on this model and on the user requests, in terms of temperature values, the reference signal for each room during the day is computed to minimize the energy consumption. To reduce the computational burden, only ramp and step reference signals are considered. Although the obtained solution is therefore suboptimal from a theoretical point of view, the solution can be determined in a relatively short time interval before the resulting planning is applied (for example, it can be calculated during the night for the day after). Both the cases where fan-coil units and radiators are employed have been analyzed. Furthermore, the case where a room is unoccupied and therefore the value of the temperature is not relevant for the user has been addressed, showing again the effectiveness of the devised centralized approach.
The paper is organized as follows. The novelty of the developed approach is presented in Section 2. The problem is formulated in Section 3, while the methodology proposed to solve it is presented in Section 4. The model of the residential building used to illustrate the method is described in Section 5 and simulation results are in Section 6. The case of unoccupied rooms is elaborated in Section 7 and, a comparison between the proposed method and the well-known Model Predictive Control is shown in Section 8. Final discussions and conclusions are given respectively in Section 9 and Section 10.
2. Aim and Novelty of the Study
As pointed out in the introduction, the problem of energy minimization in buildings is important to reduce the energy waste and, consequently, the CO emissions. Many attempts have been made by researchers to figure out a solution. However, all the previous listed methods, even though they always take into account user comfort, never employ the occupant requirements in terms of thermal comfort as hard constraints. The simple methodology presented in this paper aims at solving this particular issue. In fact, the proposed approach is focused mainly on already existent residential buildings. In such a system the user wants to reduce the energy consumption by acting correctly on the HVAC systems, instead of retrofitting the building. Furthermore, the methodology directly exploits as hard constraints the user requirements, in term of temperature value. The occupants are asked to define their daily temperature schedule, and the presence or not of unoccupied spaces. Subject to these requirements, which cannot be violated, the algorithm plans an optimal set-point schedule for each room for the whole day. The algorithm is based on a thermal black-box self-tuning methodology which directly takes into account the thermal coupling effects between adjacent spaces and all the relevant exogenous inputs, for instance the HVAC systems and the weather conditions. In order to decrease the computational burden and therefore to decrease the computational time of the GA, only two different kinds of set-point variations are allowed. Therefore, the algorithm gives as a result a suboptimal solution which is actually close to the optimal one. The GA is run at midnight of each day and then the control of the system, in terms of disturbance rejection and set-point following, is needed to lower the leve of the cascade controllers. Furthermore, during the remaining part of the day, the genetic algorithm approach can be used to solve other optimization problems to obtain results that can help the user to better plan the temperature set-points. In other words, it is possible to answer to some user’s specific request; for example, if the user wants to obtain a 5% reduction in the total energy consumption, the algorithm could evaluate which set-points are worth to being changed. Indeed, it is possible to evaluate the variation in the energy consumption subject to a different user defined set-point signal. Thus, the method can be used to build a thermal comfort policy that yields a significant reduction of the energy consumption.
3. Problem Formulation
We consider a building where the control system is composed by two different layers:
- the low-level layer with the temperature controllers (one for each room);
- the high-level layer related to the optimal set-point planner.
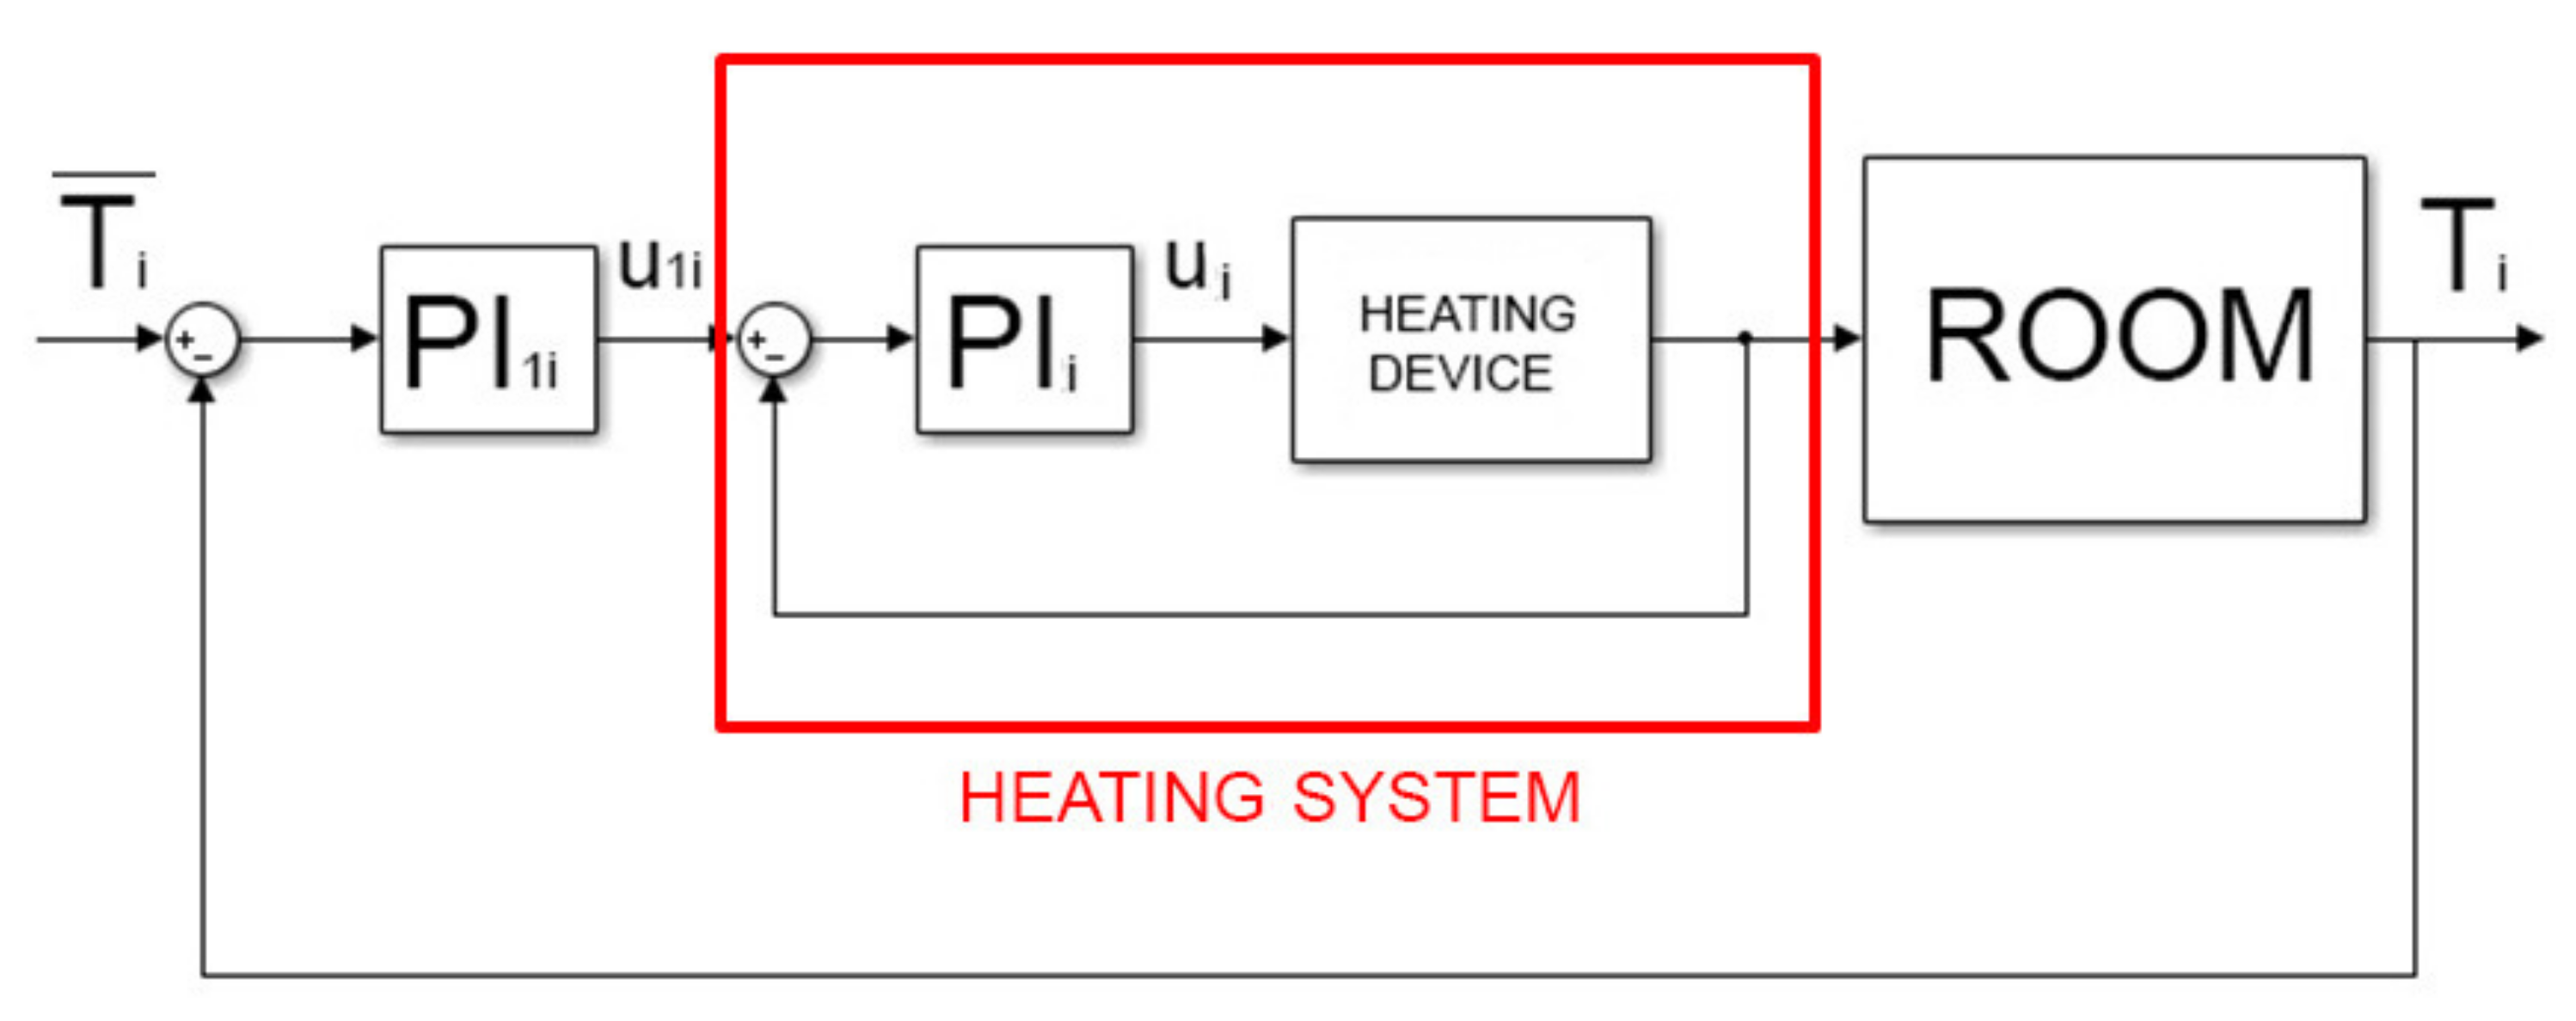
The low-level controllers are used to ensure the tracking of the reference signal and a fast rejection of disturbances (like the opening of a window for a short time interval). The control system used for this purpose (shown in Figure 1) is a standard cascade control scheme based on proportional-integral (PI) controllers. The inner loop represents the heating device, which is assumed it cannot be modified by the user. The outer loop controller determines the room temperature by acting on the set-point of the inner loop so that the output of the primary PI controller can be considered as a measure of the heat provided to the room, which is directly related to the energy.
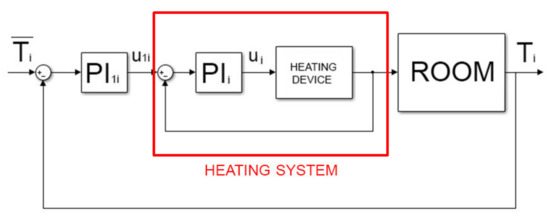
Figure 1.
The control scheme for the temperature of the ith room.
The considered problem is to find optimal set-point temperature signals (one for each room) to reduce the energy consumption by fulfilling some specific constraints required by the user. In this context, it is assumed that the user during the day, for each room, selects different constant set-points for different time intervals (for example, starting from midnight, the set-point temperature in a bedroom can be selected as 20 [] from 0 to 7 am and from 9 to 12 pm, while from 7 am to 9 pm it can be selected as 18 []). In other words, step set-point variations are assumed to be defined by the user. We denote as the temperature required by the user for the ith room and as the time instants when the value of the required temperature changes for the ith room, where (the number of rooms in the building) and (the number of set-point changes in a day for the ith room). The aim of the optimization strategy is to determine, starting from the values defined by the user, the set-point signals to be actually applied to the temperature control system of the ith room (see Section 5) to minimize the overall energy and by ensuring at the same time, that the actually achieved temperature is never lower (more than a given threshold fixed to 0.5 []) than the temperature required by the user.
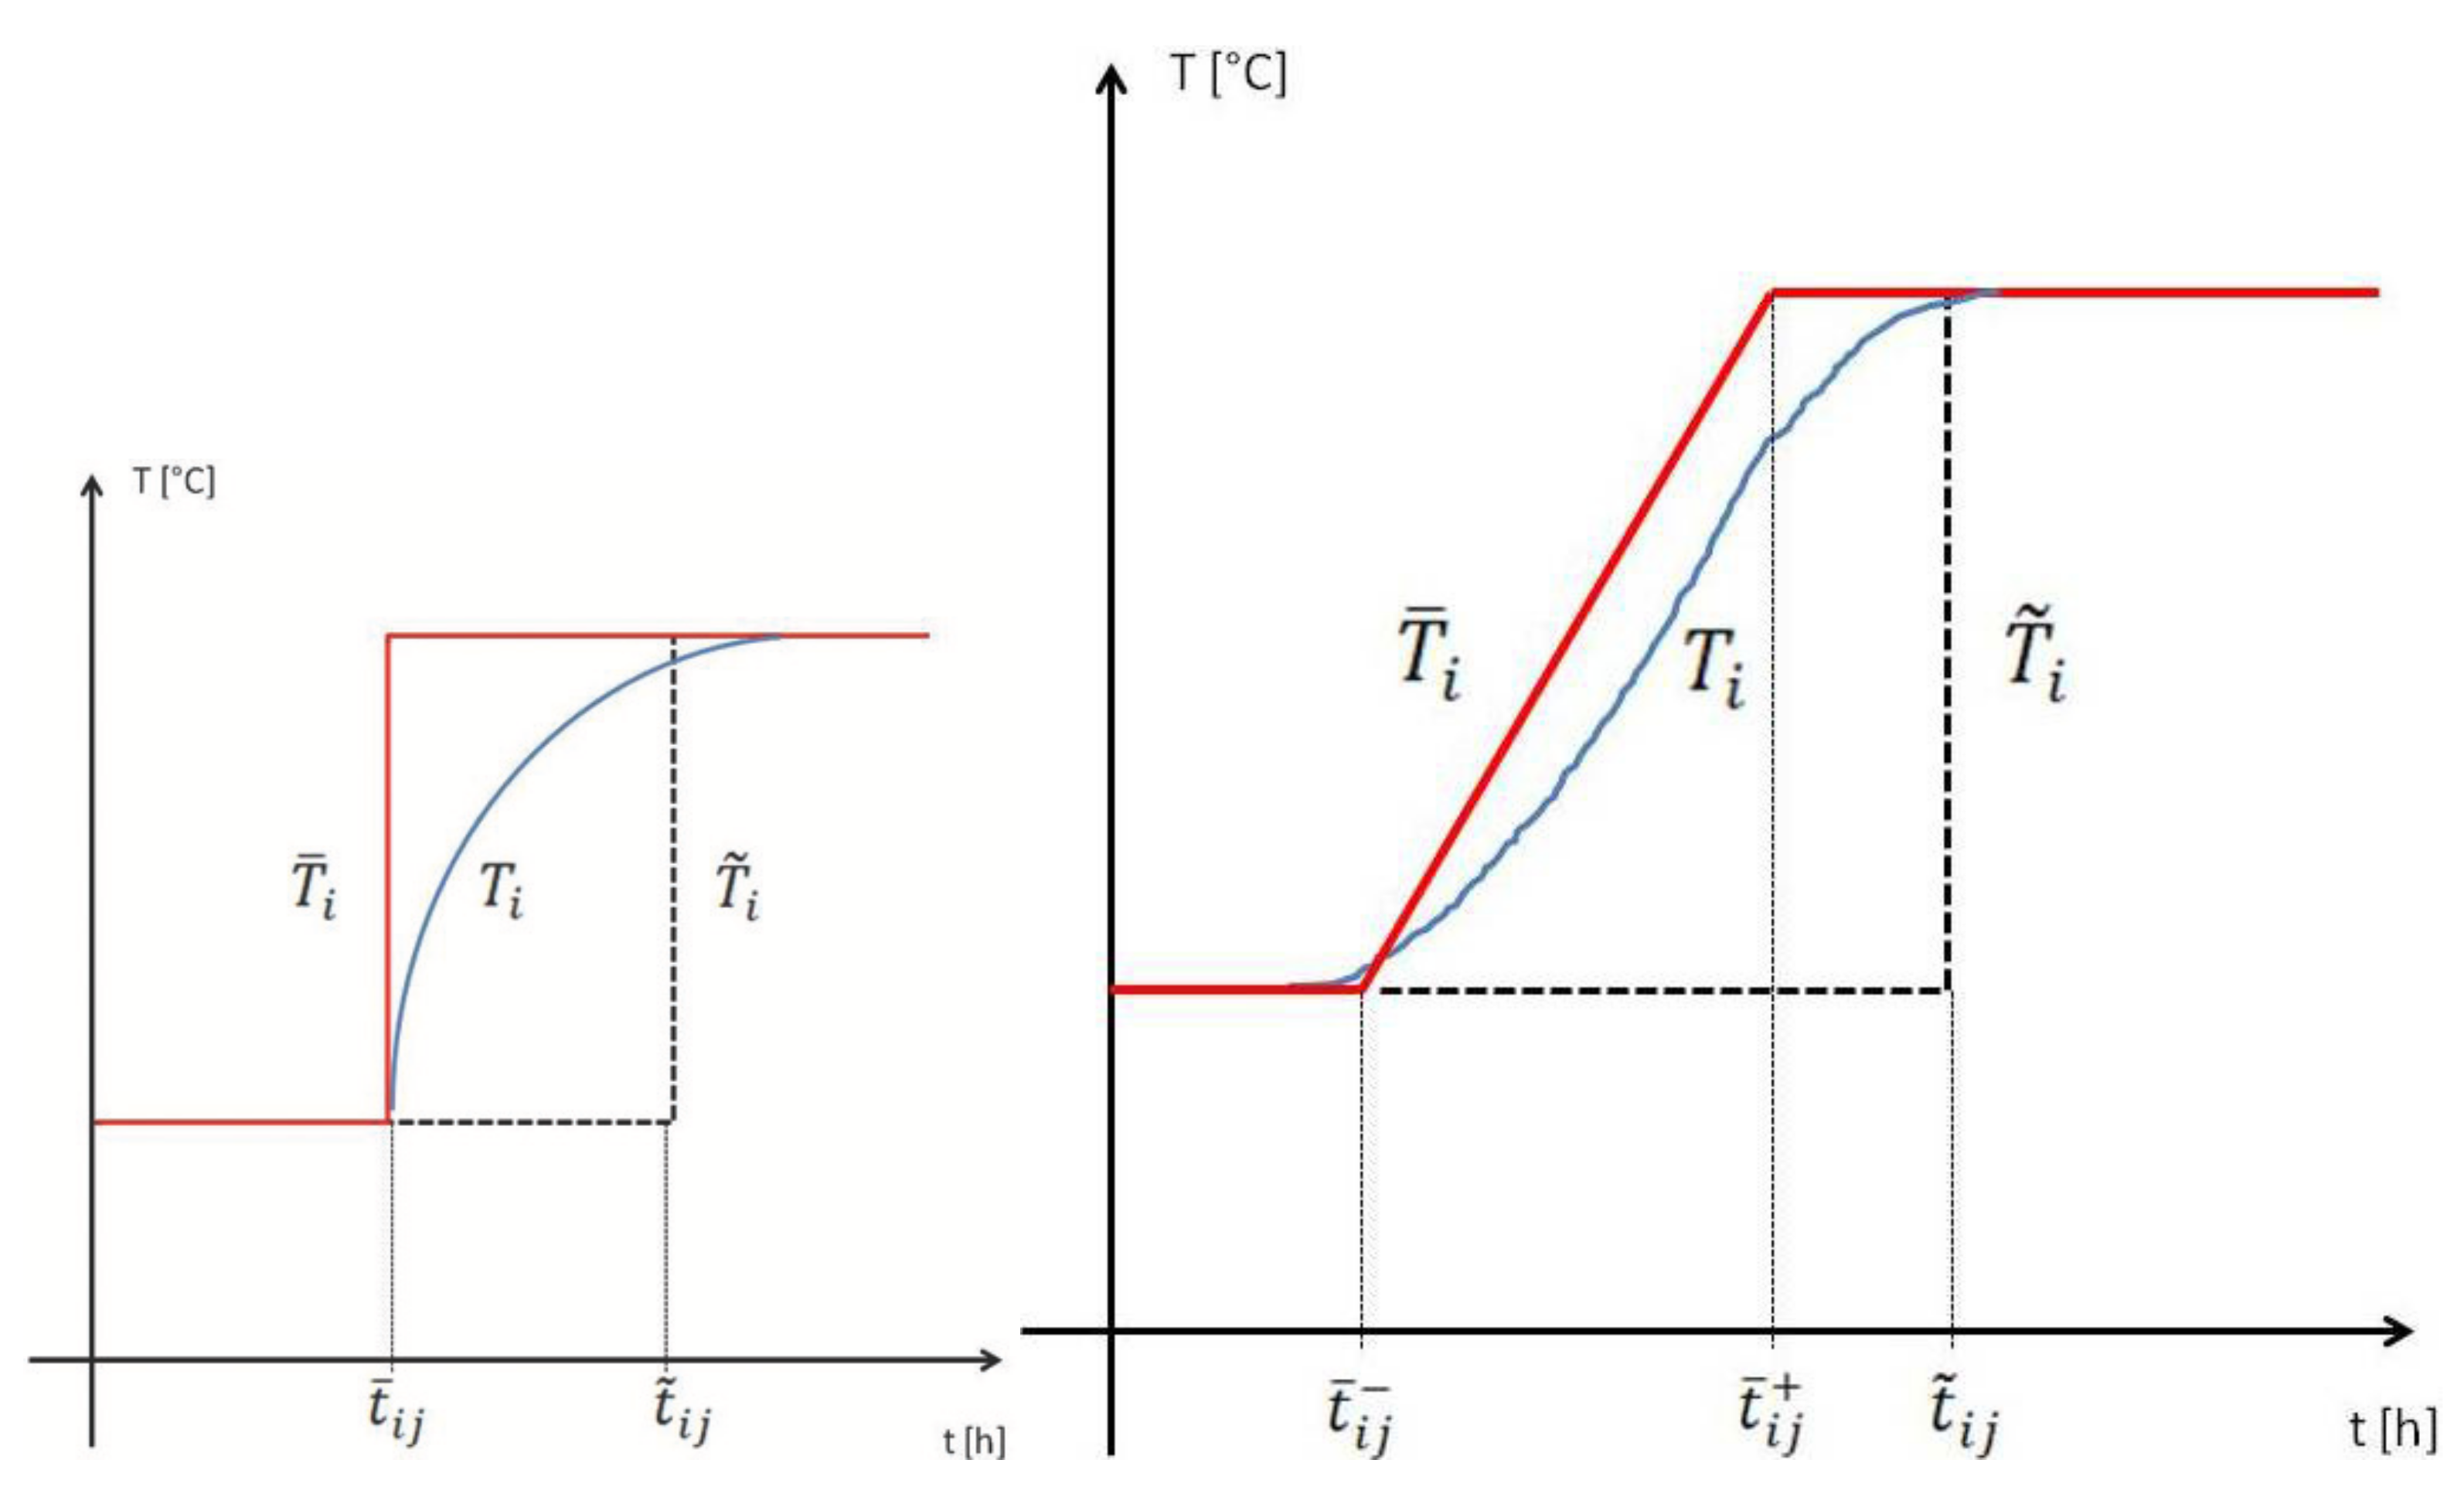
Obviously, the optimal reference signals should not have a predefined shape. However, to keep the optimization problem simple (as it will be clear in Section 4), we define two possible kinds of reference signal variations (thus, yielding actually to a suboptimal solution), namely, based on step and ramp signals. In the first case, for each time , the optimization algorithm must determine a time instant where to apply the set-point step to the room temperature controller. On the other side, if a ramp set-point signal is considered, two time instants and must be selected: the first is the time instant when the ramp starts and the second when the ramp ends. Of course, in both cases the final value of the set-point change is equal to the value of for the considered time interval. The situation is depicted in Figure 2 where a typical evolution of the room temperature is also shown.
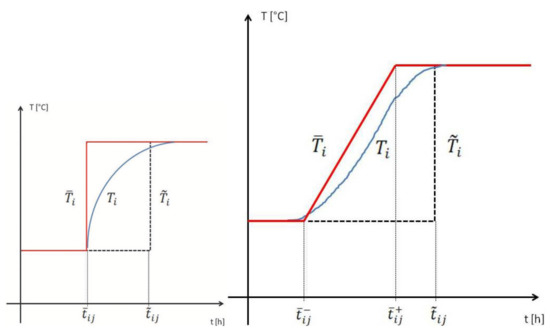
Figure 2.
A sketch of the use of optimized step and ramp signals [21].
The optimization problem to be solved can be therefore written as
or
such that
where the performance index J is defined as the sum of the control variables of all the rooms at each time instant k, namely,
Depending on the kind of the heating system present in the building, the control variable u has different physical meanings. In particular, if radiators are used, [kg/h] represents the water flow at a given time instant for the ith room. Conversely, if fan-coil units are used, [K] represents the inlet liquid temperature. Obviously, in both cases, a minimization of the control effort implies a minimization of the overall energy consumption. In fact, in case of radiators, the energy consumption is proportional to the water flux. The same consideration can be applied to the fan-coil system case, the higher is the inlet temperature of the liquid, the more energy is used.
4. Methodology
To determine the optimal set-point planning for all the rooms (for a given day) the use of GAs is proposed. One of the main advantages of GAs is that they search for a global optimal solution (even if in a stochastic sense) to complex optimization problems. Furthermore, they can find the optimal solution without a specific initialization, while other methods need reasonable initial guesses that have a great effect on the convergence speed and on the final result in most cases.
The optimal parameters to be found are the time instants (in case of step reference signals) or (in case of ramp reference signals). A simple choice for the definition of the search space for each parameter is therefore from the beginning of the day until . Regarding and , in the first case the search space can be defined from the beginning of the day until , while in the second case it can be defined from until the end of the day.
The rationale of a genetic algorithm is to improve the population of individual solutions, by means of an evolutionary process, until the optimal solution is found. To determine the fitness function (4) for each individual during the optimization process, a simulation of the building must be performed. In this context, it must be noted that using a dynamic model of the building that takes into account all the thermodynamic issues is rather impractical, as the simulation time in this case is very long and it is worth using a big population size and many generations to converge to the global optimum. Thus, we propose to use the thermal model developed in [28], which is a seventh-order autoregressive–moving-average with exogenous inputs (ARMAX) model where the couplings between the rooms are also taken into account, to predict the temperature behavior of each room. In case of buildings, the time constants of all the internal spaces is actually quite long, usually some hours, therefore the sampling period that characterize the black-box model is chosen equal to 4 min. It has to be stressed that the model requires, in addition to the measurements of the temperature of each room, also the solar radiation and the external temperature as inputs at each sampling time. Hence, in case of reliable weather forecast, these can be effectively employed as inputs. However, if these data are not available, the weather conditions of the previous day can be in any case used, by assuming a slow variation of them.
Finally, it is worth highlighting that the constraint (3), which is used to preserve in any case the user comfort, can be included in the fitness function of the genetic algorithm by simply multiplying the difference between the obtained room temperature and the required one by a constant that is set to zero is the constraint is satisfied and it is set to a high value if the constraint is not satisfied.
5. Simulated Case Study
A residential building has been considered to evaluate the proposed methodology. It is an apartment that has been created with Google SketchUp 2013 (Trimble Inc., Sunnyvale, CA, USA) [29], which is a well-known software tool to design 3D models of buildings. Then, the model has been imported in TRNSYS 17 (TESS LLC, Fort Lauderdale, FL, USA) simulation environment, that is a simulation software used to describe the thermal behavior of a system. The building has been placed in Milan Linate (Italy). Real weather conditions have been downloaded from TRNSYS 17 Weather Data [30] and have been employed.
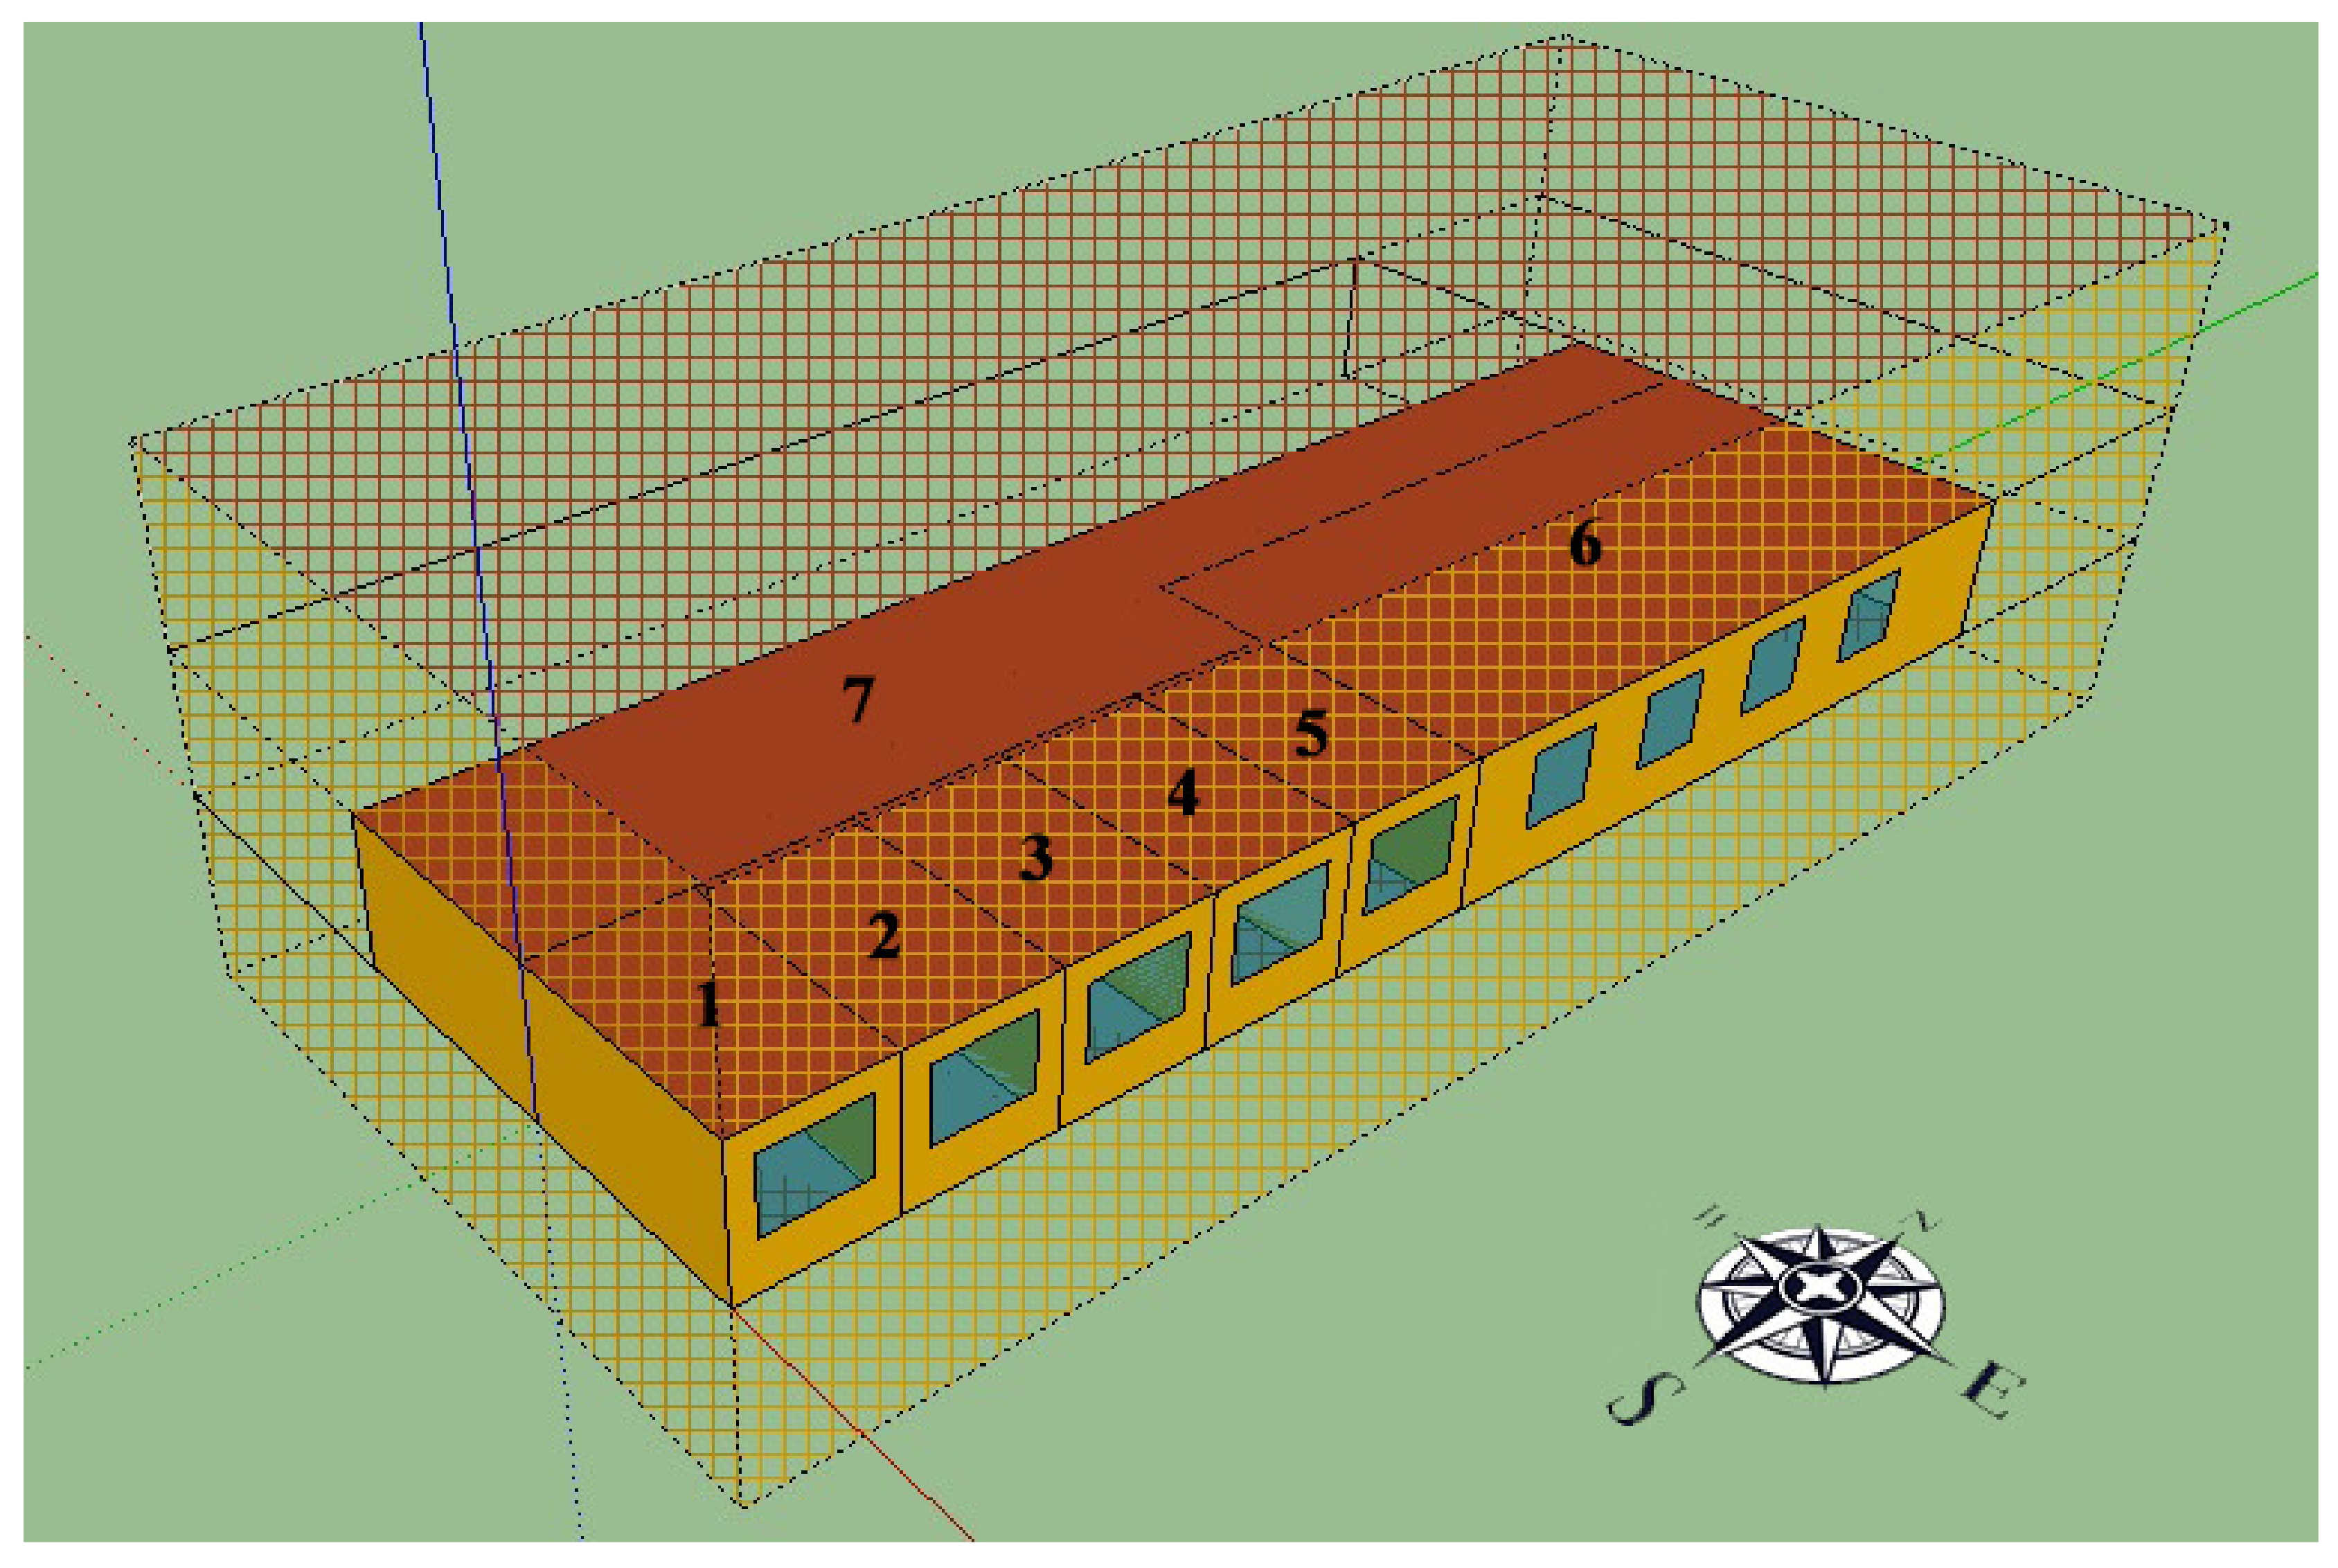
The apartment is shown in Figure 3 and it is composed of seven rooms (see Table 1) and placed in between two residential floors, which are represented by a grid in the figure. There are only two exterior walls, the southern and the eastern ones, for which their external surface temperature depends directly on the weather conditions. The other walls are shared with two adjacent other flats. It can be noted that there is also a corridor that is adjacent to all the other rooms. All the windows are placed in the East direction. The building has a heating system in each room, implemented in TRNSYS 17 by using TESS (Thermal Energy System Specialists) HVAC Library [31]. Two cases have been considered for it: in the first case the system is composed of fan-coil units (denoted as Type 600 block in the software), while in the second case radiators (denoted as Type 1231) are used. To better simulate a retrofitted already existent building, radiators have been employed as heating source. In fact, in many countries such as Italy these are the most common heating sources especially in old houses. The main characteristics of the different parts of the buildings are listed in the Table 2.
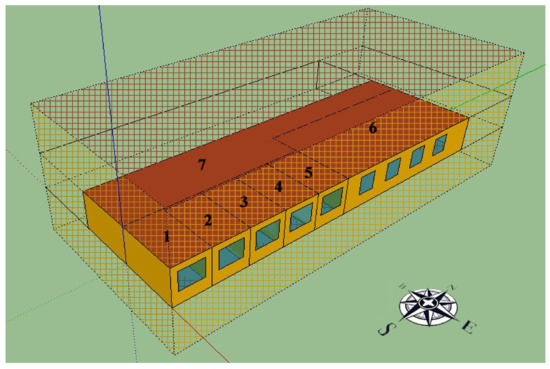
Figure 3.
The seven rooms flat used as a benchmark. The corresponding room number is written in black.

Table 1.
Characteristics of the considered building. Rooms are numbered starting from the most southeastern one and following the anticlockwise direction.

Table 2.
Construction characteristics of the different parts of the building.
6. Illustrative Results
As an illustrative example, we consider the apartment described in Section 5, in this case the model has been previously identified by applying a methodology described in [28]. To obtain a simulation as close as possible to the real case, a user defined set-point signal , one for each room, has been applied to the building. In Table 3 the set-point temperature values for each room and for each time interval of the day are shown. The genetic algorithm implemented in the MATLAB Global Optimization Toolbox (The Mathworks Inc., Natick, MA, USA) has been used for the optimization procedure, with an initial population size of 100 and a maximum number of generations of 300. To practically ensure that a global minimum is achieved, the function tolerance, which determines the termination of the algorithm if the difference between the value of the fitness function from one iteration and the previous one is less than this threshold, has been selected equal to .

Table 3.
Set-point values selected by the user for each room for one day.
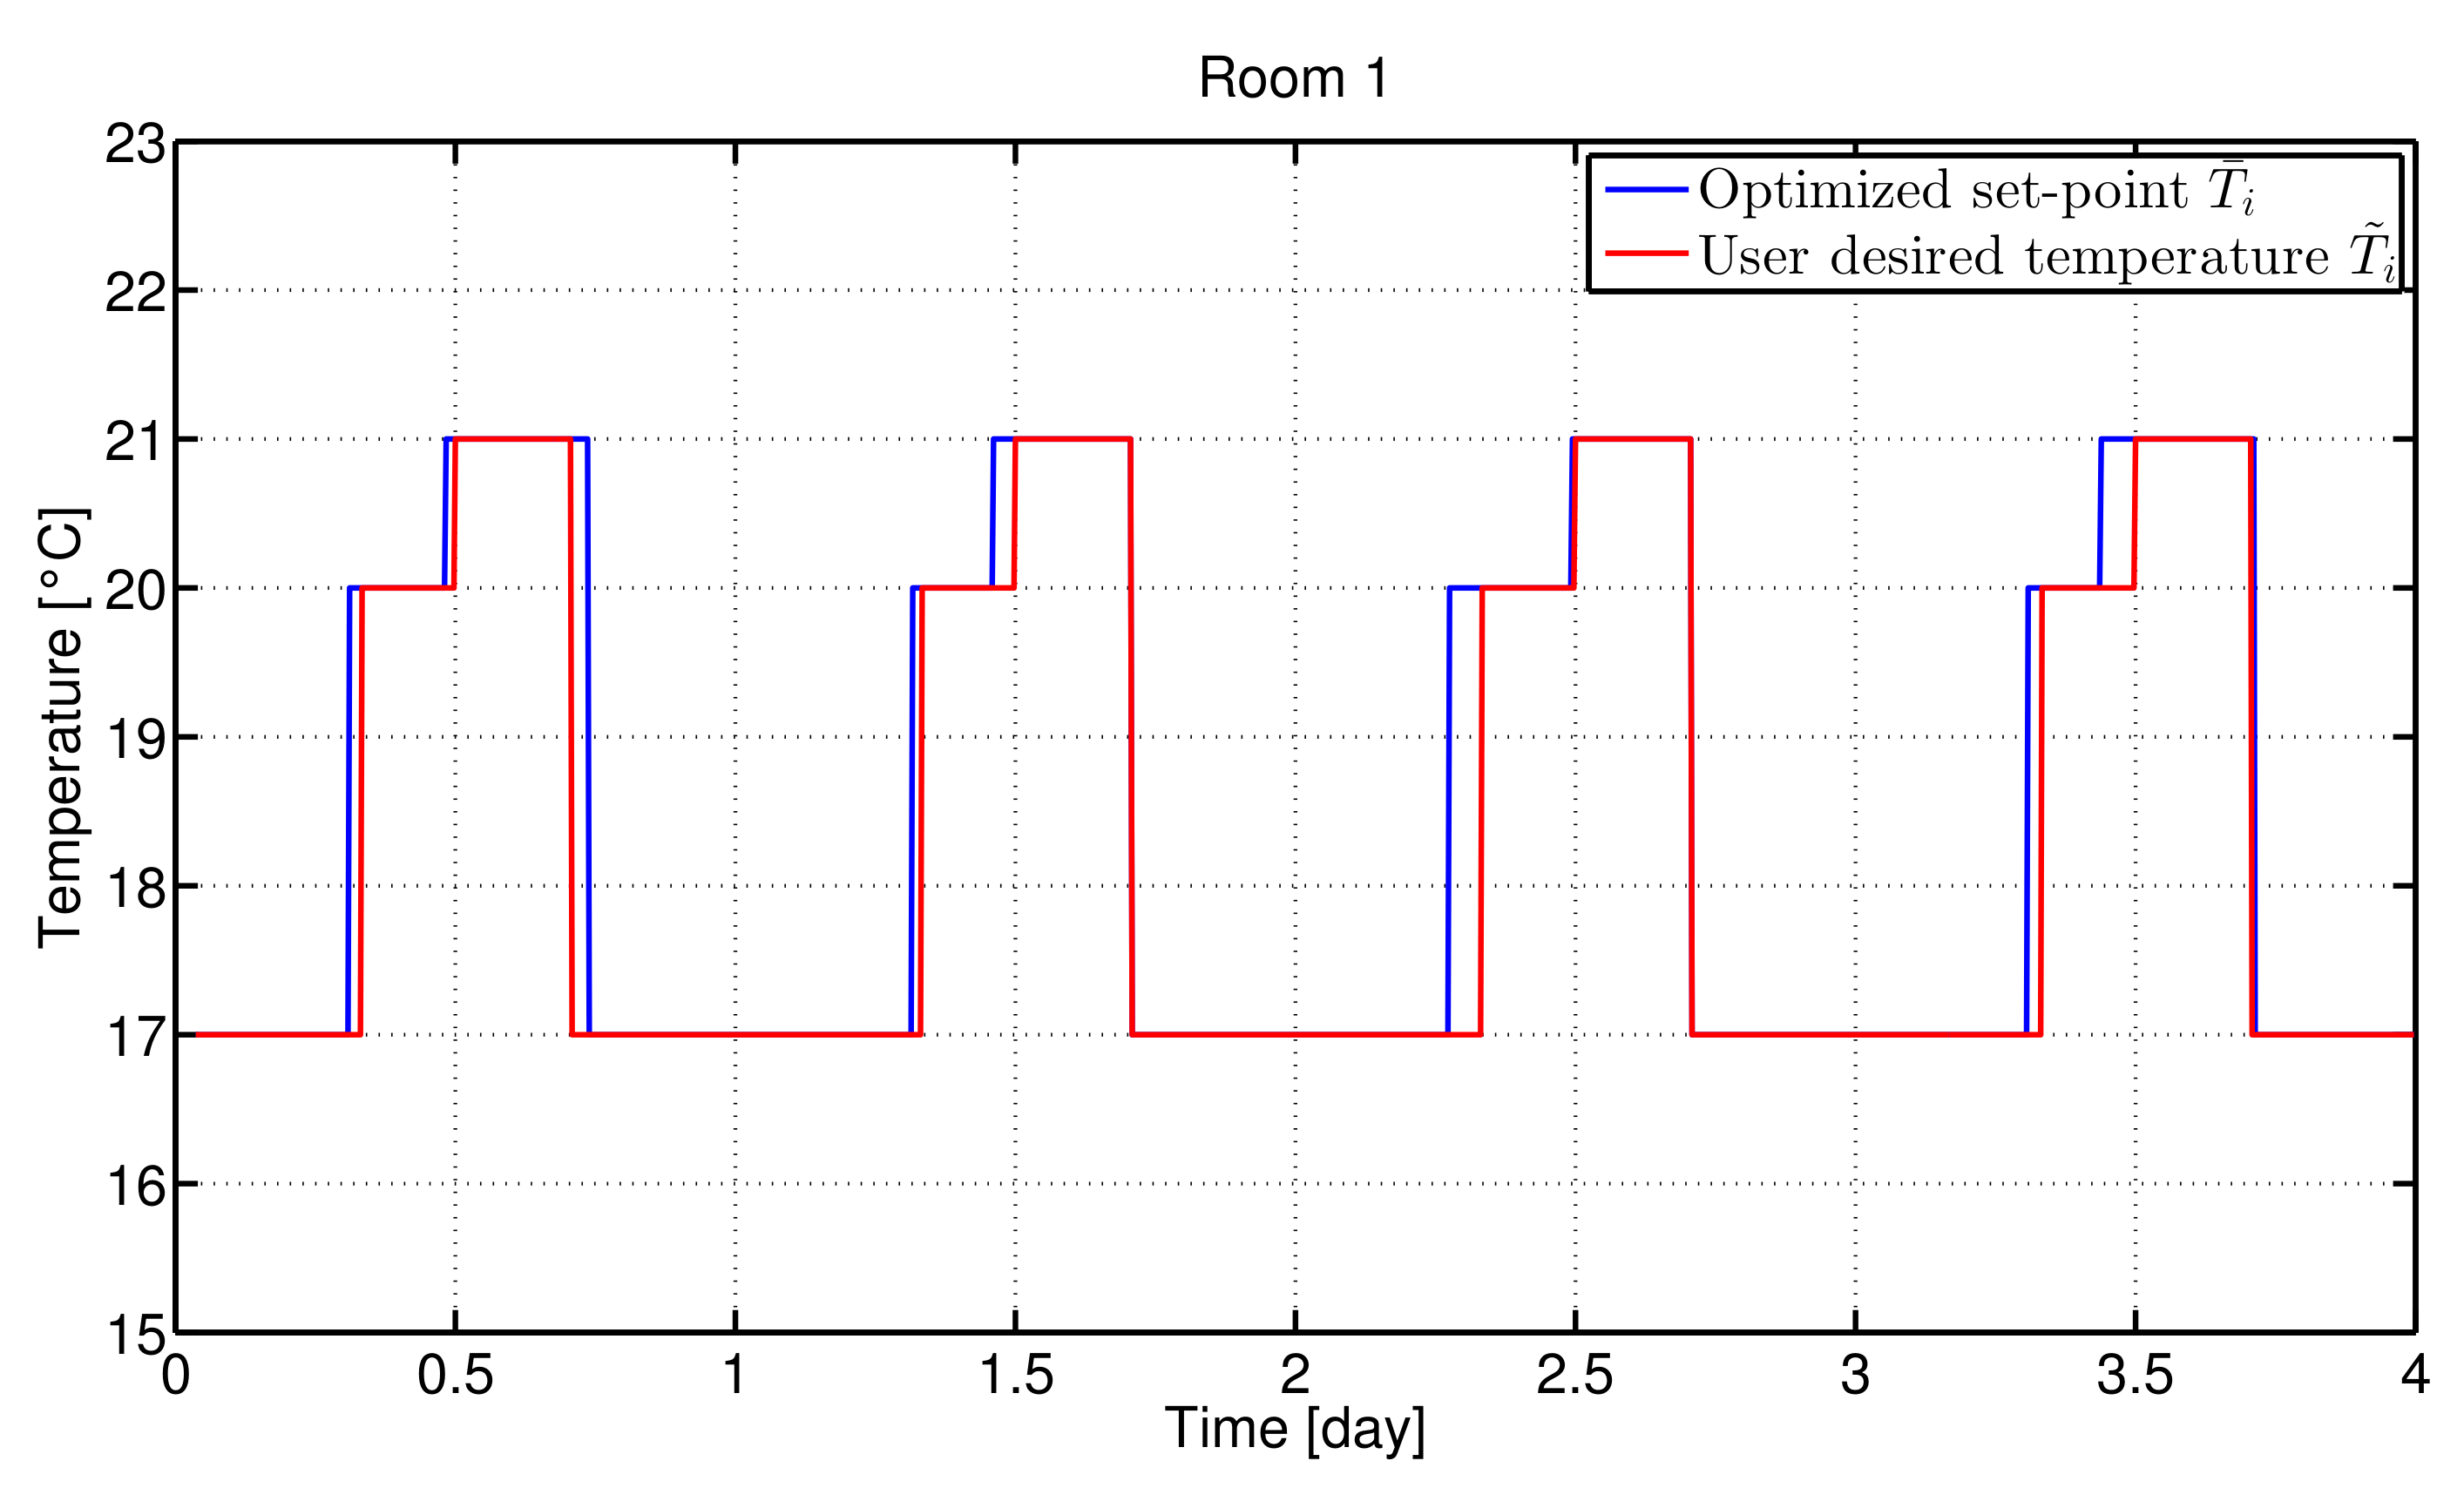
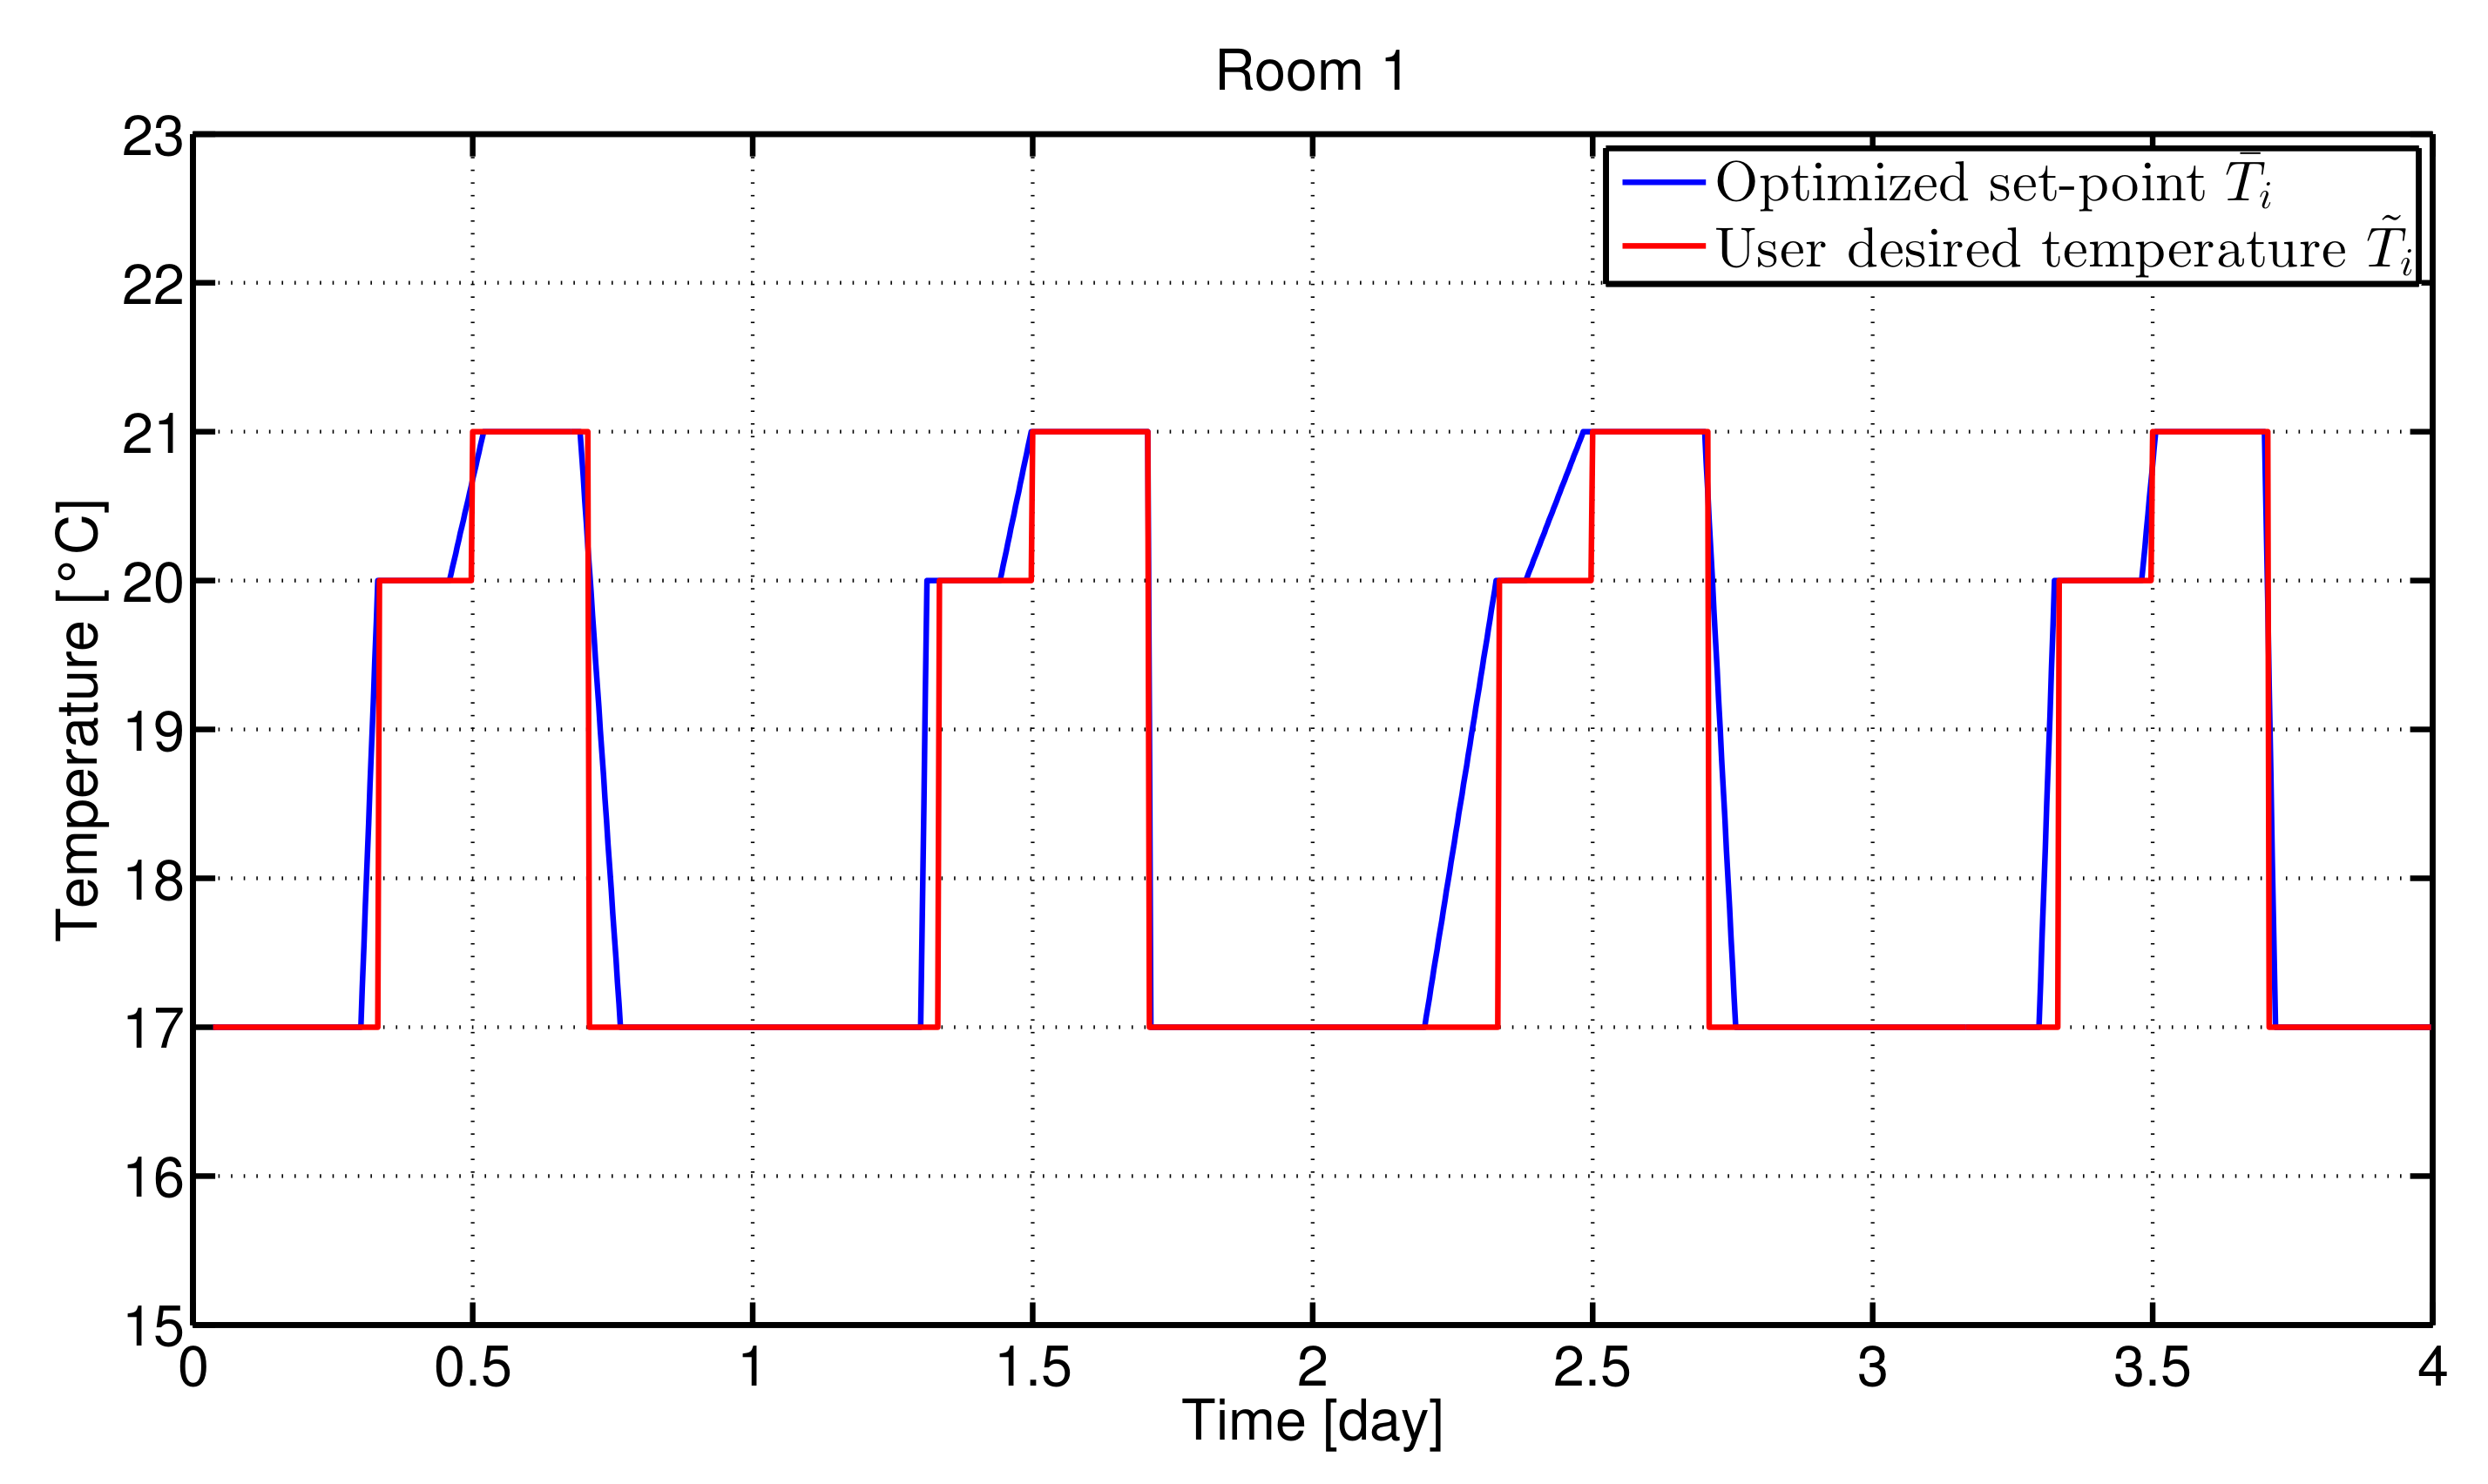
As a first illustrative result, Figure 4 and Figure 5 show the set-point signal, for room 1 of the considered apartment, resulting from the optimization for a simulation of four days, starting from 15 November to 18 November. In particular, Figure 4 shows the results when the set-point value can change as a step signal, while Figure 5 shows the same example where the optimized set-point signal can change as a ramp. In both cases fan-coil units have been used. The optimization for each day is performed during the night, starting at midnight. In case the weather forecasts of the subsequent day are not available, the external temperature and solar radiation data of the previous day are used as exogenous inputs, by assuming that the environmental conditions are similar from one day to the following one (for this reason, results are different from one day to another one). Please note that, in case of step signals, the computational time for the optimization is about 700 [s] while in case of ramp signals it is 1200 [s], as in this case more parameters must be optimized. The developed approach can be considered as a centralized optimization, in fact it takes into account the building from a global point of view instead of a single subsystem. It is important to stress that a set of optimal set-point signals determined by decentralized algorithms can be different from a set determined by a global optimization, due to the thermal coupling between adjacent areas. As it can be expected, the set-point step (or ramp) signals are applied before the temperature change selected by the user to obtain the required temperature at the required time.
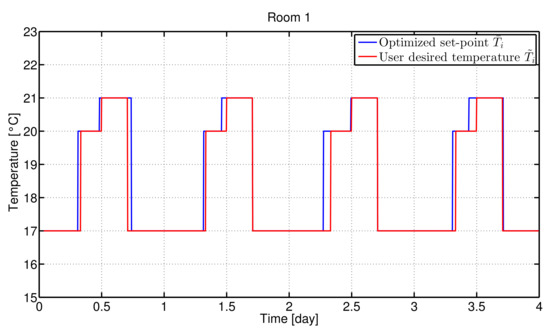
Figure 4.
Four days simulation, from 15 November to 18 November, and optimal set-point signal planning, in case the optimized set point can change as a step signal. Red line: user defined set-point signal. Blue line: optimal set-point signal obtained by the genetic algorithm.
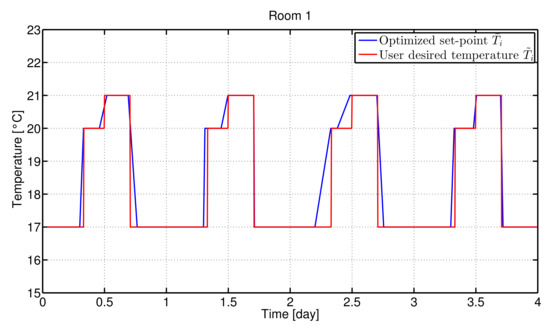
Figure 5.
Four days simulation, from 15 November to 18 November, and optimal set-point signal planning, in case the optimized set point can change as a ramp signal. Red line: user defined set-point signal. Blue line: optimal set-point signal obtained by the genetic algorithm.
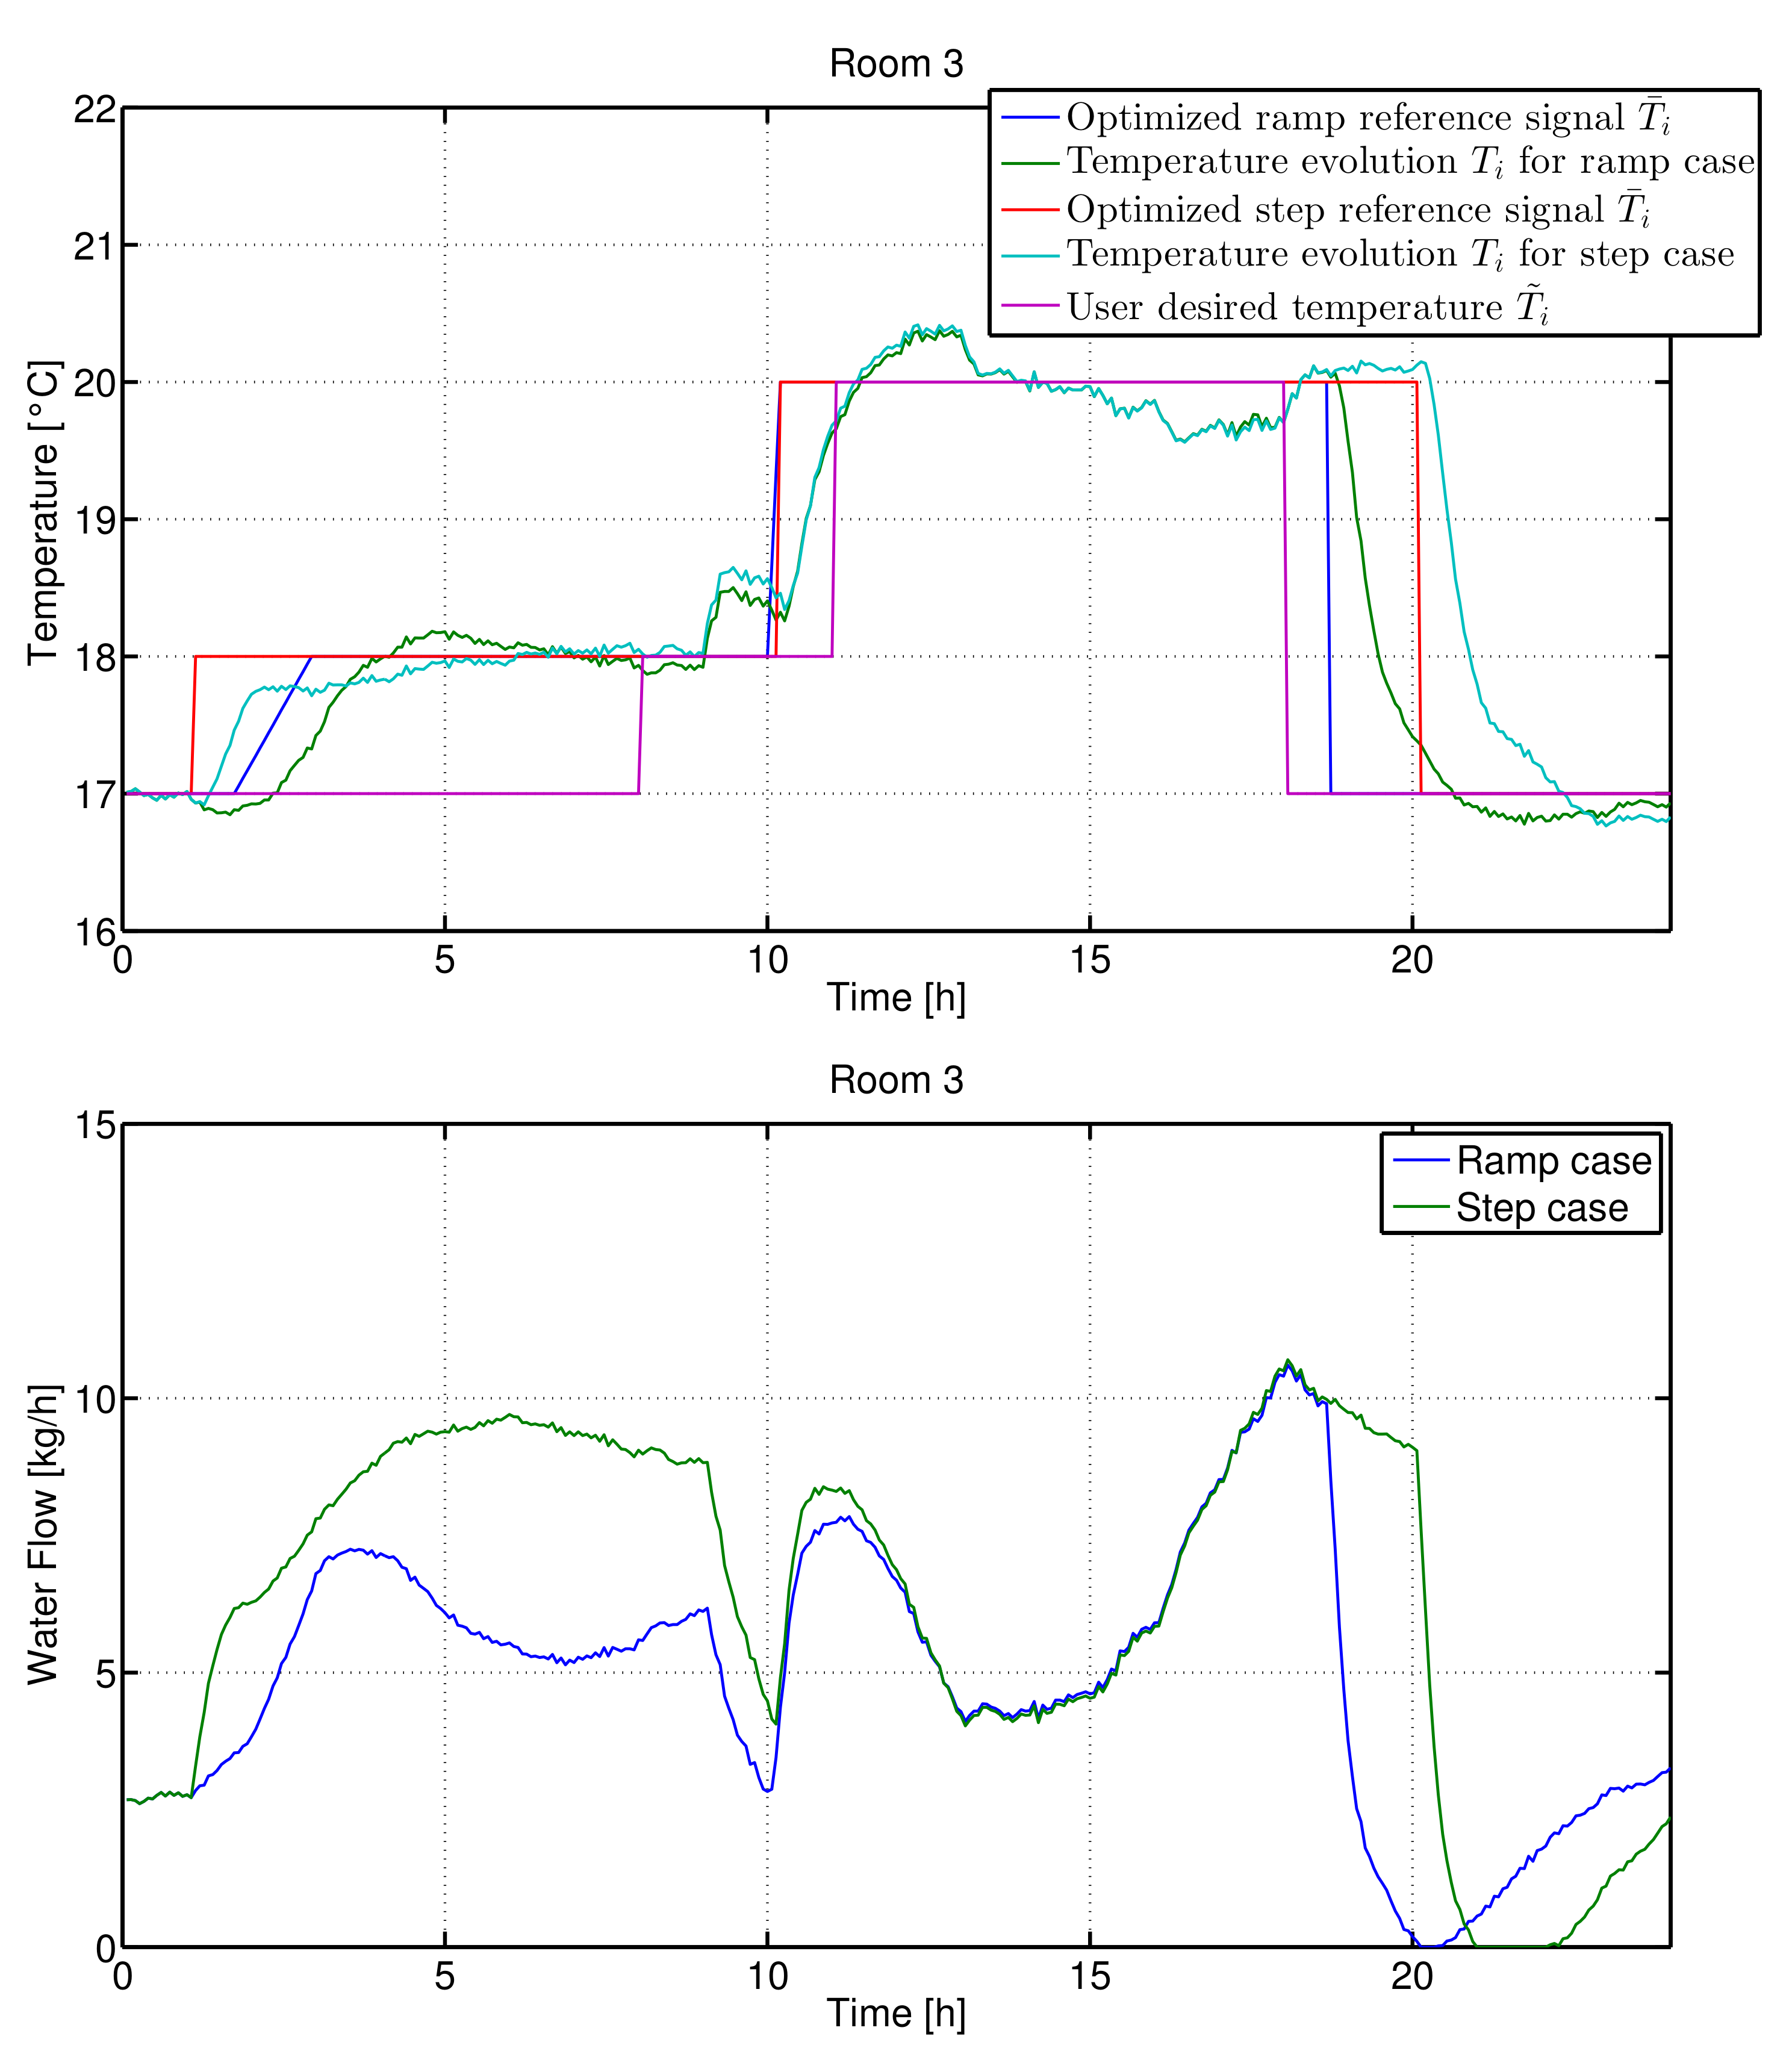
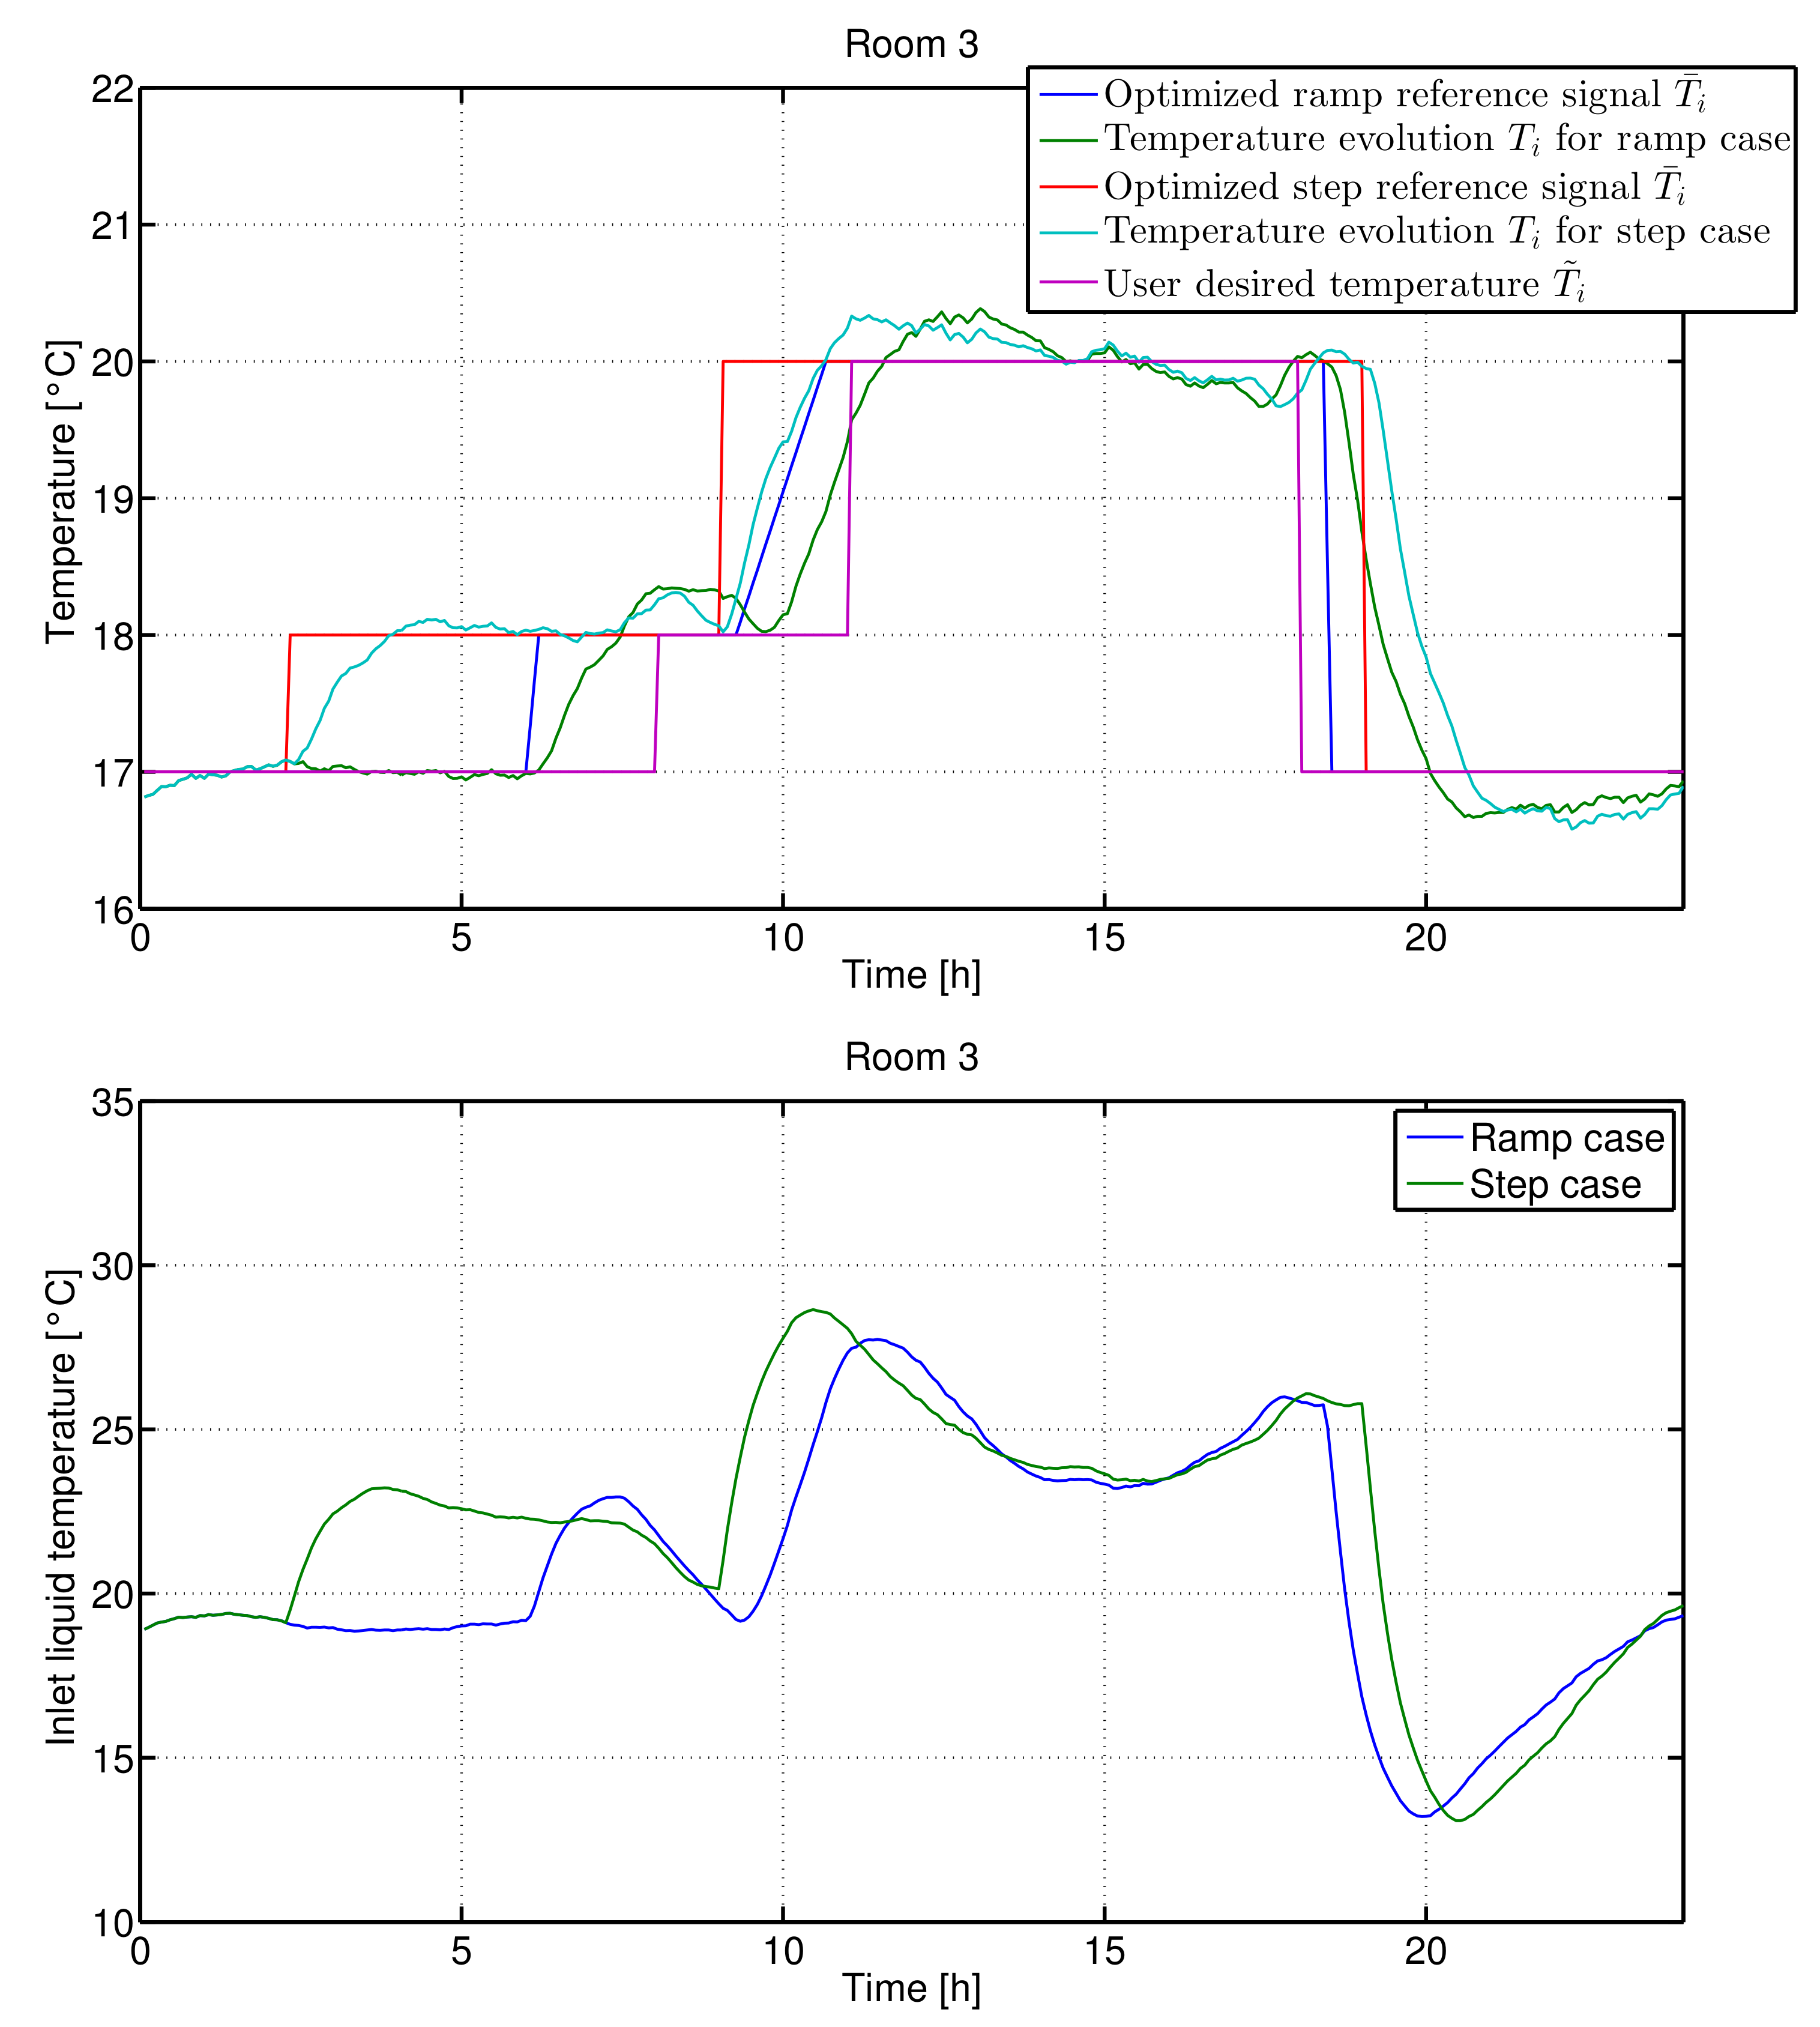
A detail of the results related to a single day (5 December) for room 3 (considered as illustrative example) is shown in Figure 6, for radiators. Analogously, results related to the fan-coil system is shown in Figure 7 for the same room 3. Please note that these results have been obtained by applying the obtained set-point signals directly to the ARMAX model. As it is possible to see, both step and ramp set-point signals can fulfill the user comfort requirements. Indeed, the actual temperature inside a specific room is never more than 0.5 [] less than the required value in a given time instant. When radiators are present, the use of ramp signals for the set-point variation (which are more general than step ones) allows a significant decrement of the energy consumption with respect to step signals, as it is shown, for the considered day, in Table 4. Indeed, the total energy in the case of ramps is approximately 13% less than the case of steps. The energy saving obtained by using ramps instead of steps is less significant in case of the use of fan-coil units, as it is shown in Table 5. This is actually an expected result as the fan-coil units allow the temperature to increase more rapidly in a room.
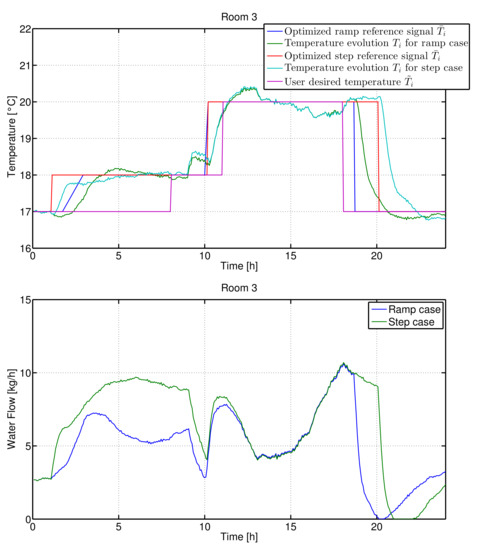
Figure 6.
Results obtained by simulating the ARMAX model of room 3 with radiators for one day, 5 December.
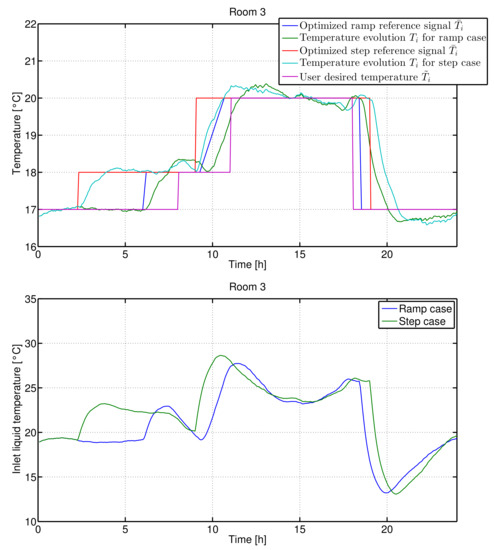
Figure 7.
Results obtained by simulating the ARMAX model of room 3 with fan-coil units for one day, 5 December.

Table 4.
Radiators performance index value (4) for both step and ramp set-point signals determined by the genetic algorithm (5 December).

Table 5.
Fan-coil performance index value (4) for both step and ramp set-point signals determined by the genetic algorithm (5 December).
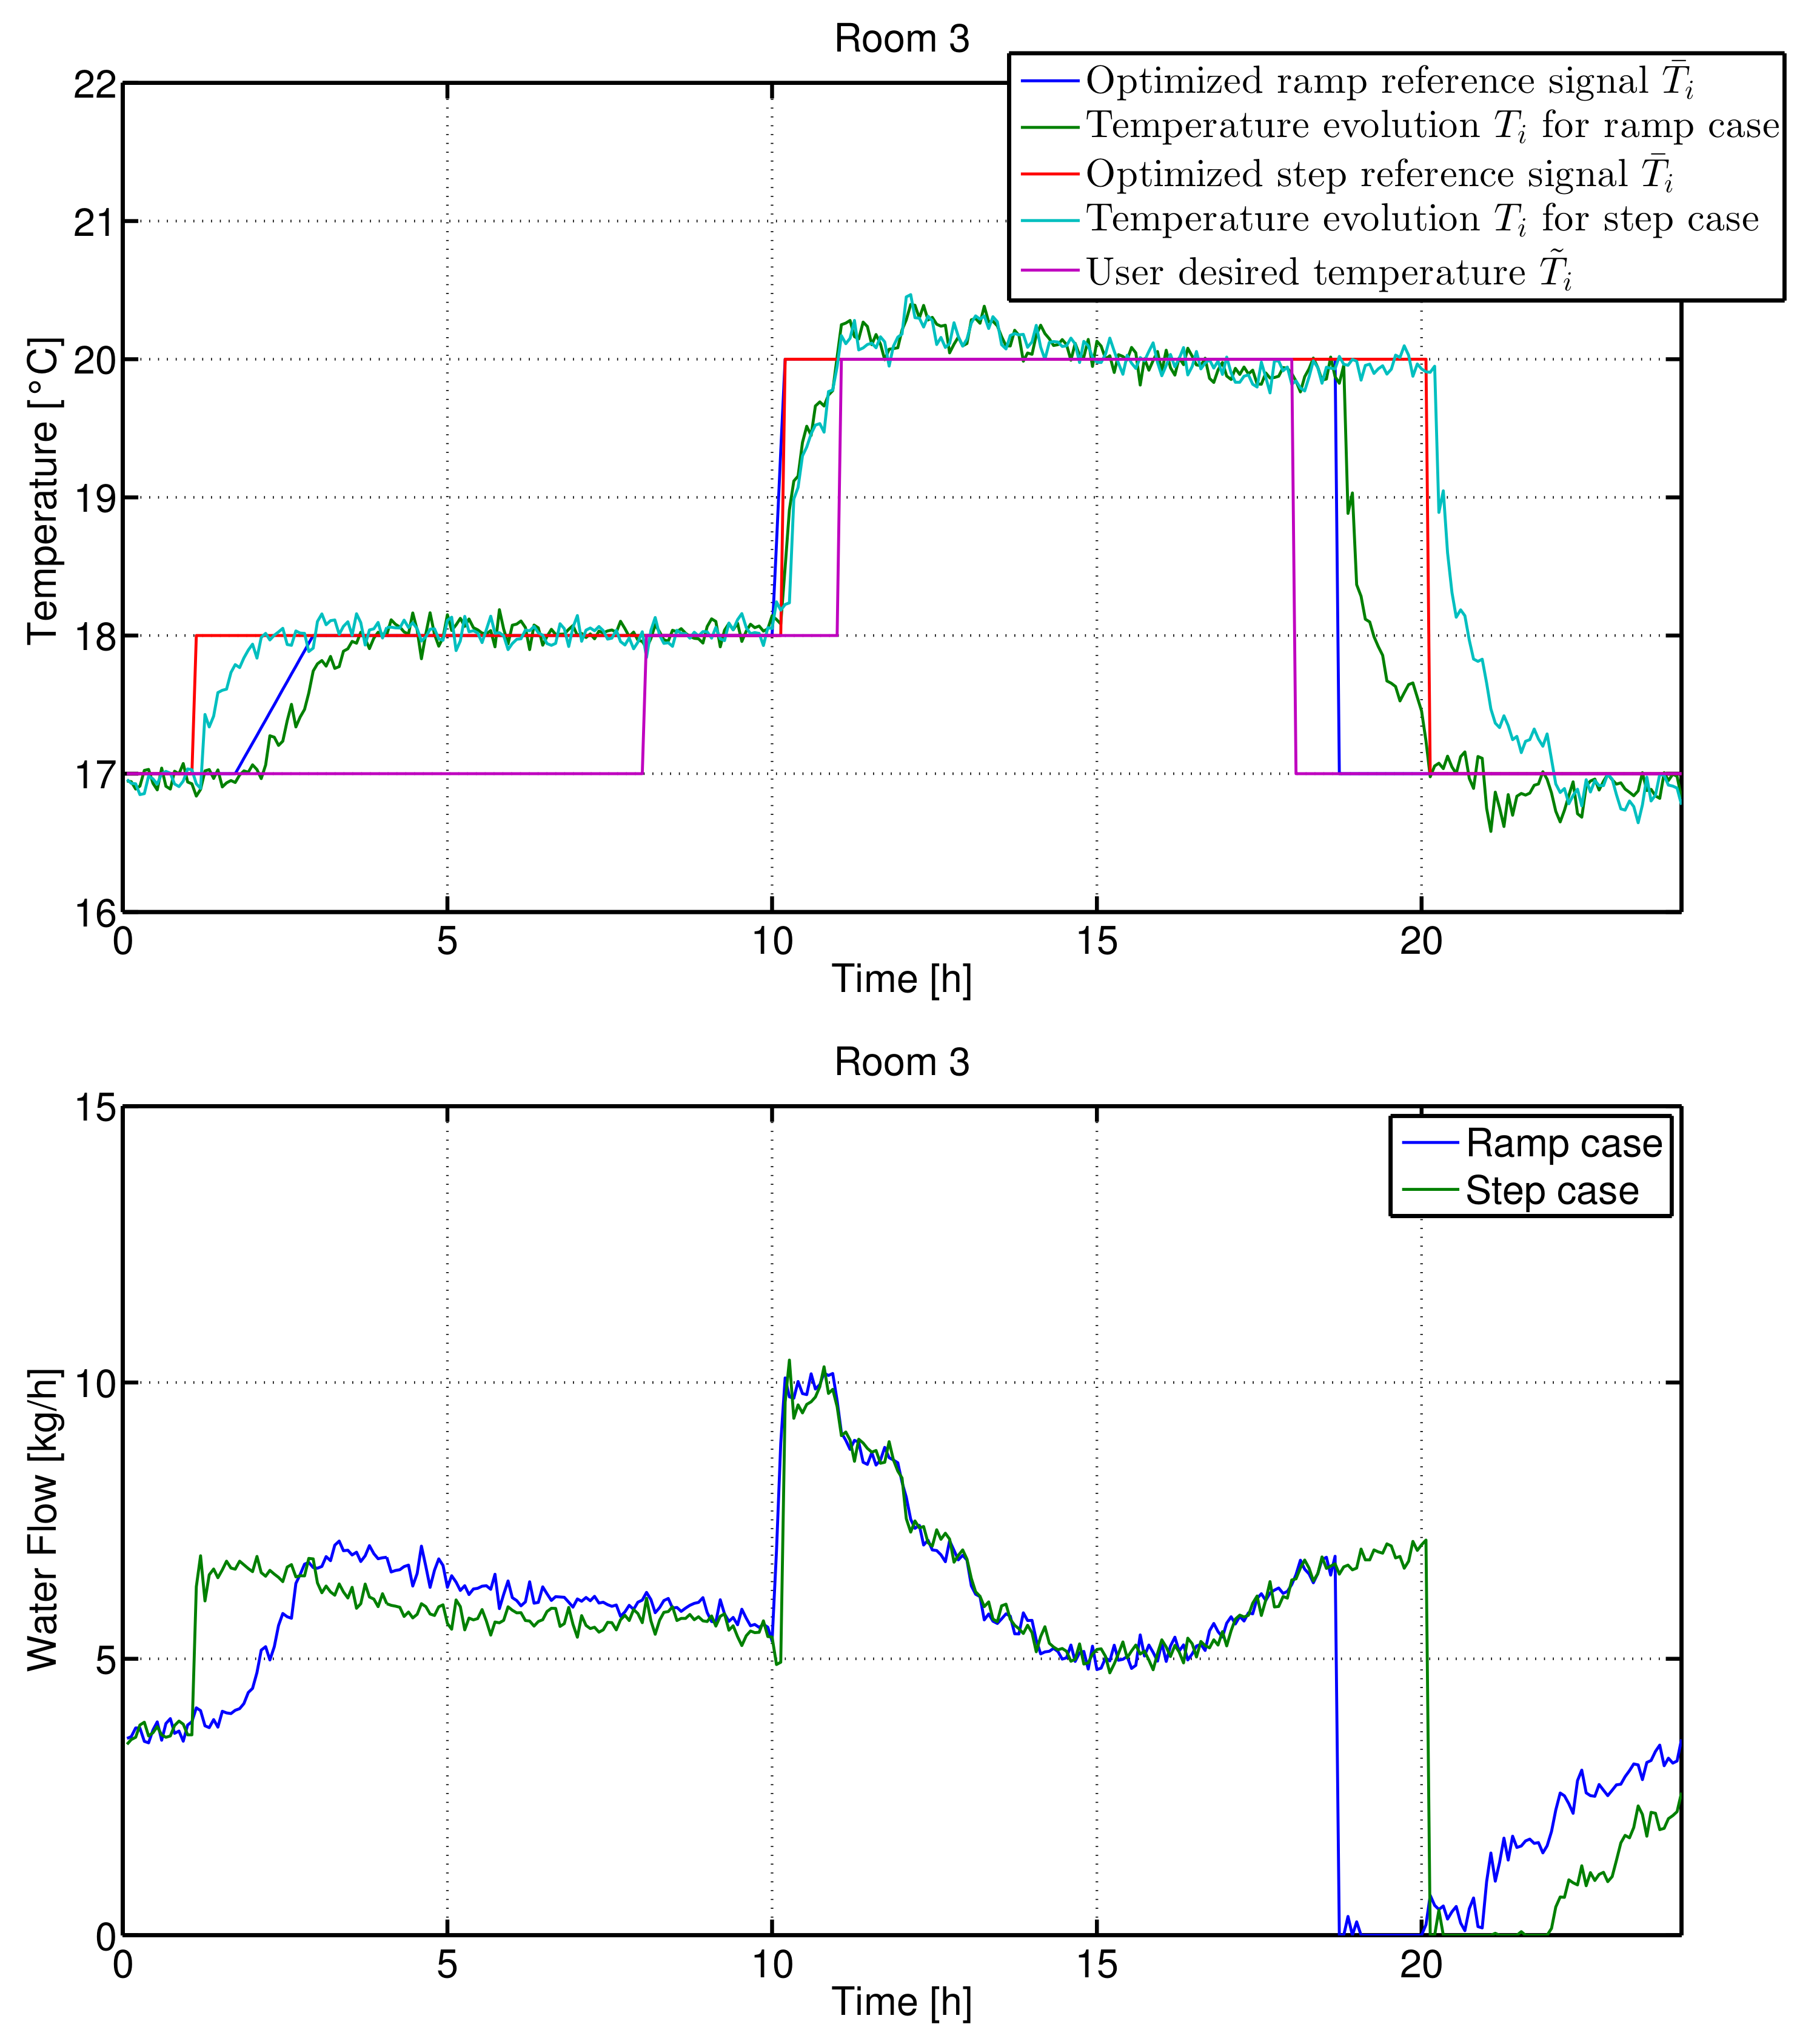
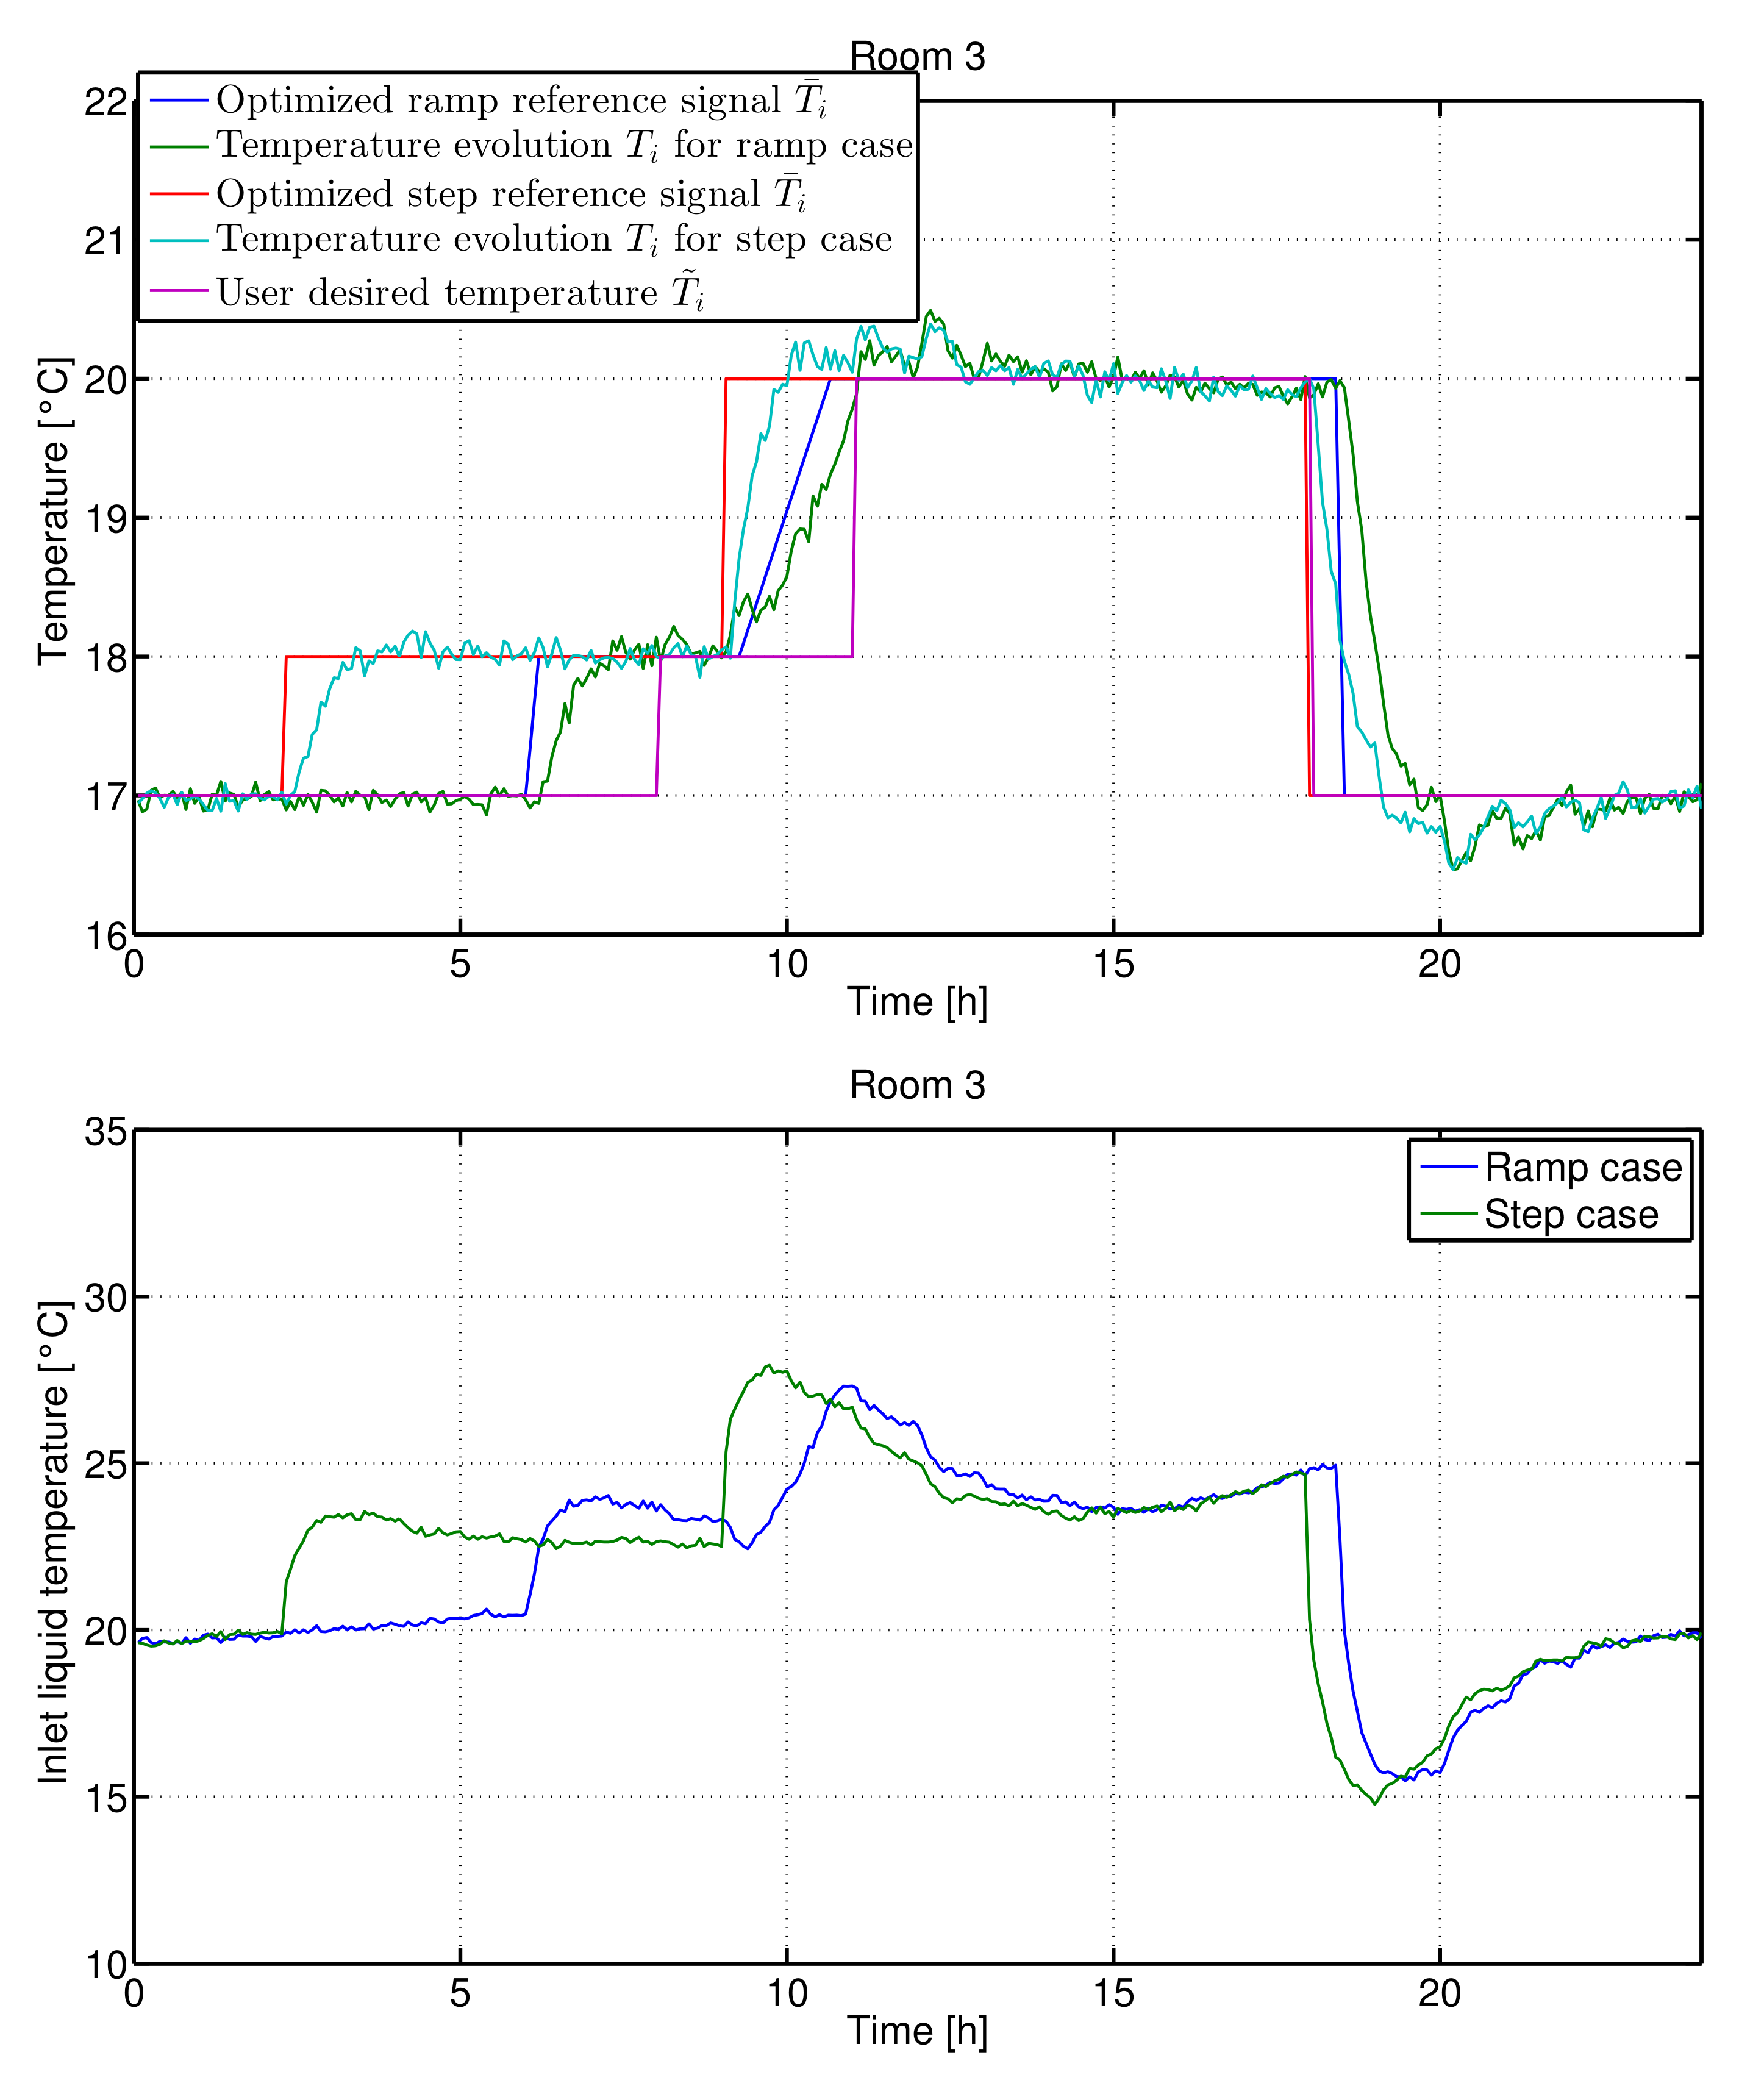
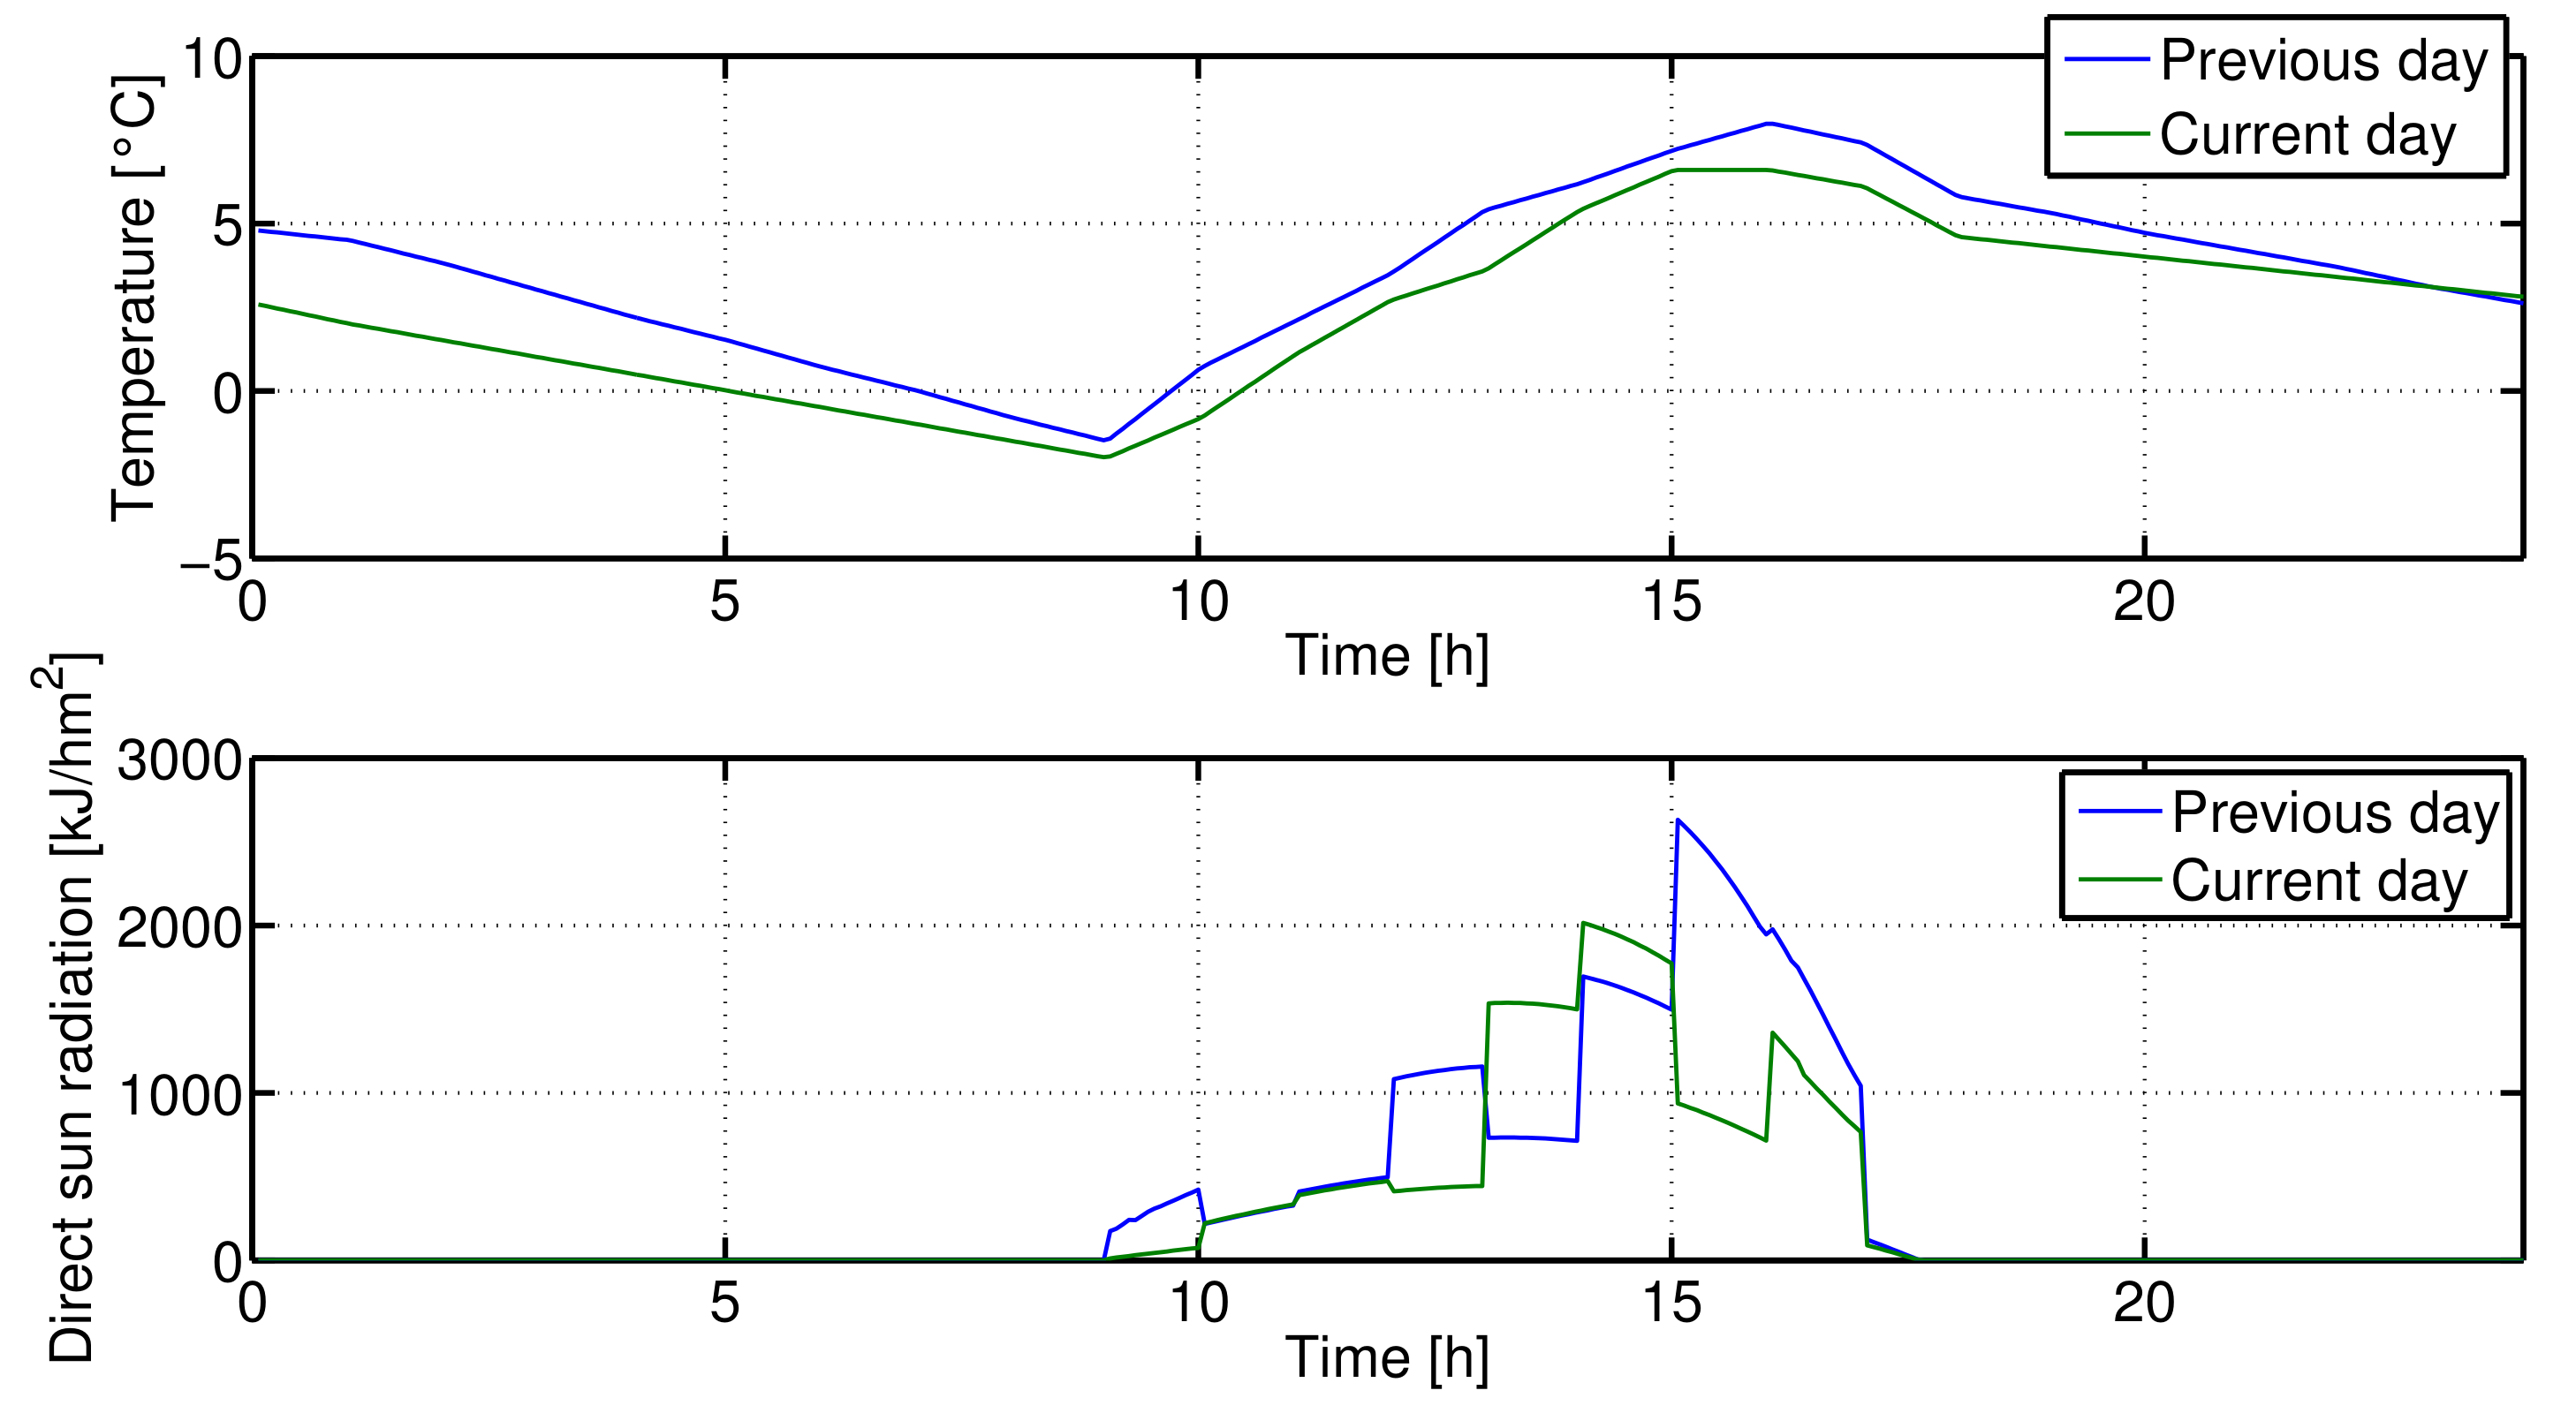
Results obtained by applying the determined set-point signals to the building model developed with TRNSYS (that is, with the model of the system that takes into account all the thermodynamics aspects) are shown in Figure 8 for the case of radiators and in Figure 9 for the case of fan-coil units, again for room 3. It appears that results are comparable to those obtained with the ARMAX model, which further proves the effectiveness of the linear modelling technique. The total energy consumption in case of TRNSYS model is summarized in Table 6 and Table 7. Therein, two cases are considered: (i) the case where the weather forecasts are not available and therefore, the weather conditions of the day before are applied directly in the optimization procedure; (ii) the case where the weather conditions are supposed to be known. To analyze better the results, the external temperature and the solar radiation in the two days considered (the one used for the optimization and the one for the day where the optimized set-point is applied) are plotted in Figure 10.
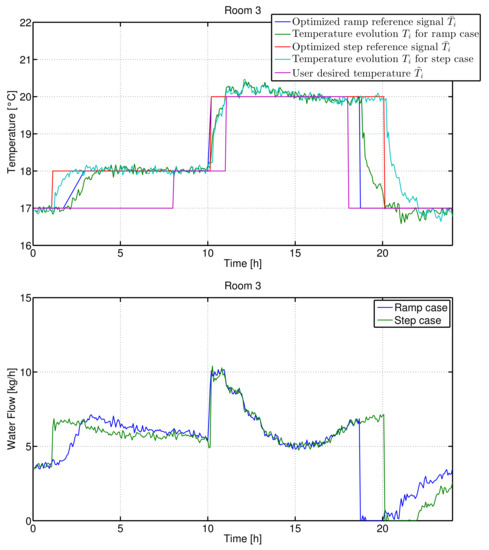
Figure 8.
Results obtained by simulating the TRNSYS model of room 3 with radiators for one day, 5 December.
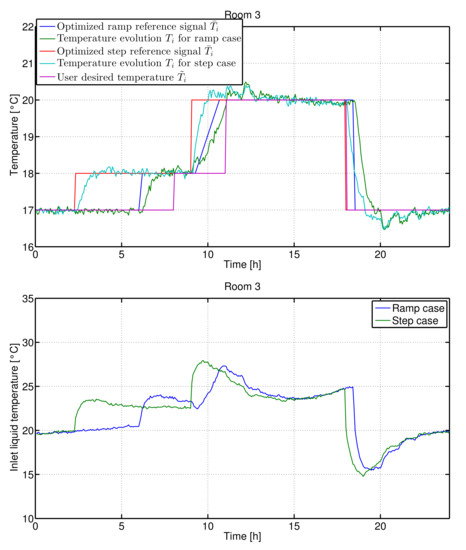
Figure 9.
Results obtained by simulating the TRNSYS model of room 3 with fan-coil units for one day, 5 December.

Table 6.
Performance index value (4) for radiators in both step and ramp case evaluated by applying the optimal set-point signals with the TRNSYS model using weather conditions of the previous days (4 December, i.e., those used by the genetic algorithm) and of the current day (5 December).

Table 7.
Performance index value (4) for fan-coil units in both step and ramp case evaluated by applying the optimal set-point signals with the TRNSYS model using weather conditions of the previous days (4 December, i.e., those used by the genetic algorithm) and of the current day (5 December).
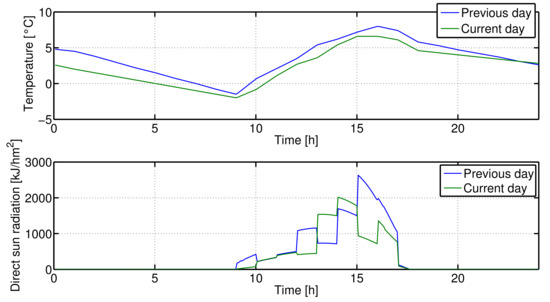
Figure 10.
External temperature and solar radiation in the two days considered for the simulation results, 4–5 December. Blue line: previous day. Green line: current day.
Also, these results confirm that, with fan-coil actuators, the use of ramp set-point signals does not provide a very significant improvement and, to save computation time, it is sufficient to calculate the time instants where the set-point steps must be applied to the control system to meet the user requirements.
7. Unoccupied Room Case
After the analysis presented in the previous sections, another important aspect will be investigated hereafter. Actually, in many (residential) buildings, there are rooms that are not occupied for long time intervals and for these time intervals there is not a desired temperature .
Thus, the problem of managing the temperature of unoccupied rooms (that is, managing an intermittent use of some rooms) must be faced during the optimization, by assuming that the occupation schedule for a given day is known a priori. In fact, due to the existence of the thermal coupling between adjacent areas it is not always true that the minimization of the energy consumption is obtained by just switching off the heating system in the unoccupied rooms.
For this purpose, the temperature set-point in a room in a time interval when it is not occupied (that is, when the user has not specified a desired temperature value), must be inserted into the optimization search space.
As an illustrative example, we consider again the building of Section 5 on 5 December, where the scheduling of Table 3 has been applied but in this case the set-point values of rooms 2, 3 and 5 are not defined from 6:00 a.m. to 12:00 a.m.
We consider only the case of ramp signals with radiators, because this is the most interesting case, as it turns out from the analysis of the previous section.
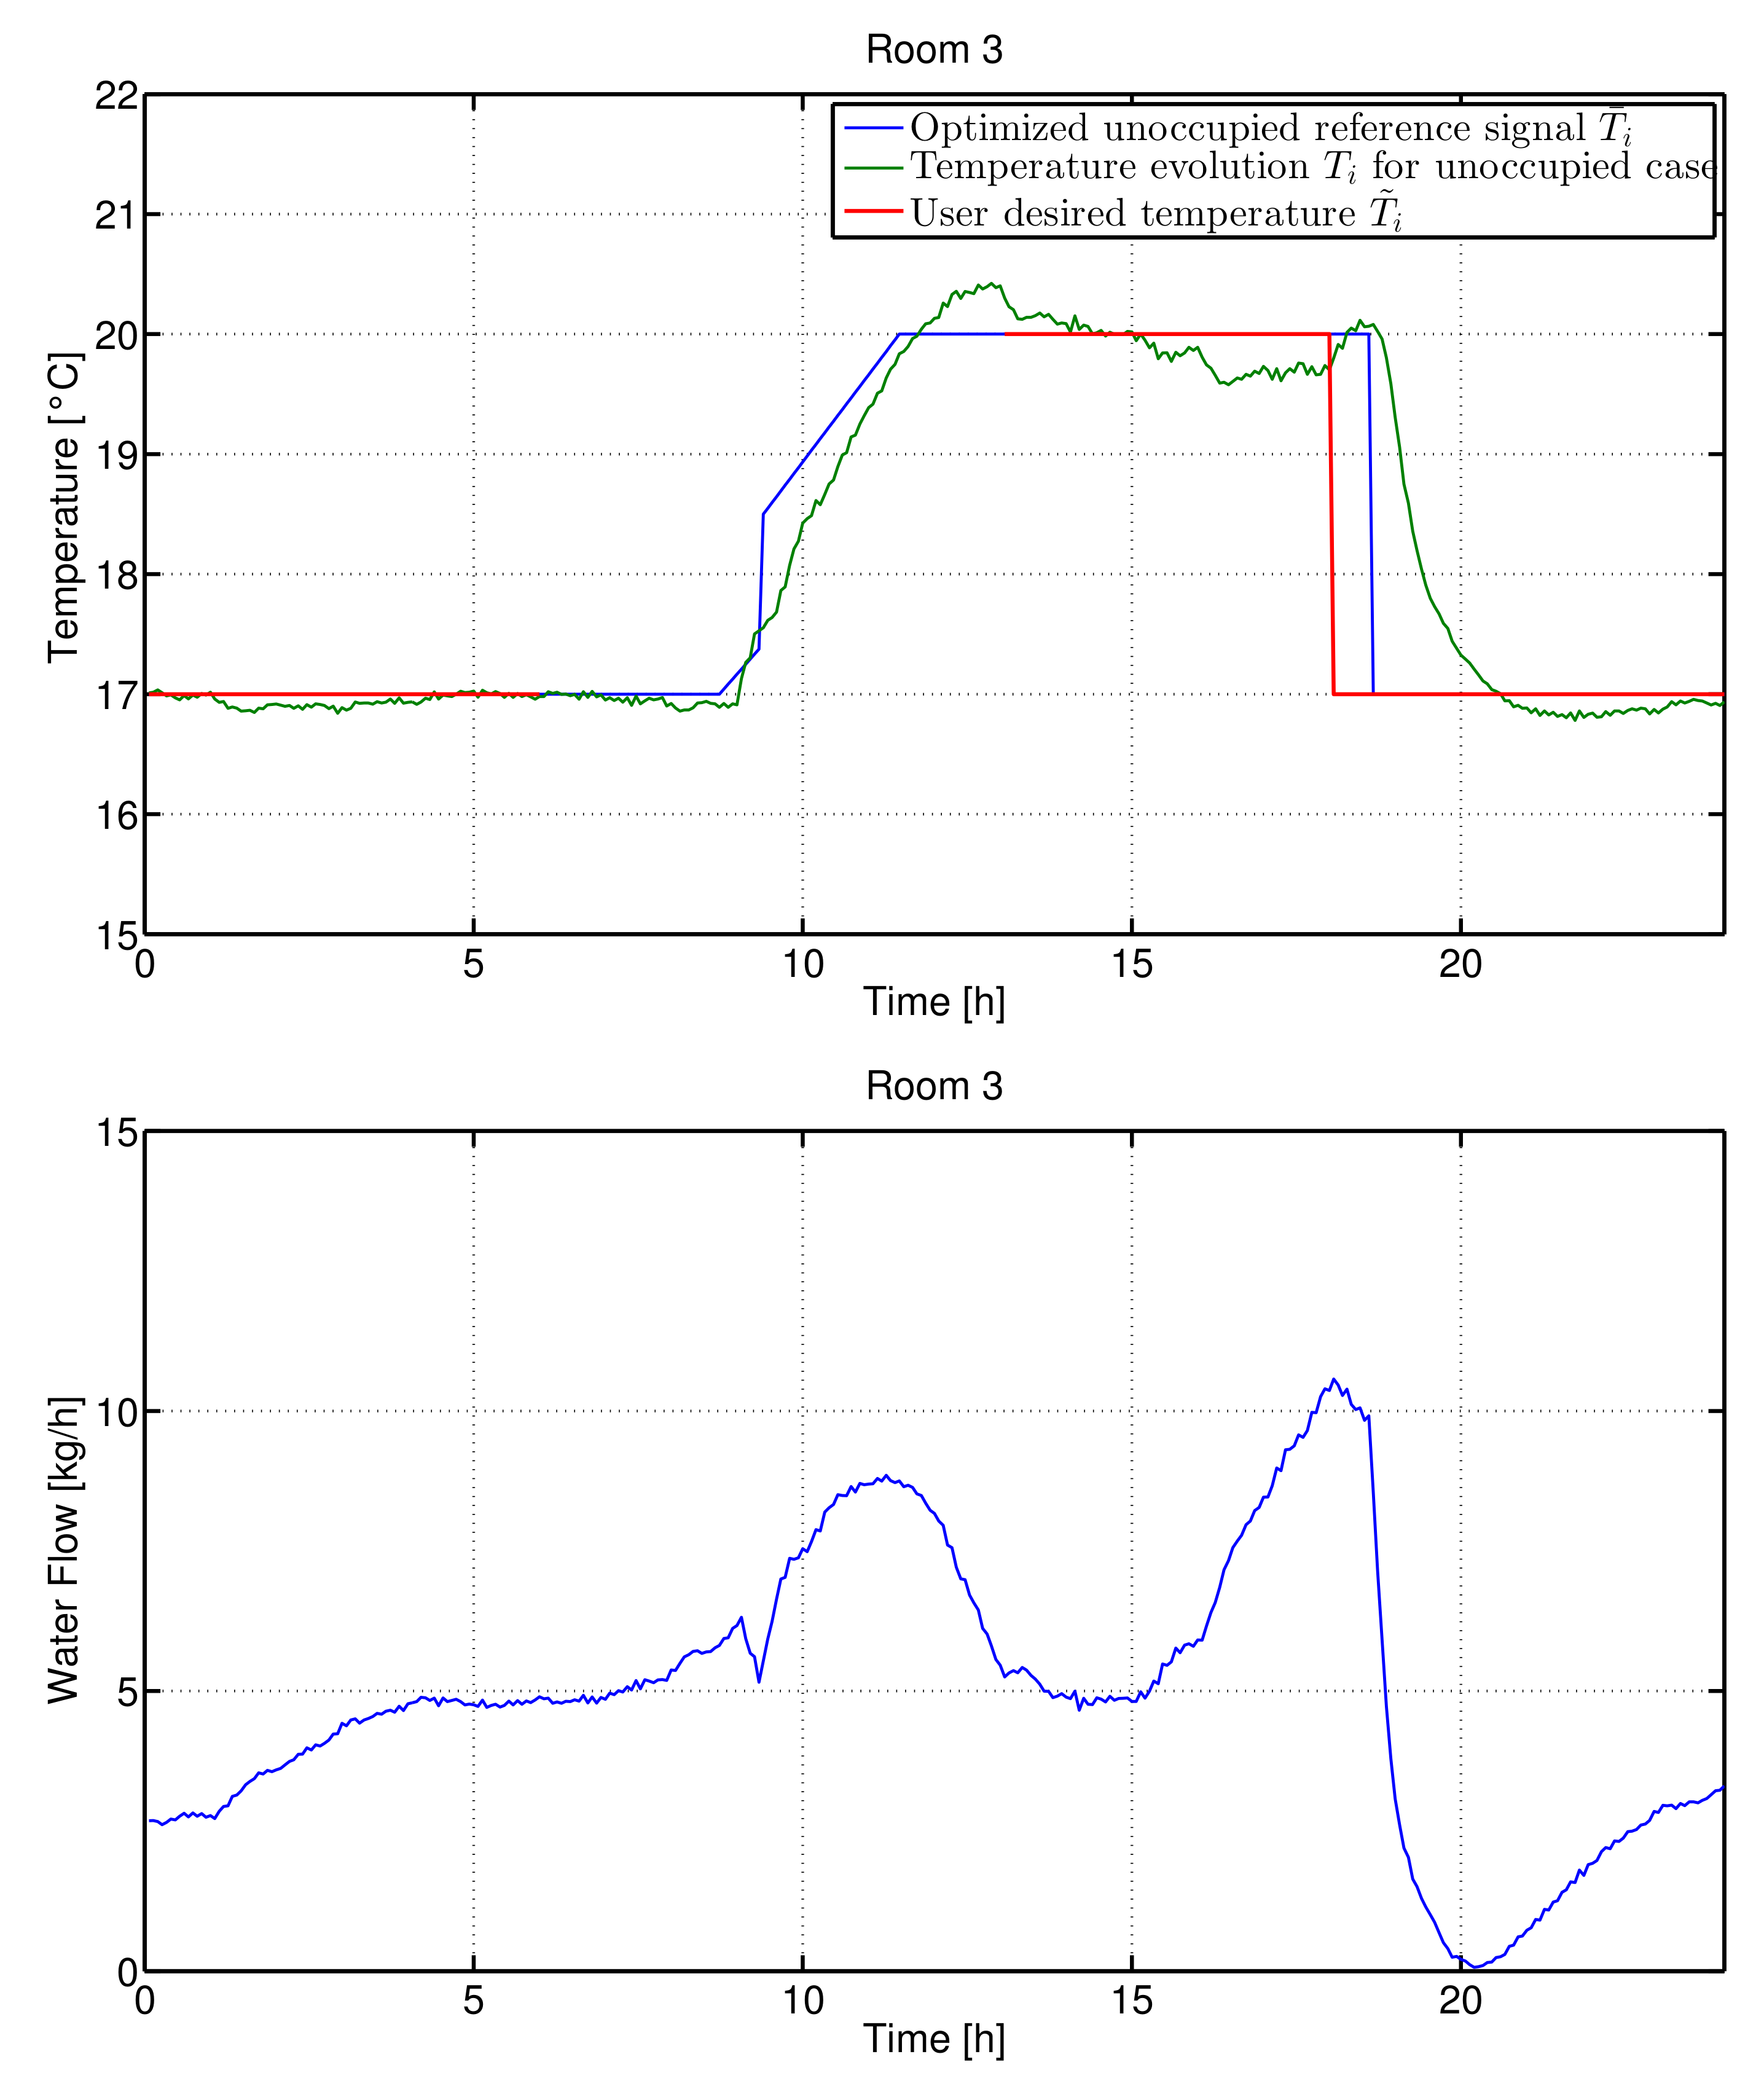
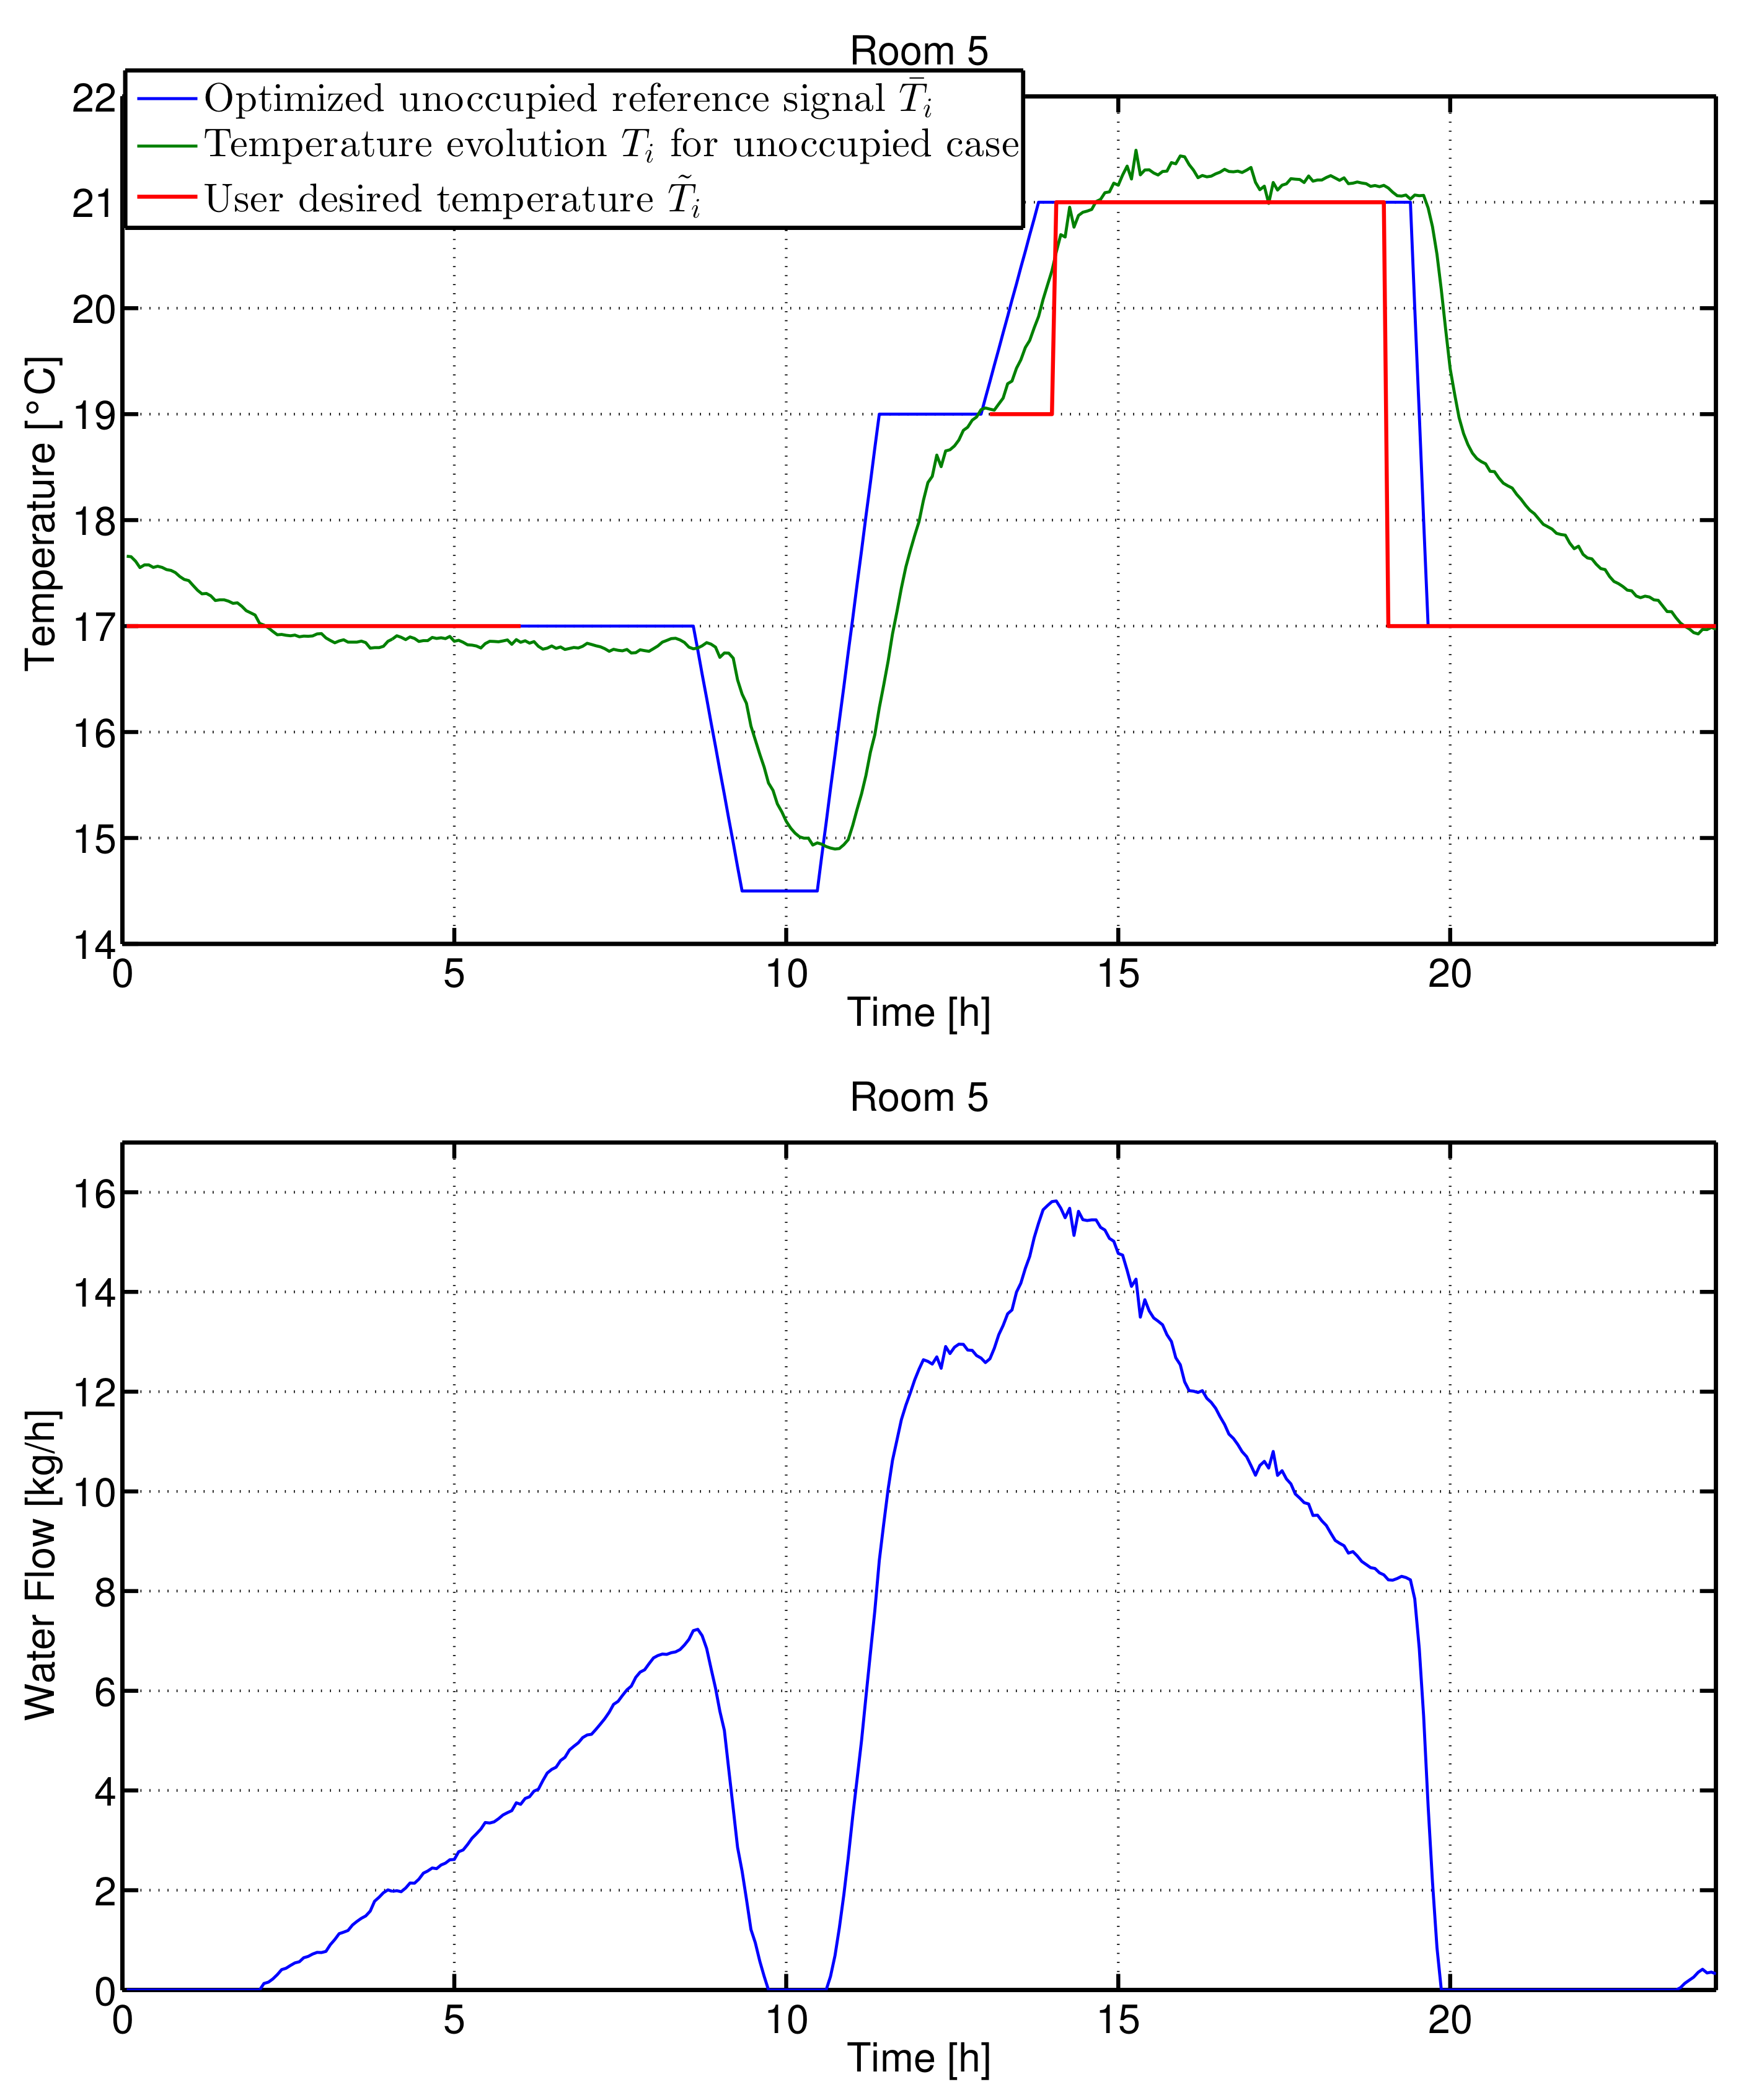
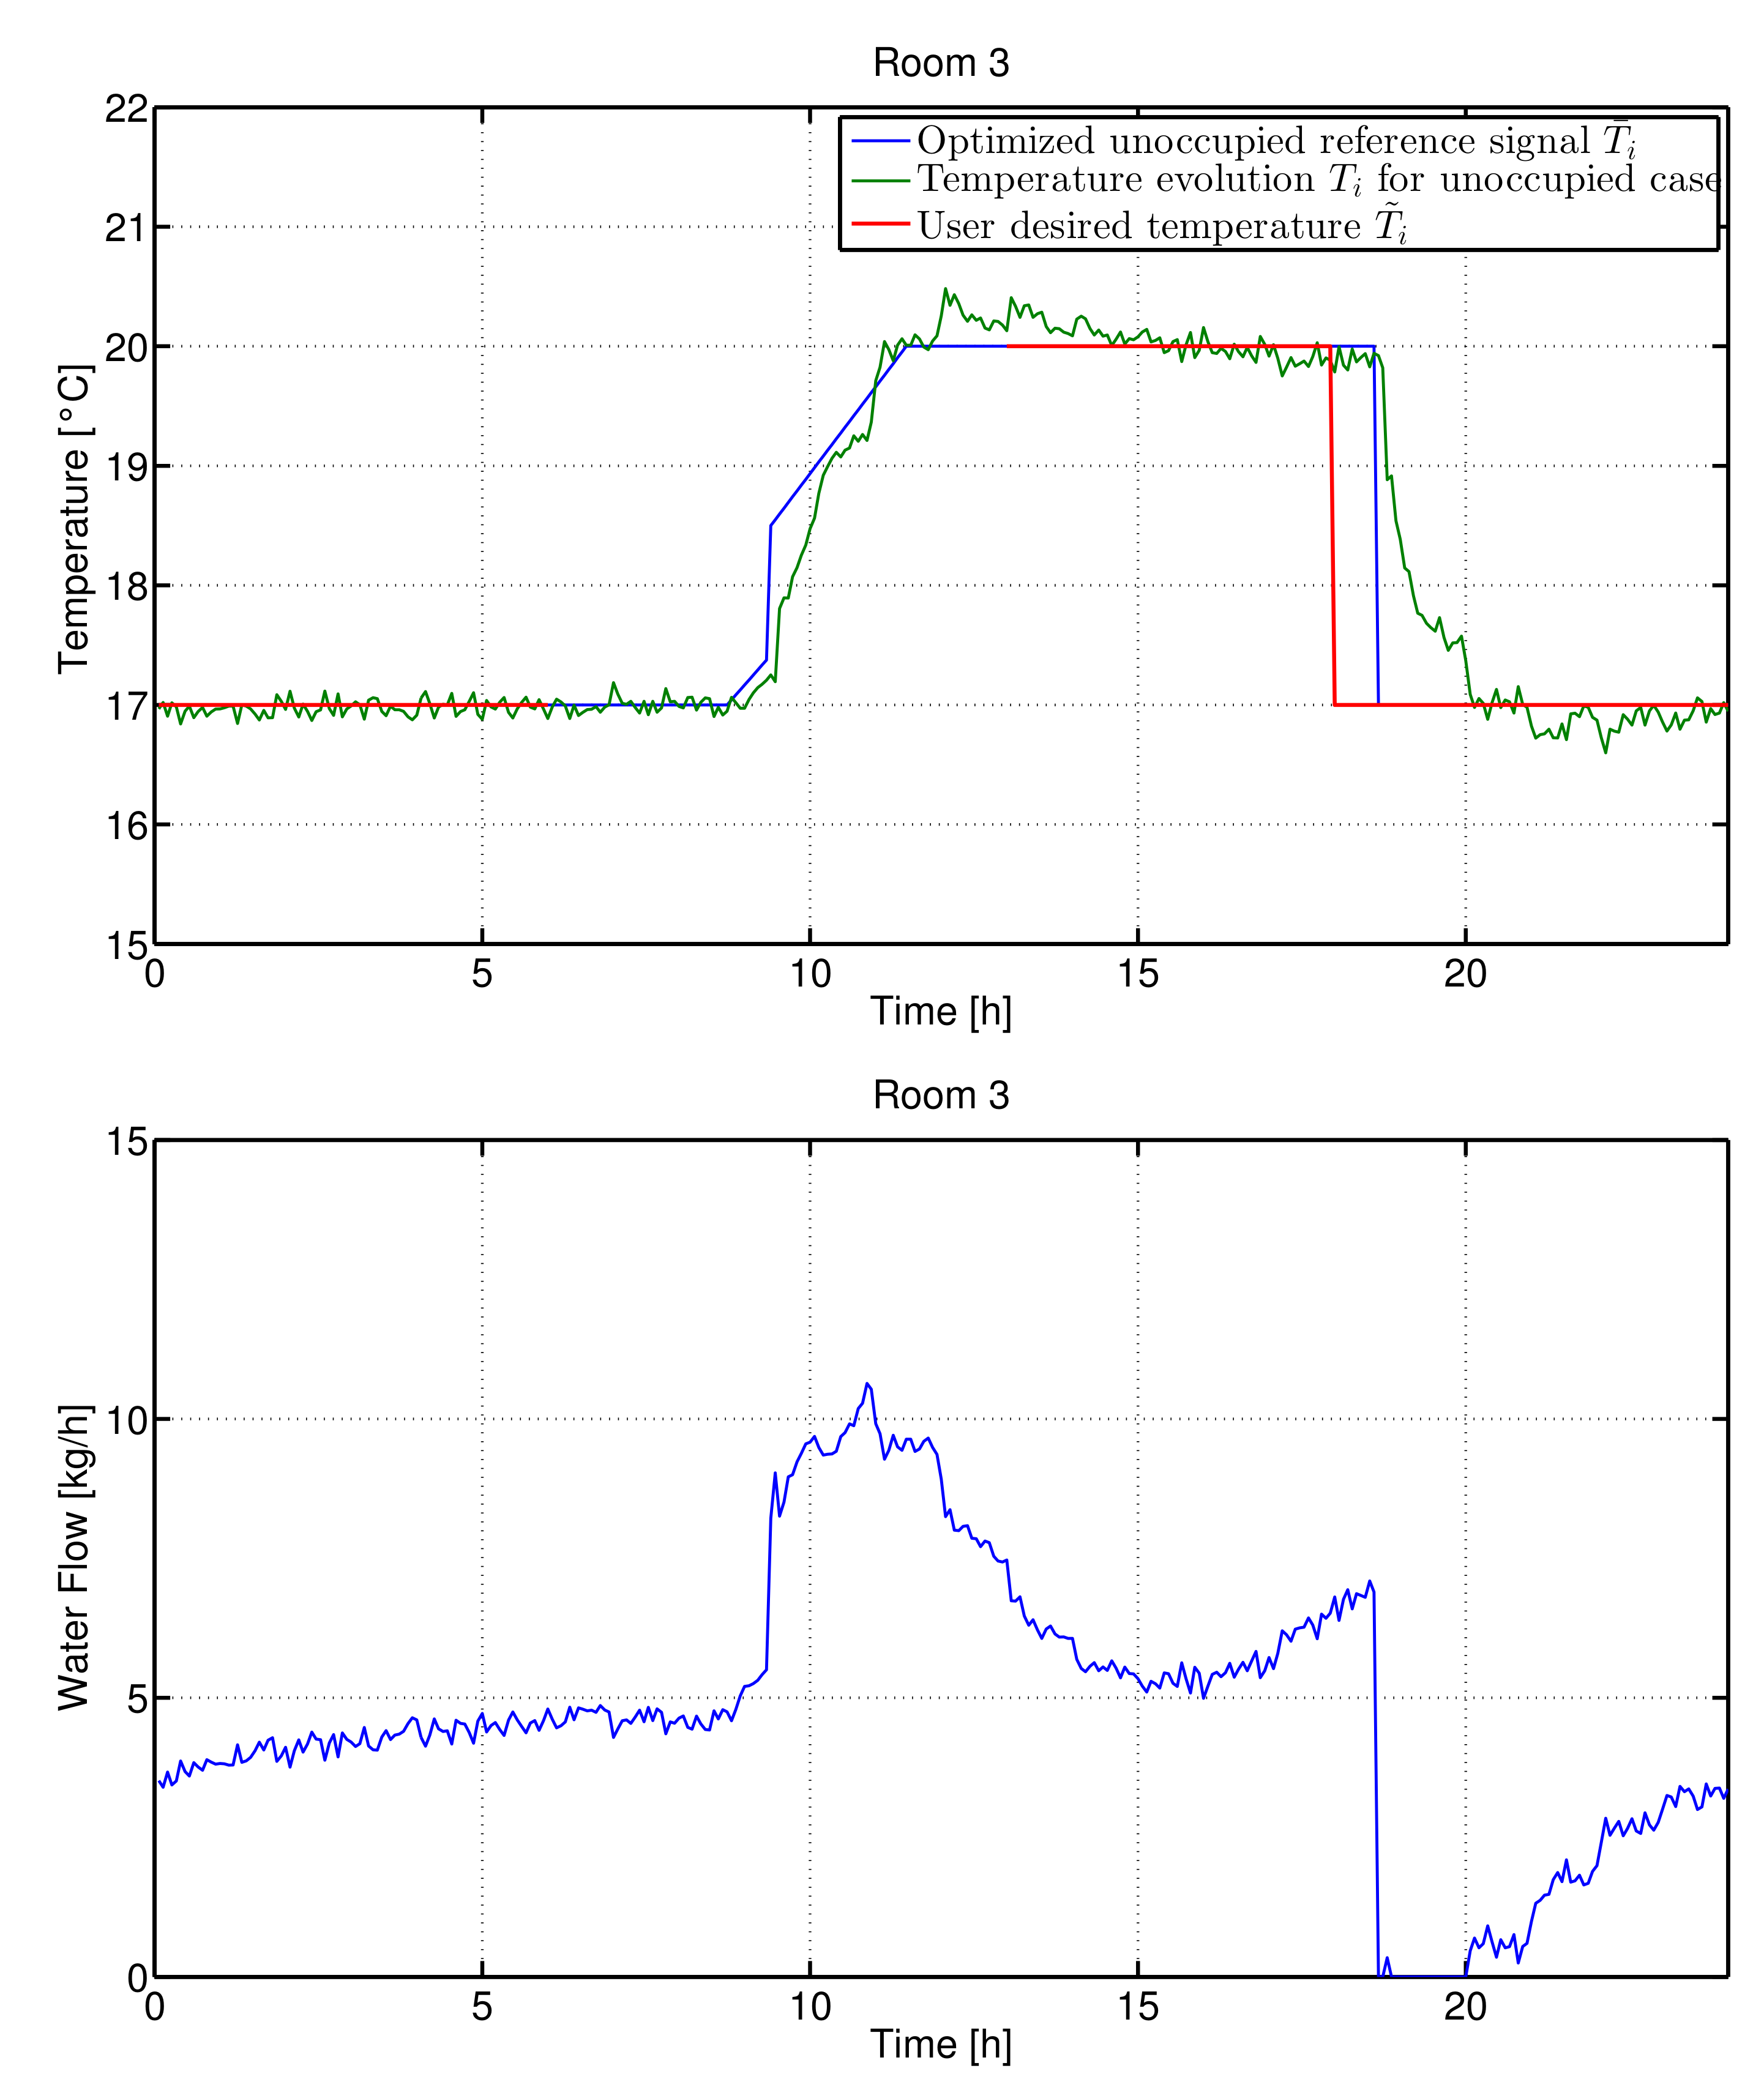
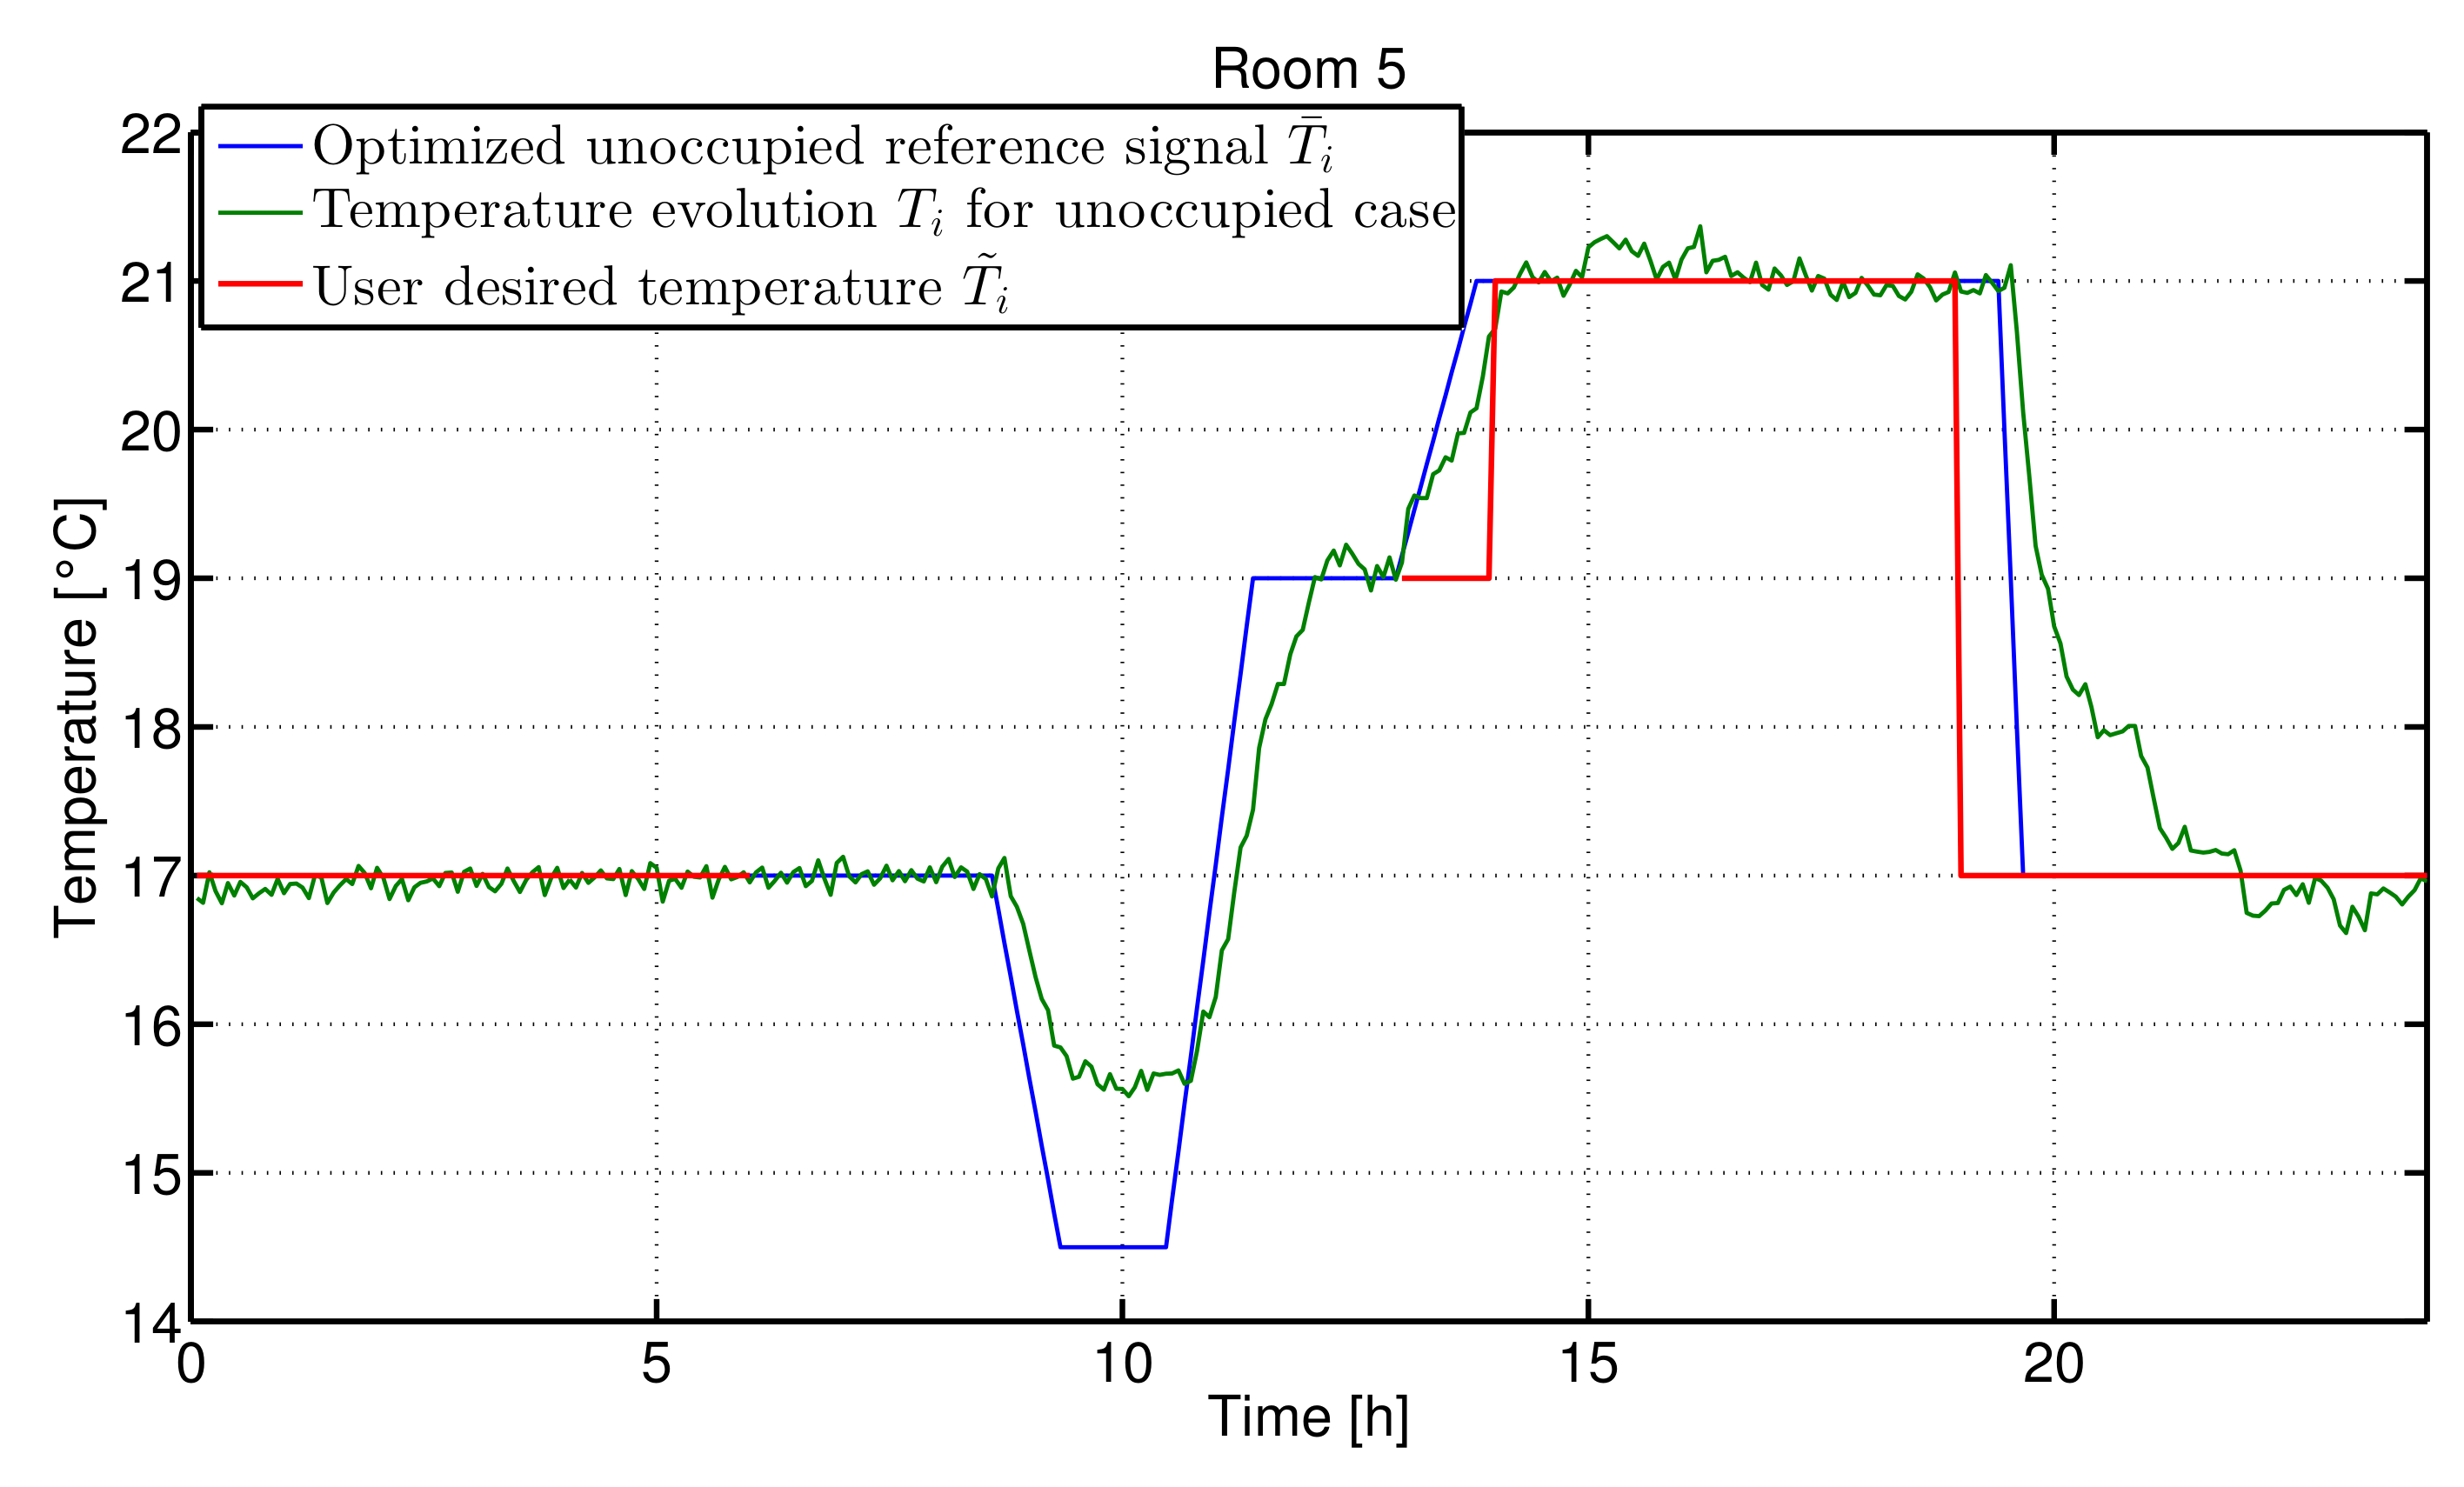
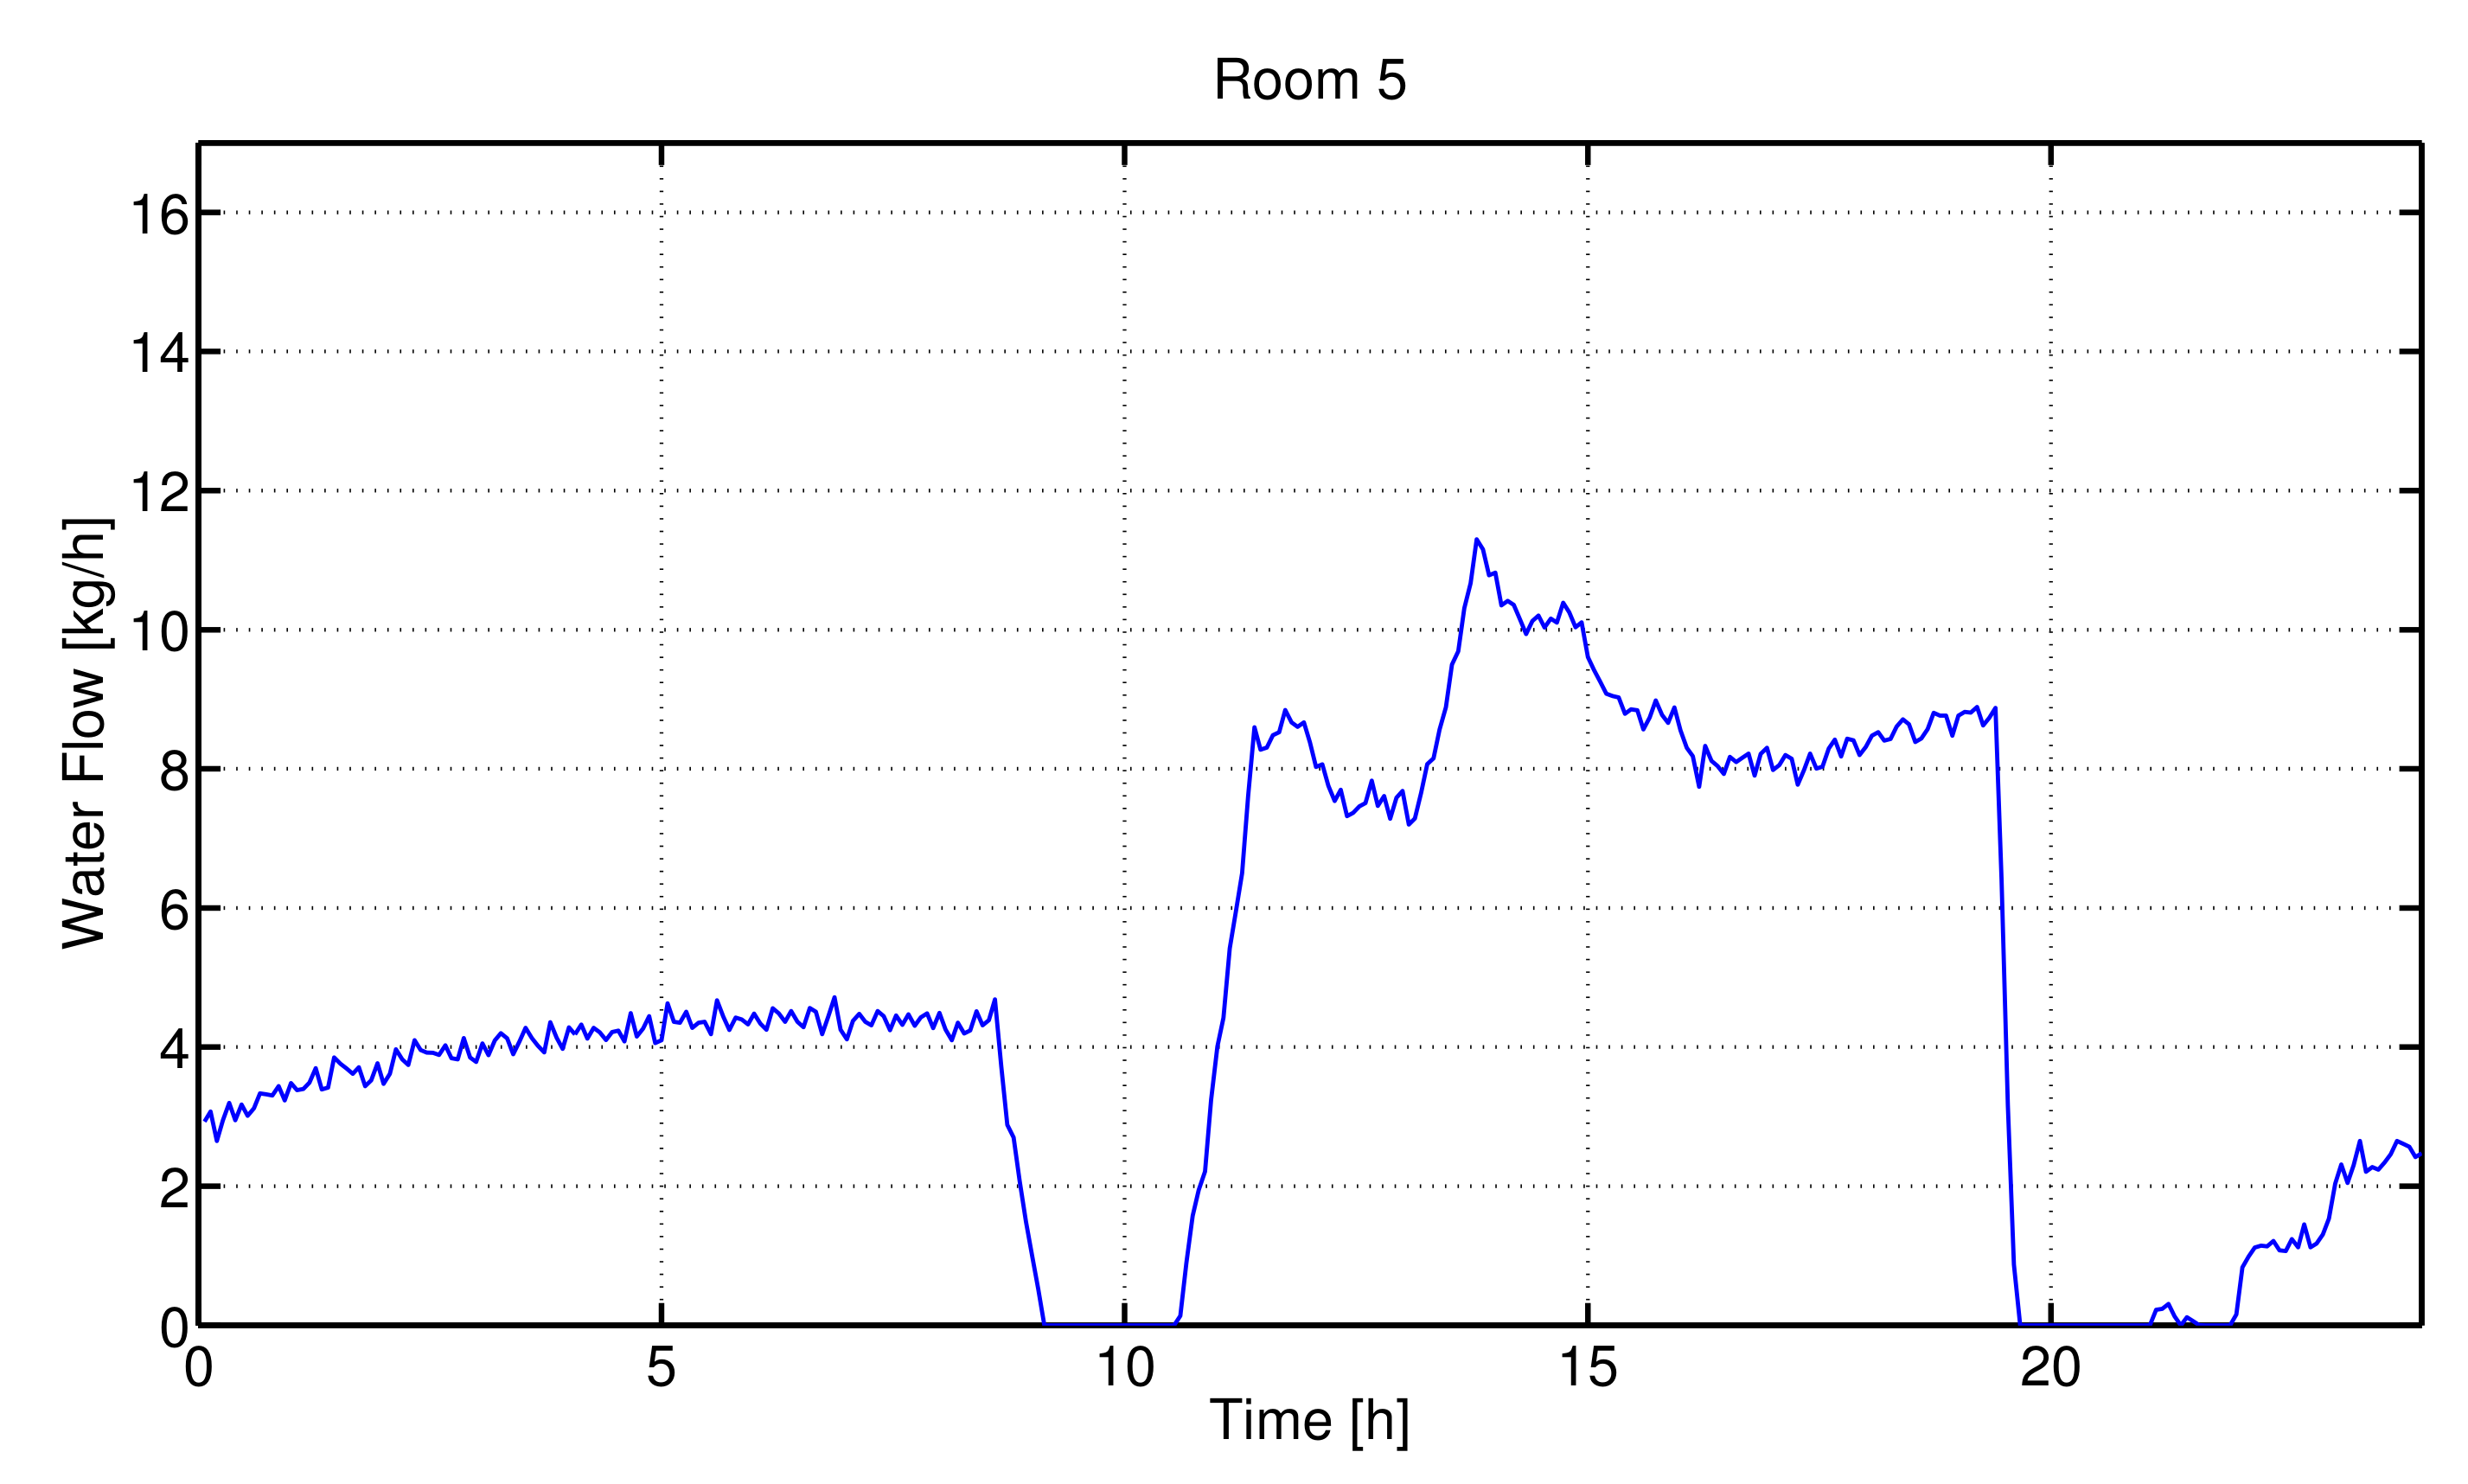
In Figure 11 and Figure 12, two rooms (room 3 and 5, respectively) in which the occupation is intermittent during the 24 h simulation are shown when the ARMAX model is used in simulation. On the other hand, results related to the TRNSYS model are shown in Figure 13 and Figure 14. It is possible to verify that the minimum energy consumption might be achieved by avoiding switching off the heating system during the unoccupied periods. Indeed, in this case the radiator of the room 3 is never switched off, although the room is empty. On the other hand, in room 5 the behavior is different, the radiator is off for a couple of hours during the unoccupied period. The energy consumption in the different cases is reported in Table 8.
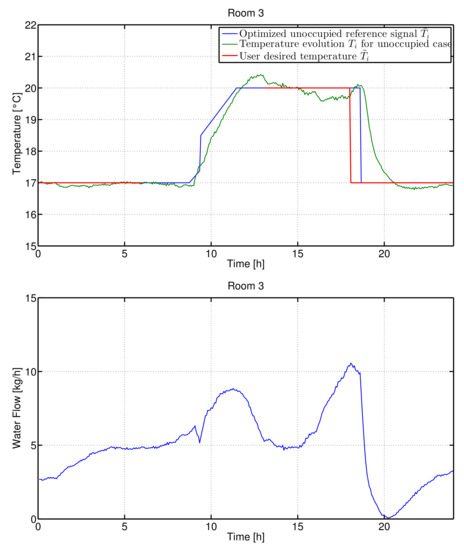
Figure 11.
One day simulation, 5 December, for room 3 with radiators in case of no set-point given by the user for given time intervals (ARMAX model).
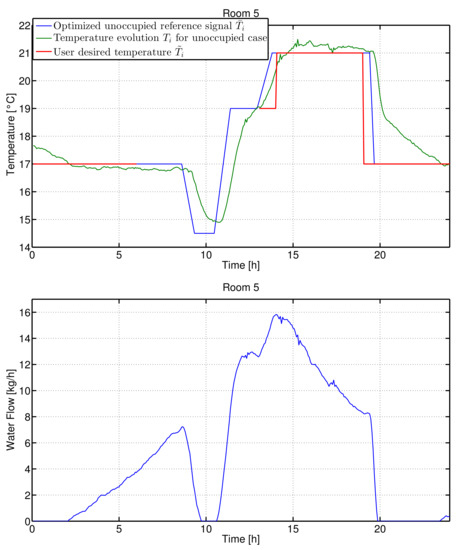
Figure 12.
One day simulation, 5 December, for room 5 with radiators in case of no set-point given by the user (ARMAX model).
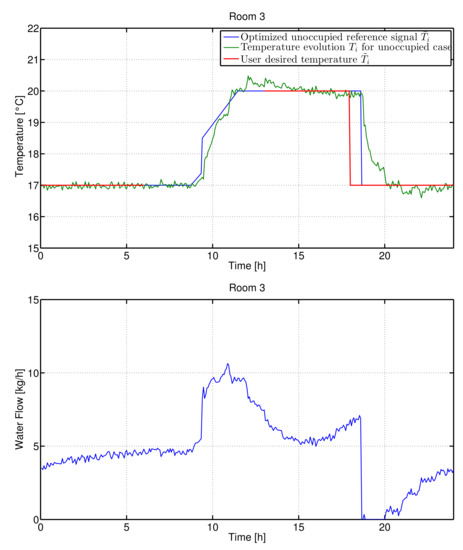
Figure 13.
One day simulation (TRNSYS model), 5 December, for room 3 for the case of unoccupied rooms, case of radiators and ramp set-point signals.
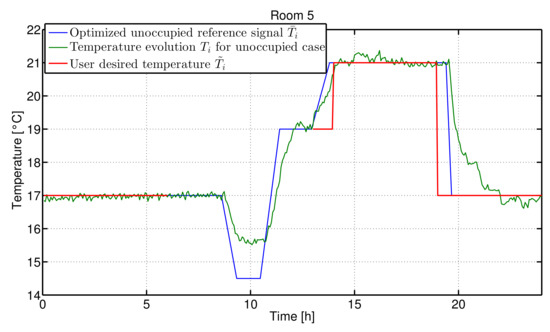
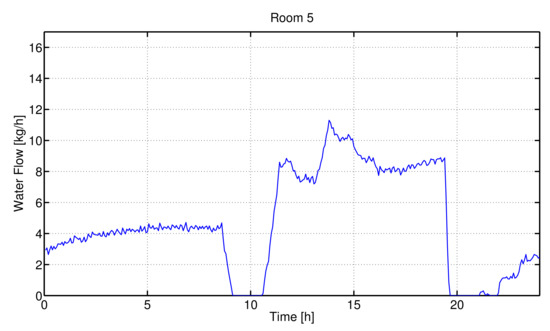
Figure 14.
One day simulation (TRNSYS model), 5 December, for room 5 for the case of unoccupied rooms, case of radiators and ramp set-point signals.

Table 8.
Radiators Performance index value (4) for the unoccupied room case with the ARMAX model and with the TRNSYS model using weather conditions of the previous days (4 December i.e., those used by the genetic algorithm) and of the current day (5 December).
It appears that the genetic algorithm-based optimization can be also effectively employed in providing useful information to the user in deciding the policy of selection of the use of the rooms in the different periods of the day.
8. Comparison between Centralized MPC and the Genetic Algorithm Approach
To further investigate the performance of the proposed optimization methodology, a comparison between the developed strategy and a MPC approach has been done. It is important to stress that the GA-based method is a centralized one, thus, to have a fair comparison between the two different strategies, the MPC has been developed in a centralized configuration. Furthermore, both methodologies have been applied to the same system in the same period of the year. However, there are two main differences between the two methods: firstly, the MPC controls directly the inner PID loop in the low-level control layer, while the genetic algorithm approach plans the set-point signal of the outer PID controller. Secondly, the MPC algorithm must solve a minimization problem at each sampling period, because of the receding horizon strategy, while the genetic algorithm approach solves the optimization problem at the beginning of the day for the whole day.
Many different constraints affect the system, for example, constraints on the control variable (the water flow inside the radiator system cannot be negative or bigger than a maximum value), or on the controlled variable (the indoor temperature, see (3)).
Thus, by considering the state-space model:
the generalized constrained optimization problem can be written as
where the performance index is a function of the inputs and the outputs of the system and is a vector containing all the different constraints that affect the system.
The centralized MPC developed is based on a state-space model description of the building, it is, therefore, clear that the ARMAX models of the different rooms has to be rewritten in a MIMO state-space form to be suitable for this kind of centralized MPC. Looking at (5), the matrix is the state matrix, where n is the number of rooms of the building and k is the order of the autoregressive part of the ARMAX model. The matrix is the input matrix, where m and l are respectively the number of controllable and uncontrollable inputs (which are, respectively, the water flows in the radiators, one for each room, and the weather conditions and the temperatures of the adjacent flats), and matrix is the output matrix, where p is the number of outputs. These are, obviously, the temperature inside the rooms of the building.
Therefore, it is now possible to write the performance index more specifically as follows:
where and are the outputs and controllable inputs vectors at the ith time instant, , and S are the weight matrices and is the reference vector for the output at the ith time instant. The prediction horizon M is the same both for the predicted outputs and the control inputs.
In this particular case, the prediction horizon has been chosen equal to 5 h, which is actually more than the value of the time constant in case of radiators employed as HVAC system. The weighting matrices have been set equal to:
where I is the identity matrix. The weight on is bigger in order to emphasize the set-point following condition, while the same value for and have been chosen in order to obtain a good trade-off between the energy used and the smoothness of the control variable (note that a too aggressive control signal might emphasize the uncertainties of the model and therefore some constraints can be violated in practice).
The formulation (7) is similar to the standard Quadratic Programming (QP) problem, and can be easily rewritten as:
where H, h, F and b are constant matrices or vectors which defines the problem and the constraints.
Given that many of the states x of the system are unknown, a state observer of the system is required in order to develop the MPC algorithm. The gain matrix L is selected, based on the eigenvalues of the state matrix, in order to obtain the dynamics of the observer faster than the system dynamics.
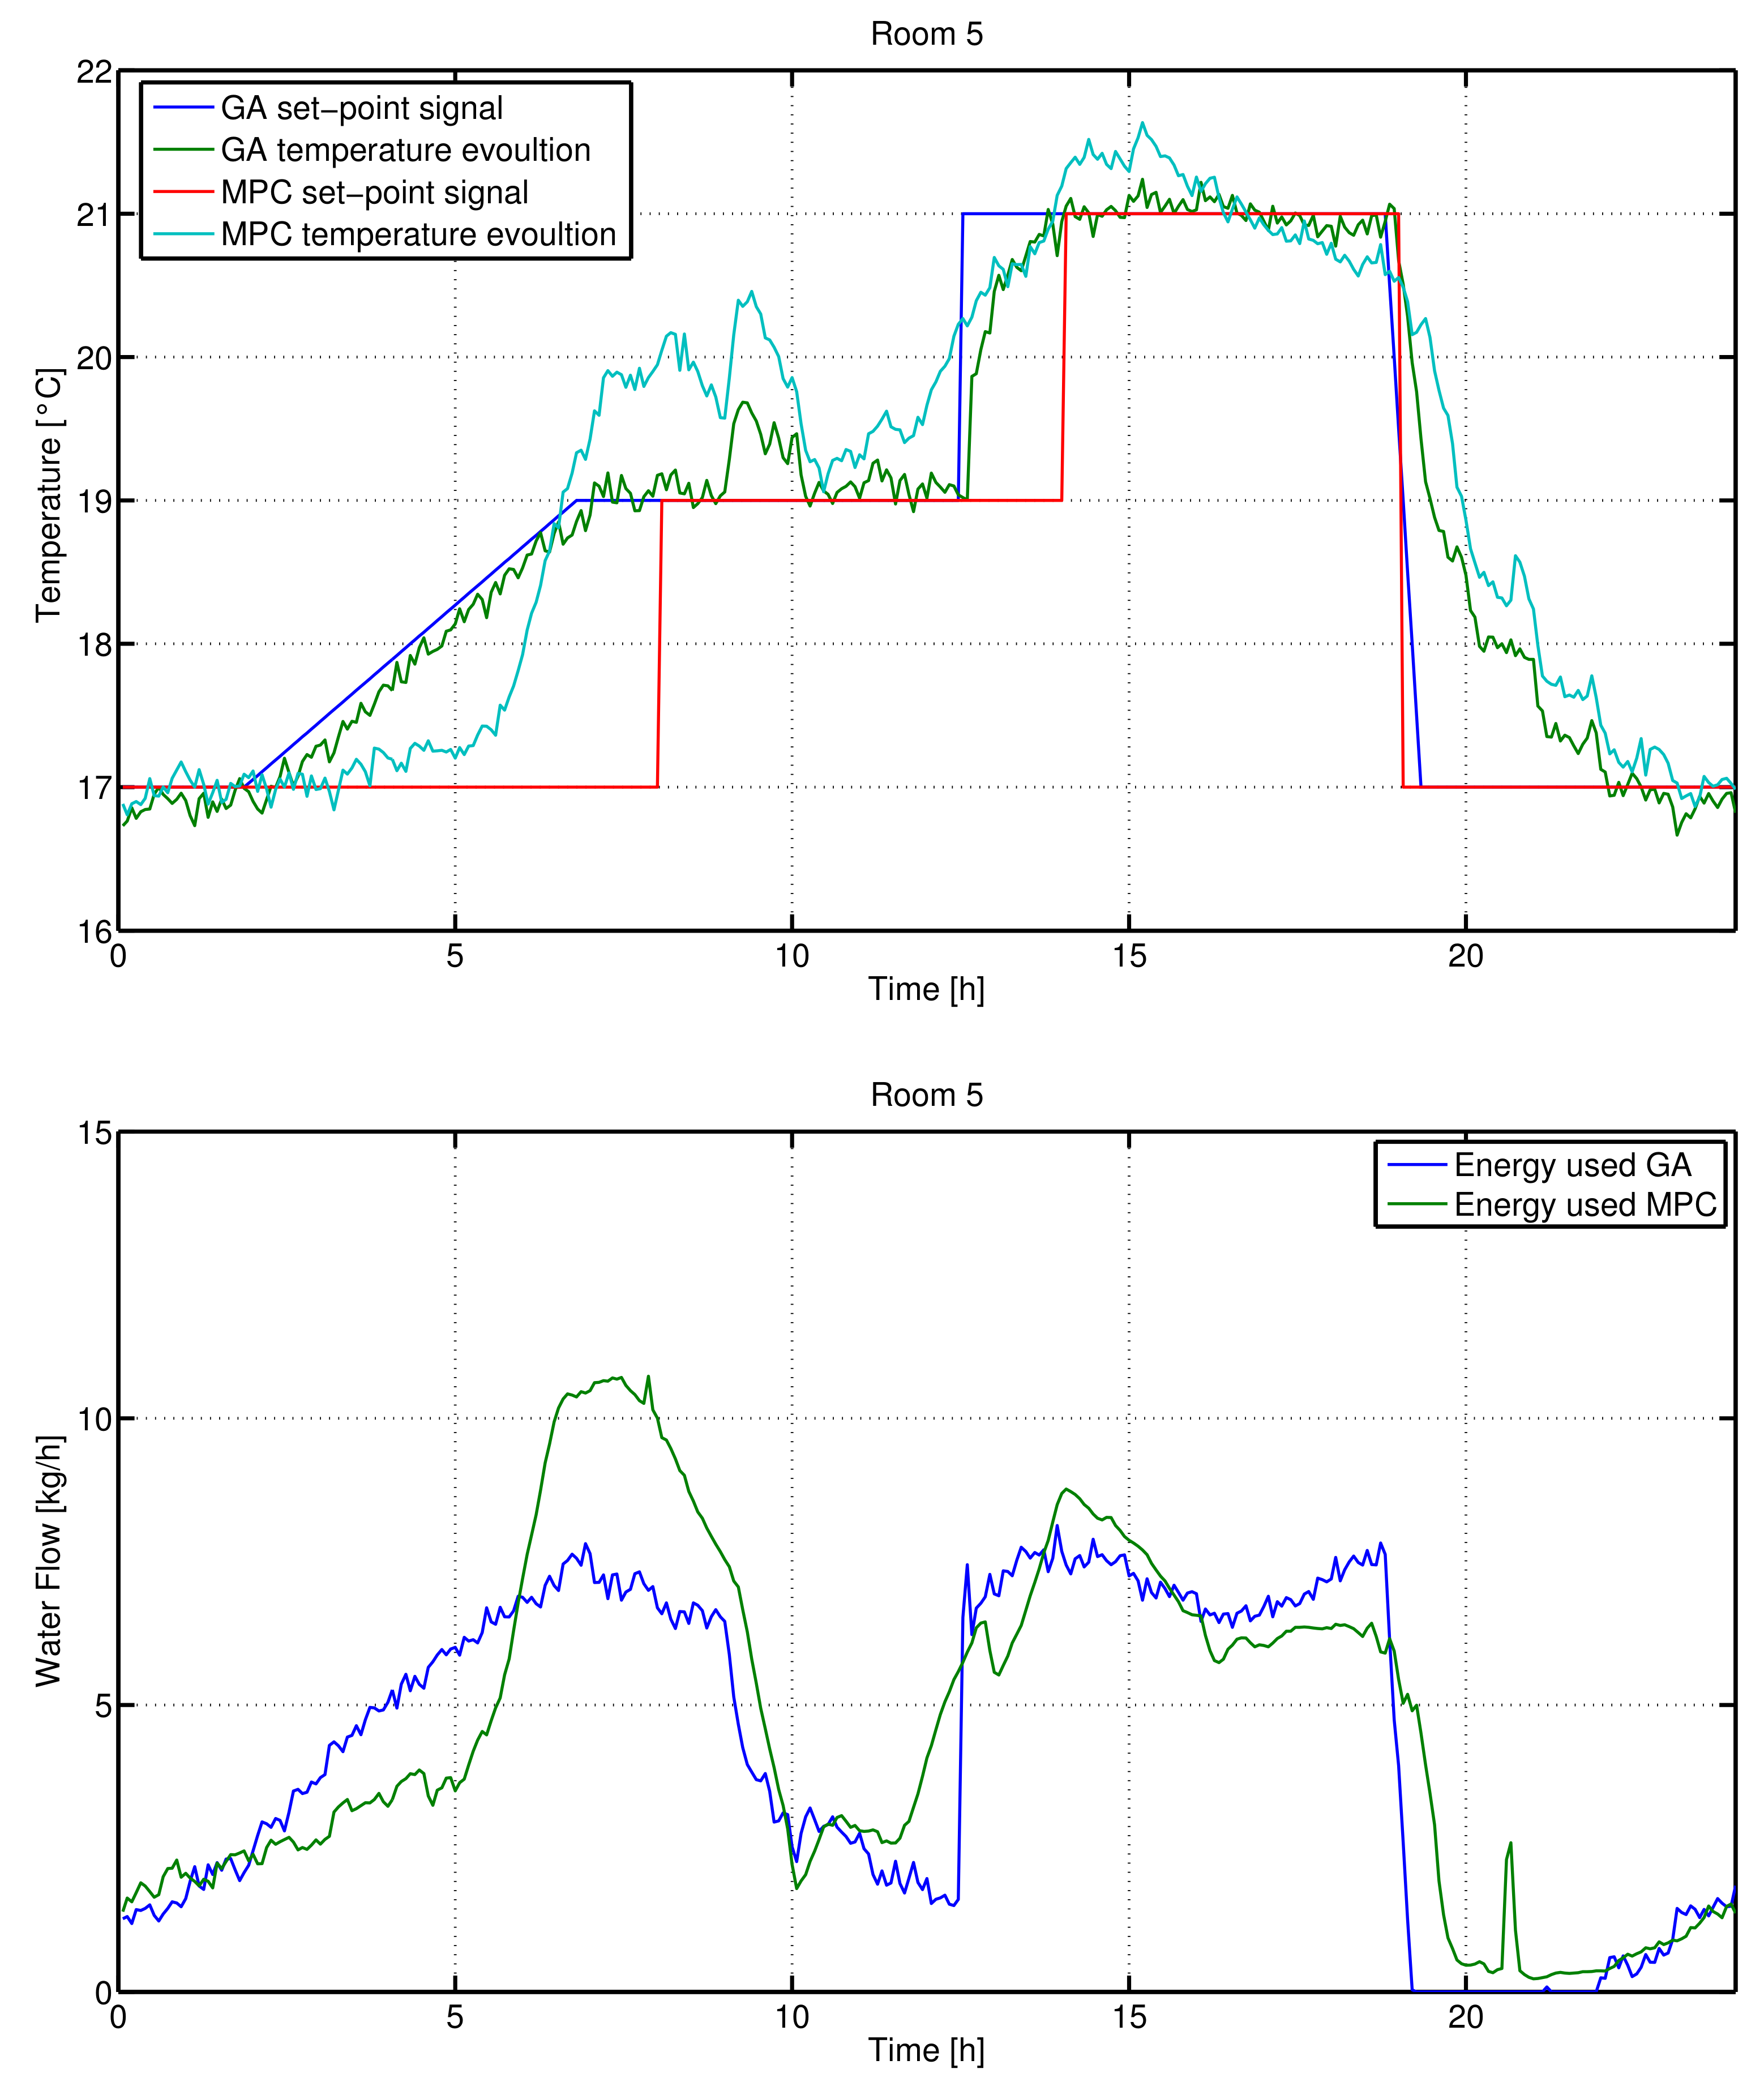
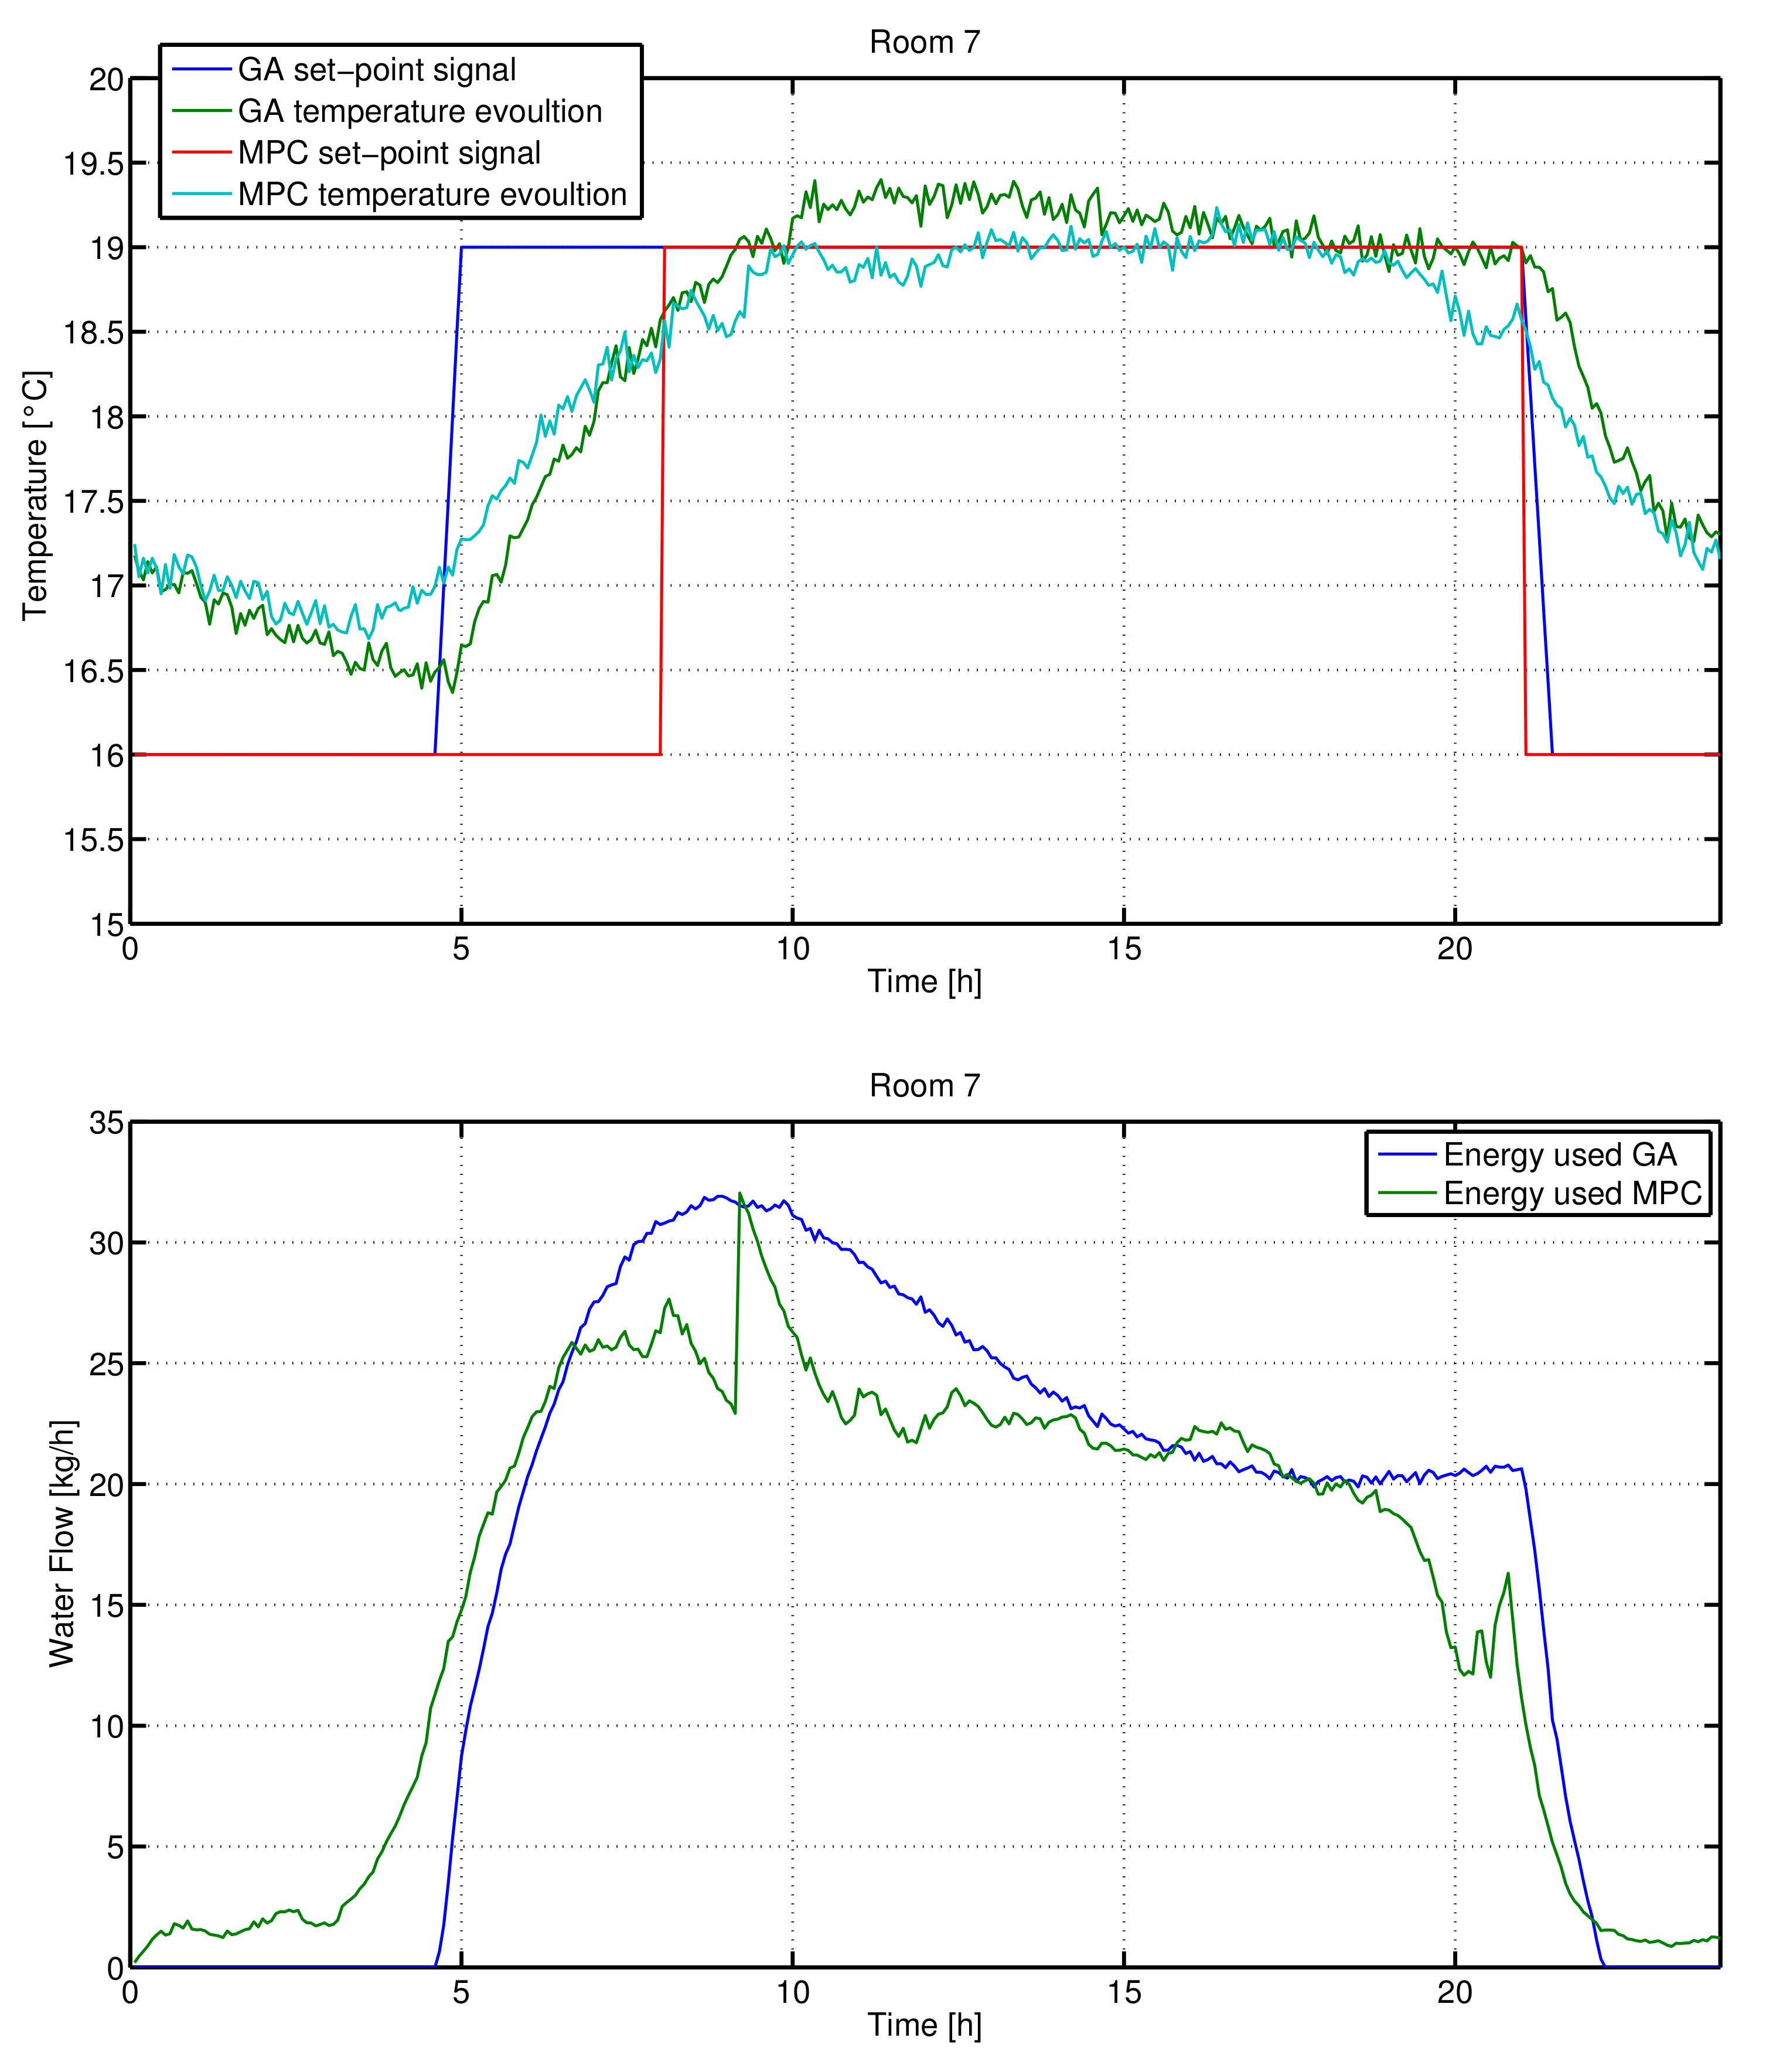
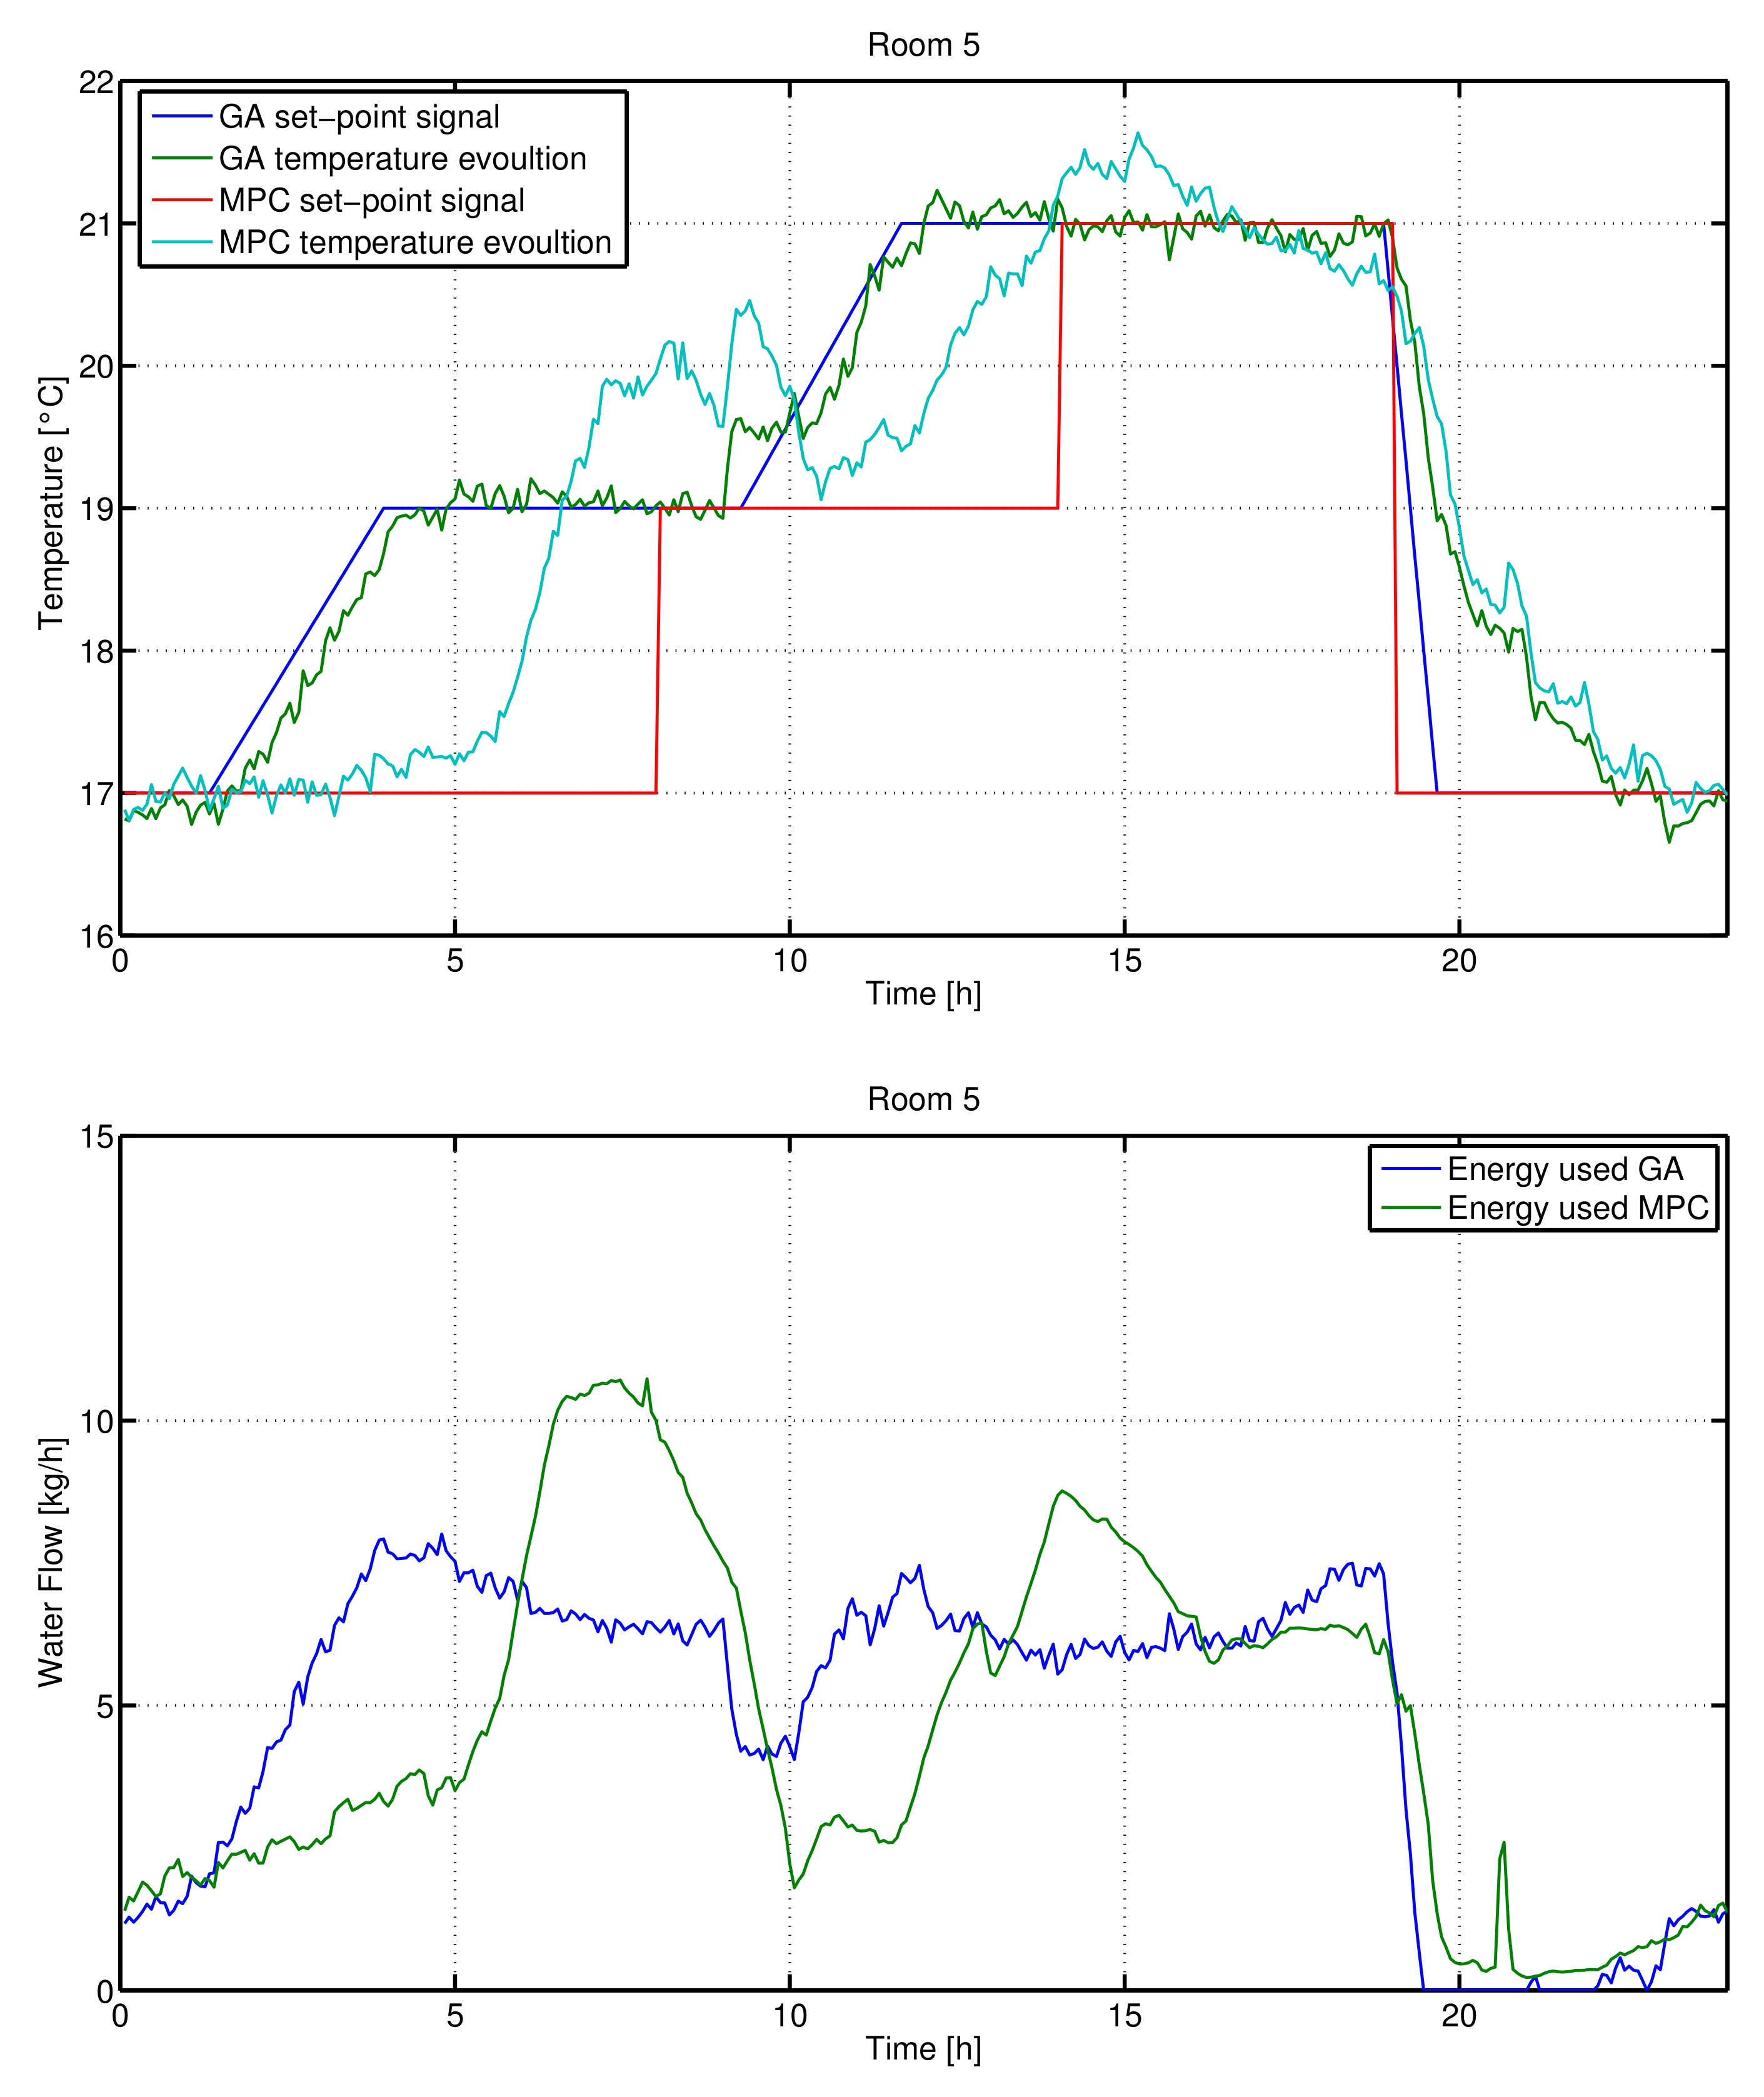
The simulations that have been carried out to compare the MPC to the genetic algorithm-based strategy are related to the building described in Section 5 when radiators are employed as HVAC system. The first comparison has been done by considering December 10. The results related to two different rooms (namely room 5 and 7) are presented in Figure 15 and Figure 16. The energy consumption of each subsystem and of the total building is shown in Table 9. It is worth stressing that the genetic algorithm set-point signal has been obtained based on the weather conditions of the day before, while the MPC algorithm actually implements the weather conditions of the current day. In this specific case, the energy consumption of the system when it is controlled by the centralized MPC is only less with respect to the genetic algorithm case.
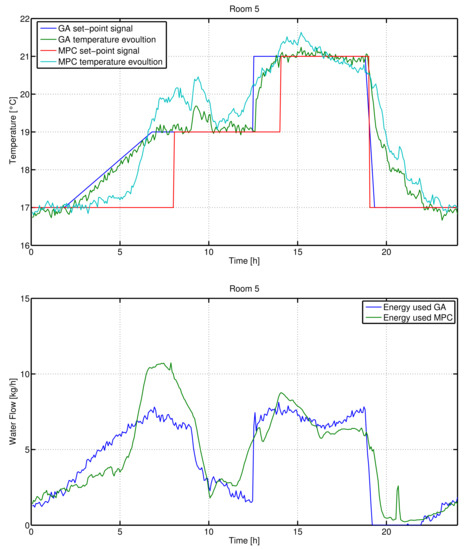
Figure 15.
One day simulation, 10 December, for room 5 (ARMAX model). Top: user defined set point (red line), optimized set-point ramp signal (blue line), temperature evolution in case of genetic algorithm set-point signal (green line), temperature evolution in case of MPC (light blue line). Bottom: resulting inlet water flow in case of ramp set-point signal (blue line) and in case of MPC (green line).
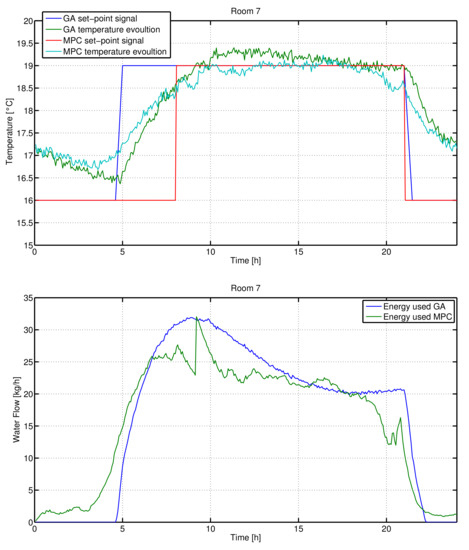
Figure 16.
One day simulation, 10 December, for room 7 (ARMAX model). Top: user defined set point (red line), optimized set-point ramp signal (blue line), temperature evolution in case of genetic algorithm set-point signal (green line), temperature evolution in case of MPC (light blue line). Bottom: resulting inlet water flow in case of ramp set-point signal (blue line) and in case of MPC (green line).

Table 9.
Performance index value (4) for each room when both the genetic-based optimization and MPC are applied to the system. In this case, the GA optimization is based on the weather conditions of the day before (December 9) while the MPC uses the weather condition of the day after (10 December)).
Even if the GA imposes that the set-point changes with a ramp signal, which has been chosen in order to reduce the convergence time of the algorithm, the performance obtained are comparable with respect to the MPC case. The resulting energy consumption of the Genetic Algorithm case is slightly higher than the MPC; however, the methodology is simpler and computationally lighter.
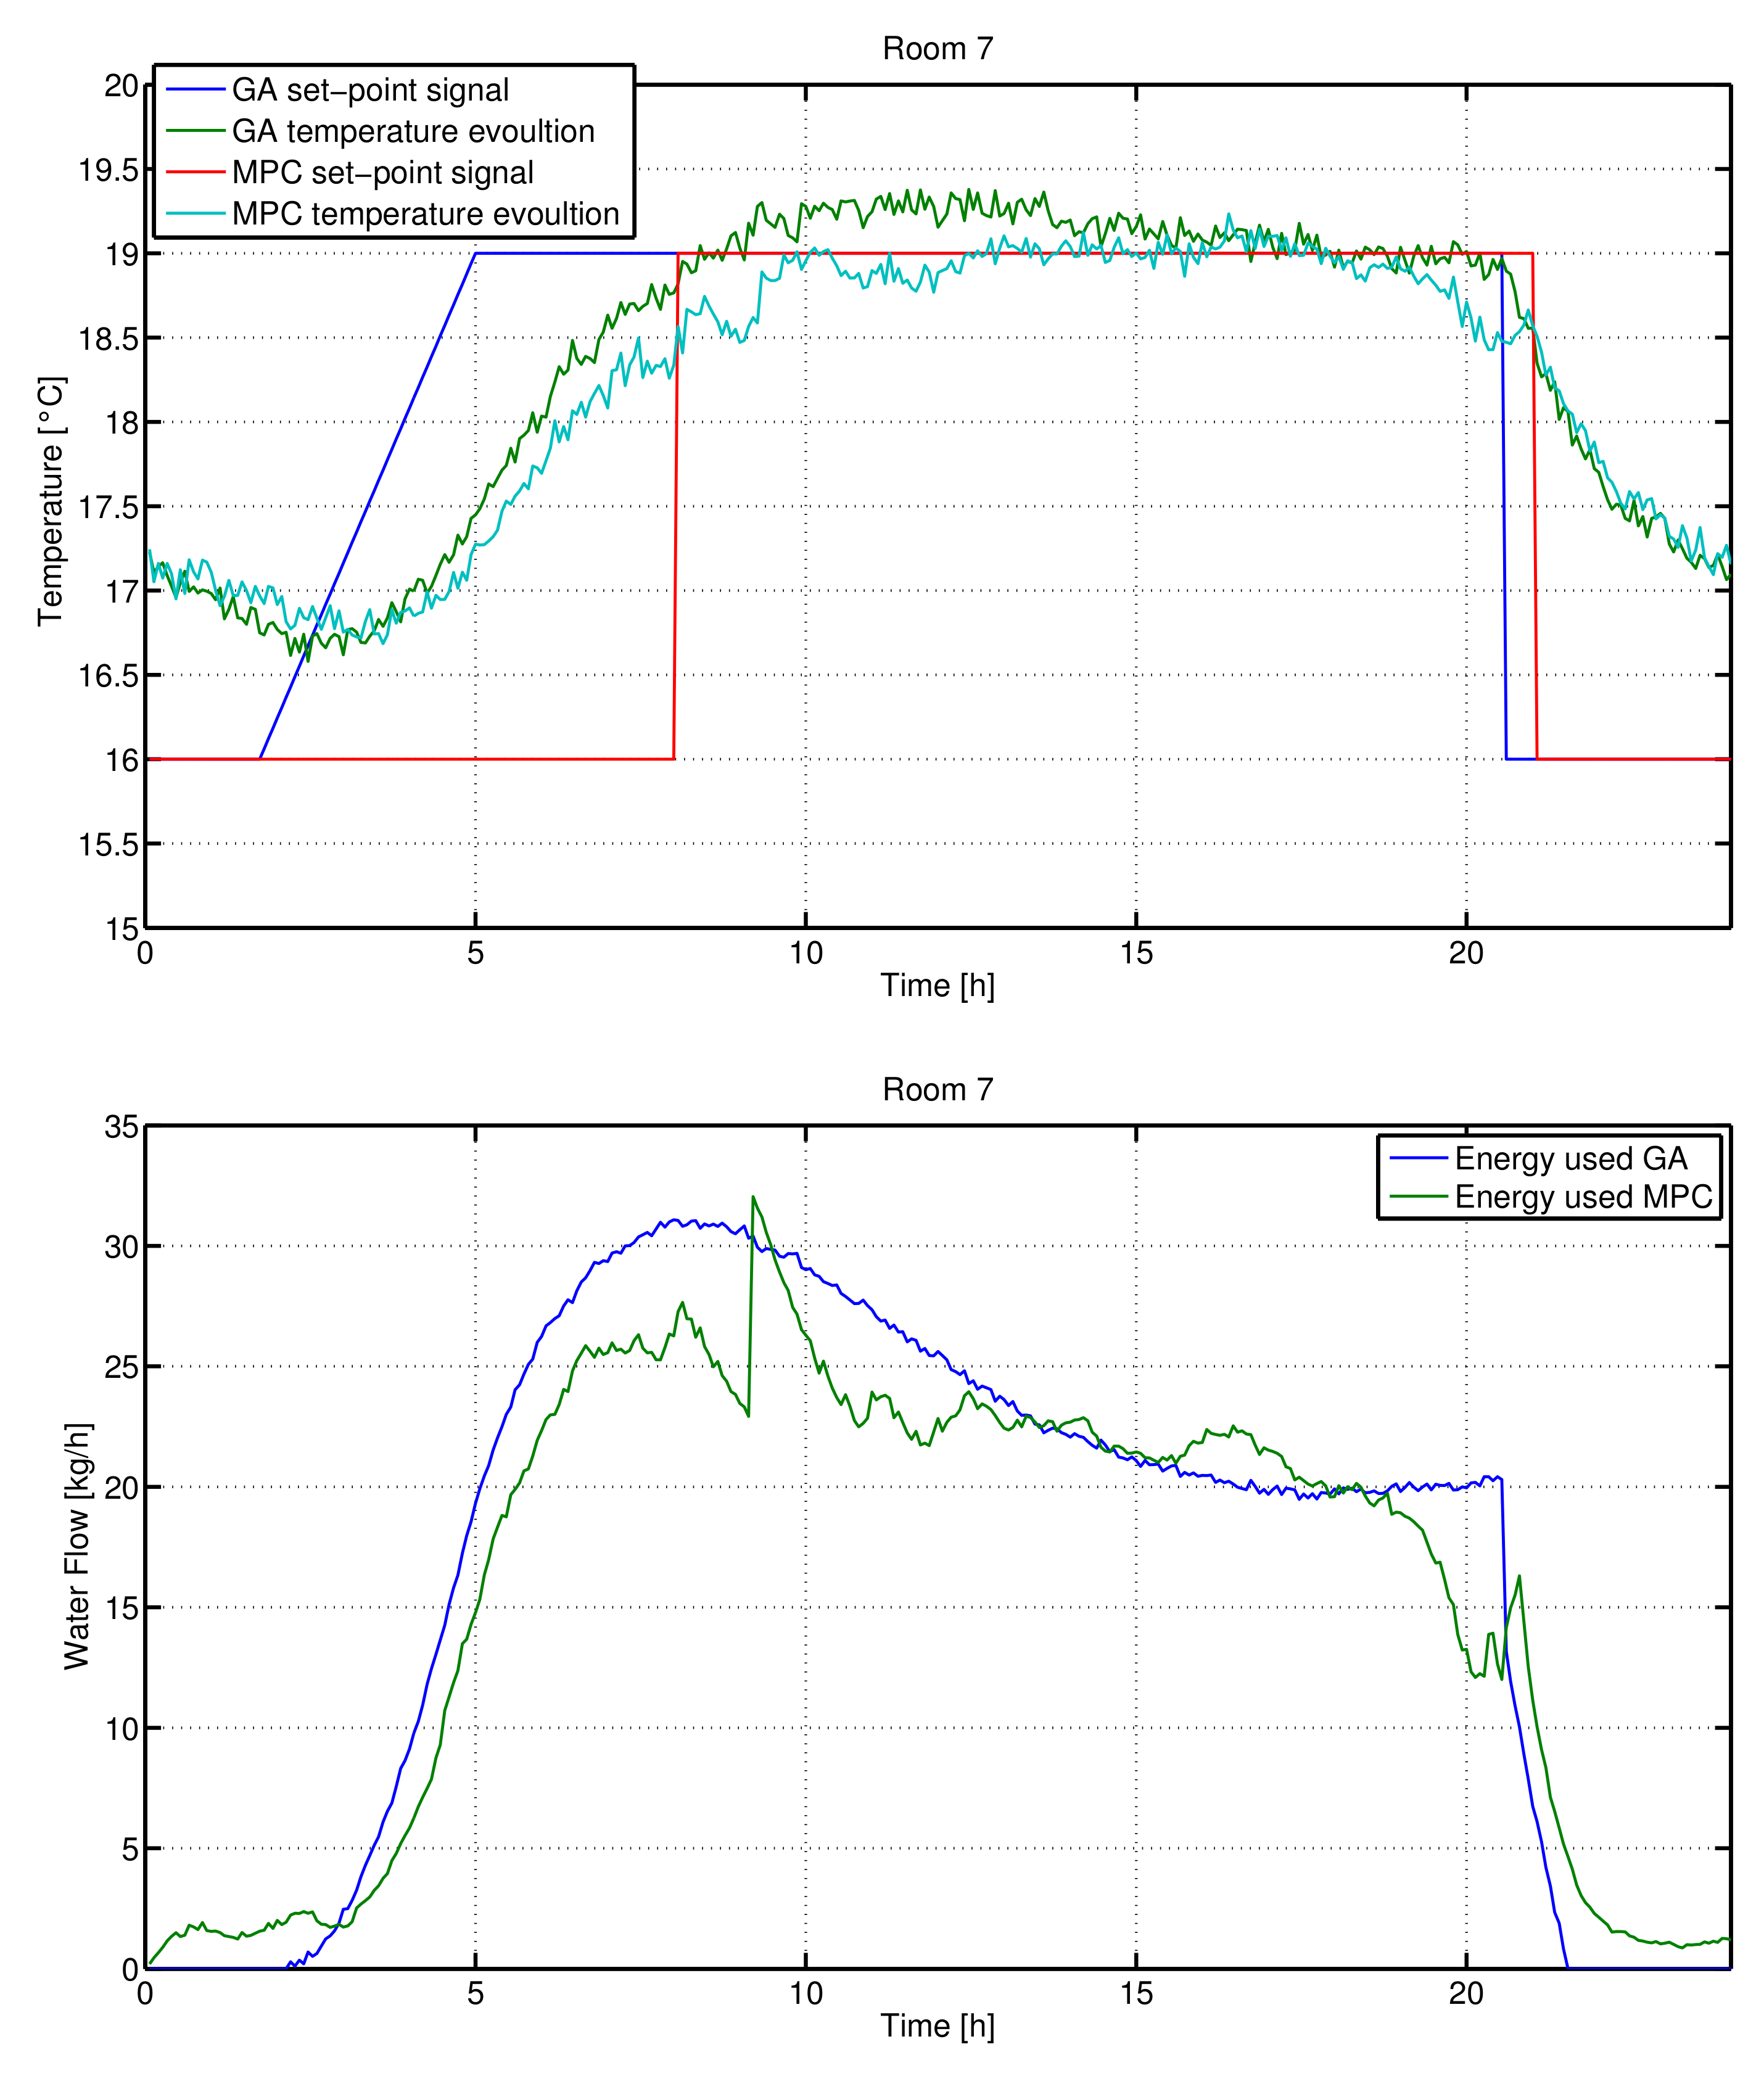
In the previously presented results, in the MPC algorithm the future weather conditions are assumed to be known in order to obtain reliable estimation of the future output and the control variable. Therefore, in order to obtain a fair comparison between the MPC and the GA approach, the GA algorithm has been applied again to the system but, in this case, the future weather conditions are assumed to be known. The test is carried out by considering, again, December 10. The results related to the rooms 5 and 7 are presented in Figure 17 and Figure 18. The energy consumption of each subsystem and of the total building is shown in Table 10. As it is possible to see the performance of the GA approach are comparable to the MPC. If both of them take into account the future weather conditions in the optimization process, the energy saving is less than the .
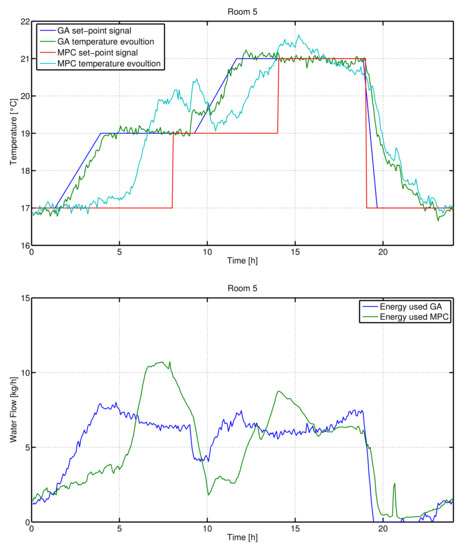
Figure 17.
One day simulation, 10 December, for room 5 (ARMAX model). Top: user defined set point (red line), optimized set-point ramp signal (blue line), temperature evolution in case of genetic algorithm set-point signal (green line), temperature evolution in case of MPC (light blue line). Bottom: resulting inlet water flow in case of ramp set-point signal (blue line) and in case of Model Predictive Control (MPC) (green line).
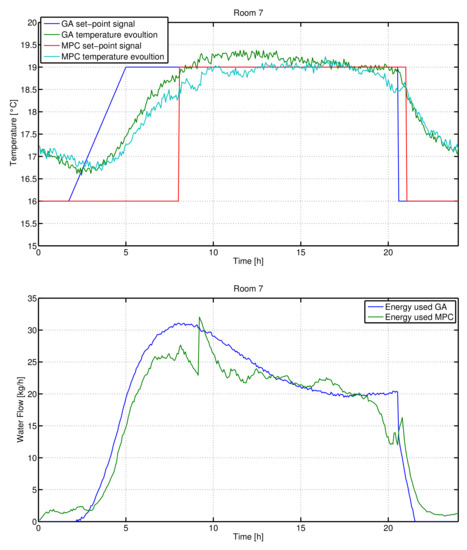
Figure 18.
One day simulation, 10 December, for room 7 (ARMAX model). Top: user defined set point (red line), optimized set-point ramp signal (blue line), temperature evolution in case of genetic algorithm set-point signal (green line), temperature evolution in case of MPC (light blue line). Bottom: resulting inlet water flow in case of ramp set-point signal (blue line) and in case of MPC (green line).

Table 10.
Performance index value (4) for each room when both the genetic-based optimization and Model Predictive Control (MPC) are applied to the system. In this case, the genetic algorithms (GA) optimization is based on the weather conditions of the day after (10 December), as the MPC.
9. Discussion of the Results
In this section, the obtained results are discussed. Firstly, it is important to stress again that the developed algorithm is an off-line strategy. It aims to plan temperatures references signals for each room for the whole day based on a mathematical model that, with a good approximation, predicts the thermal behavior of the whole building taking into account all the main exogenous inputs and the thermal coupling between adjacent areas. Basically, the algorithm reshapes user defined temperature set-point signal, in which hard constraints in terms of temperature values in specific time instants are posed, in order to fulfill all the occupant constraints. To fasten the convergence of the algorithm the set-points signals are constrained to vary as a step or as a ramp. In fact, the solution may be calculated in less than 1 h, approximately in 700 s in case of steps and 1200 s in case of ramps.
In Section 6 a comparison between these two strategies shows that in case of radiators, the use of ramps instead of steps allows a decrement of the energy consumption up to . However, it mainly depends on the kind of the HVAC system employed, in fact, in case of fan-coil units, the decrement is less significant, as it is up to 2–3%. However, the ramp signal offers more degrees of freedom than the step one, and this helps the algorithm to explore more possible temperature evolutions and therefore better solutions.
Furthermore, in Section 7, the strategy is applied in case of unoccupied spaces. It turns out that, as the approach considers the whole building and therefore the couplings between adjacent rooms, it is not always better to switch off the heating system of a room if it is empty for a certain time interval. This depends on different factors like the position of the room, its dimensions, and the weather conditions. For example, in the reported example, rooms 3 and 5, which have the same dimensions and shape, have two completely different behaviors. This is mainly due to the fact that the adjacent rooms are different. Indeed, the contribution of room 3 in heating rooms 2 and 4, which are small, is significant, so that heating room 3 is useful in allowing rooms 2 and 4 to use less energy to follow their set-point signals. On the other hand, room 5 is adjacent to room 6 which is much bigger and therefore keeping room 5 heated is less relevant to reduce the energy required to heat room 6.
Finally, a comparison between this off-line high-level algorithm and the well-known MPC is done in Section 8. This comparison aims to show that the suboptimal results obtained by this off-line strategy can be similar to results obtained with predictive online control algorithms. This means that the choice of ramp signals as set-point variations is appropriate. Furthermore, thanks to the fact that the algorithm works only during the first hour of each day, it is possible to use its resources to further help the occupant by solving other possible optimization problems.
10. Conclusions
In this paper, the temperature control problem of a residential building has been considered. A genetic algorithm has been used to optimize a user defined set-point signal in order to guarantee the temperature required by the occupants and by minimizing the energy consumption. In order to provide the temperature set-point for the control system of each room, the genetic algorithm exploits a simple linear black-box ARMAX model of the building and the weather conditions of the previous day (in case reliable weather forecasts are not available). In this context, both step and ramp signals have been taken into account.
Simulation results have shown that the methodology is effective and that with fan-coil units the step signals are more appropriate while for radiators it is worth using ramp signals to provide a significant energy consumption reduction. Finally, a comparison between the presented strategy and the well-known MPC has been performed. As the two methods have a similar performance it turns out that the choice of using ramp signals effective. Even though the MPC is an online algorithm and the GA-based strategy is mainly off-line, the performance of both are comparable.
Author Contributions
Methodology: D.G. and A.V.; software: D.G.; writing—original draft preparation, D.G.; writing—review and editing, A.V.; supervision, A.V.
Funding
This research received no external funding.
Conflicts of Interest
The authors declare no conflict of interest.
References
- Environmentalleader. Available online: https://www.environmentalleader.com/2009/04/building-sector-needs-to-reduce-energy-use-60-by-2050/ (accessed on 10 July 2018).
- Becchio, C.; Corgnati, S.; Delmastro, C.; Fabi, V.; Lombardi, P. The role of nearly-zero energy buildings in the transition towards Post-Carbon Cities. Sustain. Cities Soc. 2016, 27, 324–337. [Google Scholar] [CrossRef]
- Ascione, F.; Bianco, N.; Masi, R.D.; Mauro, G.; Vanoli, G. Design of the Building Envelope: A Novel Multi-Objective Approach for the Optimization of Energy Performance and Thermal Comfort. Sustainability 2015, 7, 10809–10836. [Google Scholar] [CrossRef]
- Congedo, P.; Baglivo, C.; D’Agostino, D.; Zacà, I. Cost-optimal design for nearly zero energy office buildings located in warm climates. Energy 2015, 91, 967–982. [Google Scholar] [CrossRef]
- Bruni, G.; Cordiner, S.; Mulone, V.; Sinisi, V.; Spagnolo, F. Energy management in a domestic microgrid by means of model predictive controllers. Energy 2016, 108, 119–131. [Google Scholar] [CrossRef]
- Meier, A.; Aragon, C.; Hurwitz, B.; Mujumdar, D.; Perry, D.; Peffer, T. How people actually use thermostats. In Proceedings of the 2010 ACEEE Summer Study on Energy Efficiency in Buildings, Pacific Grove, CA, USA, 15 August 2010. [Google Scholar]
- Bi, Q.; Cai, W.; Wang, Q.; Hang, C.; Lee, E.; Sun, Y.; Liu, K.; Zhang, Y.; Zou, B. Advanced controller auto-tuning and its application in HVAC systems. Control Eng. Pract. 2000, 8, 633–644. [Google Scholar] [CrossRef]
- Soyguder, S.; Karakose, M.; Alli, H. Design and simulation of a self-tuning PID-type fuzzy adaptive control for an expert HVAC system. Expert Syst. Appl. 2009, 36, 4566–4573. [Google Scholar] [CrossRef]
- Calvino, F.; Gennusa, M.L.; Rizzo, G.; Scaccianoce, G. The control of indoor thermal comfort conditions: Introducing a fuzzy adaptive controller. Energy Build. 2004, 36, 97–102. [Google Scholar] [CrossRef]
- Liang, J.; Du, R. Design of intelligent comfort control system with human learning and minimum power control strategies. Energy Convers. Manag. 2008, 49, 517–528. [Google Scholar] [CrossRef]
- Zaheer-uddin, M.; Tudoroiu, N. Neuro-PID tracking control of a discharge air temperature system. Energy Build. 2004, 45, 2405–2415. [Google Scholar] [CrossRef]
- Camacho, E.; Bordons, C. Model Predictive Control; Springer: Berlin, Germany, 2004. [Google Scholar]
- Cigler, J.; Široky, J.; Korda, M.; Colin, J. On the selection of the most appropriate MPC problem formulation for buildings. In Proceedings of the 11th REHVA World Congress CLIMA 2013, Prague, Czech Republic, 16–19 June 2013. [Google Scholar]
- Freire, R.Z.; Oliveira, G.H.C.; Mendes, N. Predictive controllers for thermal comfort optimization and energy savings. Energy Build. 2008, 40, 1353–1365. [Google Scholar] [CrossRef]
- Hazyuk, I.; Ghiaus, C.; Penhouet, D. Model Predictive Control of thermal comfort as a benchmark for controller performance. Autom. Construct. 2014, 43, 98–109. [Google Scholar] [CrossRef]
- Hilliard, T.; Swan, L.; Qin, Z. Experimental implementation of whole building MPC with zone based thermal comfort adjustments. Build. Environ. 2017, 125, 326–338. [Google Scholar] [CrossRef]
- Oldewurtel, F.; Paraisio, A.; Jones, C.N.; Gyalistras, D.; Gwerder, M.; Stauch, V.; Lehmann, B.; Morari, M. Use of model predictive control and weather forecasts for energy efficient building climate control. Energy Build. 2012, 45, 15–27. [Google Scholar] [CrossRef]
- Chandan, V.; Alleyne, A.G. Decentralized predictive thermal control for buildings. J. Process Control 2014, 24, 820–835. [Google Scholar] [CrossRef]
- Moro̧san, P.; Bourdais, R.; Dumur, D.; Buisson, J. A dynamic horizon distributed predictive control approach for temperature regulation in multi-zone buildings. In Proceedings of the 18th Mediterranean Conference on Control and Automation, Marrakech, Morocco, 23–25 June 2010. [Google Scholar]
- Moro̧san, P.; Bourdais, R.; Dumur, D.; Buisson, J. Building temperature regulation using a distributed model predictive control. Energy Build. 2010, 42, 1445–1452. [Google Scholar] [CrossRef]
- Gorni, D.; Visioli, A. Optimal temperature set-point planning for residential buildings. In Proceedings of the 21th IEEE International Conference on Emerging Technologies and Factory Automation, Berlin, Germany, 6–9 September 2016. [Google Scholar]
- Mitchell, M. An Introduction to Genetic Algorithms; MIT Press: Cambridge, MA, USA, 1998. [Google Scholar]
- Ascione, F.; Bianco, N.; Masi, R.D.; Mauro, G.; Vanoli, G. A new methodology for cost-optimal analysis by means of the multi-objective optimization of building energy performance. Energy Build. 2015, 88, 78–90. [Google Scholar] [CrossRef]
- Evins, R. Multi-level optimization of building design, energy system sizing and operation. Energy 2015, 90, 1775–1789. [Google Scholar] [CrossRef]
- Kusiak, A.; Xu, G. Modeling and optimization of HVAC systems using a dynamic neural network. Energy 2012, 42, 241–250. [Google Scholar] [CrossRef]
- Wei, X.; Krusiak, A.; Li, M.; Tang, F.; Zeng, Y. Multi-objective optimization of the HVAC (heating ventilation and air conditioning) system performance. Energy 2015, 83, 294–306. [Google Scholar] [CrossRef]
- Ascione, F.; Bianco, N.; Stasio, C.D.; Mauro, G.; Vanoli, G. A new comprehensive approach for cost-optimal building design integrated with the multi-objective model predictive control of HVAC systems. Sustain. Cities Soc. 2017, 31, 136–150. [Google Scholar] [CrossRef]
- Gorni, D.; Castilla, M.; Visioli, A. An efficent modelling for temperature control of residential buildings. Build. Environ. 2016, 103, 86–98. [Google Scholar] [CrossRef]
- Sketchup. Available online: http://www.sketchup.com/it/products/sketchup-pro (accessed on 10 July 2018).
- TRNSYS. Available online: http://sel.me.wisc.edu/trnsys/weather/weather.htm (accessed on 10 July 2018).
- TRNSYS. Available online: http://www.trnsys.com/tess-libraries/ (accessed on 10 July 2018).
© 2018 by the authors. Licensee MDPI, Basel, Switzerland. This article is an open access article distributed under the terms and conditions of the Creative Commons Attribution (CC BY) license (http://creativecommons.org/licenses/by/4.0/).

