EMD-Shannon Entropy-Based Methodology to Detect Incipient Damages in a Truss Structure


 ,
,  , ,
, ,
Abstract
Featured Application
Abstract
1. Introduction
2. Theoretical Background
2.1. Empirical Mode Decomposition (EMD)
- Detect the extrema points (local maximum and minimum points) of the original time signal .
- Connect the points estimated in (1), employing cubic-splines in order to obtain an upper- and lower-envelope. The average of both envelopes is assigned as , and it is subtracted from the original time signal to obtain a new time signal as follows:If does not satisfy the previous conditions (a) and (b), steps (1) and (2) are repeated until satisfies both conditions; then, is considered as the first IMF, defined as:
- Once the first frequency band or has been obtained, the signal is subtracted from the original time signal to calculate the residue signal as follows:
- Check if is a monotonic function, which would indicate that no more IMFs can be extracted. If is not a monotonic function, it has to be treated as the original time signal and repeat the steps (1) to (3) in order to estimate the other IMFs. The process is finished when becomes a monotonic function.
- Once the process is stopped, the original time signal is decomposed into intrinsic modes, IMFs, and the last residue as follows:
2.2. Ensemble Empirical Mode Decomposition (EEMD)
- Generate new time signals mixing the original time signal and different white-noise series as follows:where represents the number of trials.
- Decompose the new time signals generated in (1) using the EMD method described in Section 2.1.
- Compute a true IMF, indexed with , as followswhere the IMF indexed with for the trial is represented by . It is recommended that the number of trials be as large as possible in order to obtain a suitable result.
2.3 Complete Ensemble Empirical Mode Decomposition (CEEMD)
2.4. Shannon Entropy (SE)
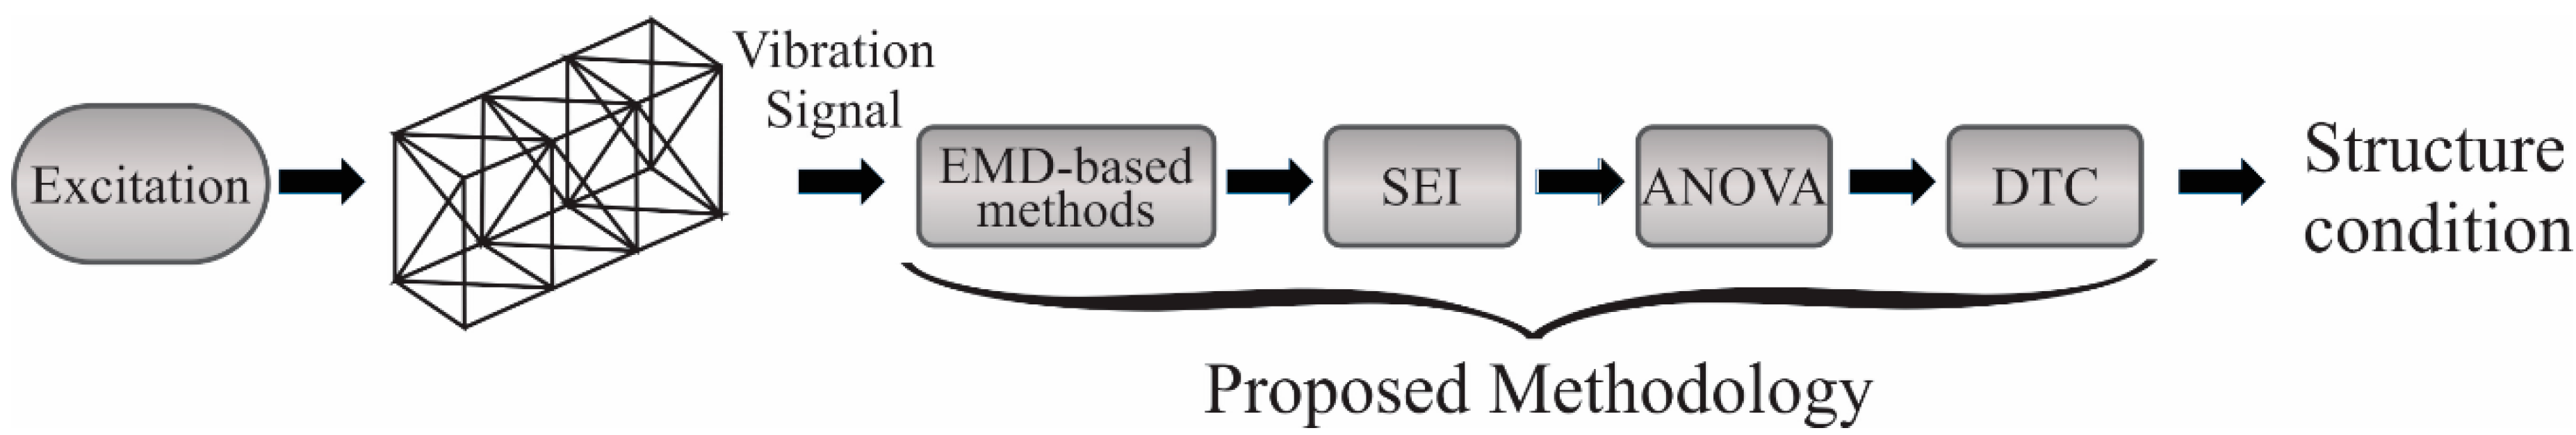
3. Methodology
4. Experimentation
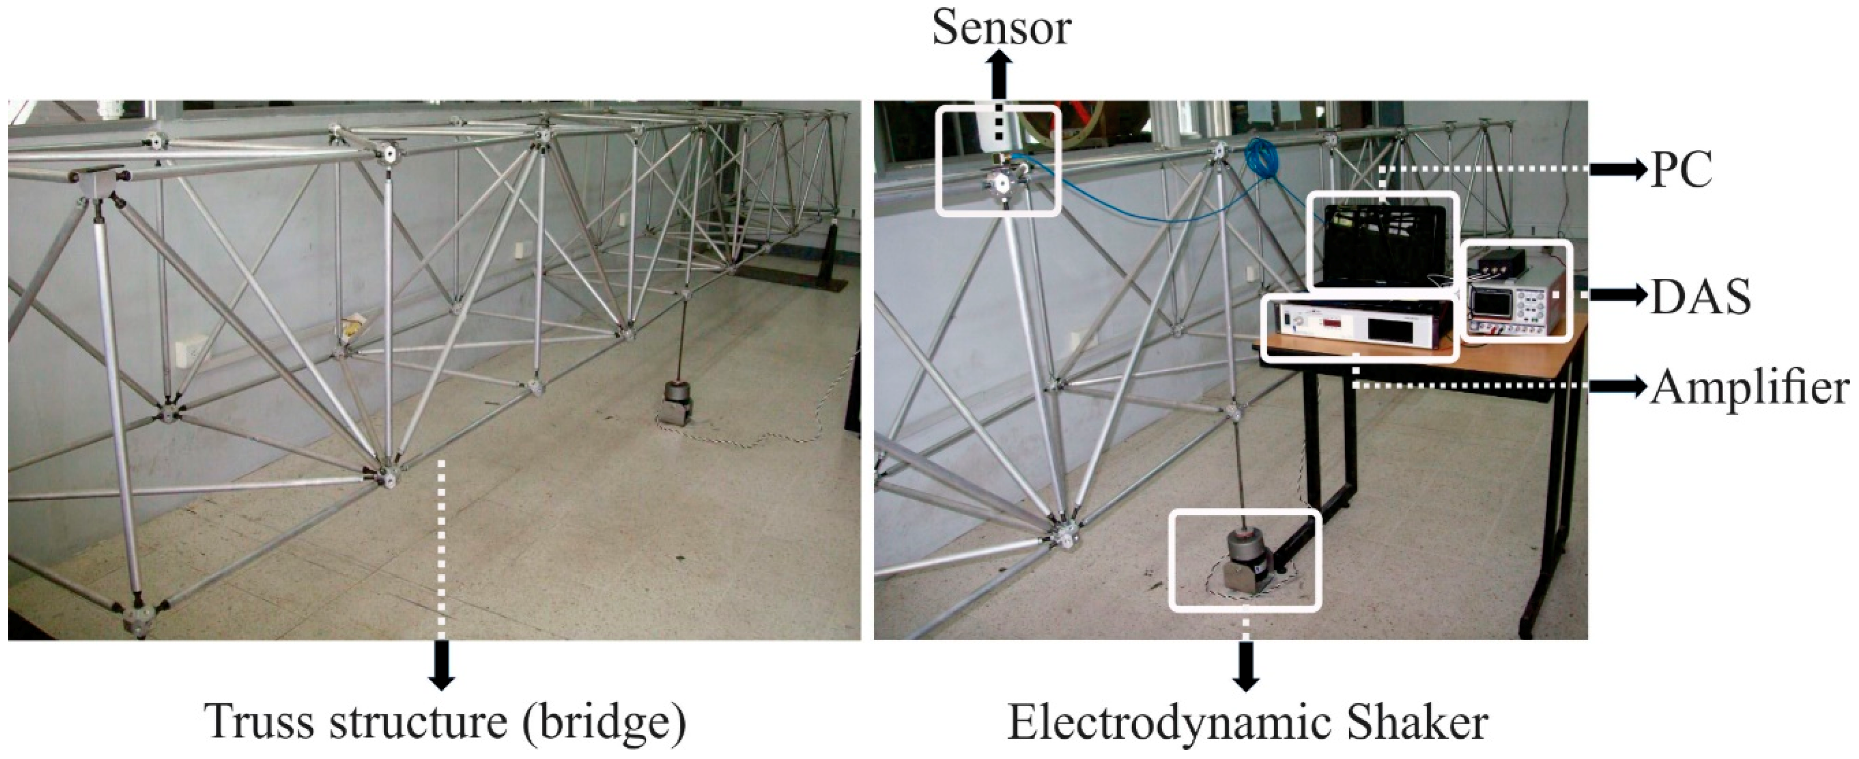
4.1. Experimental Setup
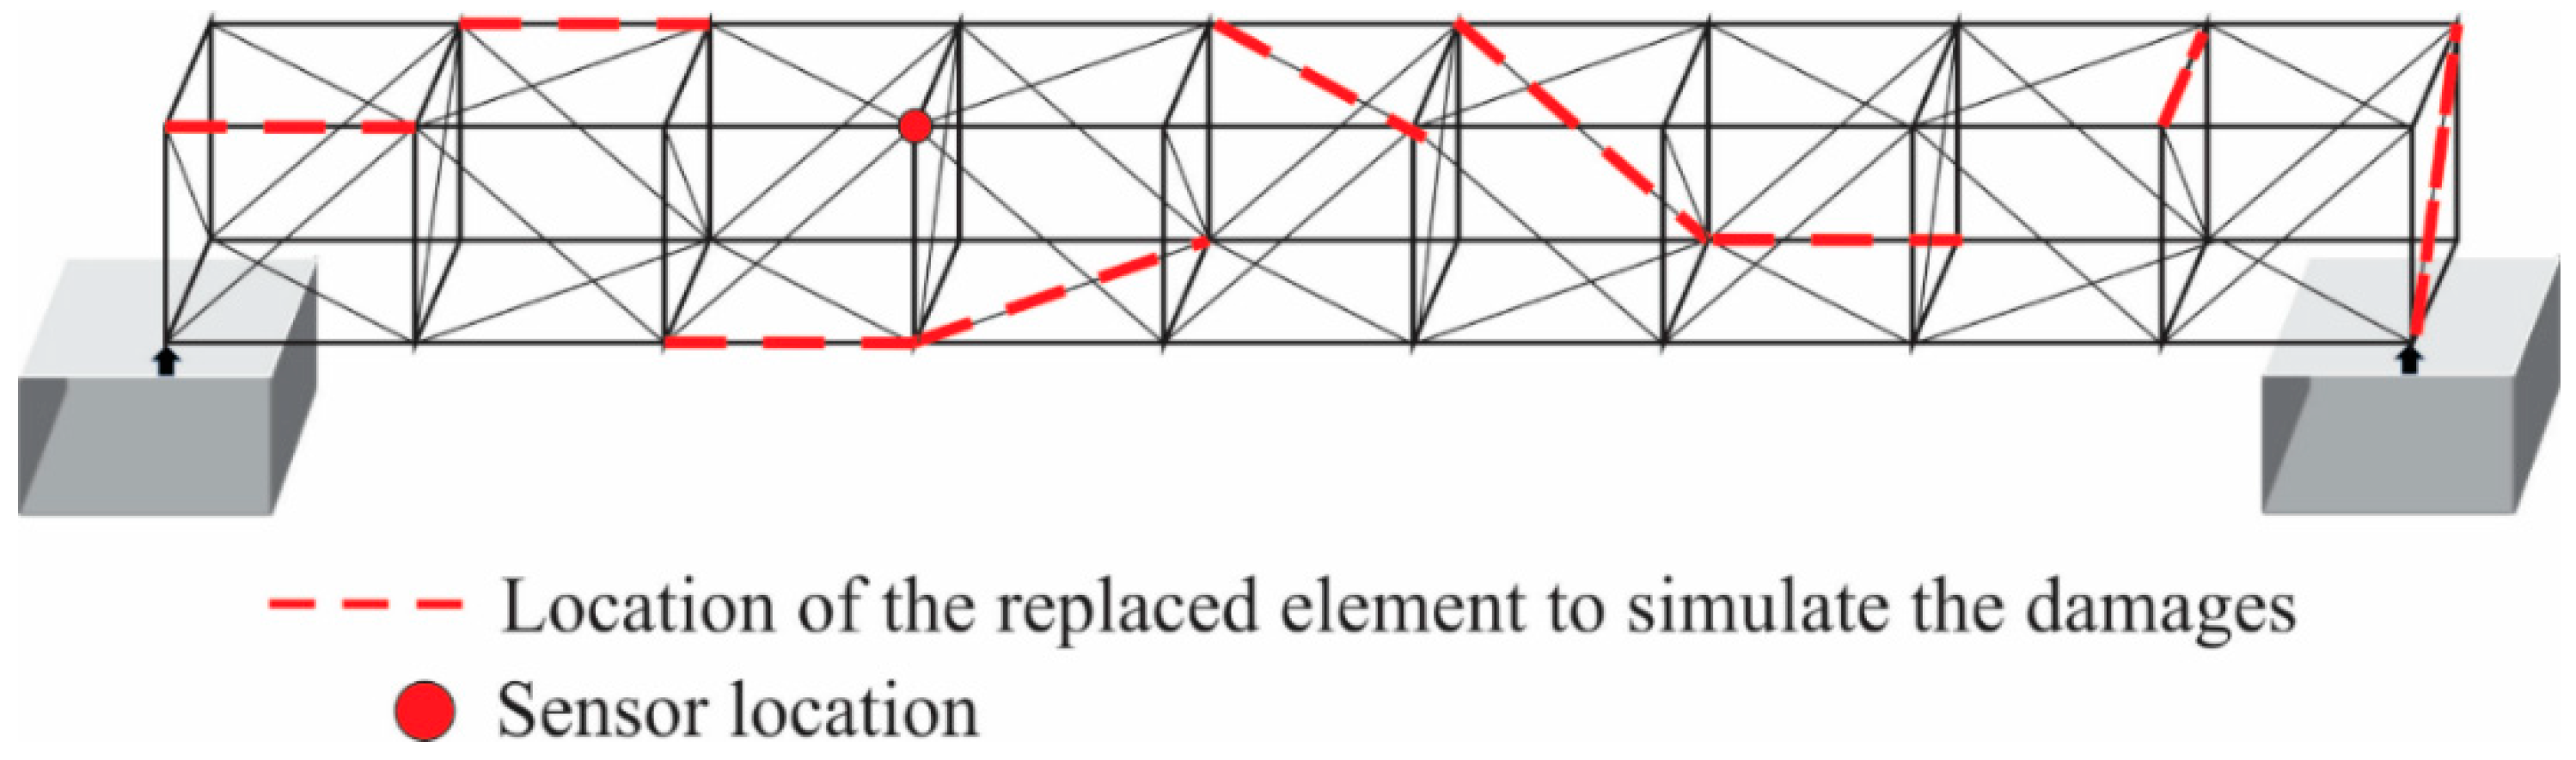
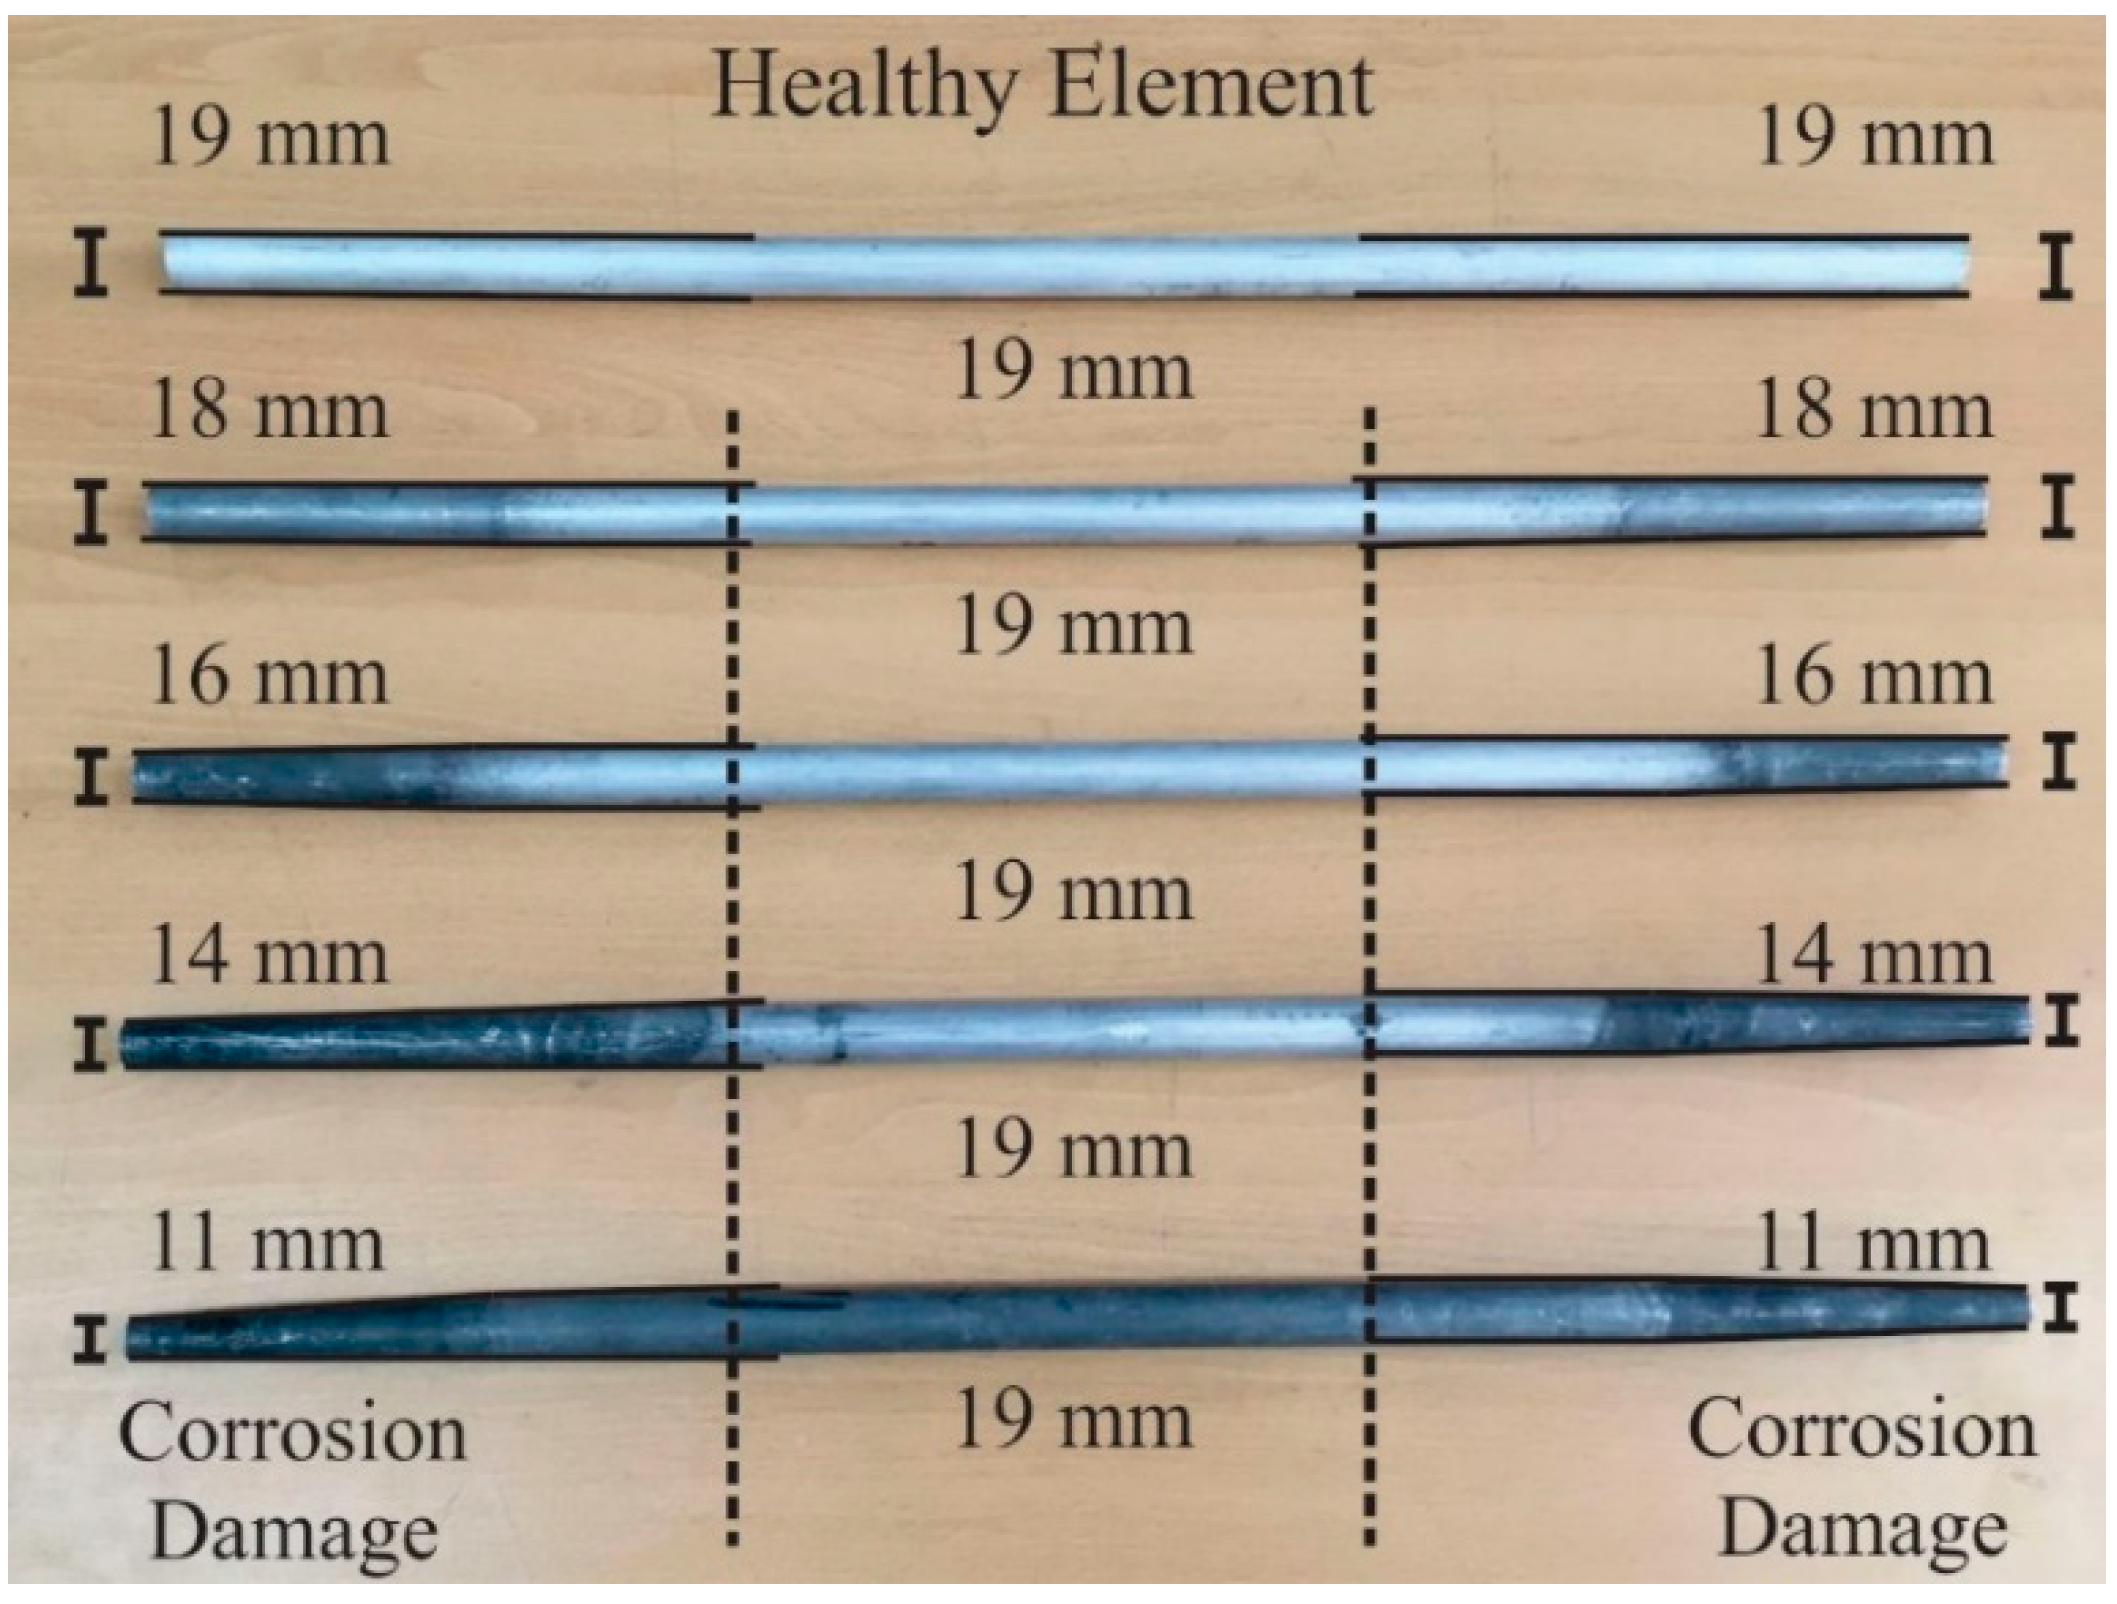
4.2. Study Cases
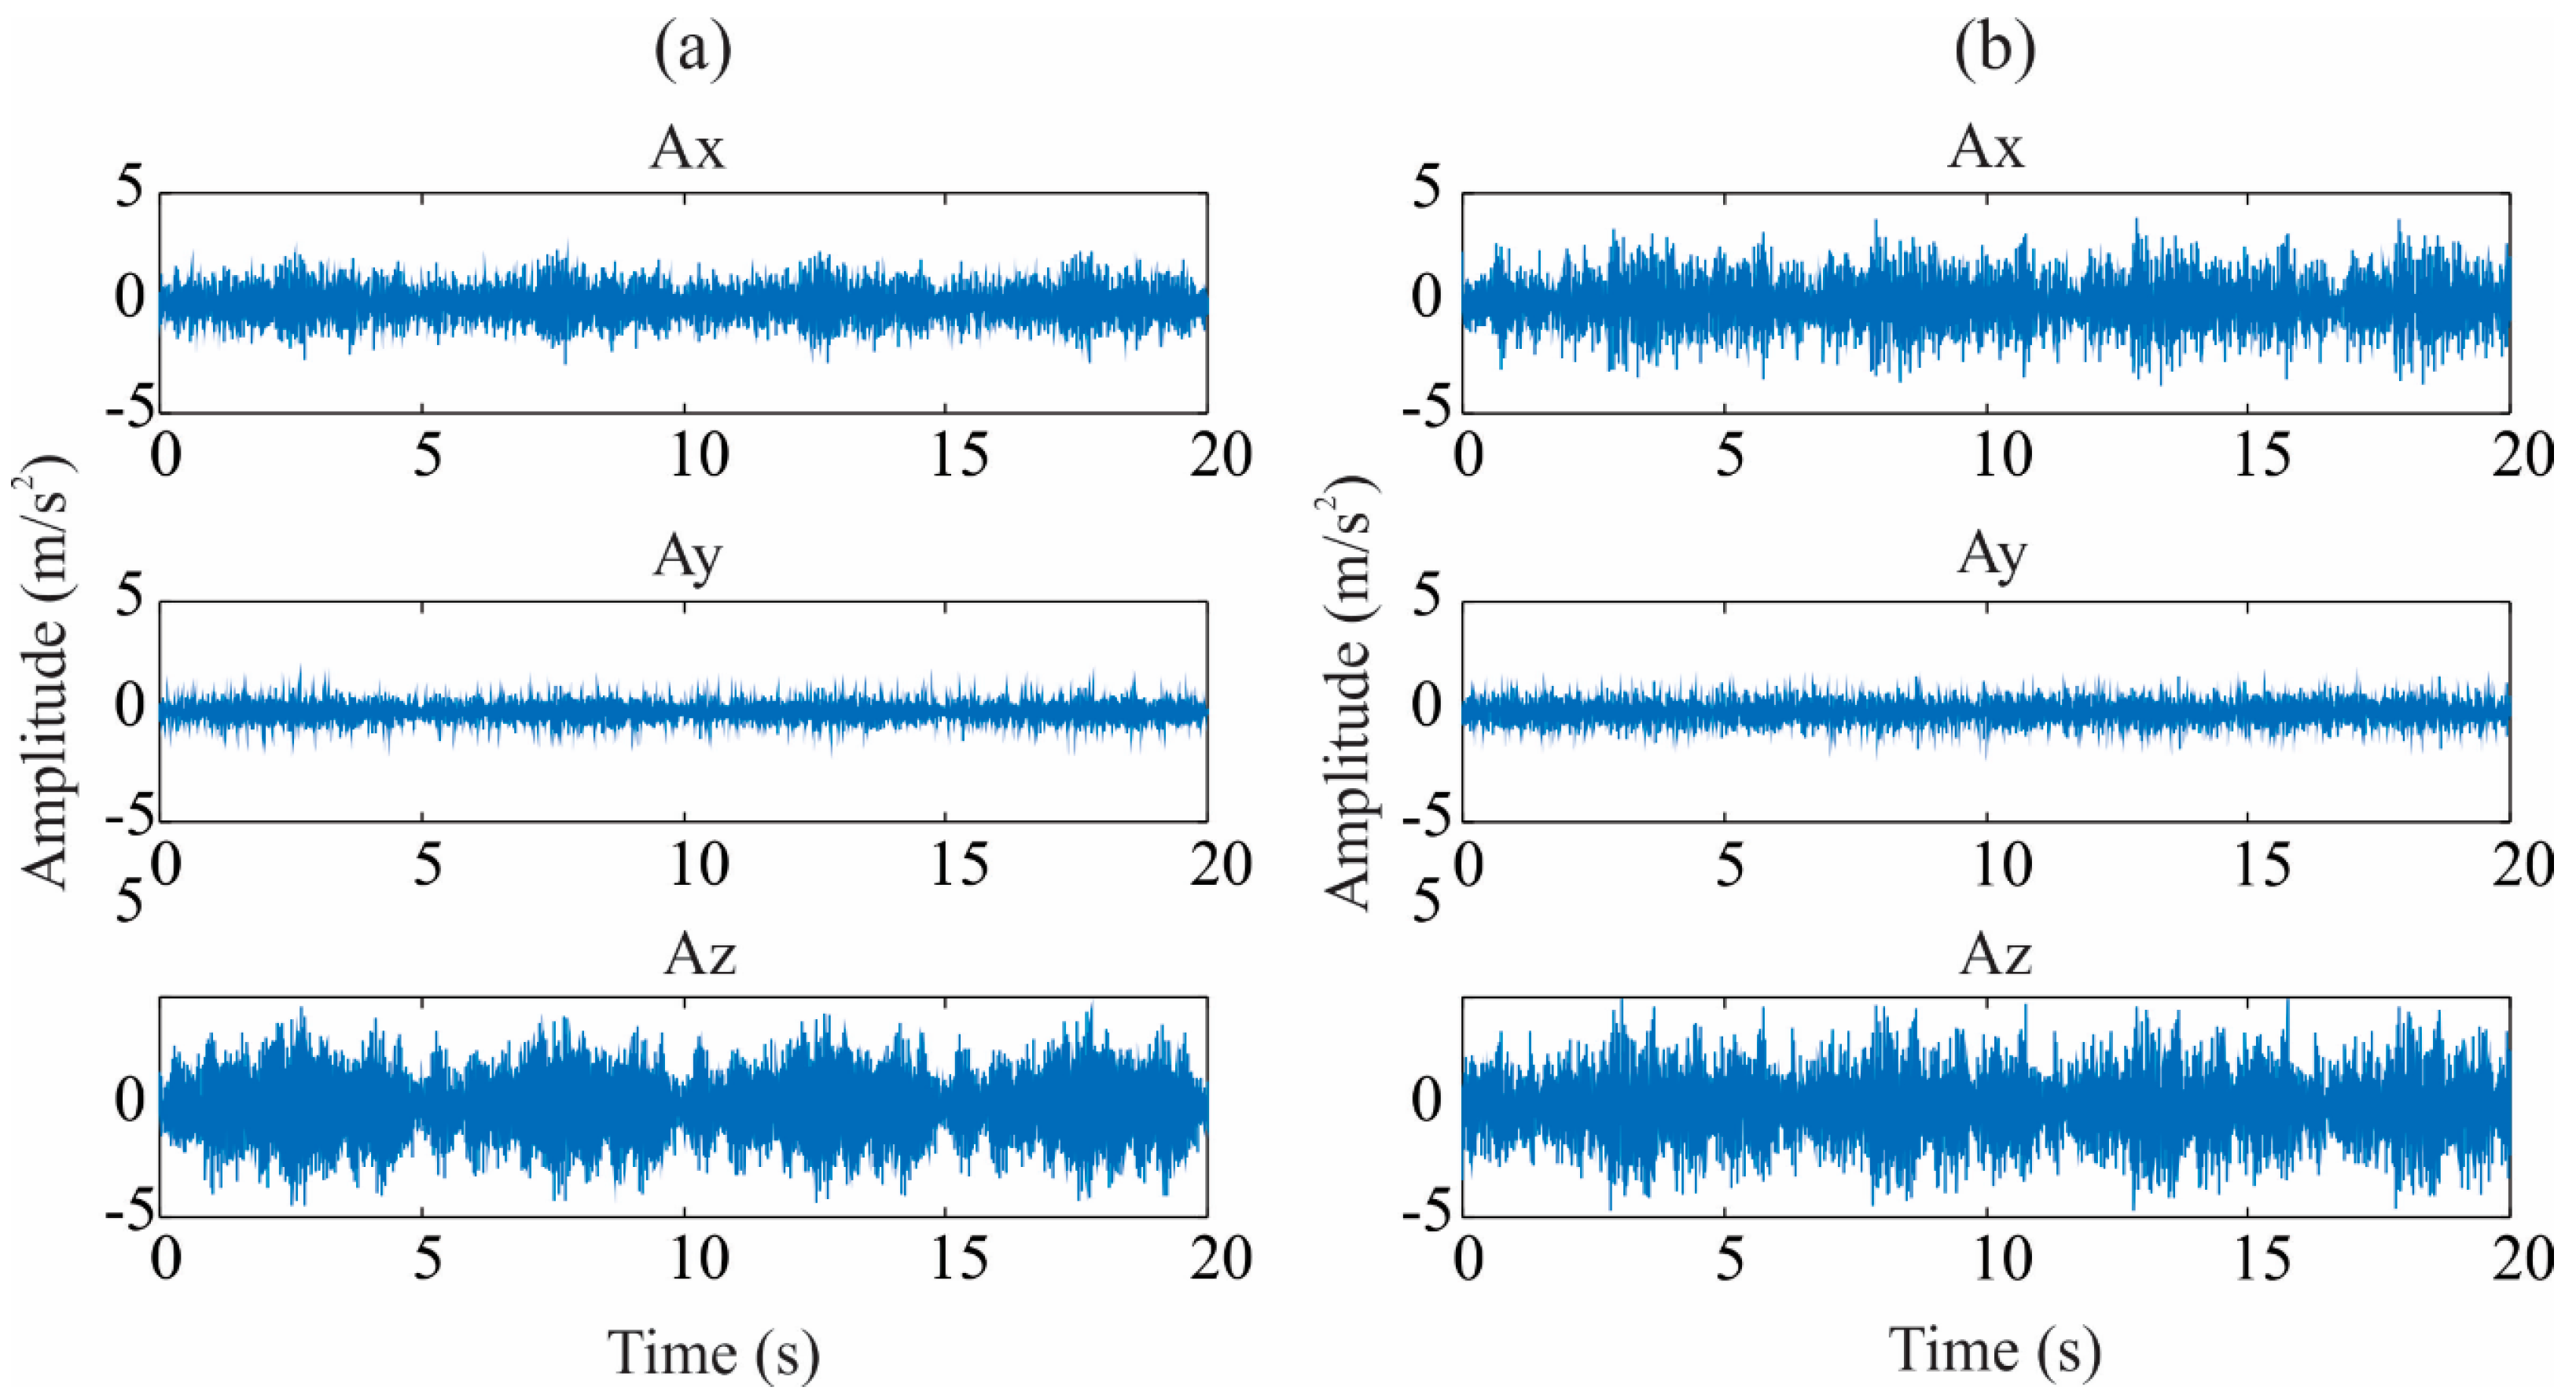
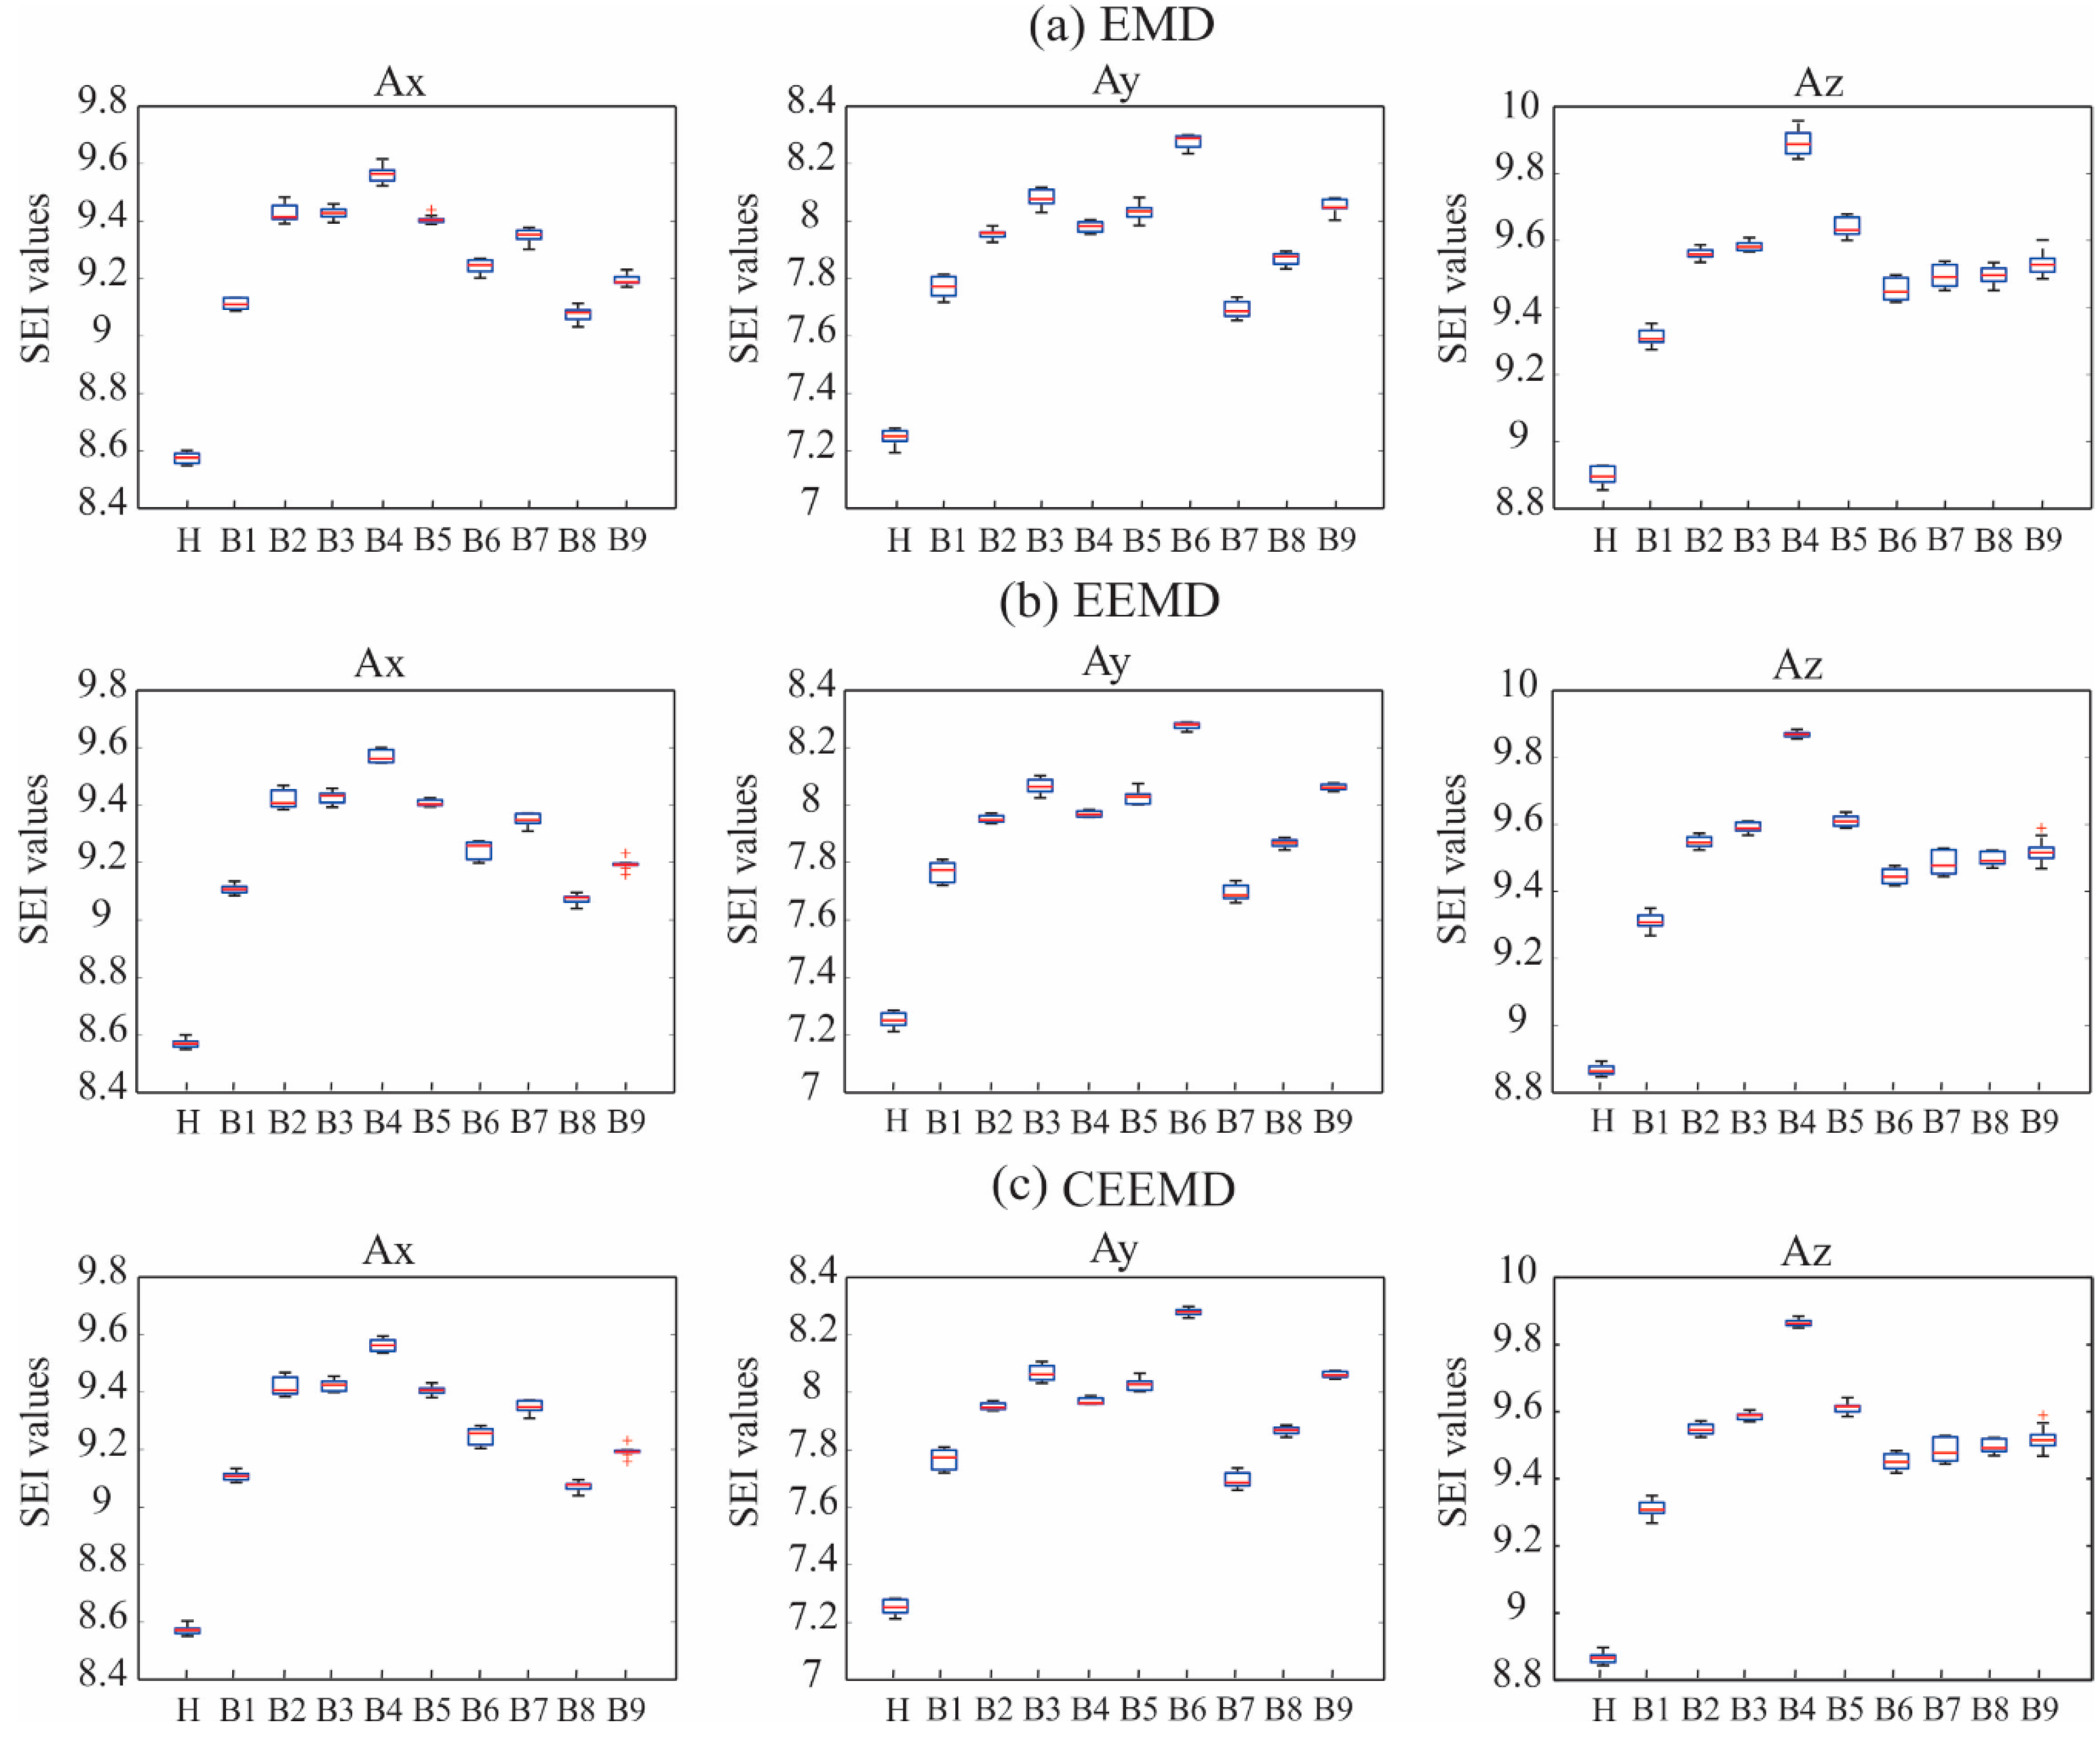
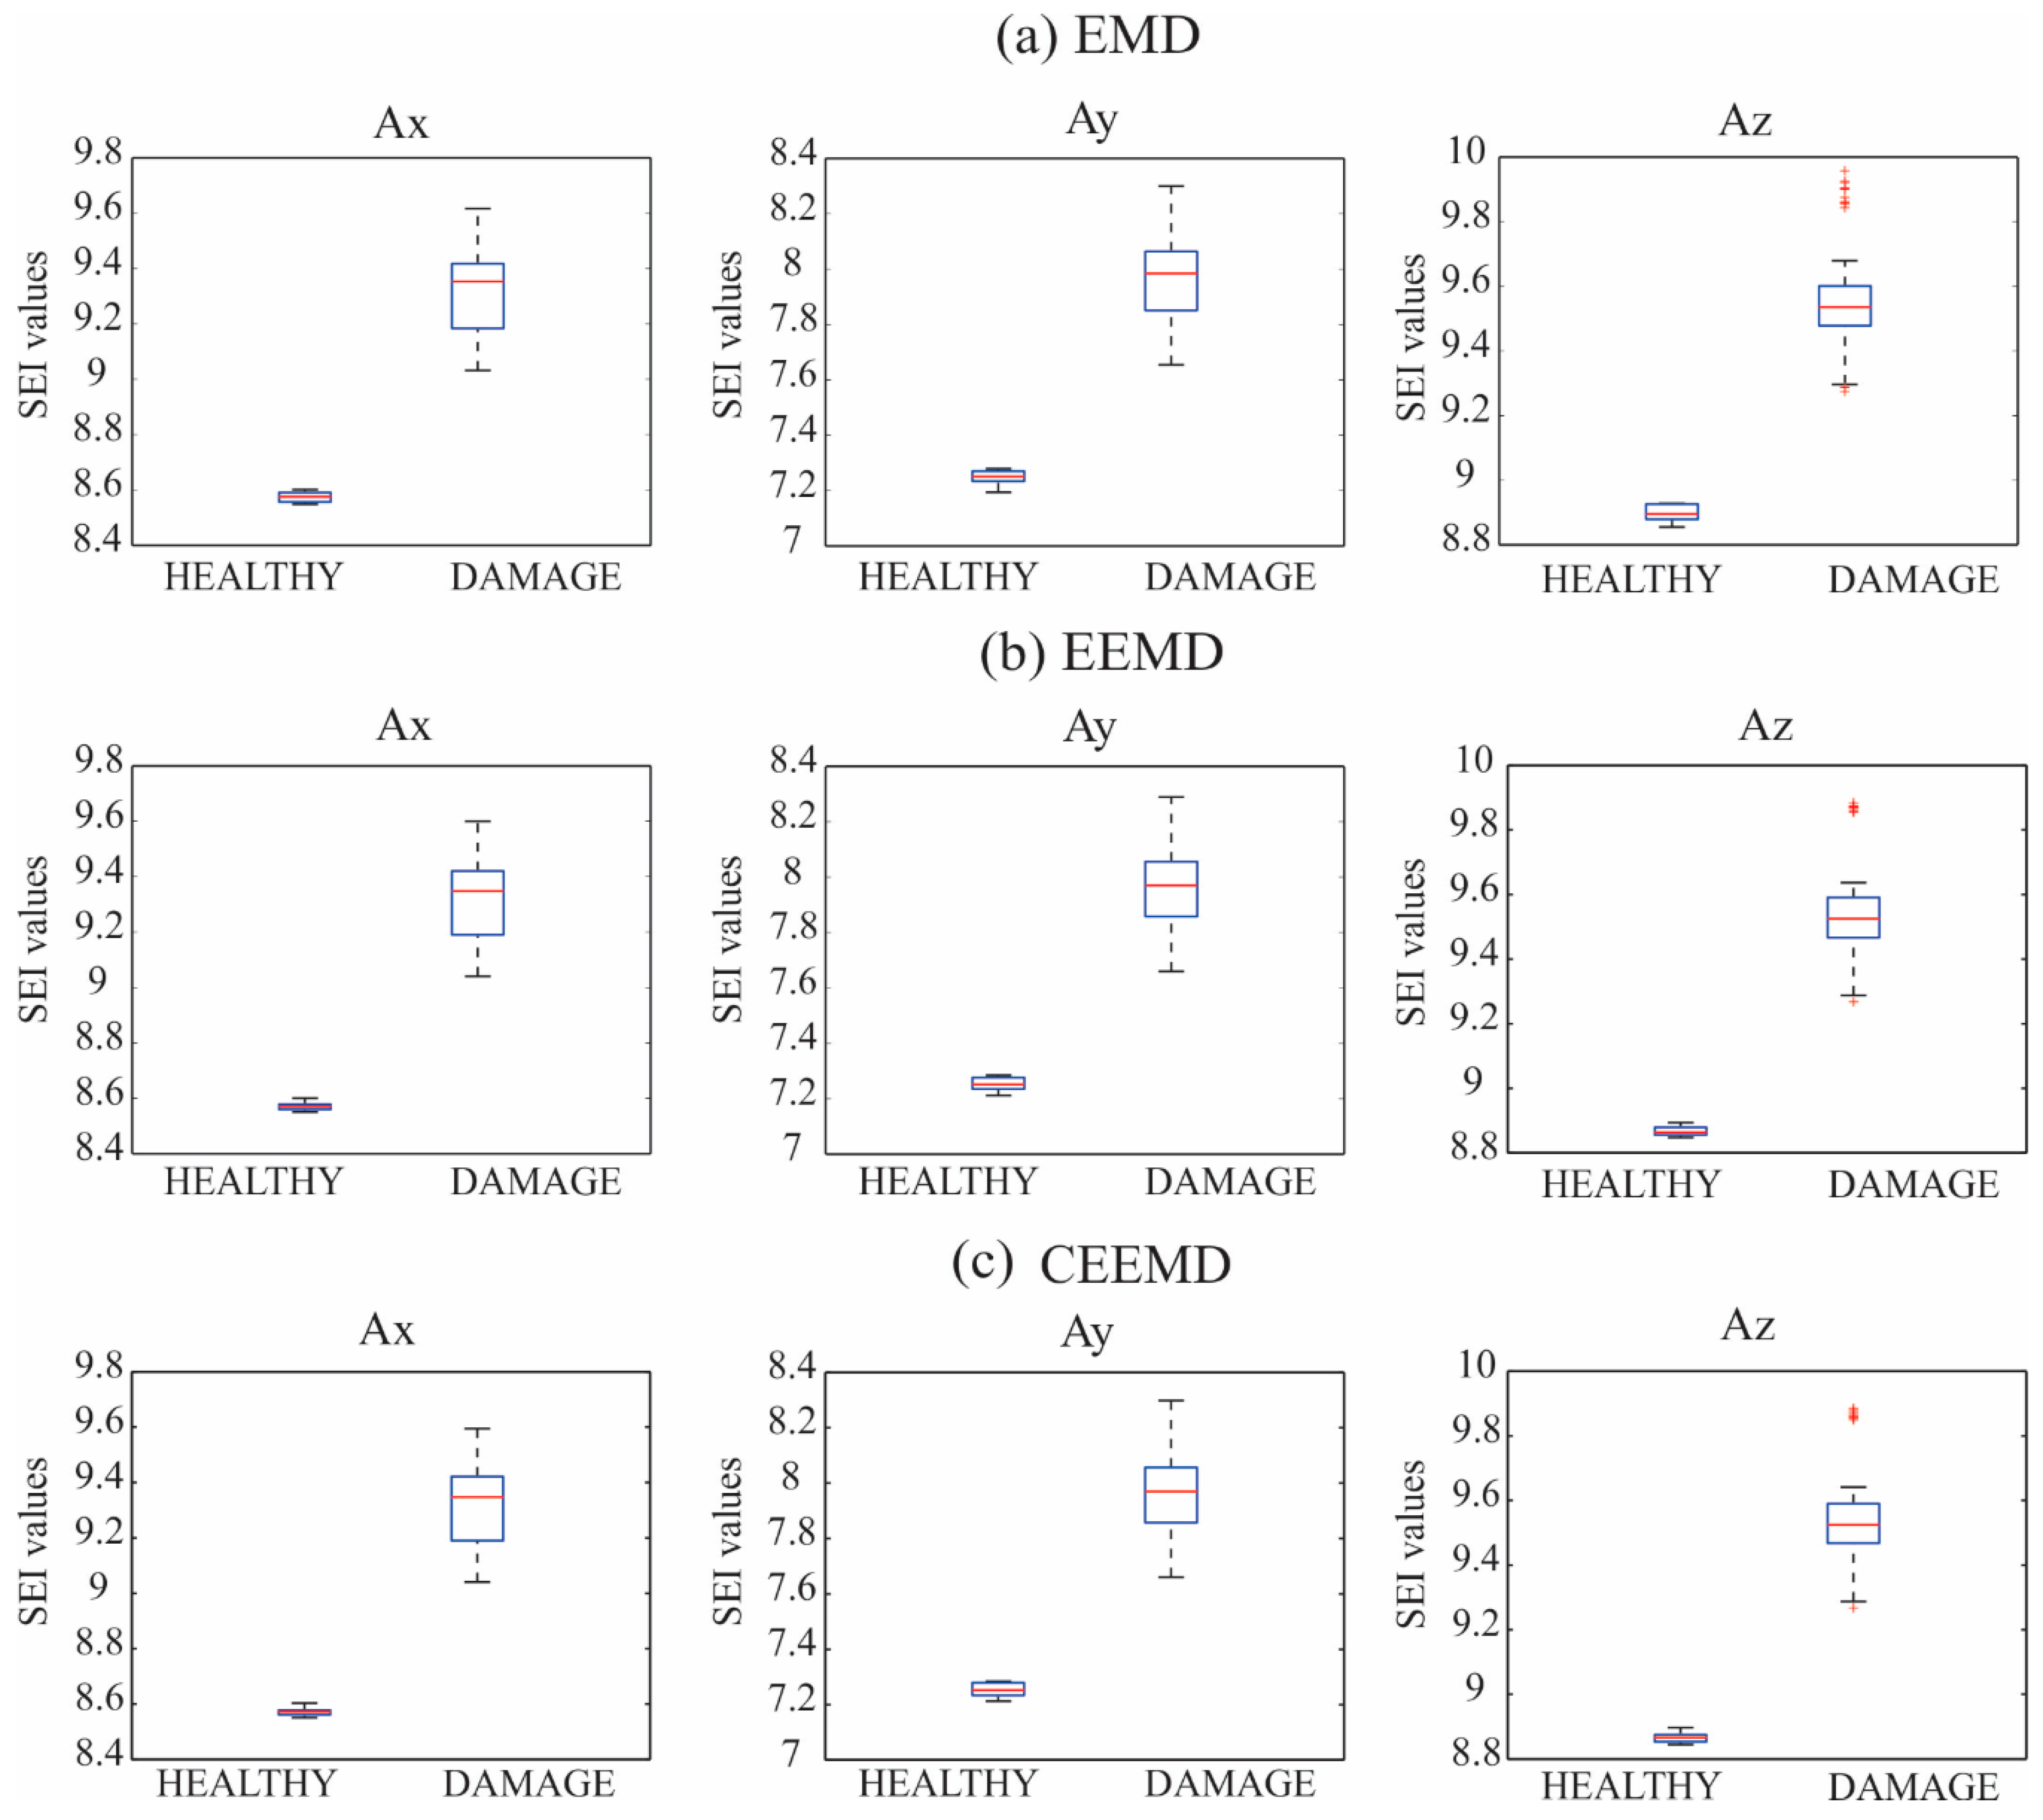
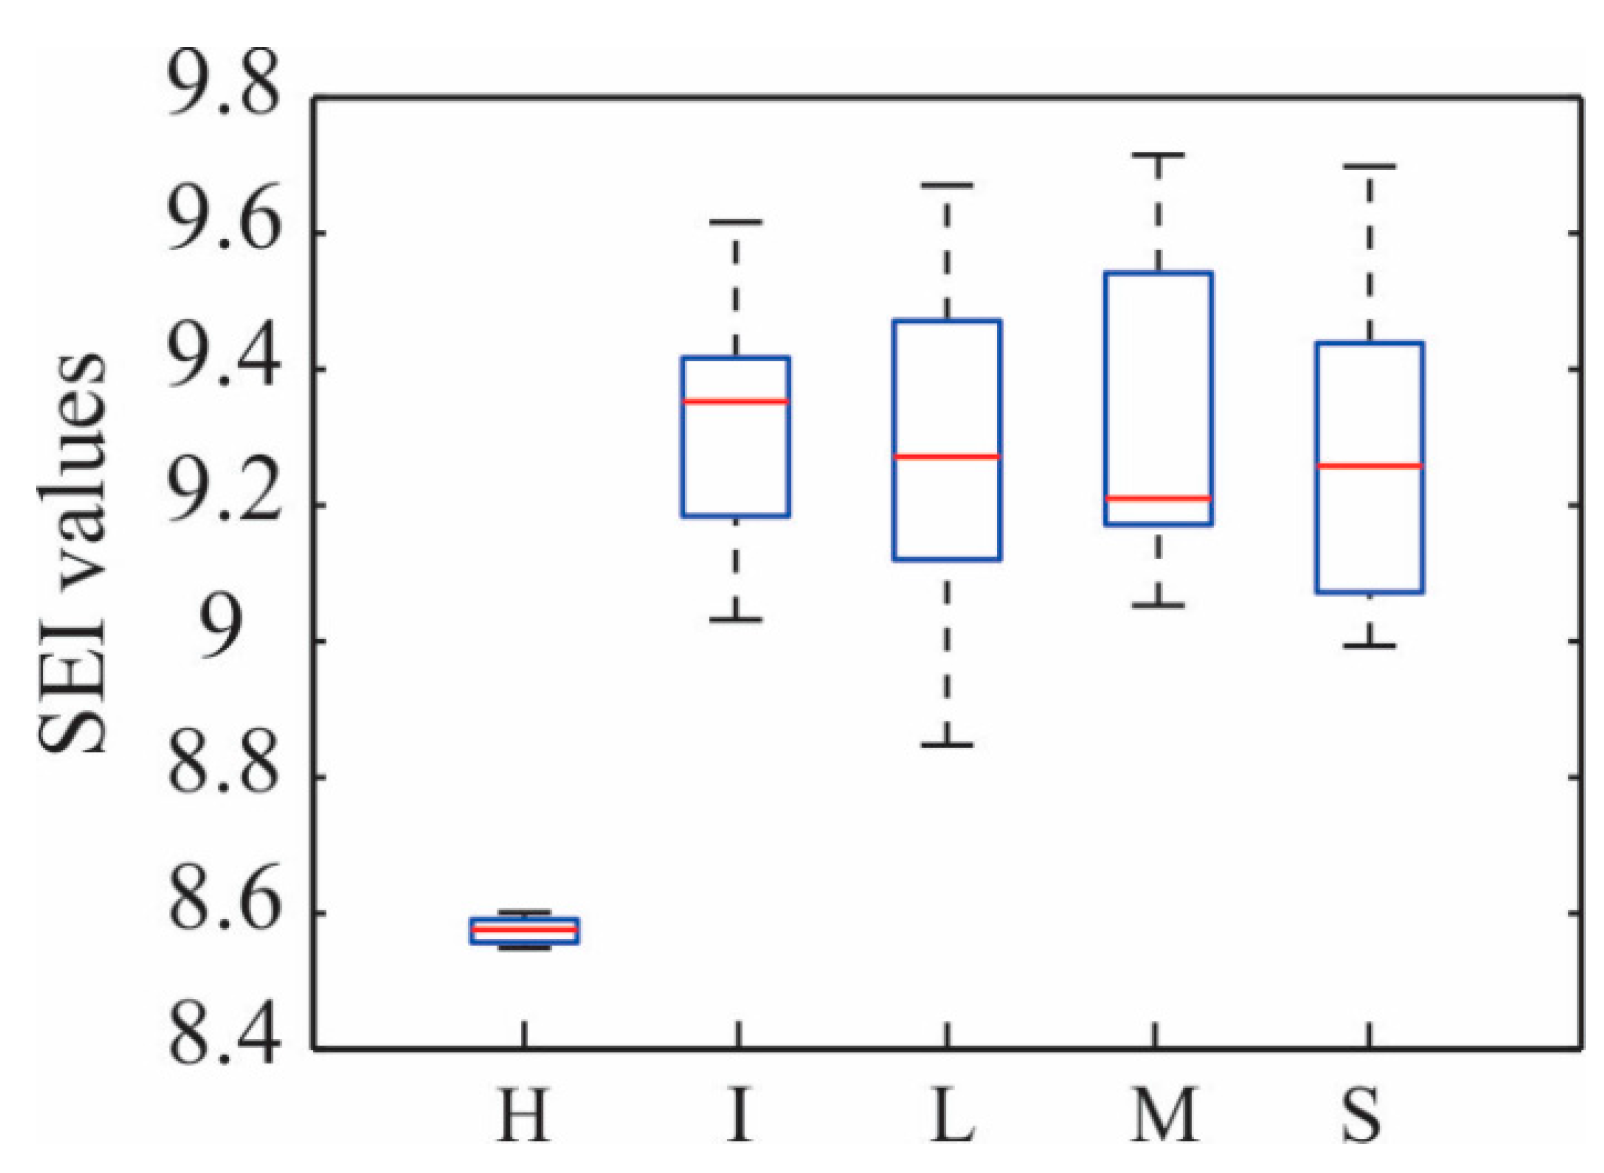
5. Results
6. Conclusions
Author Contributions
Funding
Conflicts of Interest
References
- Qarib, H.; Adeli, H. A new adaptive algorithm for automated feature extraction in exponentially damped signals for health monitoring of smart structures. Smart Mater. Struct. 2015, 24, 125040. [Google Scholar] [CrossRef]
- Rafiei, M.H.; Adeli, H. A novel machine learning-based algorithm to detect damage in high-rise building structures. Struct. Des. Tall Spec. Build. 2017, 26, e1400. [Google Scholar] [CrossRef]
- Osornio-Rios, R.A.; Amezquita-Sanchez, J.P.; Romero-Troncoso, R.J.; Garcia-Perez, A. MUSIC-ANN analysis for locating structural damages in a truss-type structure by means of vibrations. Comput. Aided Civ. Infrastruct. Eng. 2012, 27, 687–698. [Google Scholar] [CrossRef]
- Kim, C.W.; Chang, K.C.; Kitauchi, S.; McGetrick, P.J. A field experiment on a steel Gerber-truss bridge for damage detection utilizing vehicle-induced vibrations. Struct. Health Monit. 2016, 15, 174–192. [Google Scholar] [CrossRef]
- Blachowski, B.; An, Y.; Spencer, B.F., Jr.; Ou, J. Axial strain accelerations approach for damage localization in statically determinate truss structures. Comput. Aided Civ. Infrastruct. Eng. 2017, 32, 304–318. [Google Scholar] [CrossRef]
- Adeli, H.; Jiang, X. Intelligent Infrastructure: Neural Networks, Wavelets, and Chaos Theory for Intelligent Transportation Systems and Smart Structures; CRC Press: Boca Raton, FL, USA, 2009. [Google Scholar]
- Zhou, L.R.; Yan, G.R.; Ou, J.P. Response surface method based on radial basis functions for modeling large-scale structures in model updating. Comput. Aided Civ. Infrastruct. Eng. 2013, 28, 210–226. [Google Scholar] [CrossRef]
- Amezquita-Sanchez, J.P.; Valtierra-Rodriguez, M.; Adeli, H. Current efforts for prediction and assessment of natural disasters: Earthquakes, tsunamis, volcanic eruptions, hurricanes, tornados, and floods. Sci. Iran. 2017, 24, 2645–2664. [Google Scholar] [CrossRef]
- Park, H.S.; Lee, H.M.; Adeli, H.; Lee, I. A new approach for health monitoring of structures: Terrestrial laser scanning. Comput. Aided Civ. Infrastruct. Eng. 2007, 22, 19–30. [Google Scholar] [CrossRef]
- Nishikawa, T.; Yoshida, J.; Sugiyama, T.; Fujino, Y. Concrete crack detection by multiple sequential image filtering. Comput. Aided Civ. Infrastruct. Eng. 2012, 27, 29–47. [Google Scholar] [CrossRef]
- Higgins, C.; Turan, O.T. Imaging tools for evaluation of gusset plate connections in steel truss bridges. J. Bridge Eng. 2013, 18, 380–387. [Google Scholar] [CrossRef]
- Wolf, J.; Pirskawetz, S.; Zang, A. Detection of crack propagation in concrete with embedded ultrasonic sensors. Eng. Fract. Mech. 2005, 146, 161–171. [Google Scholar] [CrossRef]
- Yapar, O.; Basu, P.K.; Volgyesi, P.; Ledeczi, A. Structural health monitoring of bridges with piezoelectric AE sensors. Eng. Fail. Anal. 2015, 56, 150–169. [Google Scholar] [CrossRef]
- Zou, F.; Cegla, F.B. On quantitative corrosion rate monitoring with ultrasound. J. Electroanal. Chem. 2018, 812, 115–121. [Google Scholar] [CrossRef]
- Curadelli, R.O.; Riera, J.D.; Ambrosini, D.; Amani, M.G. Damage detection by means of structural damping identification. Eng. Struct. 2008, 30, 3497–3504. [Google Scholar] [CrossRef]
- Amezquita-Sanchez, J.P.; Adeli, H. Synchrosqueezed wavelet transform-fractality model for locating, detecting, and quantifying damage in smart highrise building structures. Smart Mater. Struct. 2015, 24, 065034. [Google Scholar] [CrossRef]
- Friesen, P.; Sadhu, A. Performance of tensor decomposition-based modal identification under nonstationary vibration. Smart Mater. Struct. 2017, 26, 035024. [Google Scholar] [CrossRef]
- Antunes, P.; Lima, H.; Varum, H.; André, P. Optical fiber sensors for static and dynamic health monitoring of civil engineering infrastructures: Abode wall case study. Measurement 2012, 45, 1695–1705. [Google Scholar] [CrossRef]
- Lee, E.T.; Rahmatalla, S.; Eun, H.C. Damage detection by mixed measurements using accelerometers and strain gages. Smart Mater. Struct. 2013, 22, 075014. [Google Scholar] [CrossRef]
- Demetgul, M.; Senyurek, V.Y.; Uyandik, R.; Tansel, I.N.; Yazicioglu, O. Evaluation of the health of riveted joints with active and passive structural health monitoring techniques. Measurement 2015, 69, 42–51. [Google Scholar] [CrossRef]
- Yang, Z.B.; Radzienski, M.; Kudela, P.; Ostachowicz, W. Fourier spectral-based modal curvature analysis and its application to damage detection in beams. Mech. Syst. Signal Process. 2016, 84, 763–781. [Google Scholar] [CrossRef]
- Shen, W.; Li, D.; Zhang, S.; Ou, J. Analysis of wave motion in one-dimensional structures through fast-Fourier-transform-based wavelet finite element method. J. Sound Vib. 2017, 400, 369–386. [Google Scholar] [CrossRef]
- Jiang, X.; Adeli, H. Pseudospectra, MUSIC, and dynamic wavelet neural network for damage detection of highrise buildings. Int. J. Numer. Methods Eng. 2007, 71, 606–629. [Google Scholar] [CrossRef]
- Zhong, Y.; Yuan, S.; Qiu, L. Multiple damage detection on aircraft composite structures using near-field MUSIC algorithm. Sens. Actuators A 2014, 214, 234–244. [Google Scholar] [CrossRef]
- Amezquita-Sanchez, J.P.; Park, H.S.; Adeli, H. A novel methodology for modal parameters identification of large smart structures using MUSIC, empirical wavelet transform, and Hilbert transform. Eng. Struct. 2017, 147, 148–159. [Google Scholar] [CrossRef]
- Roshan-Ghias, A.; Shamsollahi, M.B.; Mobed, M.; Behzad, M. Estimation of modal parameters using bilinear joint time—Frequency distributions. Mech. Syst. Signal Process. 2007, 21, 2125–2136. [Google Scholar] [CrossRef]
- Zoubi, A.; Mathews, V.; Harley, J.; Adams, D. Lamb Waves Mode Decomposition Using the Cross-wigner-ville Distribution. In Proceedings of the 10th International Workshop on Structural Health Monitoring, Stanford University, Stanford, CA, USA, 1–3 September 2015. [Google Scholar]
- Dong, Y.; Li, Y.; Lai, M. Structural damage detection using empirical-mode decomposition and vector autoregressive moving average model. Soil Dyn. Earthq. Eng. 2010, 30, 133–145. [Google Scholar] [CrossRef]
- Kim, Y.; Chong, J.W.; Chon, K.H.; Kim, J. Wavelet-based AR-SVM for health monitoring of smart structures. Smart Mater. Struct. 2013, 22, 015003. [Google Scholar] [CrossRef]
- Yao, R.; Pakzad, S.N. Damage and noise sensitivity evaluation of autoregressive features extracted from structure vibration. Smart Mater. Struct. 2014, 23, 025007. [Google Scholar] [CrossRef]
- Yu, L.; Zhu, J.H. Nonlinear damage detection using higher statistical moments of structural responses. Struct. Eng. Mech. 2015, 54, 221–237. [Google Scholar] [CrossRef]
- Chang, K.C.; Kim, C.W. Modal-parameter identification and vibration-based damage detection of a damaged steel truss bridge. Eng. Struct. 2016, 122, 156–173. [Google Scholar] [CrossRef]
- Adewuyi, A.P.; Wu, Z. Vibration-based damage localization in flexural structures using normalized modal macrostrain techniques from limited measurements. Comput. Aided Civ. Infrastruct. Eng. 2011, 26, 154–172. [Google Scholar] [CrossRef]
- Qiao, L.; Esmaeily, A.; Melhem, H.G. Signal pattern-recognition for damage diagnosis in structures. Comput. Aided Civ. Infrastruct. Eng. 2012, 27, 699–710. [Google Scholar] [CrossRef]
- Garcia-Perez, A.; Amezquita-Sanchez, J.P.; Dominguez-Gonzalez, A.; Sedaghati, R.; Osornio-Rios, R.A.; Romero-Troncoso, R.J. Fused empirical mode decomposition and wavelets for locating combined damage in a truss-type structure through vibration analysis. J. Zhejiang Univ. Sci. A 2013, 14, 615–630. [Google Scholar] [CrossRef]
- Spanos, P.D.; Giaralis, A.; Politis, N.P. Time-frequency representation of earthquake accelerograms and inelastic structural response records using the adaptive chirplet decomposition and empirical mode decomposition. Soil Dyn. Earthq. Eng. 2007, 27, 675–689. [Google Scholar] [CrossRef]
- Adeli, H.; Jiang, X. Dynamic fuzzy wavelet neural network model for structural system identification. J. Struct. Eng. 2006, 132, 102–111. [Google Scholar] [CrossRef]
- Jiang, X.; Ma, Z.J.; Ren, W.X. Crack detection from the slope of the mode shape using complex continuous wavelet transform. Comput. Aided Civ. Infrastruct. Eng. 2012, 27, 187–201. [Google Scholar] [CrossRef]
- Souza, P.R.; Nobrega, E.G. Lamb wave based damage detection and localization using two ring-shaped arrangement of piezo transducers. IFAC-PapersOnLine 2015, 48, 646–651. [Google Scholar] [CrossRef]
- Li, J.; Hao, H. Health monitoring of joint conditions in steel truss bridges with relative displacement sensors. Measurement 2016, 88, 360–371. [Google Scholar] [CrossRef]
- Yang, C.; Oyadiji, S.O. Damage detection using modal frequency curve and squared residual wavelet coefficients-based damage indicator. Mech. Syst. Signal Process. 2017, 83, 385–405. [Google Scholar] [CrossRef]
- Lu, Y.; Tang, J. On time-frequency domain feature extraction of wave signals for structural health monitoring. Measurement 2018, 114, 51–59. [Google Scholar] [CrossRef]
- Rafiei, M.H.; Adeli, H. A novel unsupervised deep learning model for global and local health condition assessment of structures. Eng. Struct. 2018, 156, 598–607. [Google Scholar] [CrossRef]
- Musafere, F.; Sadhu, A.; Liu, K. Time-Varying System Identification Using a Hybrid Blind Source Separation Method. In Structural Health Monitoring, Damage Detection & Mechatronics; Springer: Cham, Switzerland, 2016; Volume 7, pp. 99–104. [Google Scholar]
- Musafere, F.; Sadhu, A.; Liu, K. Towards damage detection using blind source separation integrated with time-varying auto-regressive modeling. Smart Mater. Struct. 2016, 25, 015013. [Google Scholar] [CrossRef]
- Chen, S.L.; Liu, J.J.; Lai, H.C. Wavelet analysis for identification of damping ratios and natural frequencies. J. Sound Vib. 2009, 323, 130–147. [Google Scholar] [CrossRef]
- Kodogiannis, V.S.; Amina, M.; Petrounias, I. A clustering-based fuzzy-wavelet neural network model for short-term load forecasting. Int. J. Neural Syst. 2013, 23, 1350024. [Google Scholar] [CrossRef] [PubMed]
- Hazra, B.; Sadhu, A.; Roffel, A.J.; Narasimhan, S. Hybrid time-frequency blind source separation towards ambient system identification of structures. Comput. Aided Civ. Infrastruct. Eng. 2012, 27, 314–332. [Google Scholar] [CrossRef]
- Razi, P.; Esmaeel, R.A.; Taheri, F. Application of a robust vibration-based non-destructive method for detection of fatigue cracks in structures. Smart Mater. Struct. 2011, 20, 115017. [Google Scholar] [CrossRef]
- Rezaei, D.; Taheri, F. Damage identification in beams using empirical mode decomposition. Struct. Health Monit. 2011, 10, 261–274. [Google Scholar] [CrossRef]
- Hsu, W.; Chiou, D.; Chen, C.; Liu, M.; Chiang, W.; Huang, P. Sensitivity of initial damage detection for steel structures using the Hilbert-Huang transform method. J. Vib. Control 2012, 19, 857–878. [Google Scholar] [CrossRef]
- Bao, C.; Hao, H.; Li, Z.X. Multi-stage identification scheme for detecting damage in structures under ambient excitations. Smart Mater. Struct. 2013, 22, 045006. [Google Scholar] [CrossRef]
- Liu, T.Y.; Chiang, W.L.; Chen, C.W.; Hsu, W.K.; Lu, L.C.; Chu, T.J. Identification and monitoring of bridge health from ambient vibration data. J. Vib. Control 2010, 17, 589–603. [Google Scholar] [CrossRef]
- Shi, W.; Shan, J.; Lu, X. Modal identification of Shanghai World Financial Center both from free and ambient vibration response. Eng. Struct. 2012, 36, 14–26. [Google Scholar] [CrossRef]
- Wu, W.H.; Chen, C.C.; Jhou, J.W.; Lai, G. A rapidly convergent empirical mode decomposition method for analyzing the environmental temperature effects on stay cable force. Comput. Aided Civ. Infrastruct. Eng. 2018, 33, 672–690. [Google Scholar] [CrossRef]
- Barbosh, M.; Sadhu, A.; Vogrig, M. Multisensor-based hybrid empirical mode decomposition method towards system identification of structures. Struct. Control Health Monit. 2018, 25, e2147. [Google Scholar] [CrossRef]
- Torres, M.E.; Colominas, M.A.; Schlotthauer, G.; Flandrin, P. A Complete Ensemble Empirical Mode Decomposition with Adaptive Noise. In Proceedings of the 2011 IEEE International Conference on Acoustics, Speech and Signal Processing (ICASSP), Prague, Czech Republic, 22–27 May 2011. [Google Scholar]
- An, Y.; Błachowski, B.; Zhong, Y.; Hołobut, P.; Ou, J. Rank-revealing QR decomposition applied to damage localization in truss structures. Struct. Control Health Monit. 2017, 24, e1849. [Google Scholar] [CrossRef]
- Huang, N.E.; Shen, Z.; Long, S.R.; Wu, M.C.; Shih, H.H.; Zheng, Q.; Liu, H.H. The empirical mode decomposition and the Hilbert spectrum for nonlinear and non-stationary time series analysis. Proc. R. Soc. Lond. A 1998, 454, 903–995. [Google Scholar] [CrossRef]
- Wu, Z.; Huang, N.E. Ensemble empirical mode decomposition: A noise-assisted data analysis method. Adv. Adapt. Data Anal. 2009, 1, 1–41. [Google Scholar] [CrossRef]
- Shannon, C.E. A mathematical theory of communication. Bell Syst. Tech. J. 1948, 27, 379–423. [Google Scholar] [CrossRef]
- Al-Sherrawi, M.H.; Lyashenko, V.; Edaan, E.M.; Sotnik, S. Corrosion as a source of destruction in construction. Int. J. Civ. Eng. Technol. 2018, 9, 306–314. [Google Scholar]
- Perez-Macias, F.J.; Perez-Ramirez, C.A.; Valtierra-Rodriguez, M.; Dominguez-Gonzalez, A.; Amezquita-Sanchez, J.P. Wavelet Transform-Fractal Dimension-Based Methodology for Damage Assessment in Truss Type Structures. In Proceedings of the 43rd Annual Conference of the IEEE Industrial Electronics Society, Beijing, China, 29 October–1 November 2017. [Google Scholar]
- Mejia-Barron, A.; Valtierra-Rodriguez, M.; Granados-Lieberman, D.; Olivares-Galvan, J.C.; Escalera-Perez, R. The application of EMD-based methods for diagnosis of winding faults in a transformer using transient and steady state currents. Measurement 2018, 117, 371–379. [Google Scholar] [CrossRef]
- Camarena-Martinez, D.; Valtierra-Rodriguez, M.; Garcia-Perez, A.; Osornio-Rios, R.A.; Romero-Troncoso, R.J. Empirical mode decomposition and neural networks on FPGA for fault diagnosis in induction motors. Sci. World J. 2014, 2014, 908140. [Google Scholar] [CrossRef] [PubMed]
- Cabal-Yepez, E.; Valtierra-Rodriguez, M.; Romero-Troncoso, R.J.; Garcia-Perez, A.; Osornio-Rios, R.A.; Miranda-Vidales, H.; Alvarez-Salas, R. FPGA-based entropy neural processor for online detection of multiple combined faults on induction motors. Mech. Syst. Signal Process. 2012, 30, 123–130. [Google Scholar] [CrossRef]


| Ax | Ay | Az | |||||||
|---|---|---|---|---|---|---|---|---|---|
| EMD | EEMD | CEEMD | EMD | EEMD | CEEMD | EMD | EEMD | CEEMD | |
| IMF1 | 8.63 × 10−98 | 1.32 × 10−97 | 6.29 × 10−98 | 2.65 × 10−91 | 2.17 × 10−91 | 4.38 × 10−91 | 1.47 × 10−91 | 1.43 × 10−97 | 3.55 × 10−98 |
| IMF2 | 1.13 × 10⁻¹³ | 2.86 × 10−09 | 2.46 × 10−05 | 5.68 × 10−04 | 0.00427 | 0.03355 | 2.64 × 10−06 | 7.36 × 10−07 | 6.25 × 10−07 |
| IMF3 | 4.45 × 10−61 | 1.95 × 10−69 | 3.46 × 10−65 | 3.47 × 10⁻²³ | 1.13 × 10−40 | 1.52 × 10−51 | 9.78 × 10−57 | 4.10 × 10−72 | 1.51 × 10⁻¹¹ |
| IMF4 | 1.31 × 10−65 | 7.14 × 10−74 | 2.52 × 10−63 | 1.60 × 10−49 | 1.26 × 10−63 | 3.46 × 10−62 | 4.55 × 10−55 | 2.85 × 10−54 | 2.33 × 10−81 |
| IMF5 | 2.13 × 10−83 | 2.54 × 10−85 | 7.99 × 10−37 | 1.17 × 10−50 | 1.32 × 10−58 | 8.75 × 10−50 | 1.45 × 10−44 | 2.16 × 10−55 | 8.96 × 10−51 |
| IMF6 | 3.48 × 10−73 | 5.46 × 10−88 | 2.73 × 10−92 | 3.22 × 10−40 | 7.19 × 10−49 | 5.38 × 10−38 | 3.31 × 10⁻³¹ | 1.25 × 10−43 | 1.35 × 10−45 |
| IMF7 | 6.18 × 10−56 | 9.47 × 10−45 | 3.84 × 10−57 | 3.34 × 10−43 | 4.24 × 10−45 | 9.73 × 10−48 | 2.40 × 10⁻¹⁶ | 2.73 × 10⁻²⁷ | 1.86 × 10−47 |
| Structure Condition | Healthy | Corrosion | Effectiveness (%) | |
|---|---|---|---|---|
| Healthy | 100 | 100 | 100 | |
| Corrosion | Incipient (1 mm reduction) | 100 | 100 | 100 |
| Light (3 mm reduction) | ||||
| Moderate (5 mm reduction) | ||||
| Severe (8 mm reduction) | ||||
| Total Effectiveness | 100% | |||
© 2018 by the authors. Licensee MDPI, Basel, Switzerland. This article is an open access article distributed under the terms and conditions of the Creative Commons Attribution (CC BY) license (http://creativecommons.org/licenses/by/4.0/).
Share and Cite
Moreno-Gomez, A.; Amezquita-Sanchez, J.P.; Valtierra-Rodriguez, M.; Perez-Ramirez, C.A.; Dominguez-Gonzalez, A.; Chavez-Alegria, O. EMD-Shannon Entropy-Based Methodology to Detect Incipient Damages in a Truss Structure. Appl. Sci. 2018, 8, 2068. https://doi.org/10.3390/app8112068
Moreno-Gomez A, Amezquita-Sanchez JP, Valtierra-Rodriguez M, Perez-Ramirez CA, Dominguez-Gonzalez A, Chavez-Alegria O. EMD-Shannon Entropy-Based Methodology to Detect Incipient Damages in a Truss Structure. Applied Sciences. 2018; 8(11):2068. https://doi.org/10.3390/app8112068
Chicago/Turabian StyleMoreno-Gomez, Alejandro, Juan P. Amezquita-Sanchez, Martin Valtierra-Rodriguez, Carlos A. Perez-Ramirez, Aurelio Dominguez-Gonzalez, and Omar Chavez-Alegria. 2018. "EMD-Shannon Entropy-Based Methodology to Detect Incipient Damages in a Truss Structure" Applied Sciences 8, no. 11: 2068. https://doi.org/10.3390/app8112068
APA StyleMoreno-Gomez, A., Amezquita-Sanchez, J. P., Valtierra-Rodriguez, M., Perez-Ramirez, C. A., Dominguez-Gonzalez, A., & Chavez-Alegria, O. (2018). EMD-Shannon Entropy-Based Methodology to Detect Incipient Damages in a Truss Structure. Applied Sciences, 8(11), 2068. https://doi.org/10.3390/app8112068