Article

Linking the Effect of Aggregate Interaction to the Compaction Theory for Asphalt Mixtures Using Image Processing

1
R&D Institute, Kolon Global Corporation, 32 Songdogwahak-ro, Yeonsu-gu, Incheon 21984, Korea
2
Wisconsin Department of Transportation, 3502 Kinsman Blvd, Madison, WI 53704, USA
*
Author to whom correspondence should be addressed.
Appl. Sci. 2018, 8(11), 2045; https://doi.org/10.3390/app8112045
Submission received: 14 September 2018 / Revised: 15 October 2018 / Accepted: 22 October 2018 / Published: 25 October 2018
(This article belongs to the Section Materials Science and Engineering)

Abstract

:
This study presents a modified compaction concept of asphalt mixtures based on aggregate frictional behavior using self-developed image processing for measuring the aggregate orientation. The compaction energy index was introduced to evaluate the aggregate orientation on different compaction temperatures. For the better rearrangement of aggregates, there was an optimum temperature at which a preferred orientation exists, providing lower compaction efforts. An excessively high temperature reduced the asphalt contents for lubrication and caused additional aggregate friction to require higher compaction efforts. This phenomenon can be found in the changes of the volume of the effective asphalt binder (Veac) and the absorbed asphalt binder (Pba). The mixture produced higher Veac, at which an optimum compaction temperature required lower compaction energy. Despite being higher than the optimum temperature for the PG62-28 mixture, the Veac decreased by 0.4%. An increase of 0.35% in the Pba was inferred to flow into the aggregates. Clearly, a reduction of lubricant in the mixture caused a higher frictional interaction between aggregates. Changes in the Veac and the Pba can eliminate the viscosity effect for the rearrangement of aggregates. Based on the aggregate orientation and change in mixture volumetrics, the aggregate interaction effect was introduced to the Mohr–Coulomb compaction theory to explain the additional friction.

1. Introduction

There is overwhelming evidence regarding the significance of the fabric of asphalt mixtures, which is referred to as the internal structure of asphalt mixtures, on the compaction of asphalt pavements. With respect to material properties, the internal structure of asphalt mixtures is influenced by asphalt binder type, aggregate gradation, and aggregate shape/texture [1,2,3,4,5,6,7,8,9,10,11,12]. In compaction circumstances, the behavior of asphalt mixtures depends on compaction methods, tools, and temperatures [6,13,14,15,16,17,18]. The importance of internal structure in asphalt mixtures has been recognized by experimental researchers in that the internal structure of an asphalt mixture affects not only the compaction performance but also the pavement performance and distresses such as rutting, fatigue, and thermal cracking [18,19,20,21,22,23,24,25].
As a part of the Strategic Highway Research Program (SHRP) study for a new asphalt mixture design, the adoption of the Superpave Gyratory Compaction (SGC) method, which is a convenient way of assessing the compaction process of asphalt mixtures, shows pavement technologists to volumetrically characterize asphalt mixtures and its constituents on a more rational basis [26,27,28]. Asphalt mixtures consist mainly of an asphalt binder, aggregate, and air voids. However, intensive efforts have been devoted to improve the properties of asphalt binders [28,29,30,31,32]. Since the aggregates in asphalt mixtures are over 90% by mass, the aggregates play an important role in the compaction of asphalt mixtures, as well as in determining the mechanical behavior of the asphalt pavement. The response of aggregates during compaction depends on the compaction temperature and applied pressure by rollers [17,33,34]. Accordingly, the internal structure of an asphalt mixture has been indirectly determined by investigating the preferred aggregate orientation, interface contact between aggregate and binder, and adhesive characteristics between aggregates [4,5,15,35,36,37,38,39,40,41,42,43]. In order to explain the compaction mechanism in an asphalt mixture, it is necessary to investigate the behavior of aggregates in the mixtures. However, it is difficult to define a simple compaction concept of asphalt mixture related to the behavior of aggregates.
Although previous research focused on linking the internal structure of asphalt mixture to the engineering properties of each constituent of mixture, changing not only the material types as well as the compaction methods, limited information is currently available on the internal structure of asphalt mixtures. Nevertheless, Masad et al. [38] firstly introduced asphalt–aggregate responses into a well-established structure of asphalt mixture along with compaction conditions. For characterizing the macrostructure of asphalt mixtures, in terms of the orientation and distribution of the aggregate as well as the distribution of air voids, many of the internal structure studies employed the image processing technique and X-ray tomography as tools to measure and quantify the distribution or orientation of aggregate and air voids from an analysis of photographed images of asphalt mixtures [1,2,8,15,22,35,38,40,41,42,43,44,45]. According to Azari et al. [28], there is the preferred tendency for aggregate orientation and distribution up to a certain compaction effort (loading pressure), and the optimum asphalt binder viscosity makes it possible for aggregates to be uniformly distributed and preferably oriented. In addition, the brittleness of the binder leading to the fatigue can be decreased by the compensation of a preferred orientation in aggregates. They found that aggregates in the mixture also can be rearranged according to the magnitude and duration of loading. Onifade et al. [40] investigated the microstructure between adjacent aggregates of asphalt mixture, and reported that the morphological properties (shape, angularity, and texture of aggregates) can determine the load transfer between aggregate particles at contact and the bonding at the interface between the mastic and aggregate particles. These properties were captured using the X-ray CT and image processing software.
Recently, image processing has been widely used to assess the engineering properties of asphalt mixtures and determine a better combination of compaction circumstances by the analysis of the internal structure of asphalt mixture [1,6,7,8,15,22,38,40,41,42,43,44,45]. However, most subjects of study on image analysis are coarse aggregates. This could be caused by two reasons. One is assuming that coarser aggregates primarily govern the movement of particles during the compaction process. As the aggregate in the mixture gets coarser, mixtures are expected to require more energy due to the increase in internal friction and resistance to compact. However, finer aggregates that are less than 5 mm in either fine or coarse gradation take possession of at least 40% of the total aggregate weight. In addition, the finer mixtures offer higher internal frictional resistance up to a certain density than coarse mixtures based on the observation of eccentricity for measuring the shear resistance of an asphalt mixture in the gyratory compactor [27]. There is a hypothesis to explain this phenomenon in which the interparticle contact points increase as particle size decreases, resulting in reduced space for the movement of particles. Therefore, it is therefore to consider many finer aggregates in asphalt mixtures so that the parameters measured regarding the image process can more accurately reflect the shear strength and stiffness of mixtures with varying aggregate sizes. The other is due to the difficulty associated with a clear distinction between aggregate and asphalt binder during the image process. With 256 levels of gray scale, it is difficult to choose a threshold that can define an aggregate or asphalt binder because of the aggregate colors being higher or lower than a given threshold. Gray-scale variations on the captured image depend on the mineral components of the aggregates. Therefore, if a given point of an aggregate has a darker threshold value, the analysis program will assign it as an asphalt binder, and thus background.
The purposes of this paper were to: present a summary of the development of image processing that can solve difficulties such as the selection of threshold and separation between aggregate contacts; indirectly determine how compactive efforts can be consumed due to aggregate interaction; and investigate the relationship between the volumetrics and aggregate rearrangement of an asphalt mixture. Image processing was used to investigate the internal structure of an asphalt mixture in terms of the aggregate orientation and explain the effect of aggregate interactions in the compaction theory of asphalt mixture. In addition, this study dealt with the role of asphalt viscosity, which affects the volumetric change in mixtures directly related to aggregate behavior. Based on this approach, the effect of aggregate interaction was introduced to Mohr–Coulomb (M–C) compaction theory. The energy efforts to densify an asphalt mixture were used as amendments to assess the effect of aggregate interaction during the compaction of an asphalt mixture.

2. Compaction Theories and Compactability in Asphalt Mixtures

A compaction theory with a mathematical equation was firstly initiated to obtain the measurable parameters characterizing the compaction process of asphalt mixtures. Compaction resistance was introduced into the equation with mathematical terms [46]. The physical assumption is that the increase in density dρ, which is achieved by the compaction work dS, is proportional to the compaction potential. The compaction is the difference between the current density and a theoretical maximum density that is achieved after infinite compaction work. If the proportional constant is set to 1/C, the following equation can be found:
  d ρ d S = 1 C ( ρ ρ 0 )  
By solving Equation (1) using the initial condition ρ0 = ρ(S = 0), an exponential equation describing the compaction process is obtained:
  ρ ( S ) = ρ ( ρ ρ 0 ) · e S C  
where ρ(S) = current density as a function of compaction work (kg/m3), S = compaction work (Nm), ρ = calculated maximum density (ρ(S→∞)), ρ0 = initial density (ρ(S = 0)), and C = compaction resistance (Nm). It assumes constant temperature in the material during the entire compaction process. The compaction process for Equation (2) is presented in Figure 1. The influence of temperature on the coefficient of the exponential compaction equation was introduced in two principally different ways. In the first case, if the mix is easy to compact, the same maximum compaction level (ρ) is reached even at a lower temperature, but the compaction resistance will increase considerably. In the second case, if the mix is very difficult to compact, the compaction resistance remains constant; instead, the final compaction level decreases as the temperature decreases. Consequently, the compaction of typical mixes results in both decreasing the maximum density and increasing the compaction resistance as the temperature decreases. In order to estimate the compaction resistance at a temperature that is not examined experimentally, a mathematical relationship between the compaction temperature and the compaction resistance was introduced with a reference temperature of 135 °C. However, to estimate the effects on temperature is generally ambiguous when using a modified asphalt binder.
Based on the expected similarity between the asphalt mixture and the granular material, the compaction of the asphalt mixture was characterized by means of the parameters τ and ϕ (according to the Mohr–Coulomb theory for granular materials). In addition, the parameter η to capture the viscous component of the asphalt mixture was introduced. It was assumed that the resistance against deformation of the asphalt mixture could be represented by three physical quantities such as the angle of internal friction (ϕ), the initial resistance (τ), and the viscosity of the mass (η), which denotes the influence of the viscosity on the shear resistance of the asphalt mixtures. This latter parameter takes into account that the position of the Mohr–Coulomb failure line depends on the viscosity of the mass, and thus on the temperature of the material or loading time (Figure 2). Later on, De Sombre et al. [29] assessed the effects of several mixture characteristics on their compaction parameters to determine the asphalt mixture temperature range in which the desired density can be achieved using the Mohr–Coulomb theory. However, it is also difficult to explain the compaction process in that the asphalt binder stiffness can be changed at different loading and temperature conditions. Thus, the compaction theories above are quite simple, but have some difficulty in explaining the material properties and compaction conditions.
A number of compaction indices were developed in the United States (US) to quantitatively evaluate the compactibility of an asphalt mixture since adopting the SGC method. Compaction indices such as the compaction energy index (CEI) and the compaction force index (CFI) were used as amendments to assess compaction processes [17,26,27]. SGC compaction produces a densification curve to determine the volumetric properties of an asphalt mixture, as shown in Figure 3. CEI can be calculated by the area, which is from density at 8 gyration to 92% of maximum specific gravity (Gmm,max) in the curve. CEI represents the work by roller up to 92% Gmm in the field. In addition, SGC compaction also produces a resistive effort curve using the Gyratory Load Cell Plate Assembly on the mixture to measure compaction resistance. CFI is defined as the area under the resistive effort curve representing the amount of work for compaction to 92% Gmm. Mixtures with lower CEI and CFI values allow easier compaction in the field. The purpose of the compaction index is not to fully address and investigate compaction theory so far, but it is recognized as a useful and practical tool for the evaluation of compaction of asphalt mixtures.

3. Image Processing Technique Used

The image processing technique has been widely used as a non-destructive method to assess two, three, or even four-dimensional phenomena in biology, medicine, and material sciences. Recently, in civil engineering, this technique has been used to quantitatively analyze the microstructure and aggregate characteristics of asphalt mixtures, as well as the distribution of construction composite materials such as steel fiber-reinforced concrete in tunnel linings. Several image processing techniques that characterize volumetric relationship and aggregate properties in asphalt mixtures can be found in the literature for studying the internal structures of asphalt mixtures, and those studies present how to develop and improve the image processing technique for their own purposes. Some of the previous studies used commercial programs such as iPas, Image Pro Plus, and ImageJ [4,8,9,13,15,19,22,38,41], while some developed the image processing using MATLAB or Visual C++ software to compensate the error for their own purposes in analysis [6,16,20,35,40,42,44,45]. Developing image processing performs two main steps: image processing and analysis. In image processing, an image undergoes manipulation before processing to enhance the original image. Then, the image is segmented as a binary image to separate into objects and background. For this study, in order to obtain a high-quality image that identifies the aggregates from the asphalt mixture in the image, the following functions were used: image enhancements with filtering, threshold with the edge detection, morphological operations, and splitting.

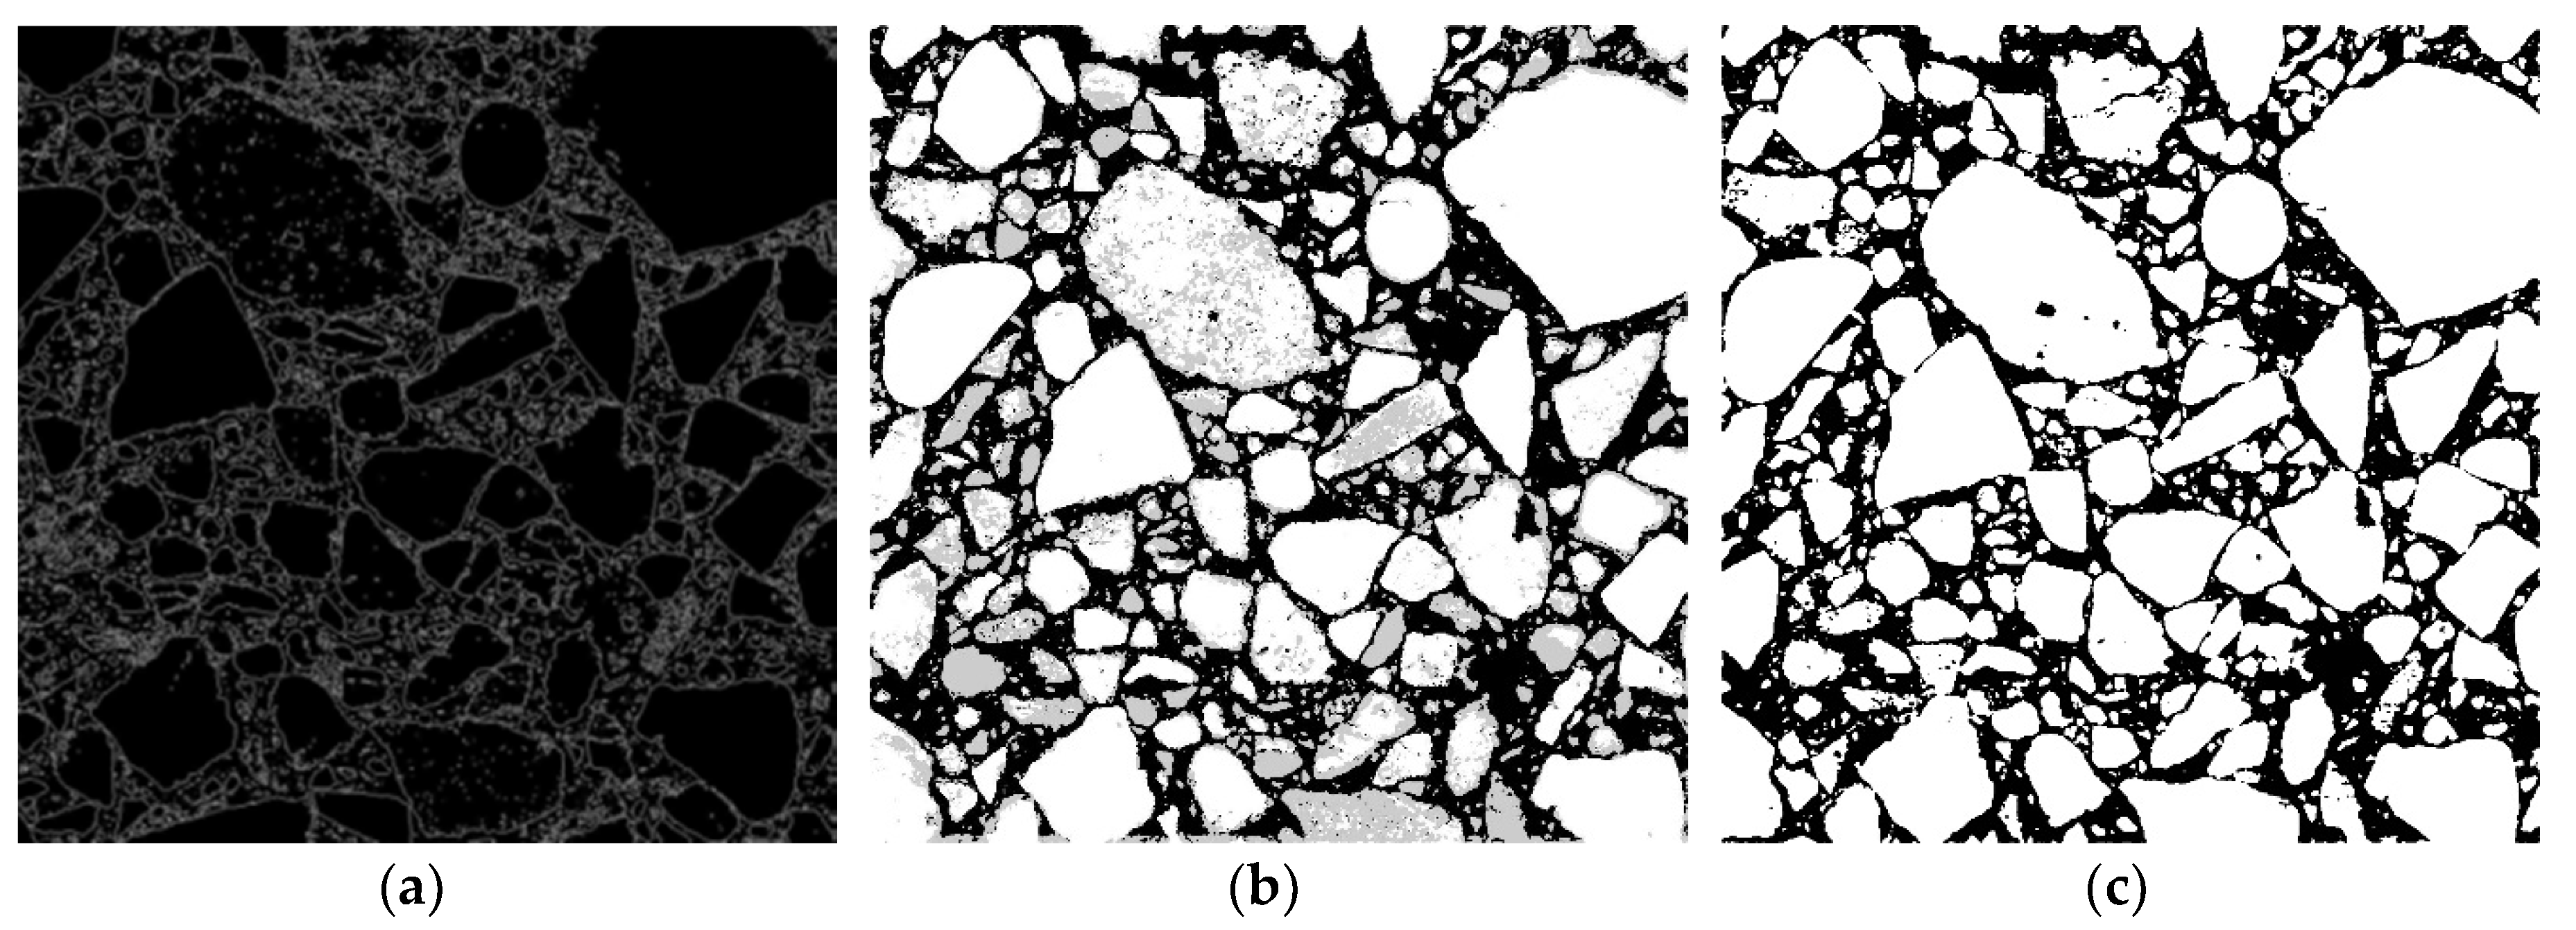
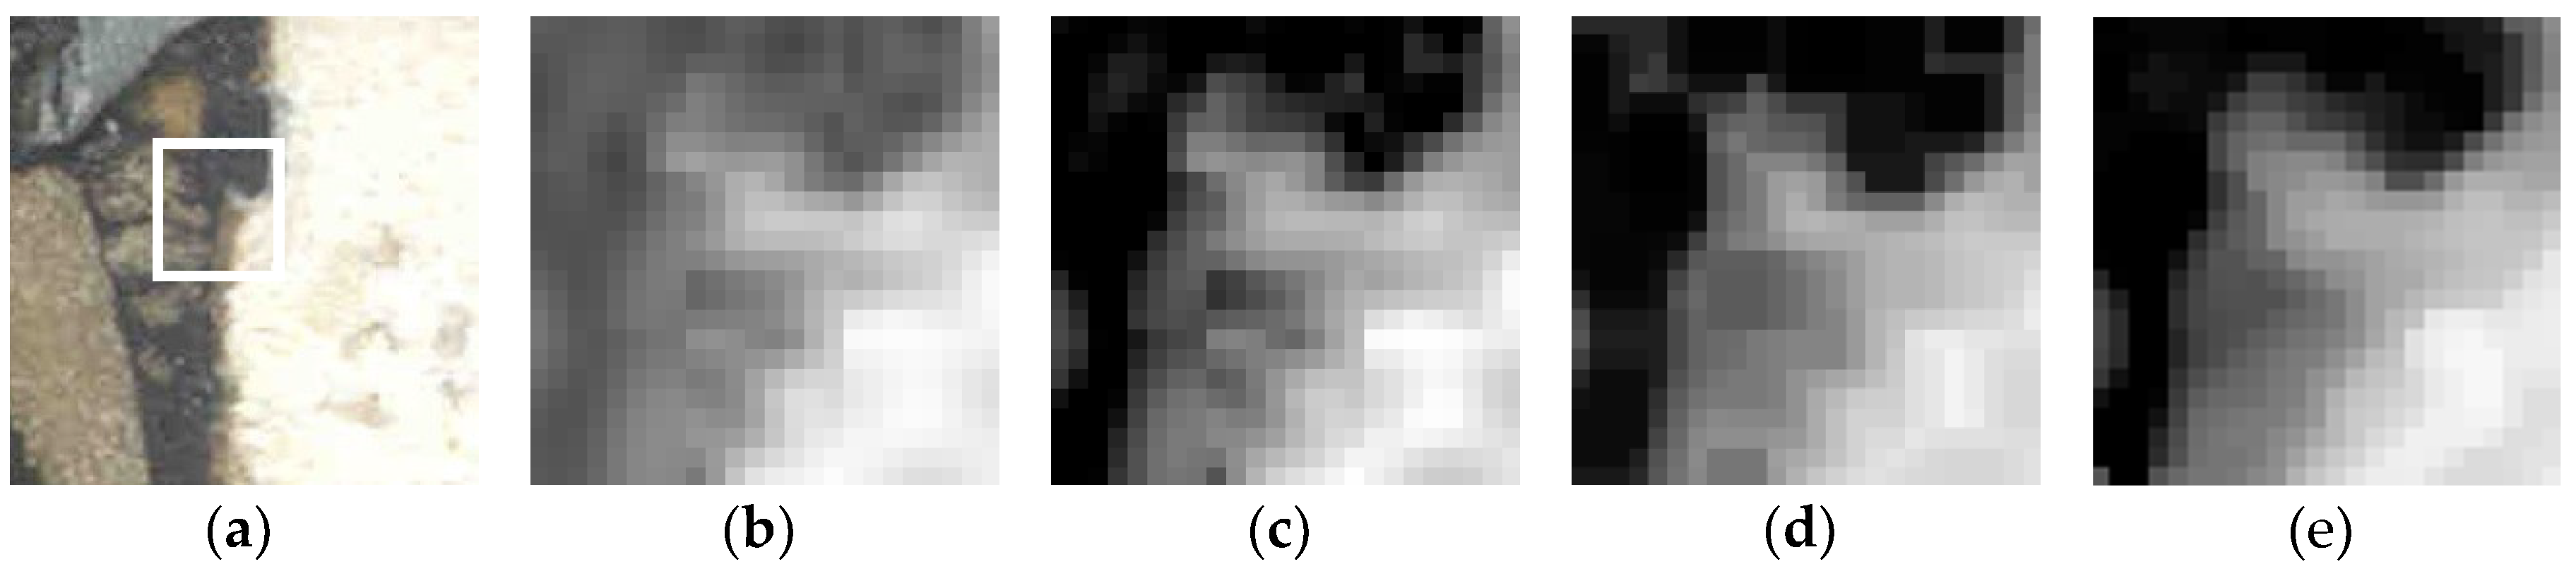
3.1. Image Enhancements

Identifying aggregates in an asphalt mixture can be simple for objects that have uniform brightness that can make objects well separated. Frequently, an image of asphalt mixture has a low signal/noise ratio due to the presence of constituent of minerals in the aggregate. This also results in the brightness values of the image not making full use of the object-separation. For those difficulties, the image enhancement techniques can make it possible to use the image for manipulation. If the target aggregate objects are particularly dark, small, and irregular in shape, or the brightness histogram of the image appears poor and single peak, a specific threshold value cannot distinguish the image into the background and aggregate objects. In order to correct this difficulty, the image is intended to extend the brightness histogram to improve the contrast, which is referred to as brightness manipulation. There are two categories on the image enhancement techniques, which are linear and non-linear methods, to adjust the color or gray-scale range of an image filling the computer display’s dynamic range and improving the contrast in the image. The terms linear and non-linear refer to the function that is applied to the data to perform image enhancement. Figure 4 shows the functions to increase the brightness to varying degrees over different ranges of the data. The transformation of the gray scale is presented as follows. When comparing the image texture of two or more images, it is common to first normalize their histograms to a standard histogram. Equalization is the most popular non-linear histogram normalization technique that attempts to change the histogram. If some gray-scale values are underutilized, it might be better to selectively spread out the displayed gray levels in the pick area, compressing them in the valley. Thus, each of the possible gray level values is assigned to the same number of pixels. Adjustment of the brightness values of pixels based on the histogram of the image by equalization is shown in Figure 4b.
There are isolated aggregates that in the gray-scale image appear as small white spots in the black background, and there are also aggregates in the objects that are not properly separated and appear as black spots in the white structures. In the absence of a pure image, it is hard to define what noise is, where it is, and what amount of noise is contained in the original noisy image. The proposed methods for reducing speckle noise in the image were the median and low pass filters. By smoothing the characteristics of the filter according to the local statistics around each point of the image, it is possible to suppress the noise while the edges and other important features are preserved. In this study, such filters were adopted to improve the detectability of the aggregate structures and subtle gray-scale variations without affecting the sharpness or internal structure information of the original image.
Smoothing was examined with using both the low-pass filter and the median filter to remove the high-spatial frequency noise from a digital image. Noise is often introduced during discretization as a side effect. The smoothing operation enhances the edge of aggregates relative to the background. This is because the background normally has a higher frequency than the edge. A low-pass filter affects the background more than the objects. Thus, it more or less cleans up the background. Median filtering is usually necessary to perform a high degree of noise reduction in an image before edge detection. Comparisons between the median filter and the low pass filter on the image show that the use of the median filter performs better regarding reducing the noise around the edges. The median filter that was proposed in the processing works under the usual assumption that the aggregate in the input image or a region of the input image (boundary of aggregates) has more or less the same intensity in brightness. The median filter works well even with the edge of the aggregates against the shaded or hatched background, as shown in Figure 5, which shows a series of image enhancements. The original image presents an asphalt mixture image at a typical 1200 dpi resolution of about 47 pixels per 1 mm; a 0.5 mm × 0.5 mm image would yield an image of 24 × 24 pixels. The white line rectangular region in the image of Figure 5a is the edge of the aggregate that became stained by the lubricant during the cutting of the mixture specimen. After applying filters, the median filter produces a better image with the destruction of edges.

3.2. Threshold with the Edge Detection

Many segmentation methods for image analysis often use brightness intensity thresholding techniques. The simplest implementation of thresholding is the selection of pixels between two user-defined values. However, without further user interaction, this technique is limited in its application, because a region of interest is often connected to other objects via the linking bridges of pixels. Thus, the authors applied an edge detector to find edges in the image. The Sobel method finds edges using the Sobel approximation to the derivative. It returns edges at those points where the gradient of the image is the maximum. In contrast to the intensity-oriented conventional object detection methods, the proposed method in this study refers to the local edge properties, and integrally evaluates them by a fuzzy function to achieve better detection quality. The result of an evaluation applied to an asphalt mixture image showed very a high detection rate in detecting the aggregate regions without any difficulty. After the edge detection by the Sobel filter, the authors reconstructed the edge to connect it to the edge boundary. Figure 6a is an edge-detection image using the Sobel edge detector. The use of the edge detector enhances the program’s ability to process the threshold.
There are many threshold approaches for image segmentation [47,48]. A combination of the global threshold method and the boundary-based method was proposed in the image processing development. In addition, the complement of the boundary-based method (limited region-based method) was introduced with the regions by comparing one pixel to its neighbors. If a criterion of homogeneity is satisfied, the pixel belongs to the same class as one or more of its neighbors. In the coding, the first step of the segmentation process involves the boundary-based method applying the Sobel filter and the partial region-based methods. Then, the threshold is applied for further segmentation because of its availability in the MATLAB software (MATLAB Student, Seoul, Korea) with the ‘graythresh’ function and its wide usage in many applications. The graythresh function uses Otsu’s method, which chooses the threshold to minimize the variance of the black and white pixels. The threshold is a very time-consuming process of trial and error. Before automatically defining the threshold values, it changed the threshold value until the results were satisfactory. Instead, a multi-level threshold approach was introduced in the program. If the entire image has relatively consistent characteristics, a global threshold gives satisfying results. If there are unevenly illuminated regions in the image, the local threshold might perform better than the global threshold. One of the limitations of the local threshold method is that it only determines the localized threshold for current regions, which is only a small portion of the entire image. However, the best fit value at once is not sufficient at all when the image has more complicated components. Thus, for images in which the brightness ranges of the foreground objects and background entangle, different thresholds must be coded for different regions. In such a scenario, the domain-dependent information was also coded in the algorithm to get the work done. Figure 6 includes the images of the threshold process in the program. In Figure 6b, the white region is initially thresholded by the graythresh function in the MATLAB function [49]. However, the global threshold value cannot fully detect all of the aggregate regions. Thus, the authors applied the second and the third threshold values until those thresholded regions, which are presented with gray in Figure 6b, reached the edges of the aggregate. After the third threshold value edge line, the pixels returned a white color and then the pixels over the edge line were coded with a black color, as shown in Figure 6c.

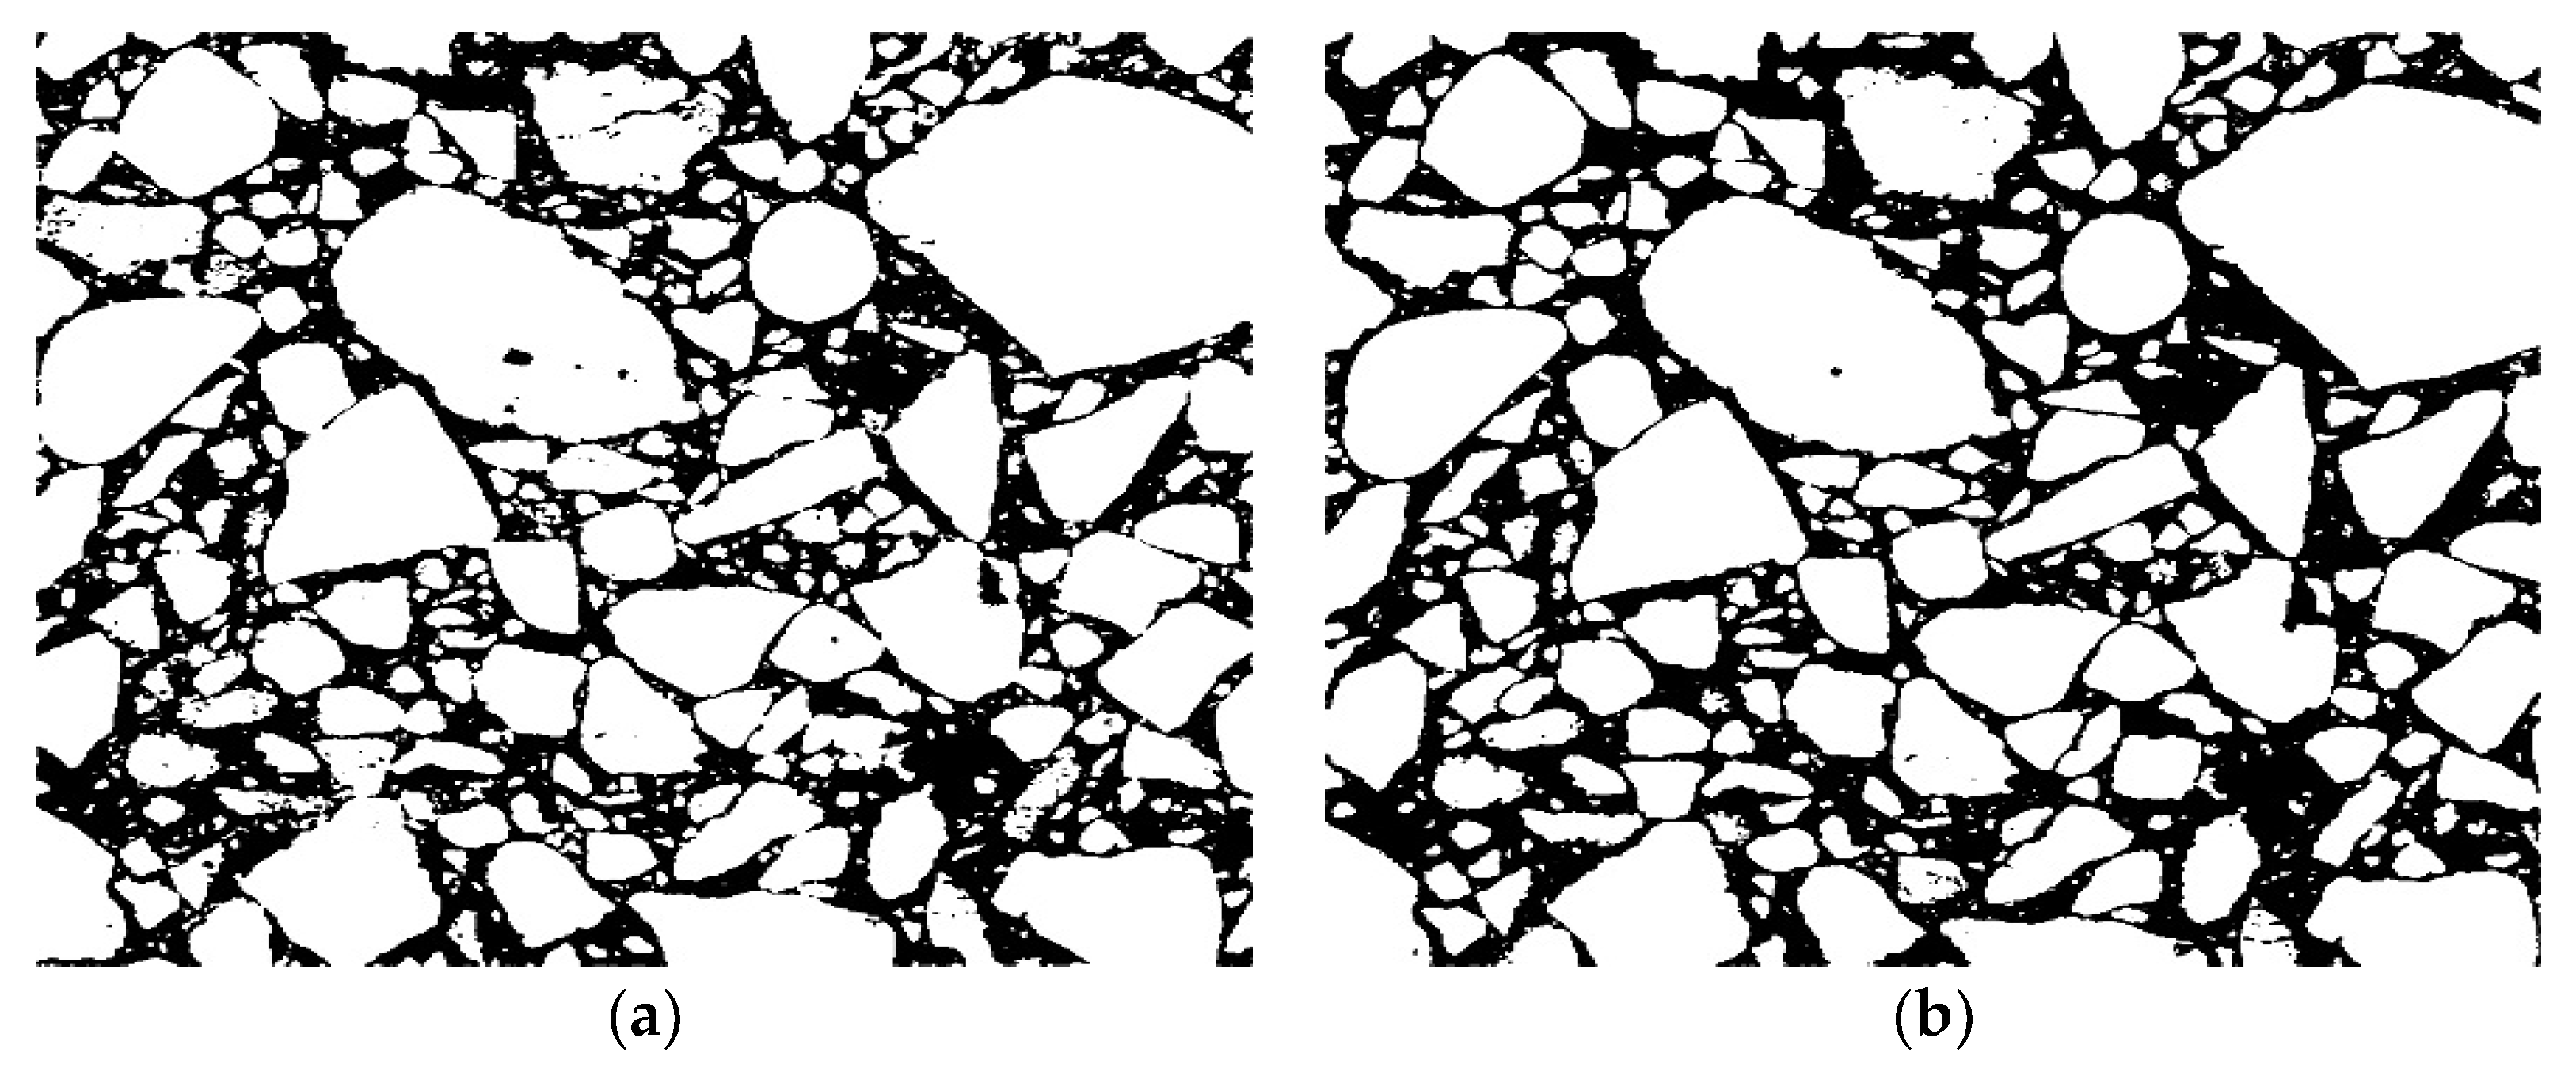
3.3. Morphological Operations

Mathematical morphology is based on two basic operations: dilation, which fills holes and smoothens the contour lines, and erosion, which removes small objects and disconnects objects connected by a small bridge. Morphology is based on set theory. The shapes of objects in a binary image are represented by object sets. This theory can be extended to gray-scale images. Morphology operations can simplify image data, preserving the object’s essential shape characteristics. They can also eliminate irrelevant objects. The main advantage of a morphological filter is the ability to preserve the shape of objects that are large enough. A morphological filter has also been proven for segmenting brain and other image analyses. Figure 7 shows initial treatments with erosion and dilatation on an image of 94 × 94 pixels (0.2 mm × 0.2 mm). The erosion and dilation was coded with a rolling ball structuring element, which automatically takes advantage of the decomposition of the structuring element. For the rest of the touching object after applying erosion and dilation, it can be breakable while applying the watershed splitting method.

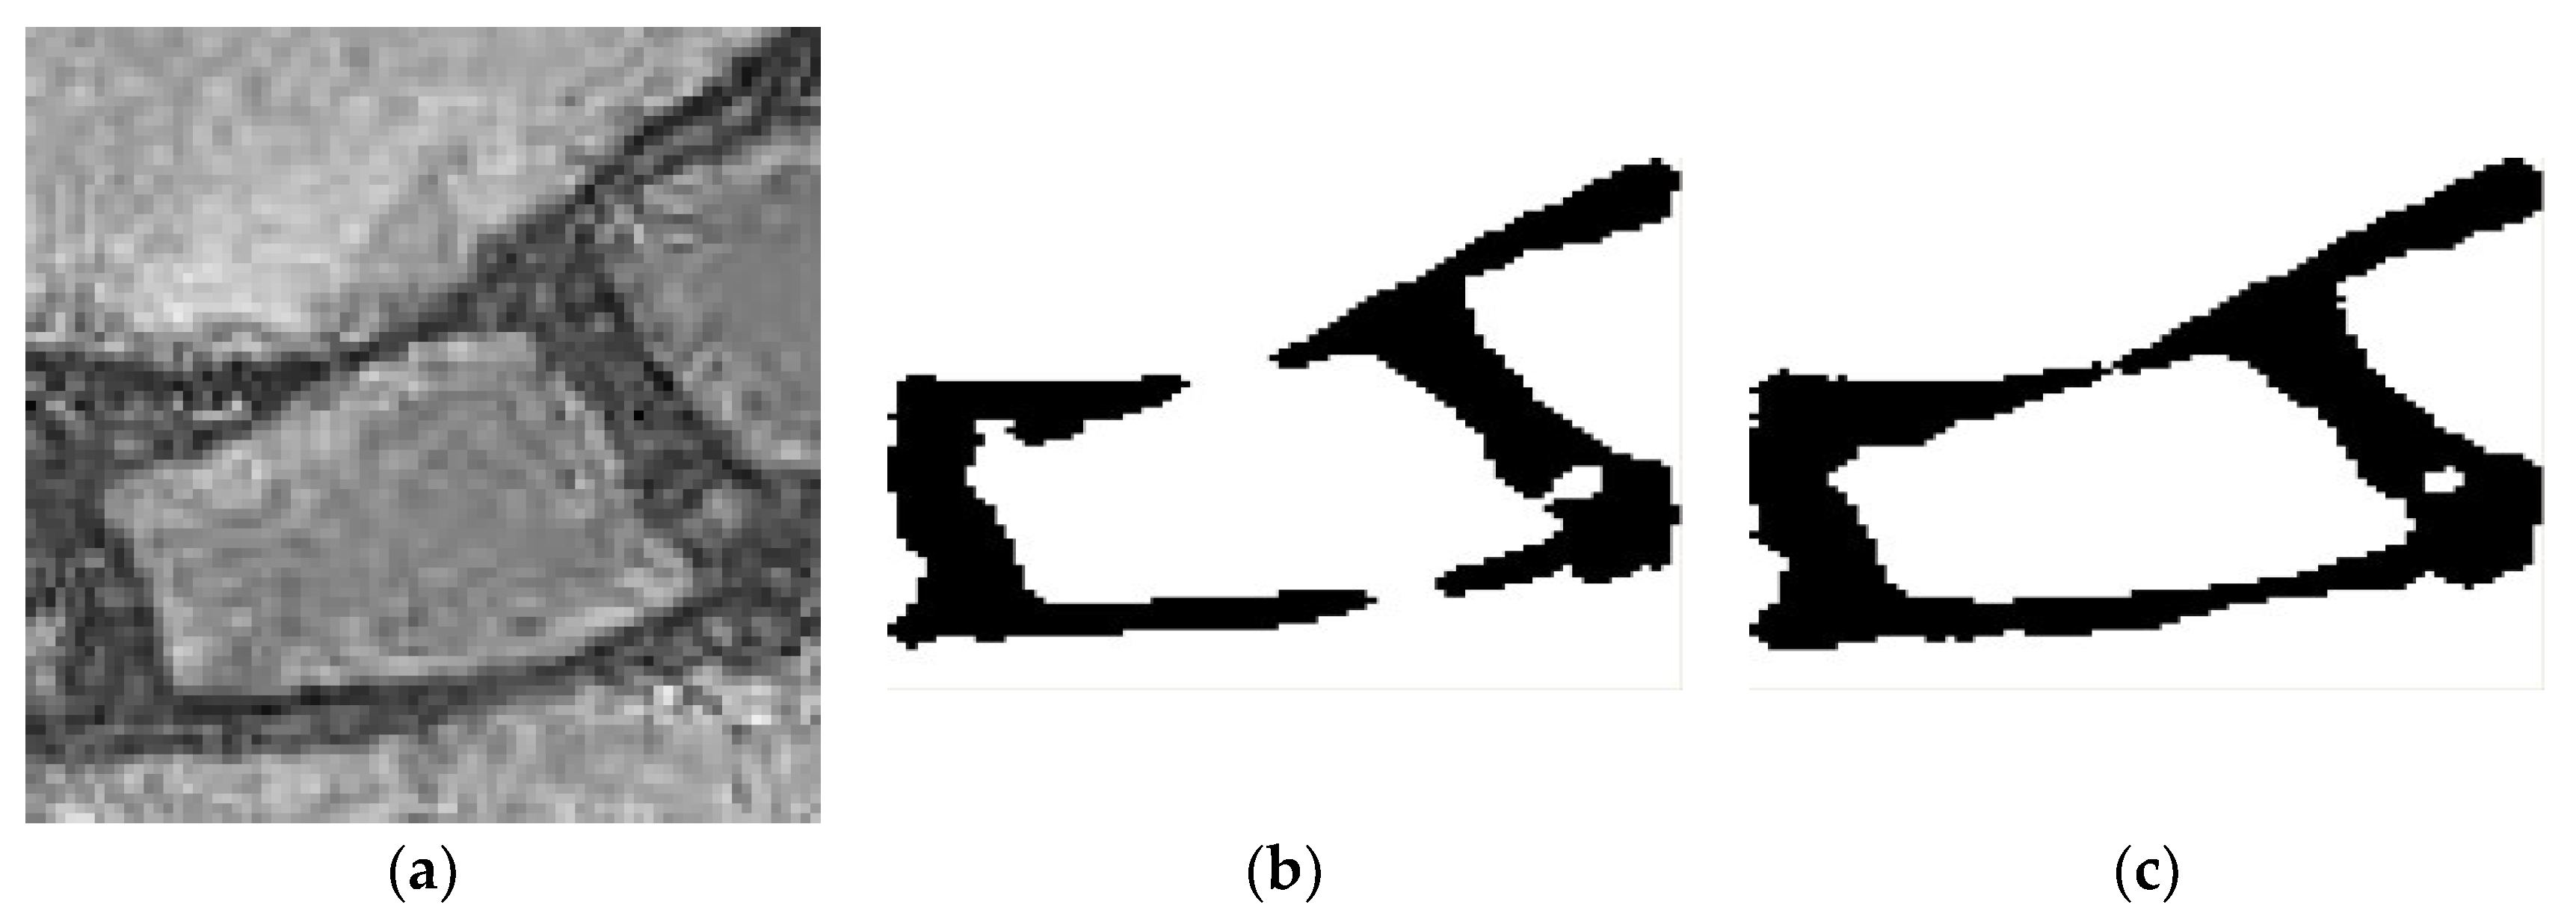
3.4. Objects Splitting

Before labeling each object in the image, the program has to separate the objects that are counted as one when two or more objects are connected and not well separated while thresholding and erosion/dilation. No matter how intelligently the thresholds are chosen by the program, the original scanning image that has a limited number of grayscale levels creates a misclassification of the edges of the individual object, which causes some artificial particles to touch each other. In those cases, the separation of objects was done through a technique called the “watershed splitting filter”, which is provided in the MATLAB software. In this technique, the objects do not come together again via dilation after separation by erosion. Performing this operation in an uncontrolled way causes many single objects to be internally split. Coding several steps of erosion and dilation in a limited watershed split minimized the internal splitting of objects while maximizing the true separation of touching objects. It was recognized that this operation, while necessary for preparing object images so that the individual objects can be recognized, creates some small loss of information and a corresponding increase in the uncertainty of the particle shape. Figure 8 shows an image after segmentation, and the resultant image after watershed splitting. Clearly, some artifacts remain or have been caused by the image operation (small appendages on objects). However, these are minimal, changing the object volumes and the surface areas in the order of a few percentage points.

3.5. Aggregate Orientation

The proposed image process was developed to evaluate the internal structure of an asphalt mixture. The internal structure of the aggregate can be characterized by calculating the following parameters: the absolute average angle of orientation (θ = ( | θ k | ) / N ) and the vector magnitude (Δ) [38]. Orientation of the individual aggregate is measured by the angle between its longest axis and a horizontal line. Using the orientation of the individual aggregate, the Δ that reflects the average anisotropy of the aggregate contact orientation distribution during compaction can be calculated as follows:
  Δ = ( sin 2 θ k ) 2 + ( cos 2 θ k ) 2 N  
where θk is the orientation of an individual aggregate on an image from −90° to +90° measured from the horizontal direction, and the positive sign indicates that the angle is measured counterclockwise from the horizontal direction. N is the number of aggregates. Complete random distribution of the orientation will give Δ of 0. On the other hand, Δ of 1 means that all of the observed orientations have exactly the same direction.

4. Materials and Methods

A group of compaction matrixes gave 12 different mixture samples, as shown in Table 1. The optimum asphalt contents were 5.1% for a PG64-28 and 5.0% for a PG58-28, as defined by the Superpave mix design, since both the asphalt contents produce 4% air voids at Ndesign (100 gyrations). Both asphalt binders were modified with SBS polymers and the aggregate was 4700 g for each specimen. The mixtures were compacted up to 160 gyrations (Nmax) with 600 kPa. The apparent bulk specific gravity of mixtures at 160 gyrations was measured with ASTM C127 and C128. The experiment design proposed three different compaction temperatures for both asphalt binders to investigate the internal structure change on the compaction process. For each compaction temperature, two 1500-g samples were prepared to measure the theoretical maximum specific gravity through AASHTO T209. The energy indexes (CEI and CFI) were calculated from the densification curves and resistive work curves on each compaction, respectively. Image acquisition for the internal structure analysis was conducted by cutting the asphalt mixture vertically. Three slices were taken from each specimen. Thus, the total number of the images was 36 images for the analysis.

5. Results and Discussion

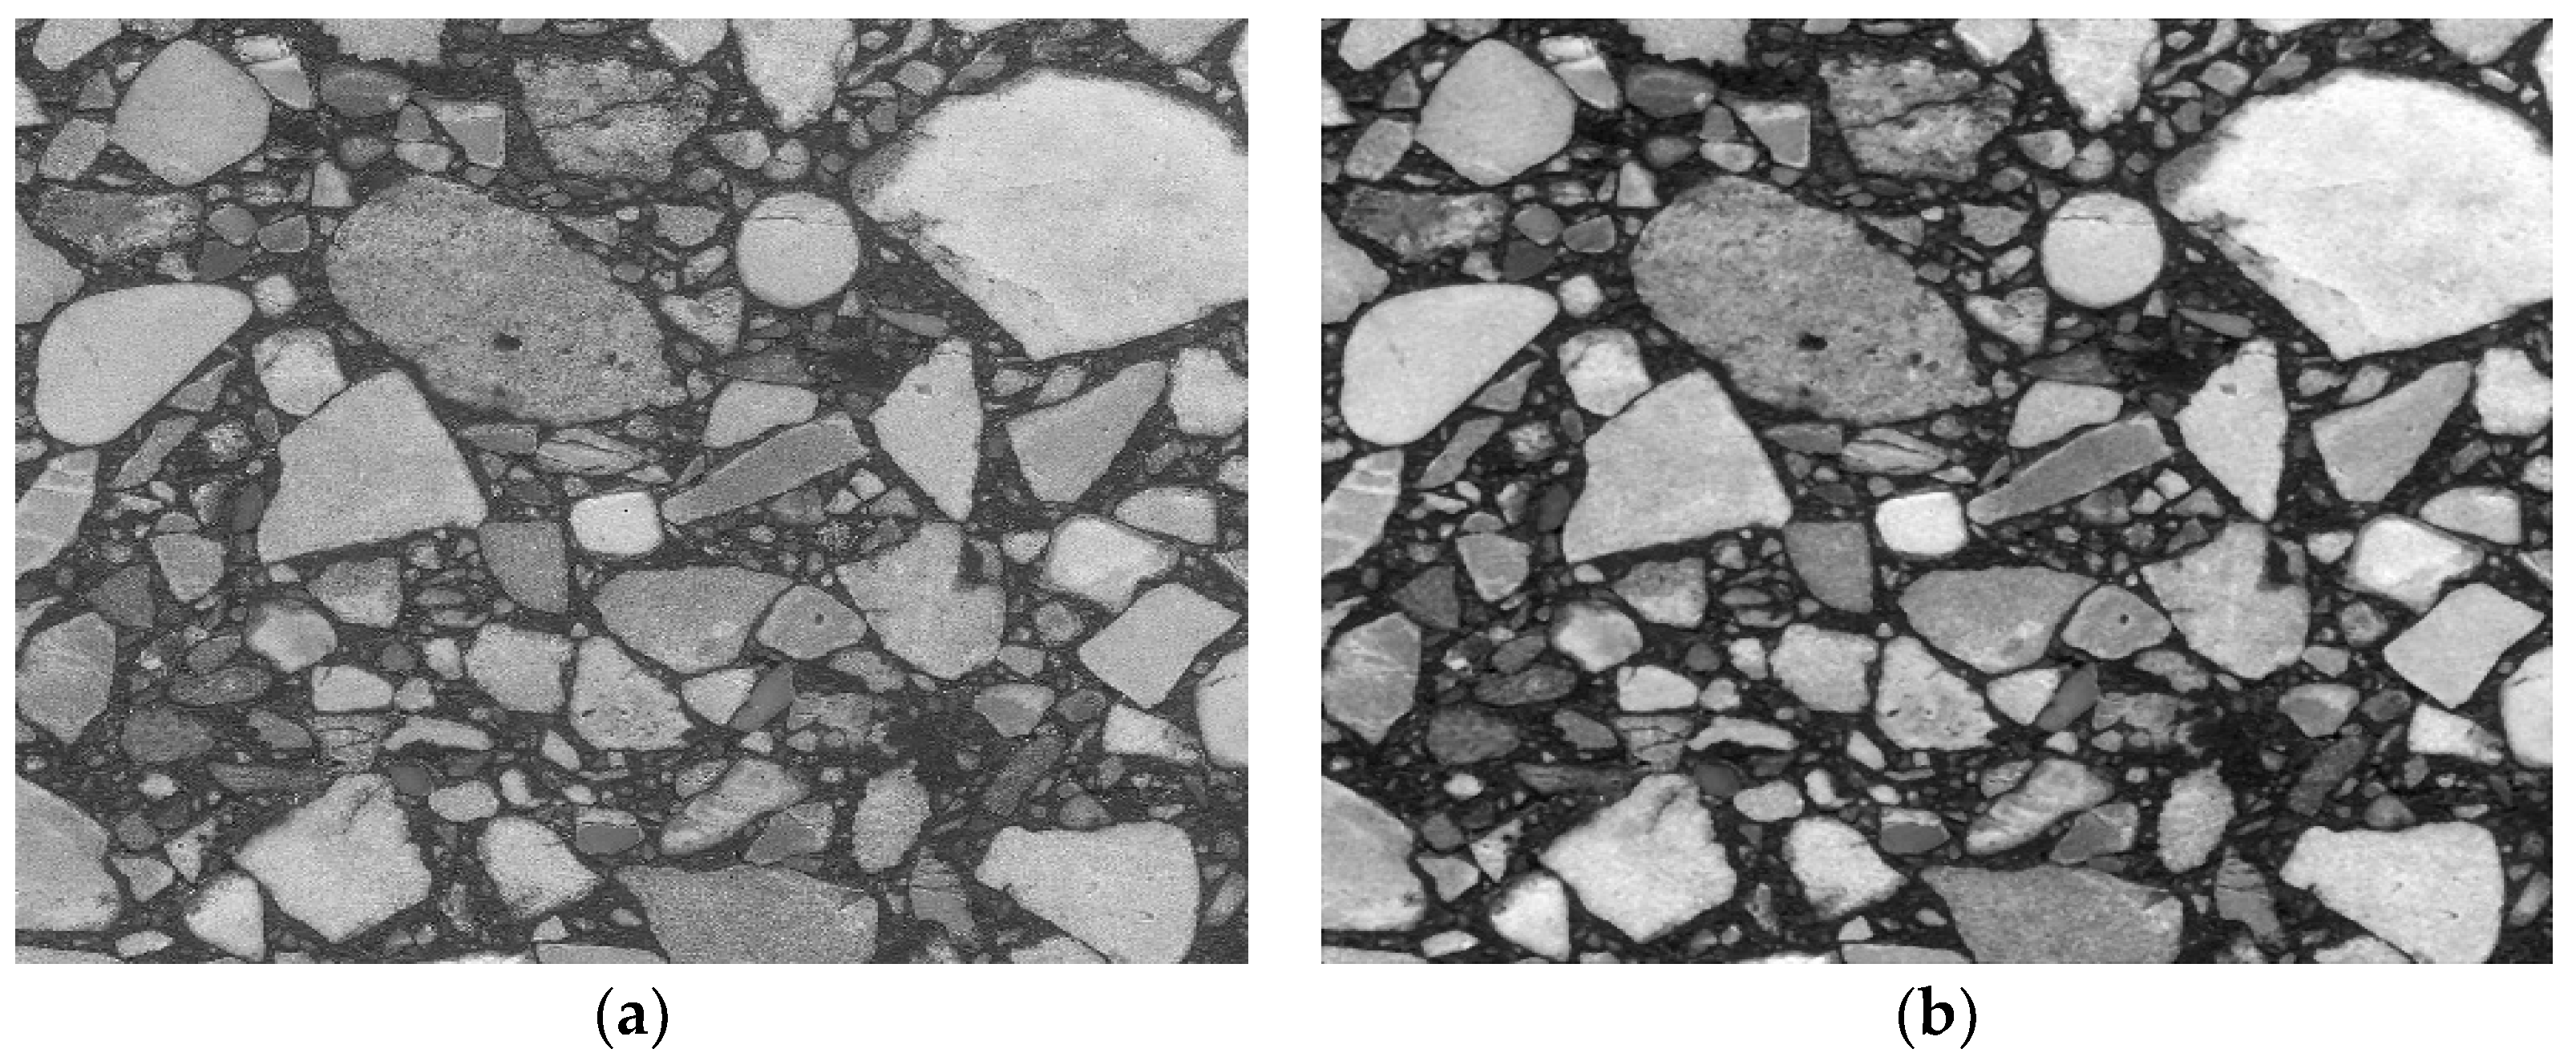
5.1. Results of Image Analysis

The compaction behavior of asphalt mixtures can be represented by the vector magnitudes (Δ) as a parameter of aggregate orientation. Aggregate orientation is well-known as a good representative to reflect the shear resistance and stiffness of asphalt mixtures against compaction. Thus, aggregate behavior primarily affects the compactibility of an asphalt mixture, resulting in a preferred aggregate orientation that can reduce compaction resistance. For studying the preferred aggregate behavior, the changes in vector magnitudes were evaluated as a function of the compaction temperature. Figure 9 shows the vector magnitude variations from three images for each mixture at a compaction temperature. The average vector magnitudes increased with an increase in the compaction temperature from 90 °C to 115 °C for the PG64-28 mixture. A similar result is shown for the PG58-28 mixture from 80 °C to 110 °C, which is a high-viscosity period. In this compaction temperature period, a t-test was applied to the data to examine the significance of the change in the vector magnitudes. For the PG64-28 mixture, the computed t value of 2.33 shows a statistically significant change in the vector magnitude with the rejection probability of 2.22%. A similar t-test result is obtained with the t value of 1.77 for the PG58-28 mixture. On the other hand, on the lower asphalt binder viscosities (at compaction temperatures higher than 115 °C for the PG64-28 mixture and 110 °C for the PG58-28 mixture), the aggregates are not sufficiently constrained to achieve their preferred orientation, which exists at 115 °C for the PG64-28 mixture and 110 °C for the PG58-28 mixture. These results are in good agreement with the findings of Azari et al. [28]. The most preferred orientation in both mixtures is achieved after increasing the compaction temperature up to a certain asphalt binder viscosity, and then decreasing it with increases in the compaction temperature. This can be because the asphalt binder viscosity mainly governs the compaction at a low compaction temperature, and the high viscosity of the asphalt binder makes it difficult to move and pack the aggregates. However, at high temperatures, the low viscosity of the asphalt binder appears to reduce the preferred orientation of the aggregates because of the greater shear resistance of the aggregate resulting from the higher interaction of the aggregate compared with the binder’s resistance to compaction.

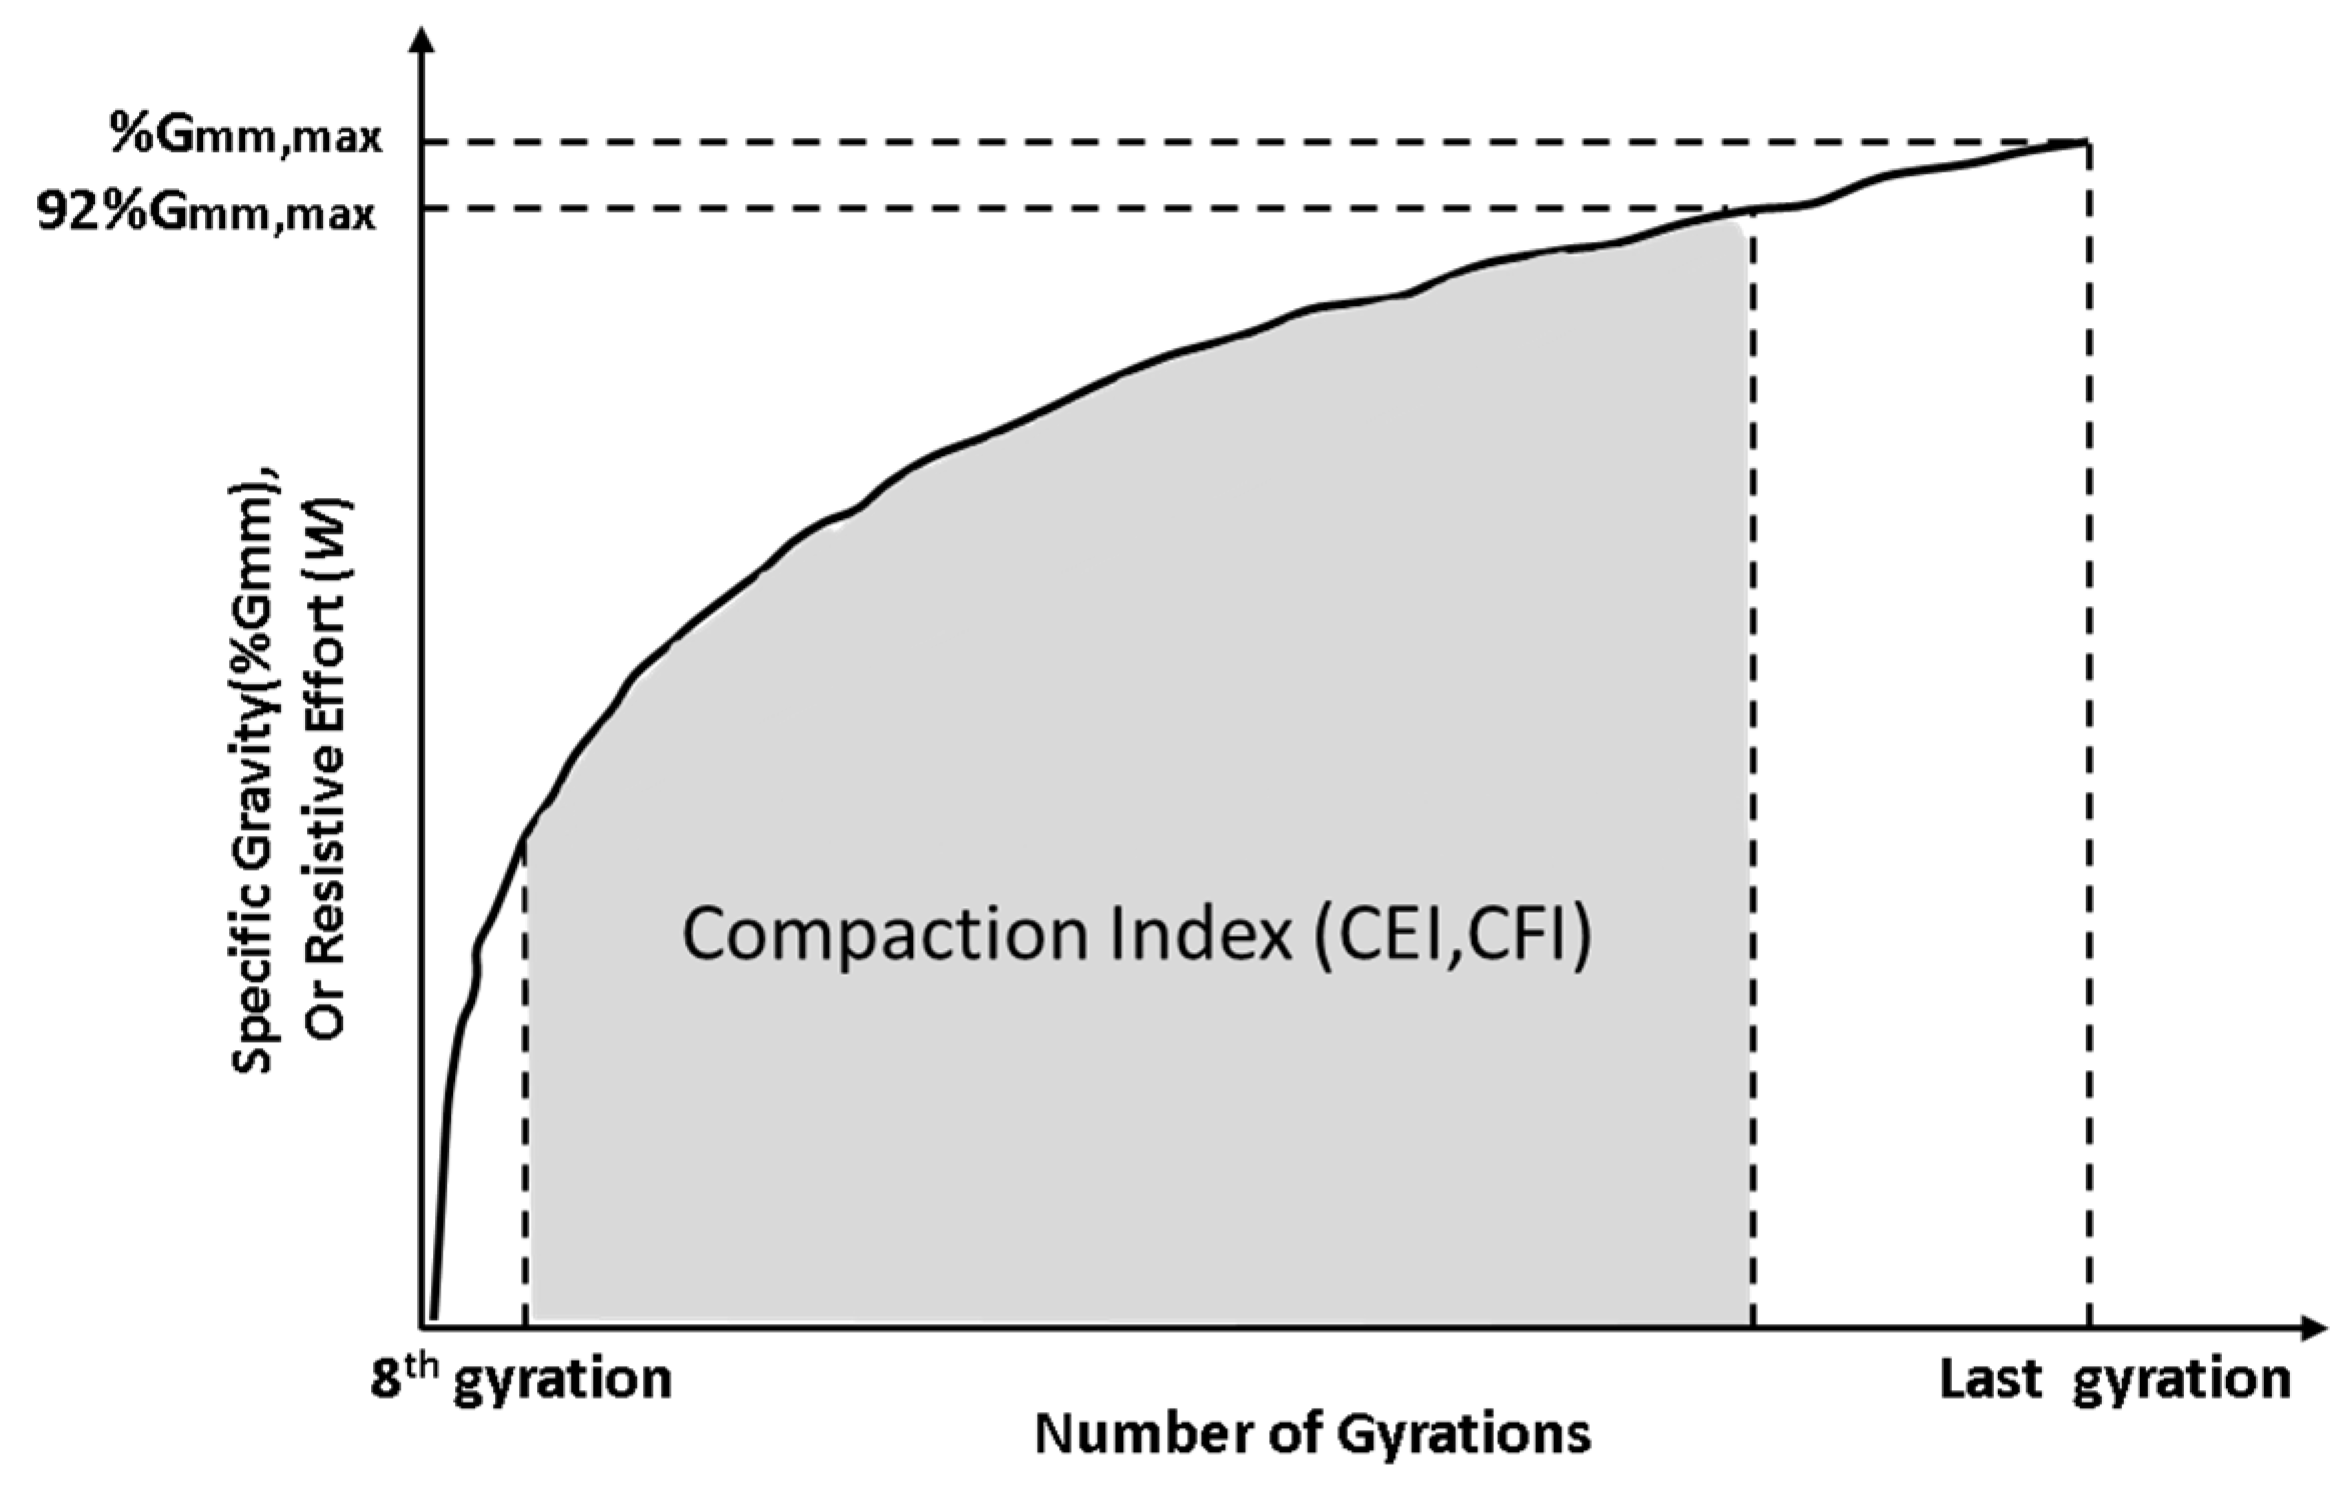
5.2. Compaction Energy Efforts

As described in compaction theory and image analysis, the temperature may affect not only the natural volumetrics (in terms of density), it also affects the aggregates’ behavior during compaction. At lower temperature, the high viscosity of the asphalt binder plays a big role in the resistance on compaction performance. After the compaction temperature reaches a certain point, the compaction becomes easier. That is, the aggregate behavior during compaction is influenced by a given compaction temperature because of the initial viscosity change, as explained in the Mohr–Coulomb theory. However, compaction becomes difficult when the temperature passes a specific viscosity.
Figure 10 depicts the relationship of the energy index and vector magnitudes on the PG 64-28 and the PG 58-28 mixtures as a function of temperature. For both mixtures, the CEI and CFI are highest at low compaction temperatures (90 °C and 80 °C). Conversely, the vector magnitudes were lowest. The lowest vector magnitude explains how the aggregates are caught by the asphalt binder due to their high viscosity, requiring high compaction efforts for compaction. Generally, the asphalt binder hardens due to aging, aggregate interlocking, and interactions. As the asphalt binder continues to harden, the aggregates interactions may decrease, and result in the low preferred orientation of the aggregate. For both mixtures at middle compaction temperatures (115 °C and 110 °C), the vector magnitudes increase with increasing temperature, and the energy index decreases. So, the viscosity effect helps the ease of compaction. However, the highest compaction temperatures (at 140 °C for both mixtures) do not give the highest vector magnitudes; rather, energy efforts are constant or higher. What happens in the mixtures is that excessively raising the temperature possibly enhances the aggregate interactions or contacts due to the low viscosity. The possibility of an increase in the aggregate interactions or direct contacts can be seen in the volume change of the effective asphalt (Veac). The Veac can be obtained by subtracting the air void (%) from VMA (%) through volumetric analysis. For the PG64-28 mixture, the Veac were 10.6%, 11.3%, and 10.9% as the compaction temperature increased. For the PG58-28 mixture, the Veac were 10.7%, 11.2%, and 11.1% as the compaction temperature increased. The volumes of the asphalt binder for lubrication decreased rather than increased in temperature. Thus, there are no meaningful changes in the CEI and CFI, although the compaction temperature rises up to 140 °C for both mixtures. Clearly, the compaction resistance for both mixtures can grow because of an increase in the aggregate interactions, which is not expected from raising the temperature for easier compaction.

5.3. Effects of Mixtures Volumetric Change on the Rearrangement of Aggregates

Asphalt mixture volumetrics in the Superpave mix design are the relationships between mass (aggregates and asphalt binder) and their volumes at 4% of the air voids. When the optimum asphalt content (obtaining 96%Gmm at Ndesign) is mixed with the aggregates for compaction, the asphalt binder forces the aggregates to slide and move to rearrange, and allows the aggregates to be moved into a denser condition. So, the same desired density can be expected at the same number of gyrations (applied with the same amount of compaction energy). Thus, the most important factor for compaction is the asphalt content that affects the internal friction due to the change in the frequency of aggregate contact by compaction when other factors are holding in the expression of the Mohr–Coulomb compaction theory. However, the viscosity, which is the cohesion in the theory, is one of factors that can affect the volumetrics. Temperature apparently influences the compaction resistance due to the change in viscosity. The viscosity corresponding to different temperatures can change the mixture volume due to asphalt binder absorption by aggregates. At a low temperature, compaction is resisted due to high viscosity, regardless of the aggregate contacts. However, at a high temperature, the viscosity helps the aggregate slide and move to the pore space; instead, it increases the internal friction to resist compaction. This can be proven by mixture volumetric analysis. In Superpave volumetric analysis, the VMA, volume of the voids filled with asphalt binder, consists of the volume of the effective asphalt binder (Veac) and air voids. The Veac can be calculated from volumetric analysis, as shown in Table 2. The Veac decreases for the PG64-28 mixtures when increasing the temperature from 115 °C to 140 °C. The volume differences in Veac for the PG58-28 mixtures are negligible at the temperatures between 110–140 °C. That is, the certain amount of asphalt for lubrication disappears and flows into the water-permeable voids that are distributed on the aggregate surface.
Figure 11 shows the frictional behavior of aggregates corresponding to the volume change in the PG64-28 mixtures. Depending on the change in temperature, the absorbed asphalt binder (Pba, wt% by aggregates) and Veac were calculated. For convenience, it was divided into two temperature sections, A (90 °C to 115 °C) and B (115 °C to 140 °C). In section A, the CFI, presenting the applied energy to achieve a desired density, is highest at 90 °C and decreases. Aggregates can be constrained by a highly viscous asphalt binder. Pba decreases, but Veac and Δ increase. The increasing temperature shows a better rearrangement of the aggregate in terms of the volume change of the asphalt mixture. In contrast, the reduction in the viscosity of section B allows the initial cohesion of the asphalt binder to increase, but the majority of the aggregate in the mixture may strongly interact with each other. An increase of 0.35% in Pba causes a 0.4% reduction in Veac. A reduction of lubricants can produce a larger contact surface area at the contact area, enabling the interfacial diffusion of the asphalt binder. This will give enhanced aggregate interfacial strength through increasing the temperature. The friction between the aggregates will increase and more compaction energy will be needed to achieve a desired density. In other words, the internal friction to resist compaction at 115 °C is lower than that at 140 °C. It is obvious that the temperature affects not only the mixture viscosity but also the internal friction due to the change in the volumetrics. However, a detailed internal friction change corresponding to a change in the asphalt binder viscosity is very limited, because it depends on aggregate properties such as the aggregate gradation, shape, and angularity used for compaction.

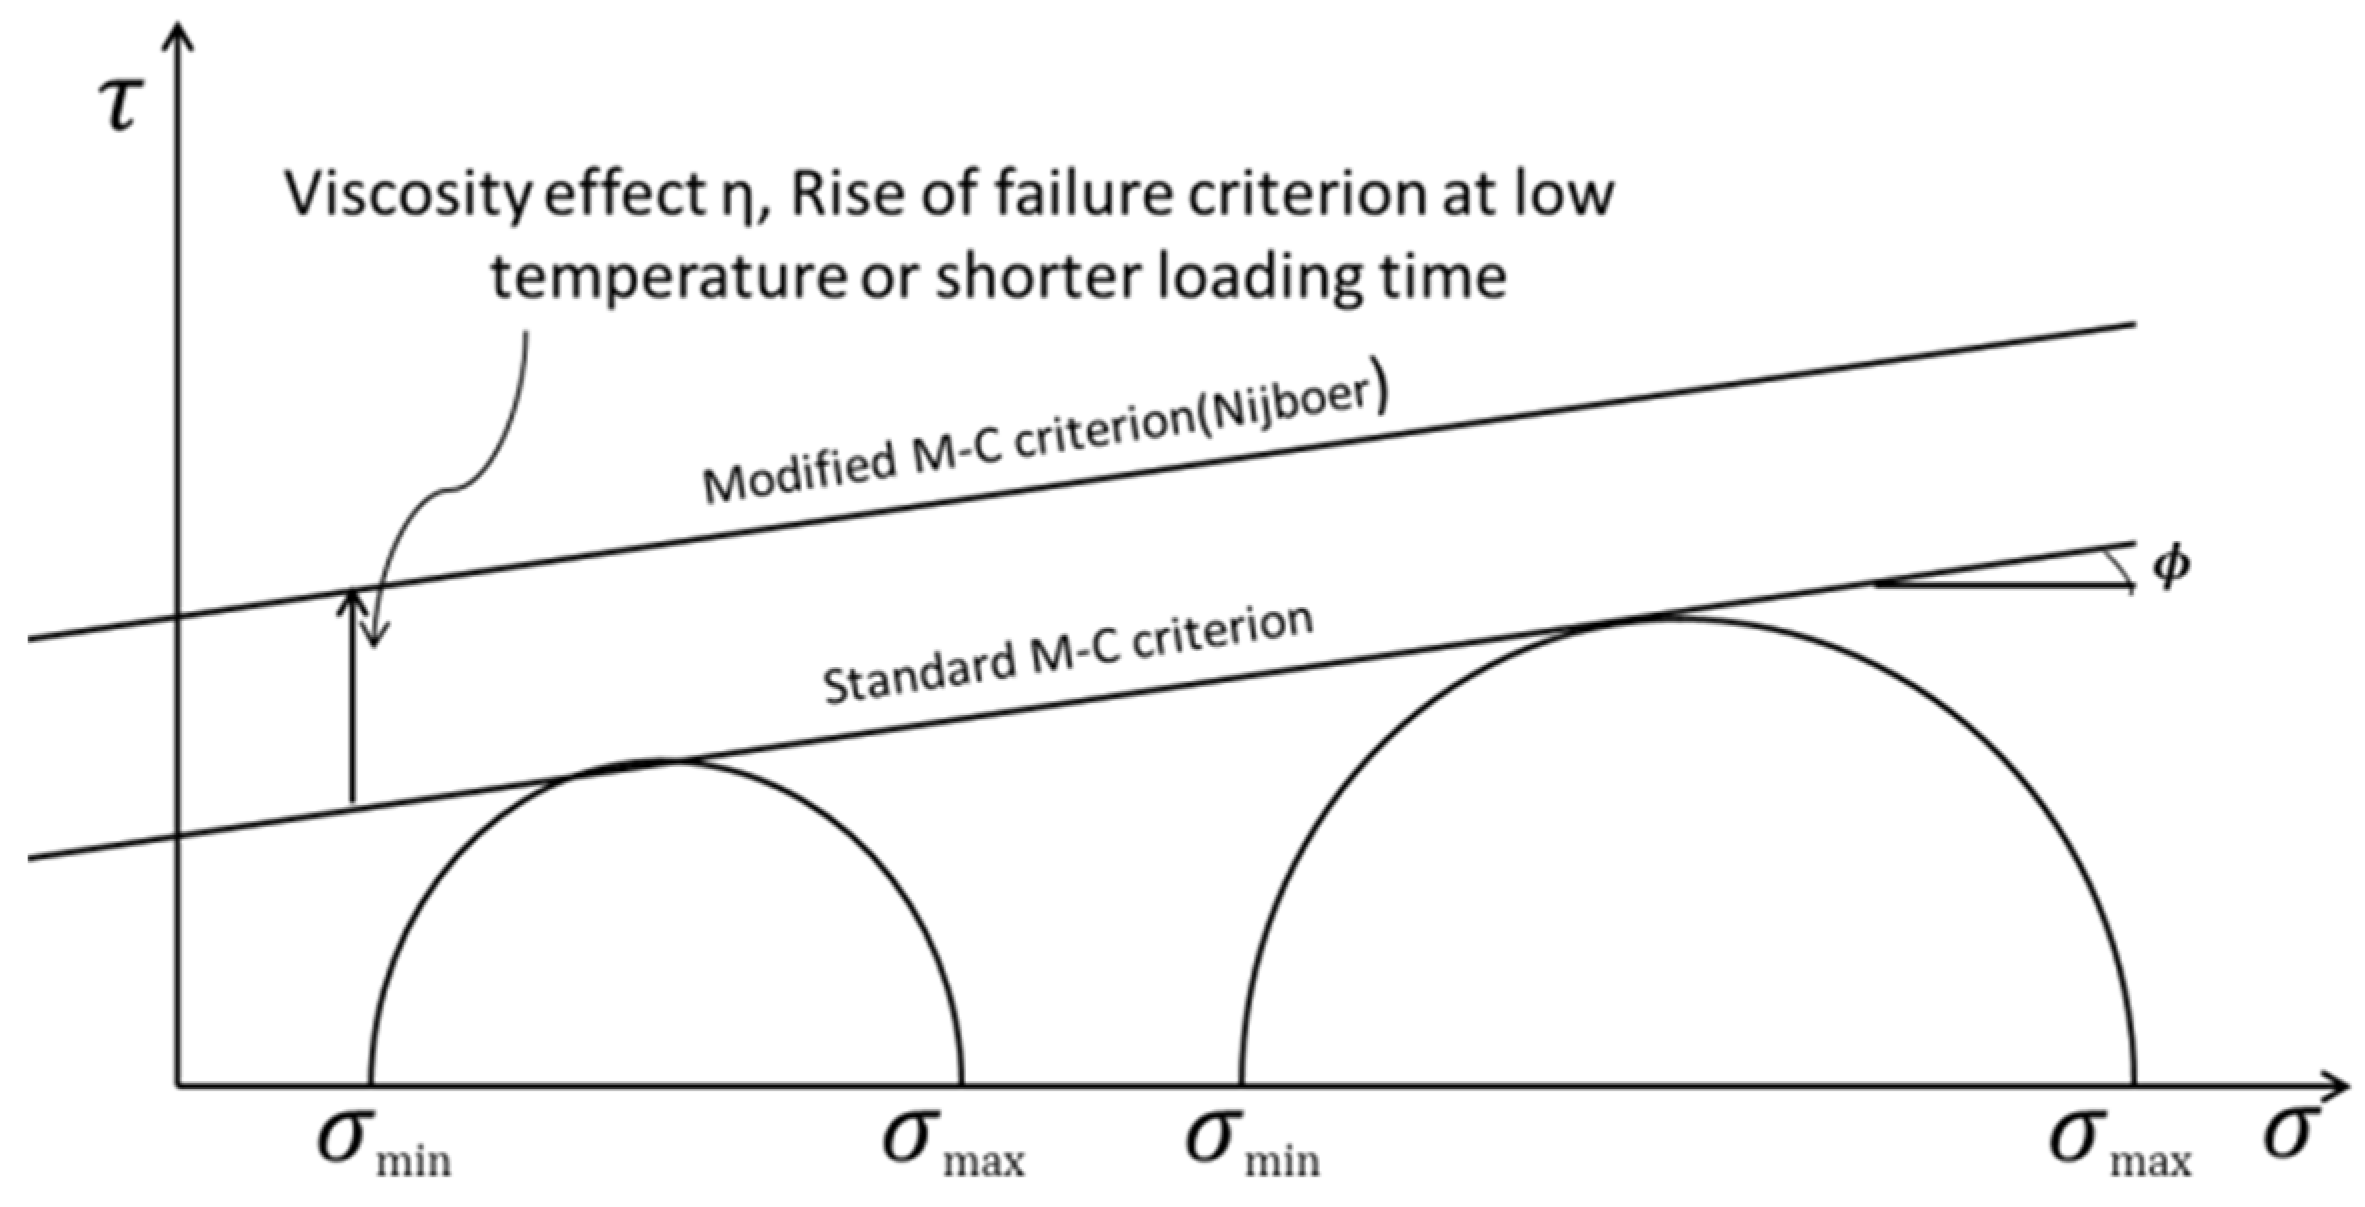
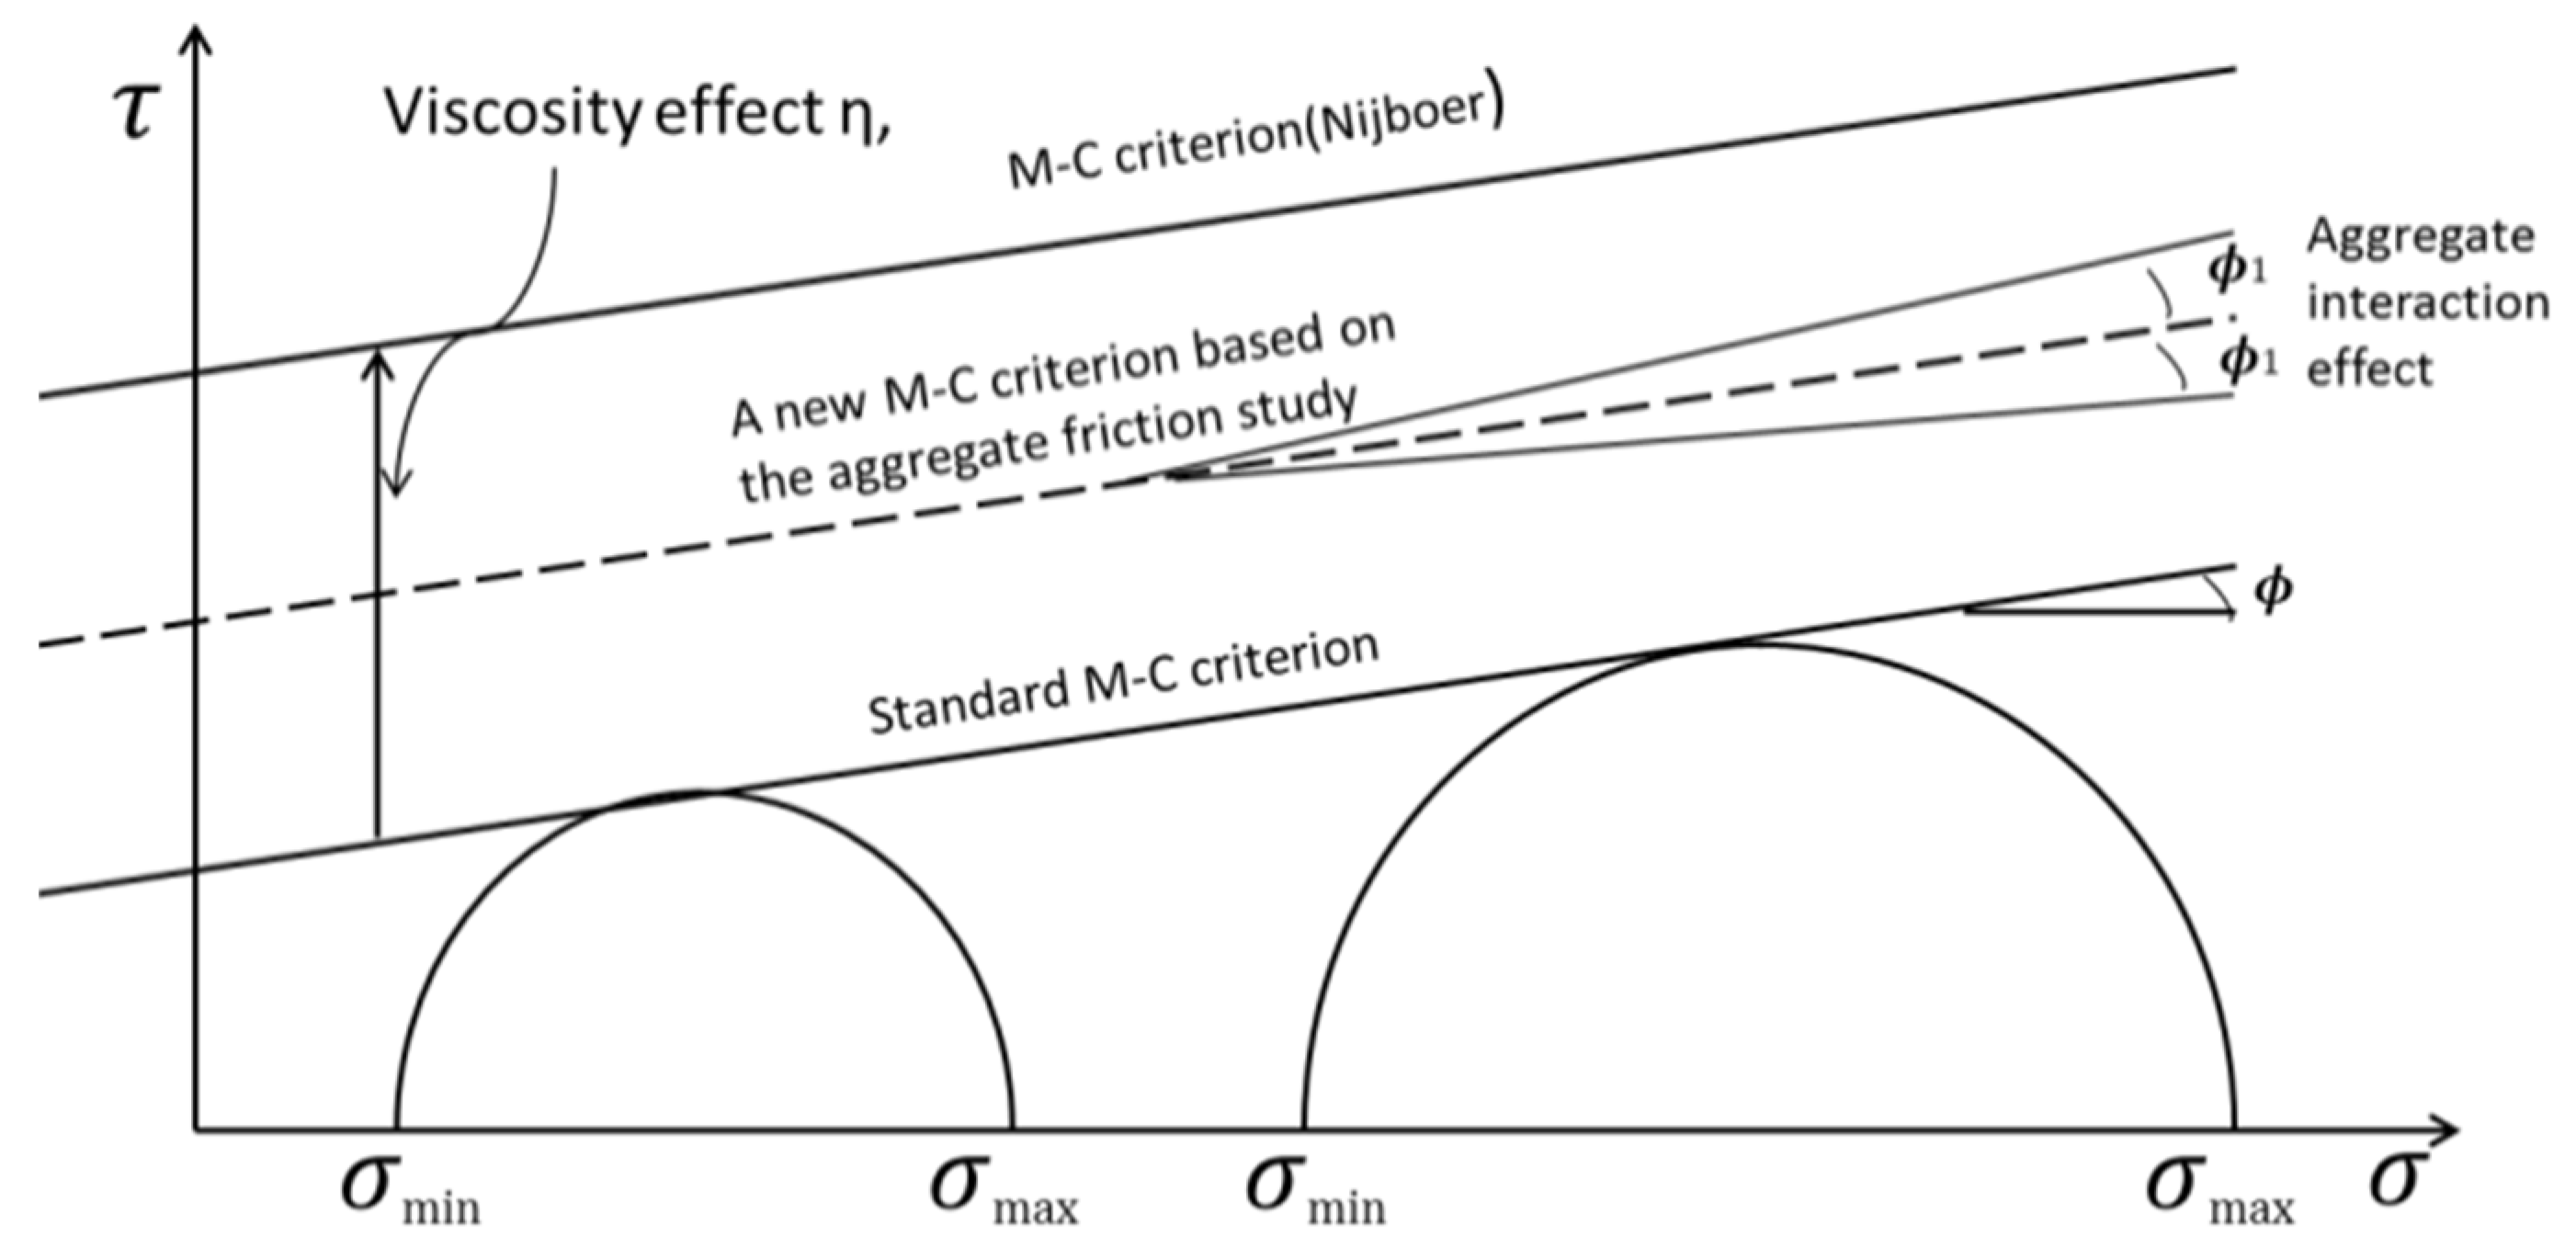
5.4. Modifying Mohr–Coulomb Compaction Concept from the Study

The Mohr–Coulomb theory has been used to characterize the asphalt mixture compaction in terms of initial cohesiveness, friction angle, and viscosity effects. However, this theory cannot explain the compaction of the asphalt mixture well, in that the effect of aggregate interactions is missing due to the change in temperature, which causes the change in volumetrics. Based on the results of the energy index and aggregate orientation studies corresponding to the change in viscosity, a modified compaction concept can be introduced. The failure line in the original concept depends on the viscosity of the mass. However, this study shows that the viscosity effect does not linearly increase in the Mohr–Coulomb failure line. It was found that the aggregate friction varies with the volume change in the asphalt binder for lubrication due to the change in viscosity. It was obvious that cohesion governs the compaction of mixture below a certain optimum mixing temperature. After passing the optimum mixing temperature, compaction appears to be more dependent on the aggregate contact rates, which can create the internal friction. Thus, this change in internal friction can be expressed with ϕ1, which denotes the influence of aggregate friction on the compaction resistance of the asphalt mixture, as shown in Figure 12.

6. Conclusions

This study was initiated to identify the internal compaction behavior for asphalt mixture using image analysis. The study focused on measuring volumetric characteristics and their effects on internal friction changes during compaction. Based on the image analysis of aggregate behavior and mixture volumetric study, the following findings can be provided:
  • Image processing was developed to conduct a better analysis of the internal structure of the asphalt mixture, including detailed image processing techniques that solved the difficulty regarding the separation of objects by equalizing, filtering for denosing, and thresholding. The results of the t-test show that it is reliable and confident to evaluate the internal structure interpretation of the mixture with good repeatability.
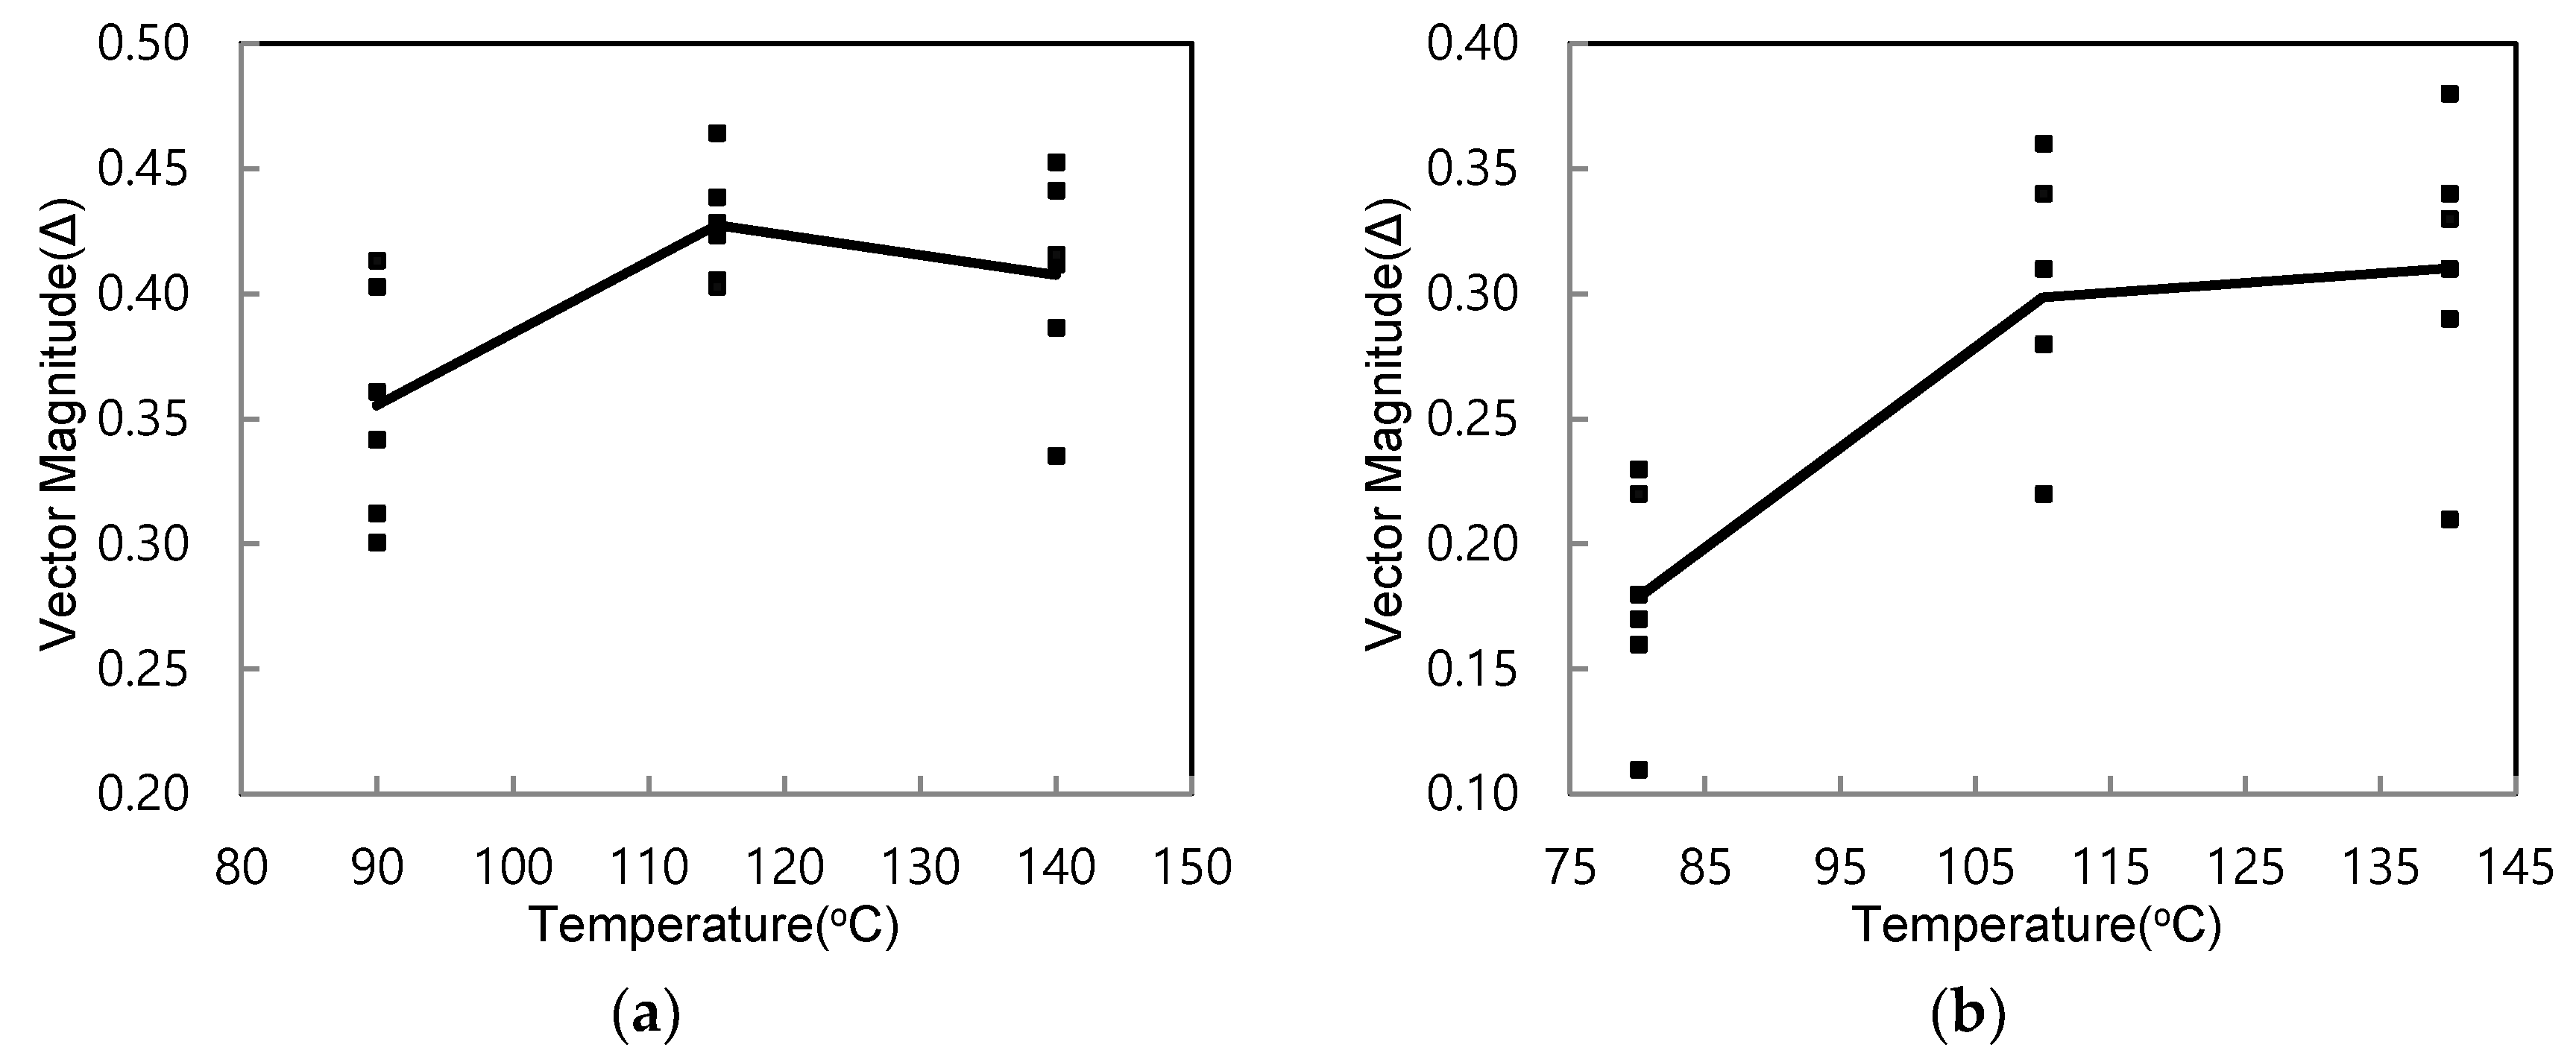
  • The aggregate orientation and the energy index were highly dependent on the compaction temperature. At high viscosity, the aggregates were not sufficiently able to slide and be moved for rearrangement; thus, the mixture needs more energy for compaction. There is an optimum compaction temperature at which a preferred orientation exists to provide a low-energy index. Excessive compaction temperature is unnecessary to obtain a better rearrangement of aggregates. Conversely, an excessive compaction temperature was found to be responsible for increasing the interaction of aggregates and causing a reduction in the amount of asphalt for lubrication.
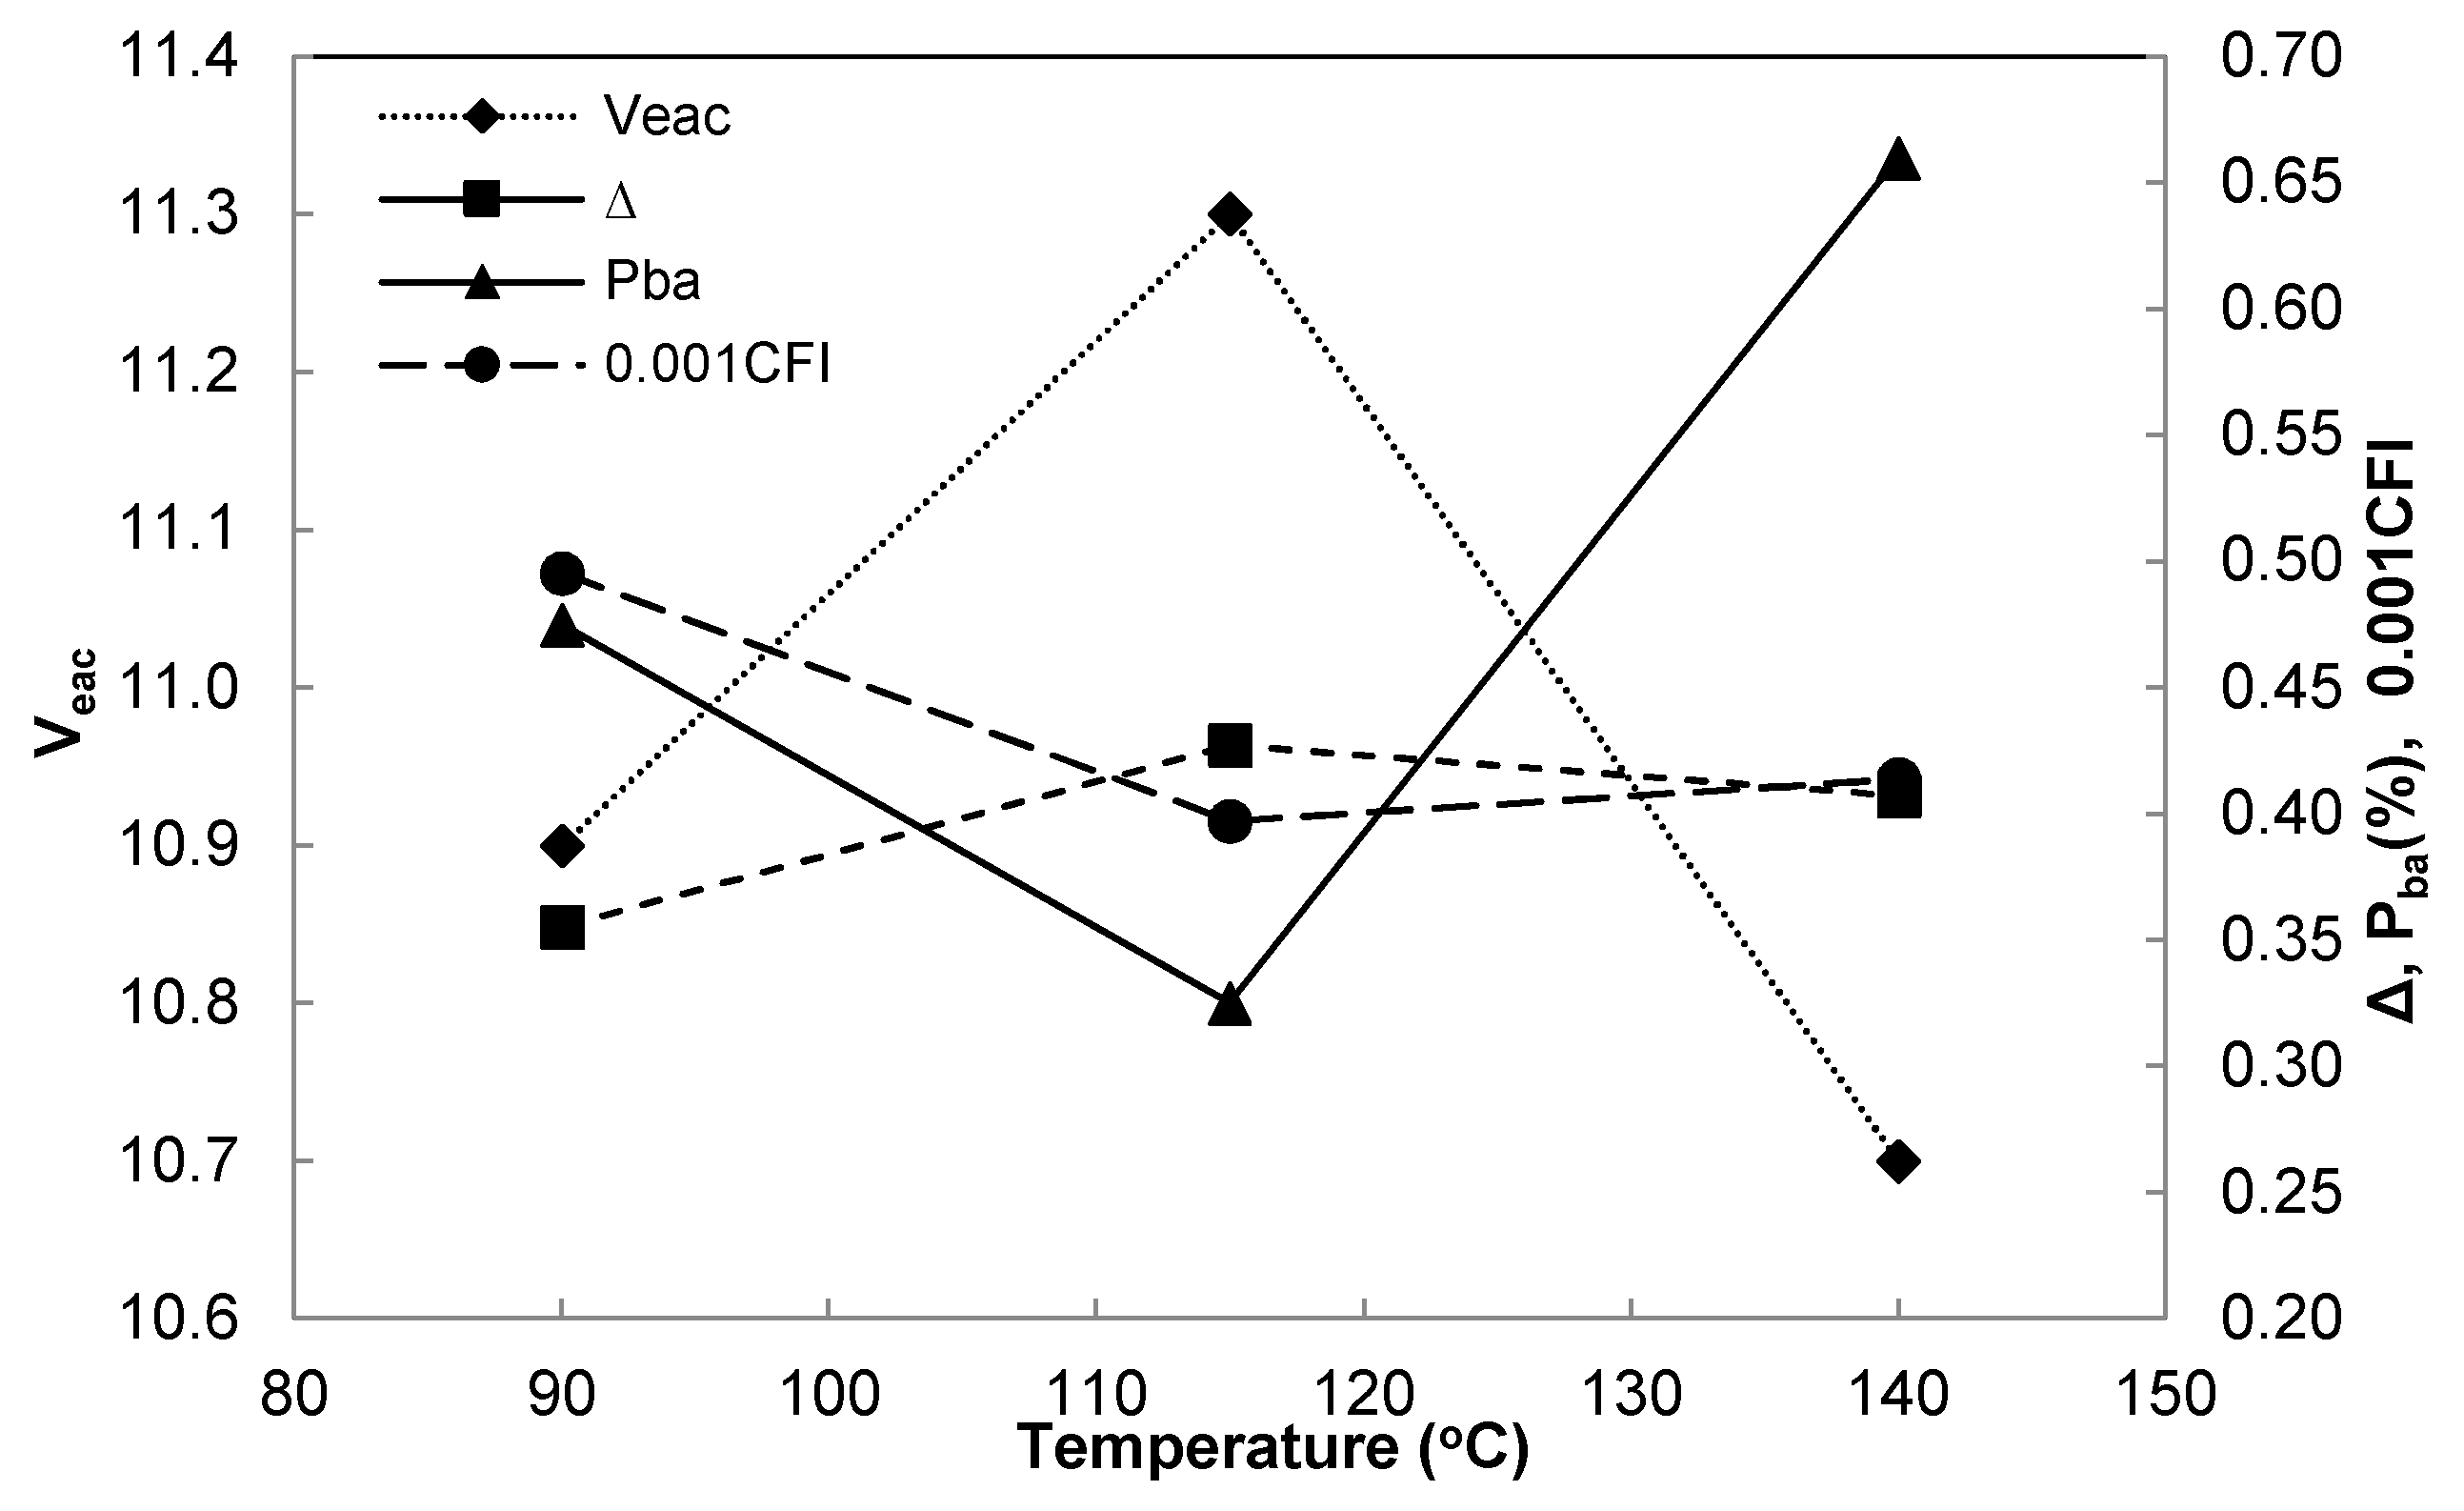
  • The results of the aggregate orientation and energy index studies show that the compaction temperature changes the asphalt mixture volume and causes internal friction changes due to aggregate interactions. The effect of the mixture volume change on the aggregate friction behavior was evaluated by the Veac and the Pba. Mixture acquires more Veac, at which an optimum compaction temperature produces low CEI and CFI values. Despite being higher than the optimum temperature for the PG62-28 mixture, the Veac decreased by 0.4% and 0.35% of the Pba, which flowed into the aggregates. This volumetric change in the Veac and Pba can produce a large frictional interaction between aggregates and eliminate the viscosity effect to increase a better rearrangement of aggregates.
  • The aggregate interaction effect was introduced to modify the More–Coulomb compaction concept, and it explains the additional friction that is produced due to the change in the volumetrics of mixture. The additional friction parameter is sensitive to the compaction temperature.

Author Contributions

Regarding the authors’ participation in the research, K.K. planned and performed the laboratory test, analyzed experiments, and drafted the manuscripts. M.K. guided this study, provided valuable comments, and revised the manuscripts.

Funding

This research received no external funding.

Conflicts of Interest

The authors declare that there is no conflict of interests regarding the publication of this paper.

References

  1. Zhang, C.; Wang, H.; You, Z.; Yang, X. Compaction characteristics of asphalt mixture with different gradation type through superpave gyratory compaction and X-ray CT scanning. Constr. Build. Mater. 2006, 129, 243–255. [Google Scholar] [CrossRef]
  2. Chen, J.; Wang, H.; Li, L. Virtual testing of asphalt mixture with two-dimensional and three-dimensional random aggregate structures. Int. J. Pavement Eng. 2015, 1–13. [Google Scholar] [CrossRef]
  3. Delage, K.P. The Effect of Fine Aggregate Angularity on Hot Mix Asphalt Performance. Master’s Thesis, University of Wisconsin-Madison, Madison, WI, USA, 2001. [Google Scholar]
  4. Tashman, L.; Masad, E.; Peterson, B.; Saleh, H. Internal structure analysis of asphalt mixes to improve the simulation of superpave gyratory compaction to field conditions. J. Assoc. Asph. Paving Technol. 2001, 70, 605–645. [Google Scholar]
  5. Chen, M.J.; Wong, Y.D. Evaluation of the development of aggregate packing in porous asphalt mixture using discrete element method simulation. Road Mater. Pavement Des. 2017, 18, 64–85. [Google Scholar] [CrossRef]
  6. Maerz, N.H. Technical and computational aspects of the measurement of aggregate shape by digital image analysis. J. Comput. Civ. Eng. 2004, 18, 10–18. [Google Scholar] [CrossRef]
  7. Sefidmazgi, N.R.; Teymourpour, P.; Bahia, H. Effect of particle mobility on aggregate structure formation in asphalt mixtures. Road Mater. Pavement Des. 2013, 14 (Suppl. 2), 16–34. [Google Scholar] [CrossRef]
  8. Sefidmazgi, N.R. Defining Effective Aggregate Skeleton in Asphalt Mixture Using Digital Imaging. Master’s Thesis, University of Wisconsin-Madison, Madison, WI, USA, 2011. [Google Scholar]
  9. Bessa, S.; Branco, V.T.C.; Soares, J.B.; Neto, J.A.N. Aggregate shape properties and their influence on the behavior of hot-mix asphalt. J. Mater. Civ. Eng. 2015, 27, D04014212. [Google Scholar] [CrossRef]
  10. Caro, S.; Castillo, D.; Darabi, M.; Masad, E. Influence of different sources of microstructural heterogeneity on the degradation of asphalt mixtures. Int. J. Pavement Eng. 2018, 19, 9–23. [Google Scholar] [CrossRef]
  11. Pasetto, M.; Baldo, N. Experimental evaluation of high performance base course and road base asphalt concrete with electric arc furnace steel slags. J. Hazard. Mater. 2010, 181, 938–948. [Google Scholar] [CrossRef] [PubMed]
  12. Wu, S.; Xue, Y.; Ye, Q.; Chen, Y. Utilization of steel slag as aggregates for stone mastic asphalt (SMA) mixtures. Build. Environ. 2007, 42, 2580–2585. [Google Scholar] [CrossRef]
  13. Masad, E.; Muhunthan, B.; Shashidar, N.; Harman, T. Quantifying laboratory compaction effects on the internal structure of asphalt concrete. Trans. Res. Rec. 1999, 1681, 179–185. [Google Scholar] [CrossRef]
  14. Perez-Jimenez, F.; Martinez, A.H.; Miro, R.; Hernandez-Barrera, D.; Araya-Zamorano, L. Effect of compaction temperature and procedure on the design of asphalt mixtures using marshall and gyratory compactor. Constr. Build. Mater. 2014, 65, 264–269. [Google Scholar] [CrossRef]
  15. Sefidmazgi, N.R.; Tashman, L.; Bahia, H. Internal Structure characterization of asphalt mixtures for rutting performance using imaging analysis. Road Mater. Pavement Des. 2012, 13 (Suppl. 1), 21–37. [Google Scholar] [CrossRef]
  16. Georgiou, P.; Sideris, L.; Loizos, A. Evaluation of the effects of gyratory and field compaction on asphalt mix internal structure. Mater. Struct. 2016, 49, 665–676. [Google Scholar] [CrossRef]
  17. Delgadillo, R.; Bahia, H. Effect of temperature and pressure on hot mixed asphalt compaction: Field and laboratory study. J. Mater. Civ. Eng. 2008, 20, 440–448. [Google Scholar] [CrossRef]
  18. Yin, A.; Yang, X.; Zhang, C.; Zeng, G.; Yang, Z. Three-dimensional heterogeneous fracture simulation of asphalt mixture under uniaxial tension with cohesive crack model. Constr. Build. Mater. 2015, 76, 103–117. [Google Scholar] [CrossRef]
  19. Airey, G.D.; Collop, A.C. Mechanical and structural assessment of laboratory and field compacted asphalt mixtures. Int. J. Pavement Eng. 2015, 17, 50–63. [Google Scholar] [CrossRef]
  20. Jiang, J.; Ni, F.; Gao, L.; Yao, L. Effect of the contact structure characteristics on rutting performance in asphalt mixtures using 2d imaging analysis. Constr. Build. Mater. 2017, 136, 426–435. [Google Scholar] [CrossRef]
  21. Cong, L.; Peng, J.; Guo, Z.; Wang, Q. Evaluation of fatigue cracking in asphalt mixtures based on surface energy. J. Mater. Civ. Eng. 2017, 29, D4015003. [Google Scholar] [CrossRef]
  22. Hassan, N.A.; Airey, G.D.; Hainin, M.R. Characterization of micro-structural damage in asphalt mixtures using image analysis. Constr. Build. Mater. 2014, 54, 27–38. [Google Scholar] [CrossRef]
  23. Pasetto, M.; Baldo, N. Influence of the aggregate skeleton design method on the permanent deformation resistance of stone mastic asphalt. J. Mater. Res. Innov. 2014, 18, 96–101. [Google Scholar] [CrossRef]
  24. Kehagia, F. Skid resistance performance of asphalt wearing courses with electric arc furnace slag aggregates. Waste Manag. Res. 2009, 27, 288–294. [Google Scholar] [CrossRef] [PubMed]
  25. Ahmedzade, P.; Sengoz, B. Evaluation of steel slag coarse aggregate in hot mix asphalt concrete. J. Hazard. Mater. 2009, 165, 300–305. [Google Scholar] [CrossRef] [PubMed]
  26. Bahia, H.; Friemel, T.; Peterson, P.; Russel, J. Optimization of constructability and resistance to traffic: A new design approach for HMA using the superpave compactor. J. Assoc. Asph. Paving Technol. 1998, 67, 189–232. [Google Scholar]
  27. Guler, M.; Bahia, H.; Bosscher, P.; Plesha, M. Device for measuring shear resistance of hot-mix asphalt in gyratory compactor. Trans. Res. Rec. 2000, 1723, 116–124. [Google Scholar] [CrossRef]
  28. Azari, H.; McCuen, R.H.; Stuart, K.D. Optimum compaction temperature for modified binder. J. Trans. Eng. 2003, 129, 531–537. [Google Scholar] [CrossRef]
  29. Sombre, R.; Newcomb, D.; Chadbourn, B.; Voller, V. Parameter to define the laboratory compaction temperature range of hot-mix asphalt. J. Assoc. Asph. Paving Technol. 1998, 67, 125–152. [Google Scholar]
  30. Fallaha, F.; Khabaz, F.; Kim, Y.R.; Reddy Kommidi, S.; Haghshenas, H.F. Molecular dynamics modeling and simulation of bituminous binder chemical aging due to variation of oxidation level and saturate-aromatic-resin-asphaltene fraction. Fuel 2019, 237, 71–80. [Google Scholar] [CrossRef]
  31. Khabaz, F.; Khare, R. Molecular simulations of asphalt rheology: Application of time–temperature superposition principle. J. Rheol. 2018, 62, 941–954. [Google Scholar] [CrossRef]
  32. Li, D.D.; Greenfield, M.L. Chemical compositions of improved model asphalt systems for molecular simulations. Fuel 2014, 115, 347–356. [Google Scholar] [CrossRef]
  33. Masad, E.; Scarpas, A.; Alipour, A.; Rajagopal, K.R.; Kasbergen, C. Finite element modelling of field compaction of hot mix asphalt. Part I: Theory. Int. J. Pavement Eng. 2016, 17, 13–23. [Google Scholar] [CrossRef]
  34. Masad, E.; Scarpas, A.; Rajagopal, K.R.; Kassem, E.; Koneru, S.; Kasbergen, C. Finite element modelling of field compaction of hot mix asphalt. Part II: Applications. Int. J. Pavement Eng. 2016, 17, 24–38. [Google Scholar] [CrossRef]
  35. Dai, Q.; Sadd, M.H.; Parameswaran, V.; Shukla, A. Prediction of damage behaviors in asphalt materials using a micromechanical finite-element model and image analysis. J. Eng. Mech. 2005, 131, 668–677. [Google Scholar] [CrossRef]
  36. Alvarez, A.E.; Martin, A.E.; Estakhri, C. Internal structure of compacted permeable friction course mixtures. Constr. Build. Mater. 2010, 24, 1027–1035. [Google Scholar] [CrossRef]
  37. Stakston, A.D.; Bahia, H.; Bushek, J.J. Effect of fine aggregate angularity on compaction and shearing resistance of asphalt mixtures. Trans. Res. Rec. 2001, 1761, 26–31. [Google Scholar] [CrossRef]
  38. Masad, E.; Jandhyala, V.K.; Dasgupta, N.; Somadevan, N.; Shashidhar, N. Characterization of air void distribution in asphalt mixes using X-ray computed tomography. J. Mater. Civ. Eng. 2002, 14, 122–129. [Google Scholar] [CrossRef]
  39. Wang, H.; Wang, J.; Chen, J. Micromechanical analysis of asphalt mixture fracture with adhesive and cohesive failure. Eng. Fra. Mech. 2014, 132, 104–119. [Google Scholar] [CrossRef]
  40. Onifade, I.; Jelagin, D.; Guarin, A.; Kringos, N. Asphalt Internal structure characterization with X-ray computed tomography and digital image processing. In Multi-Scale Modeling and Characterization of Infrastructure Materials; Kringos, N., Birgisson, B., Frost, D., Wang, L., Eds.; Springer: Dordrecht, The Netherlands, 2013; Chapter 11; pp. 139–158. [Google Scholar]
  41. Bessa, I.S.; Castelo Branco, V.T.F.; Soares, J.B. Evaluation of different digital image processing software for aggregates and hot mix asphalt characterizations. Constr. Build. Mater. 2012, 37, 370–378. [Google Scholar] [CrossRef]
  42. Bruno, L.; Parla, G.; Celauro, C. Image analysis for detecting aggregate gradation in asphalt mixture from planar images. Constr. Build. Mater. 2012, 28, 21–30. [Google Scholar] [CrossRef]
  43. Khattak, M.J.; Khattab, A.; Rizvi, H.R. Imaged-based discrete element modeling of hot mix asphalt mixtures. Mater. Struct. 2015, 48, 2417–2430. [Google Scholar] [CrossRef]
  44. Guo, Q.; Bian, Y.; Li, L.; Jiao, Y.; Tao, J.; Xiang, C. Stereological estimation of aggregate gradation using digital image of asphalt mixture. Constr. Build. Mater. 2015, 94, 458–466. [Google Scholar] [CrossRef]
  45. Liu, T.; Zhang, X.; Li, Z.; Chen, Z. Research on the homogeneity of asphalt pavement quality using X-ray computed tomography (ct) and fractal theory. Constr. Build. Mater. 2014, 68, 587–598. [Google Scholar] [CrossRef]
  46. Renken, P. Compaction in the Laboratory and in Practice. In Mechanical Tests for Bituminous Mixes. Characterization, Design and Quality Control; Fritz, H.W., Eustacchio, E., Eds.; Chapman and Hall: London, UK, 1990; pp. 32–36. [Google Scholar]
  47. Soille, P. Morphological Image Analysis: Principles and Applications, 2nd ed.; Springer: Berlin/Heidelberg, Germany, 2013; ISBN 978-3-540-42988-3. [Google Scholar]
  48. Hartig, S.M. Basic image analysis and manipulation in ImageJ. Curr. Protoc. Mol. Biol. 2013, 102, 1–12. [Google Scholar] [CrossRef]
  49. Matlab. 2017. Available online: http://mathworks.com (accessed on 24 October 2018).
Figure 1. Compaction process as a function of compaction work [46].
Applsci 08 02045 g001
Figure 2. Mohr–Coulomb failure on the effect of temperature.
Applsci 08 02045 g002
Figure 3. Compaction energy index (CEI).
Applsci 08 02045 g003
Figure 4. Applying equalization (b) on a gray-scale image (a).
Applsci 08 02045 g004
Figure 5. A series of image enhancements: (a) an asphalt mixture image; (b) gray-scale image of rectangular region in the asphalt mixture image; (c) equalizing image; (d) low pass filtering image; (e) median filtering image.
Applsci 08 02045 g005
Figure 6. A series of segmentation process: (a) applying edge detection on the image of Figure 4b; (b) image map presenting different threshold values; (c) a binary image after threshold.
Applsci 08 02045 g006
Figure 7. Morphological operations: (a) a gray-scale image; (b) after threshold; (c) watershed splitting filter with erosion/dilation for the splitting of contacts.
Applsci 08 02045 g007
Figure 8. (a) A binary image after threshold; (b) after applying watershed splitting filter with erosion/dilation functions.
Applsci 08 02045 g008
Figure 9. Variations of ∆: (a) PG64-28 mixtures; (b) PG58-28 mixtures.
Applsci 08 02045 g009
Figure 10. Comparisons of the energy indices and the ∆ as function of temperature: (a) PG64-28 mixtures; (b) PG58-28 mixtures.
Applsci 08 02045 g010
Figure 11. Relationships of aggregate orientation and energy index corresponding to volume change in the PG64-28 mixtures.
Applsci 08 02045 g011
Figure 12. Modifying the Mohr–Coulomb compaction concept by adding the change in internal friction.
Applsci 08 02045 g012
Table 1. Compaction matrix. (NMAS: Nominal maximum aggregate size).
Aggregate SourceGradation & NMASAsphalt Binder GradeCompaction Temperature (°C)Number of Specimens
Crushed GravelFine (19 mm)PG64-28902
1152
1402
PG58-28802
1102
1402
Table 2. Volumetric properties of asphalt mixtures.
Mixture Identification1 GsbAsphalt Contents (%)Compaction Temperature (°C)%Gmm at NdesignAir Void (%)GmmVMA (%)VFA (%)1 Veac (%)2 Pba (%)
PG 58-282.7225.014096.04.02.54115.170.811.10.54
96.13.92.54715.369.911.10.44
11096.04.02.53815.372.311.20.39
95.94.12.53215.471.411.30.28
8094.35.72.54115.768.710.70.41
95.24.82.54015.868.110.60.41
PG 64-282.7225.114096.04.02.54614.772.310.70.58
95.94.12.55514.871.910.60.74
11595.94.12.53215.473.111.30.35
95.94.12.52915.572.911.30.30
9095.05.02.54116.167.610.70.50
94.85.22.53815.968.410.60.45
1 Gsb = the bulk specific gravity of aggregates, Veac = the volume of effective asphalt. 2 Pba = the percent of absorbed asphalt binder by weight of aggregates.

