1. Introduction
A super-pressure balloon (SPB) is a vehicle that can fly at a constant altitude for an extended period to perform scientific observations at a fraction of the cost of using a satellite. The SPB maintains its internal gas at a pressurized state, which suppresses buoyancy fluctuation when the balloon volume changes due to atmospheric temperature variations between day and night [
1,
2]. JAXA has been developing a lightweight, high strength balloon made of thin polyethylene films and a diamond-shaped net with high strength tensile fibers. Previous research shows that the tensile strength of the net meets requirements on SPB member strength, though the nets covering the SPB sometimes become damaged during the inflation test [
3,
4,
5]. This may be due to non-uniform expansion, which causes stress concentration, although no method exists to confirm this hypothesis [
6,
7,
8]. Contact measuring devices like strain gauges are not suitable because the SPB is too large to monitor the whole balloon and because they can deform the balloon surface during the contact measurement. Conversely, non-contact measurement methods such as the Digital Image Correlation method (DIC) can be efficiently used for this application.
DIC—an optical method to measure changes in images—usually requires the use of patterns to be applied onto the specimen surface. This method is used not only for measuring the deformation of a test piece in a tensile test but also in fracture mechanics problems and bioengineering applications [
9,
10,
11]. This method may be able to detect the stress concentration on the SPB [
12]. However, it is not suitable to study the shape of SPBs, as ink spots on the thin film may affect its strength and weight properties. To measure the deformation as accurately as possible, it is necessary to spray the particles evenly and as finely as possible to a wide range. However, if we do this, a large amount of ink will be applied to the surface, not only will it weigh more but also the polyethylene film will not stretch uniformly due to curing of the ink.
To overcome this problem, a Simplified DIC (SiDIC) using intersection detection technology was developed, which allowed us to track the diamond-shaped weave of the net so that we could measure the deformation of the SPB during the pressurization process. In this study, we developed SiDIC and verified the measurement accuracy, using a rubber balloon and diamond-shaped plastic net. First, the measurement accuracy of DIC using a patterned rubber balloon was confirmed and the deformation size measured by DIC was consistent with the rough calculations. Next, the accuracy of SiDIC was tested using a rubber balloon with random spray patterns and covered by a diamond-shaped plastic net. The pictures taken before and after deformation were analyzed using DIC and SiDIC, and the results were compared. DIC and SiDIC measured very similar deformation fields. The two methods were then tested using a rubber balloon covered just with the net. It was found that SiDIC entailed a smaller amount of data although it measured the deformation more accurately than DIC. In addition, assuming the stress concentration, the net was bonded to the balloon to restrict the deformation. Remarkably, SiDIC could properly identify the undeformed region. In summary, SiDIC is a simple and efficient method for measuring the SPB’s deformation field.
2. Simplified Digital Image Correlation Method
2.1. Digital Image Correlation
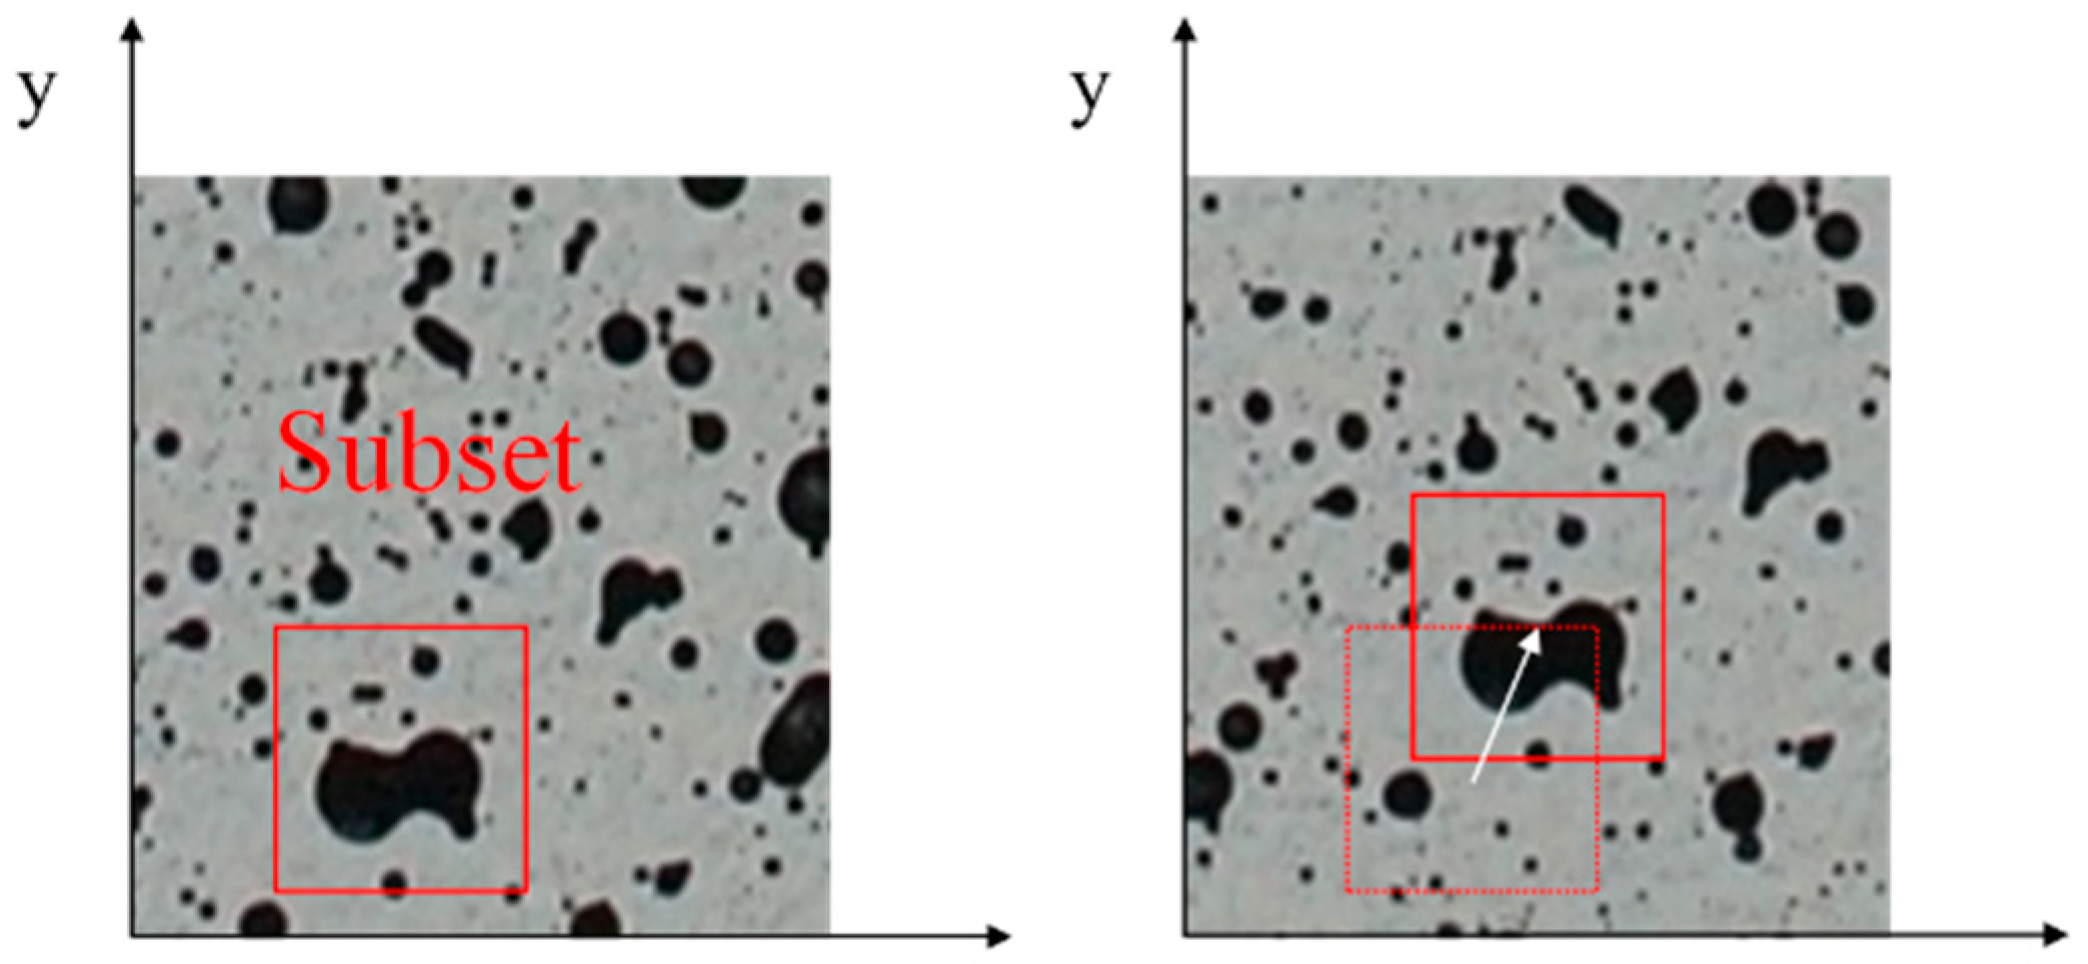
DIC is a non-contact method for measuring the amount of movement (displacement amount) on the specimen surface. A picture of the specimen surface is taken before and after deformation using a digital camera. An identical point on the specimen is determined in the images before and after deformation; the amount of movement of this point is used to obtain the amount of displacement undergone by the specimen surface. To obtain the amount of movement, the correlation of the light intensity value distribution, which defines the deformed position of the calculation region composed of a subset of pixels (see
Figure 1), is expressed as Equation (1).
F: Light intensity value before deformation G: Light intensity value after deformation
(x, y): Coordinates before deformation (x*, y*): Coordinates after deformation
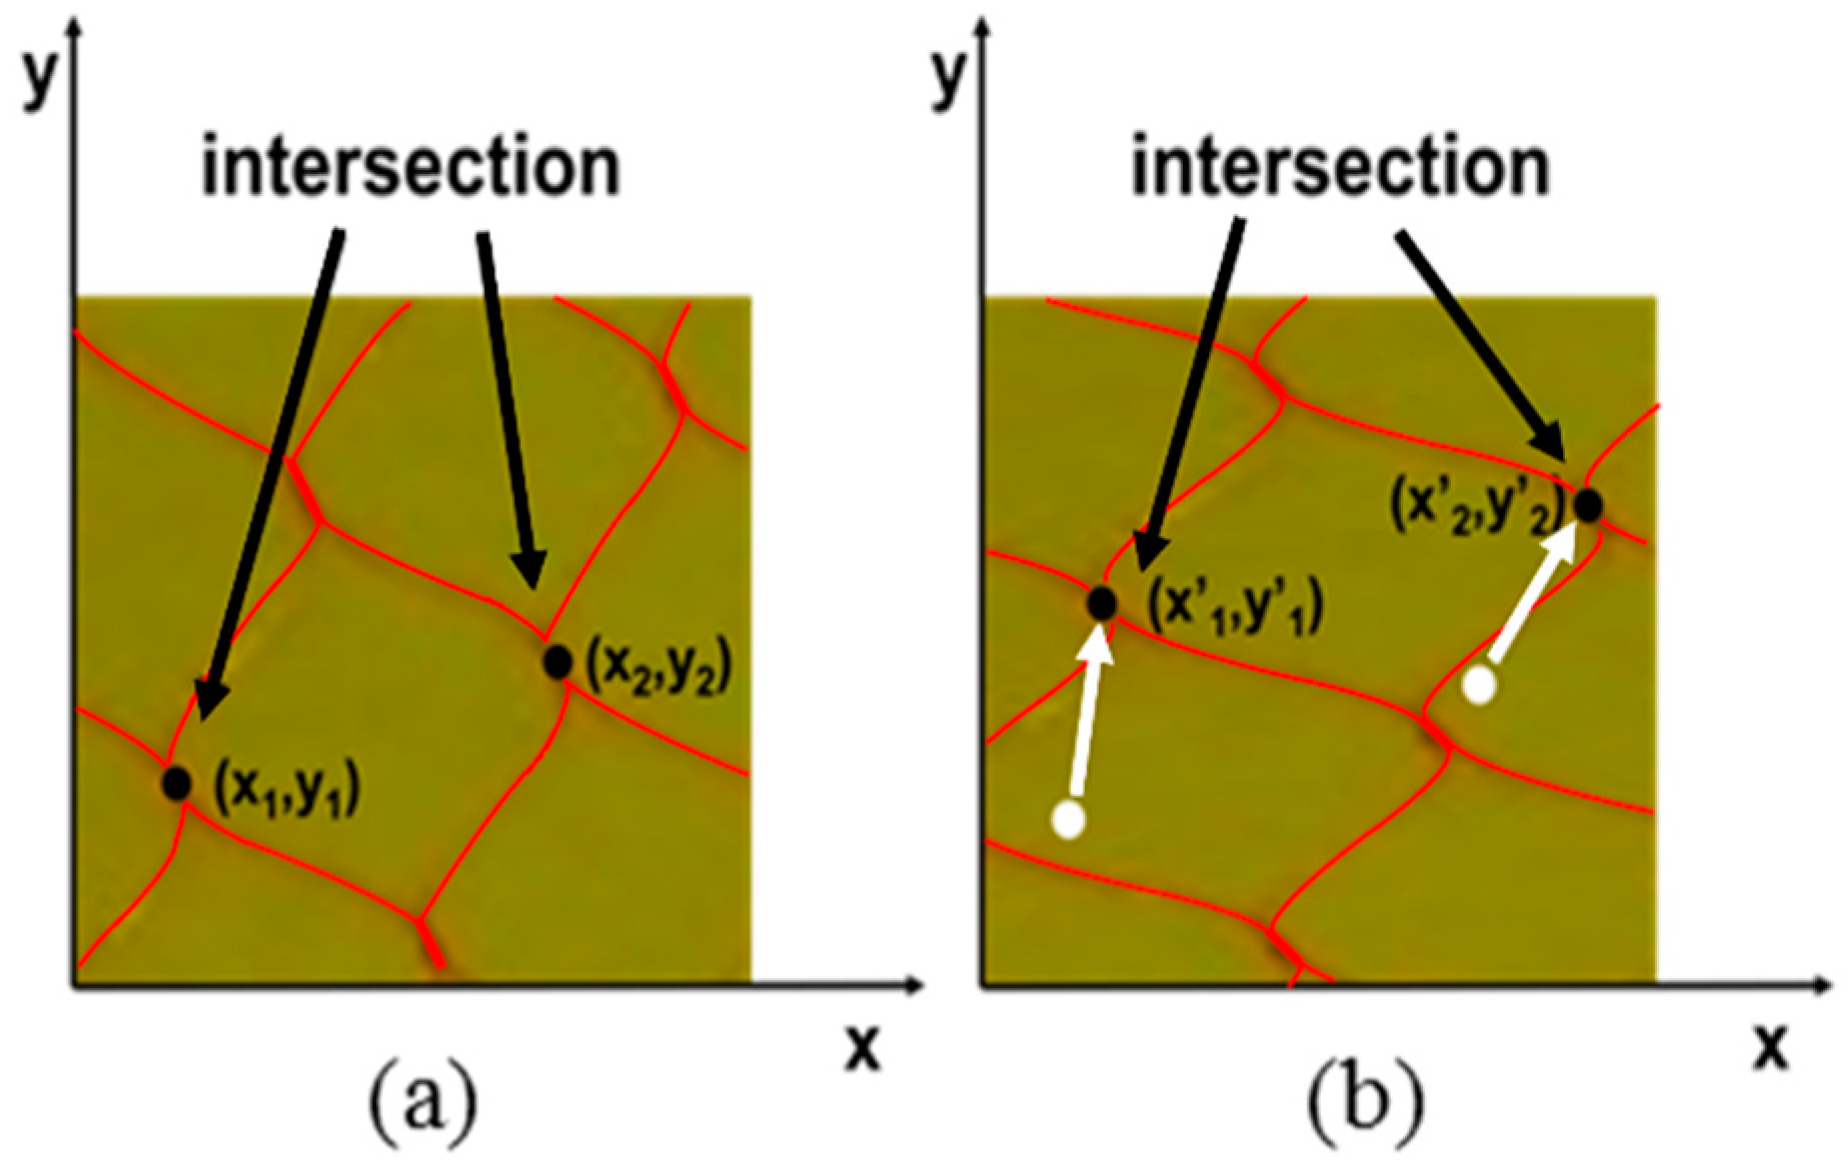
2.2. The Simplified DIC and the Intersection Detection
SiDIC is a simple method to measure deformations. Instead of reading the light intensity values of the image, SiDIC recognizes the movement of the intersections to measure the deformation.
Figure 2 shows how SiDIC measures the deformation. Basically, SiDIC reads the intersections of the net covering the balloon by using the intersection detection technology. SiDIC calculates the amount of deformation by reading the coordinates of the intersections. In this research, we detected the intersections by visual inspections. First, we read the coordinates of the intersections before and after deformation. Since actual intersections of net elements are represented by lines, there is no clear intersection in the image captured. In this experiment, the center of the line is defined as the intersection of the net. After reading the coordinates of the intersections, Equations (2) and (3) are used to calculate the amount of displacement. As a result, SiDIC measures the displacement from the amount of movement in the x and y directions before and after the deformation of each intersection.
3. DIC and SiDIC Experiments on a Rubber Balloon
3.1. Experimental Setups
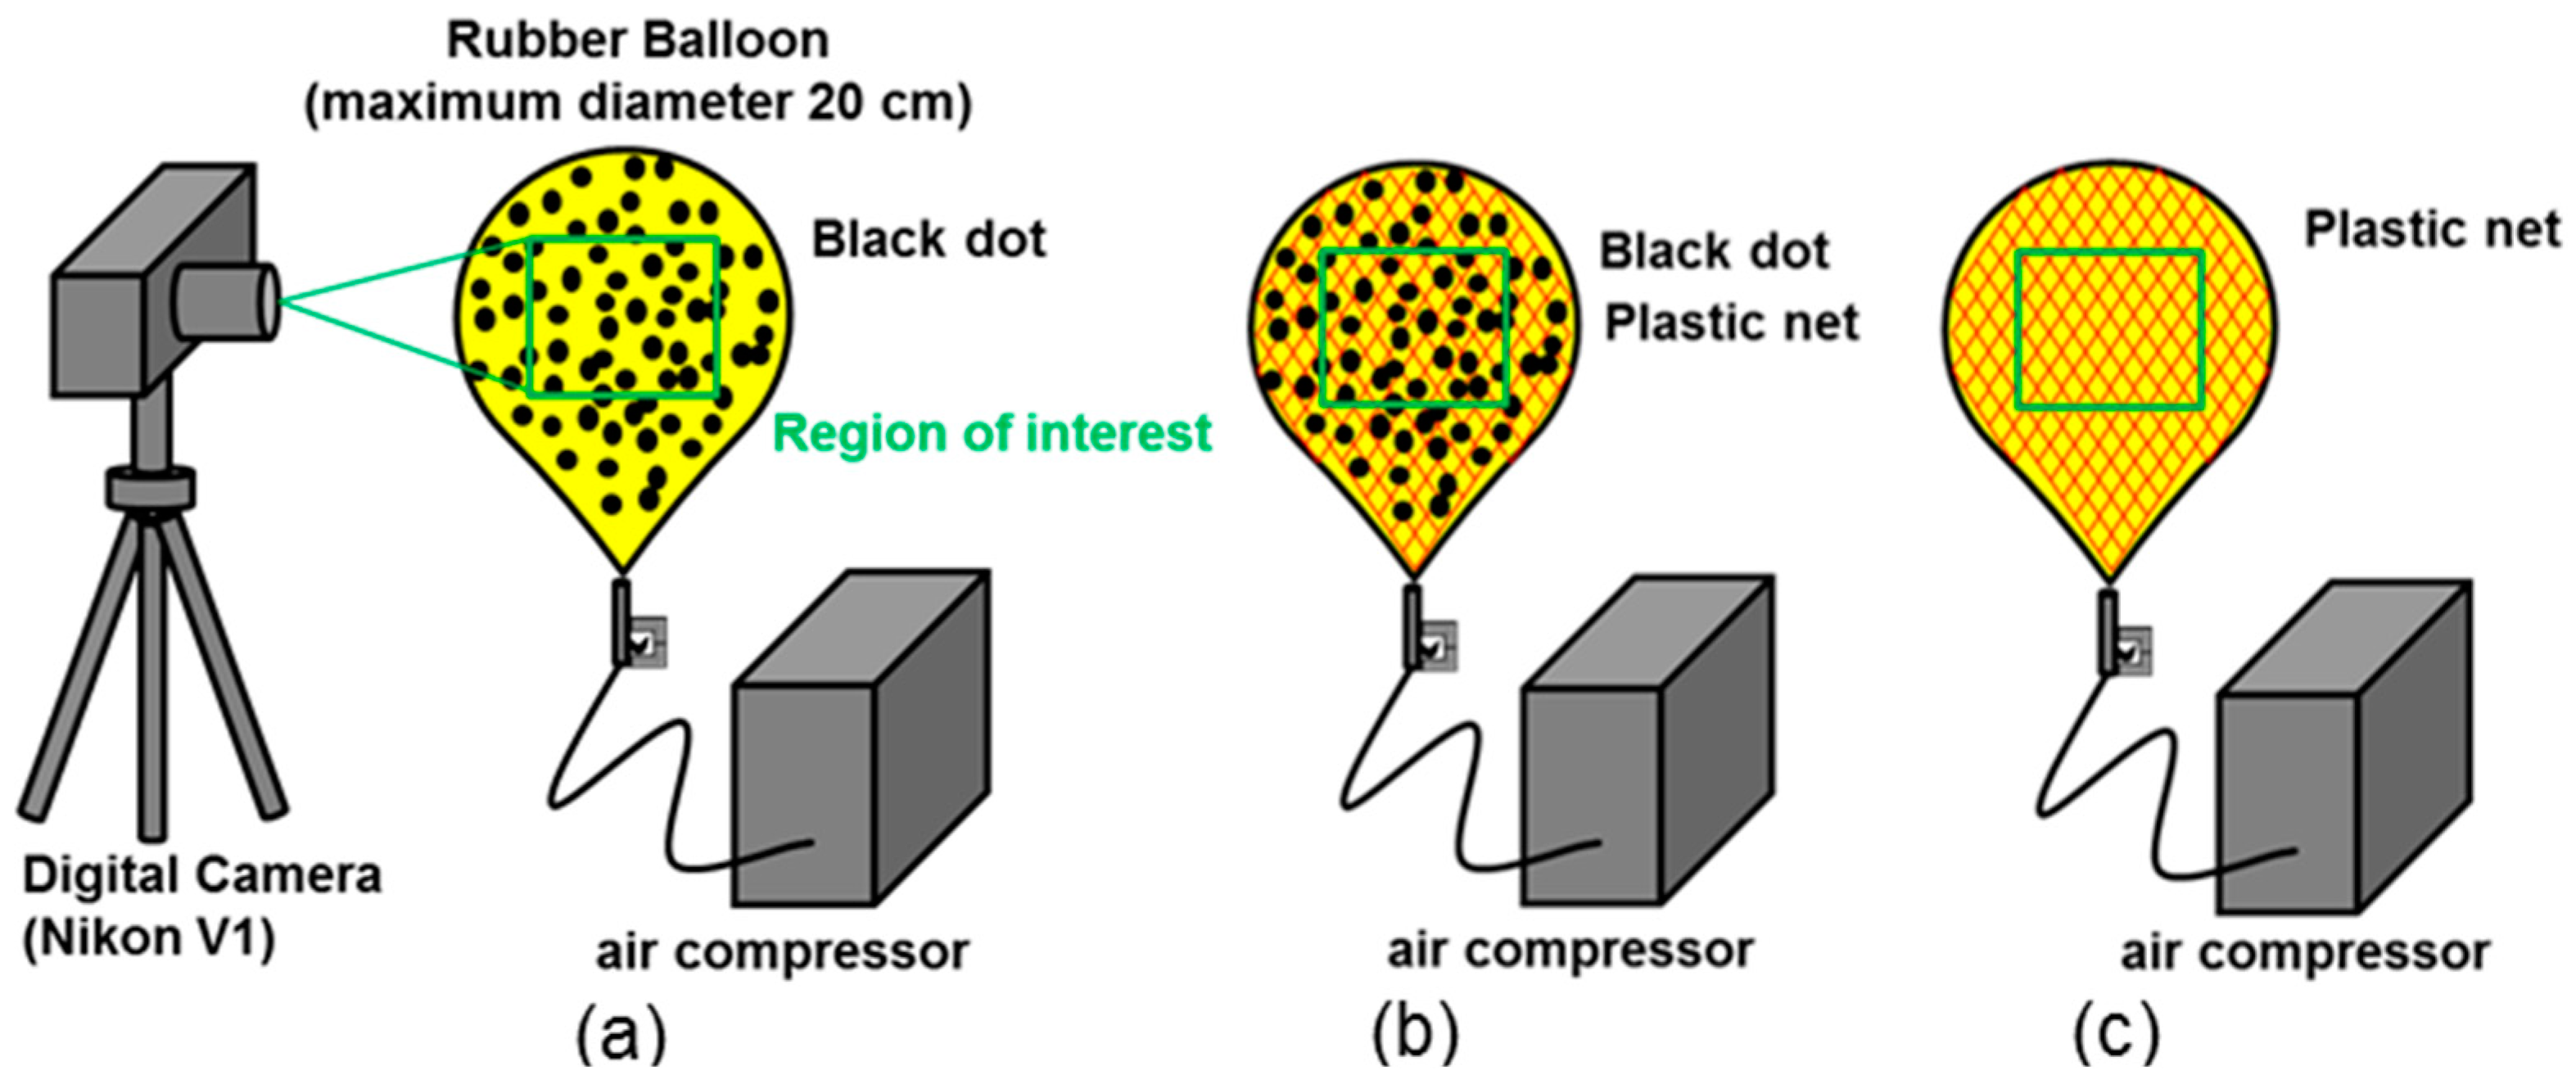
To verify the measurement accuracy of SiDIC, first, the measurement accuracy of DIC was determined using a random spray patterned rubber balloon as shown in
Figure 3a. We used a rubber balloon with a maximum diameter of 20 cm and the size of the particles covering the balloon surface was 1~5 [mm] (1.5~12 [pixel]). Next, to verify the measurement accuracy of SiDIC, a balloon which not only has random spray patterns but is also covered by a net was used as shown in
Figure 3b. This makes it possible to use both methods. The thickness of the net is 1 mm. We took pictures after the balloon surface dug into the net holes. In the SPB, it is known that the net and film deforms together in this state. Therefore, we assume it will deform together as well. To test whether DIC and SiDIC could be applied to the actual SPB, a rubber balloon covered only by a net, as shown in
Figure 3c, was used.
Generally, the shape of three-dimensionally deformed objects is measured using the three-dimensional DIC (3D-DIC). Since the planar limitation comes from the two-dimensional nature of the images shot by the camera, the solution is to use more than one camera. From images taken from two different angles of the same object, it is possible to estimate its 3D shape [
13]. In this method, it is assumed that two-dimensional deformation measurement using DIC of each image taken from different angles is performed correctly. Therefore, in this research, we confirm whether the 2D deformation measurement of each image is done correctly. In this experiment, a digital camera is used to take an image of the balloon before and after deformation. Therefore, not the actual deformation of the surface of the balloon but the two-dimensional deformation amount on the image is measured. The unit deformation measured from the image corresponds to a pixel.
3.2. The Measurement Accuracy of DIC Applied to a Rubber Balloon
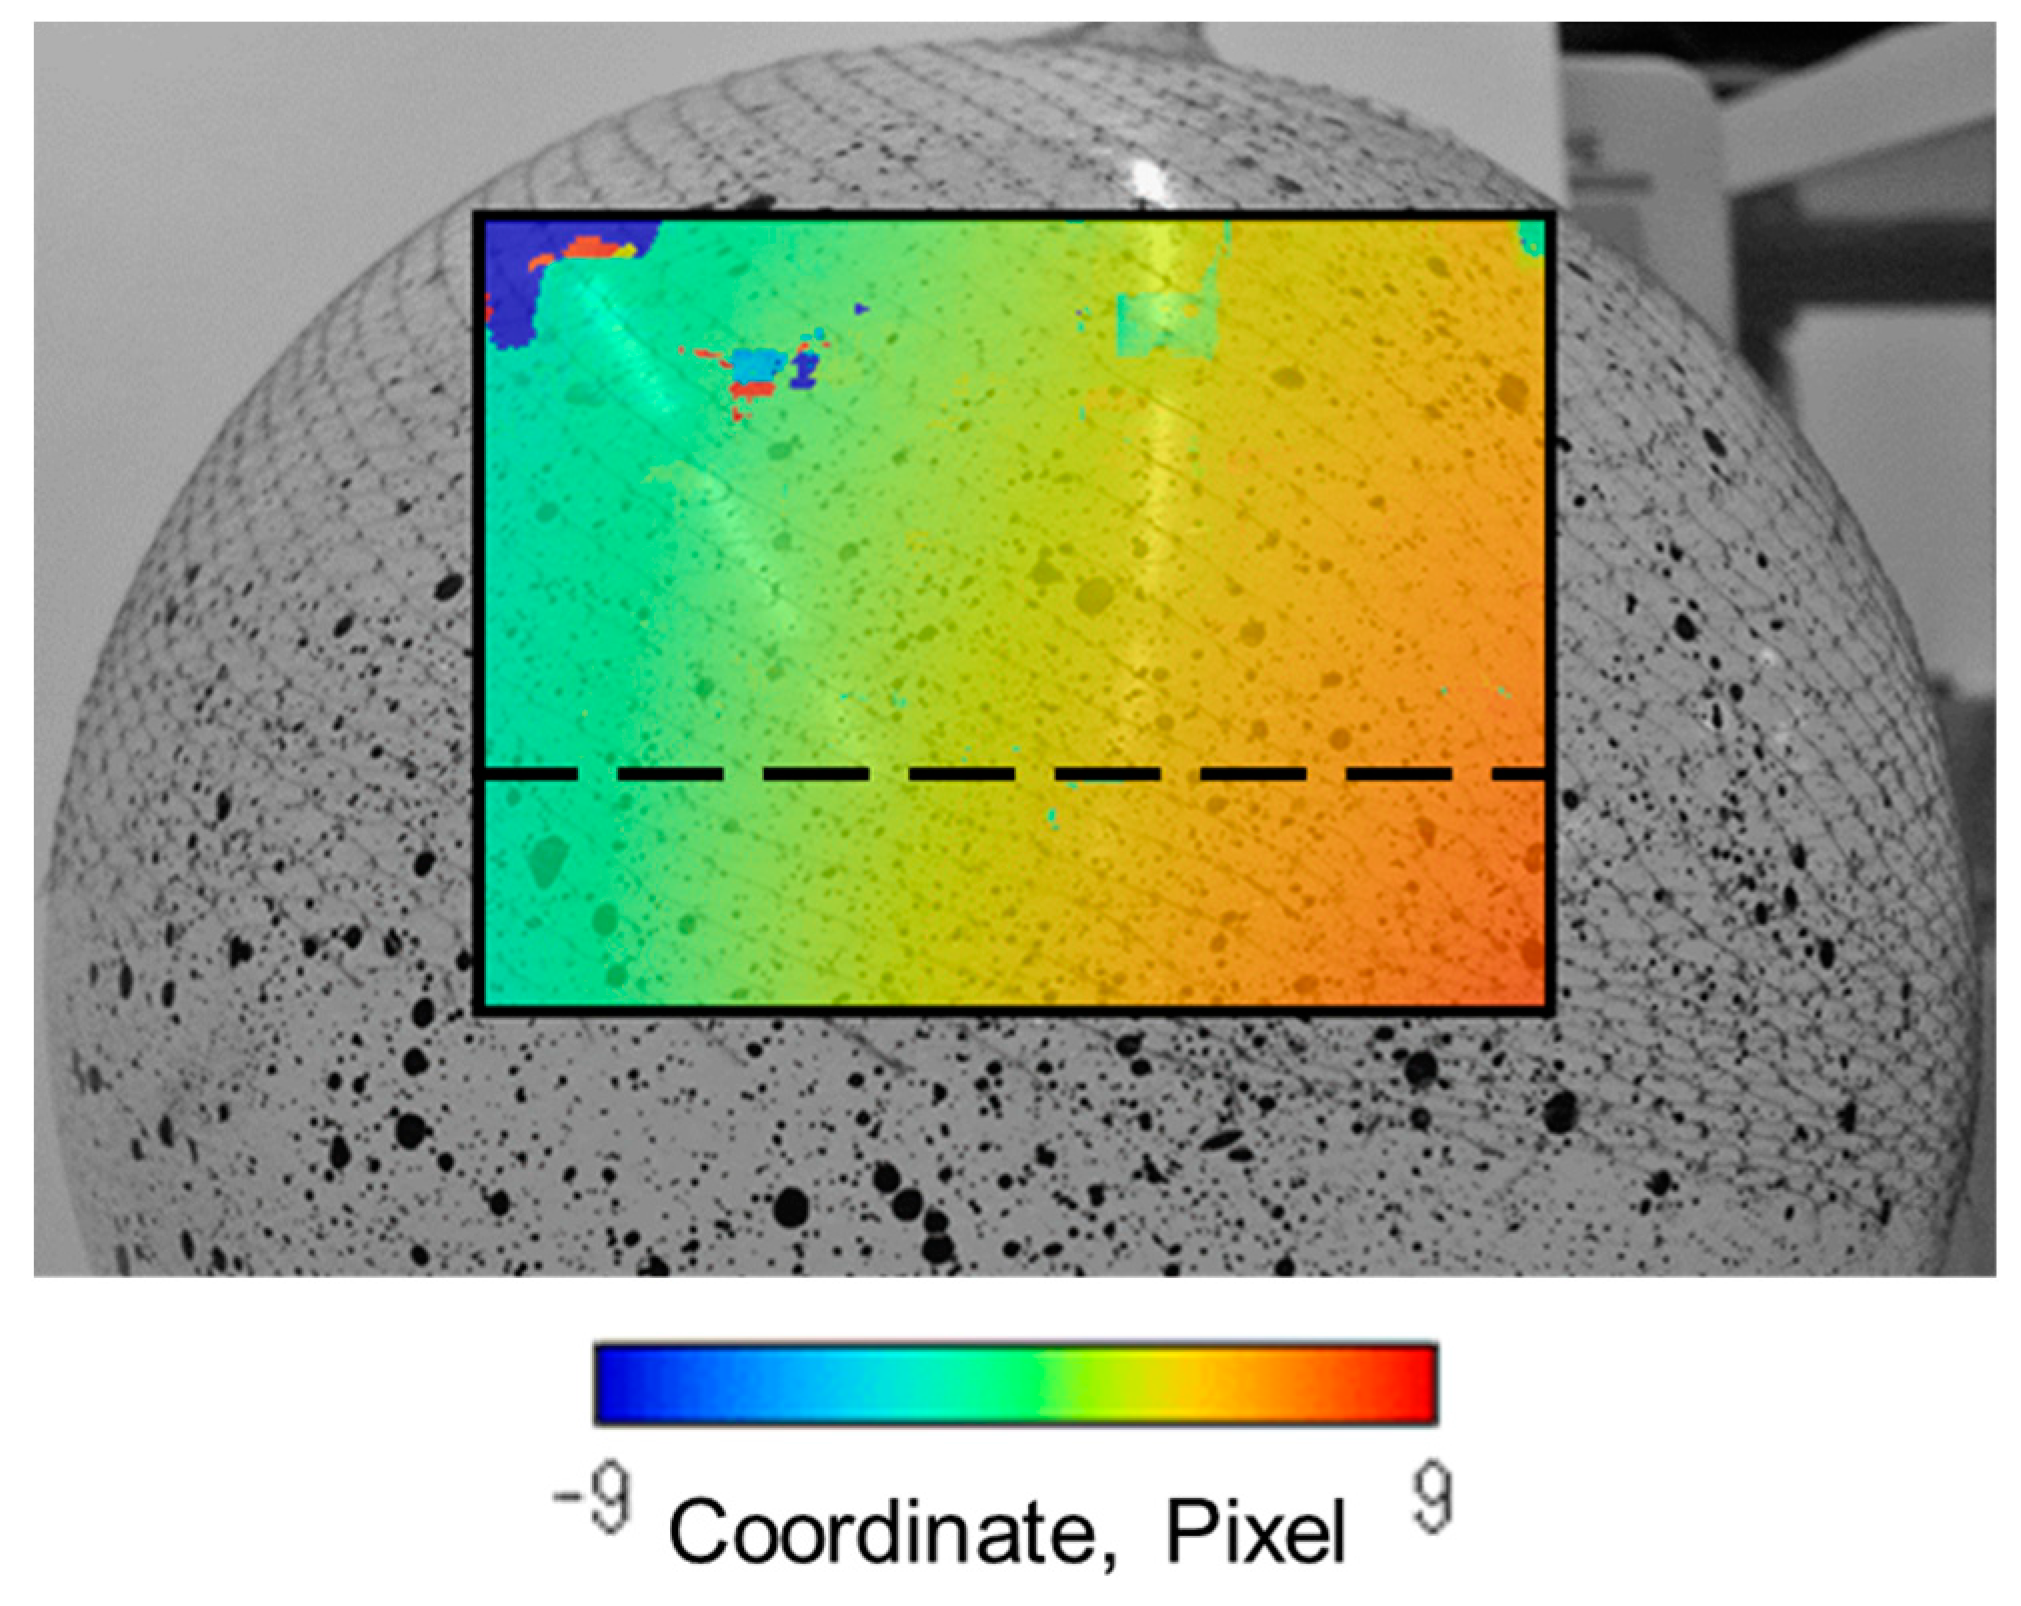
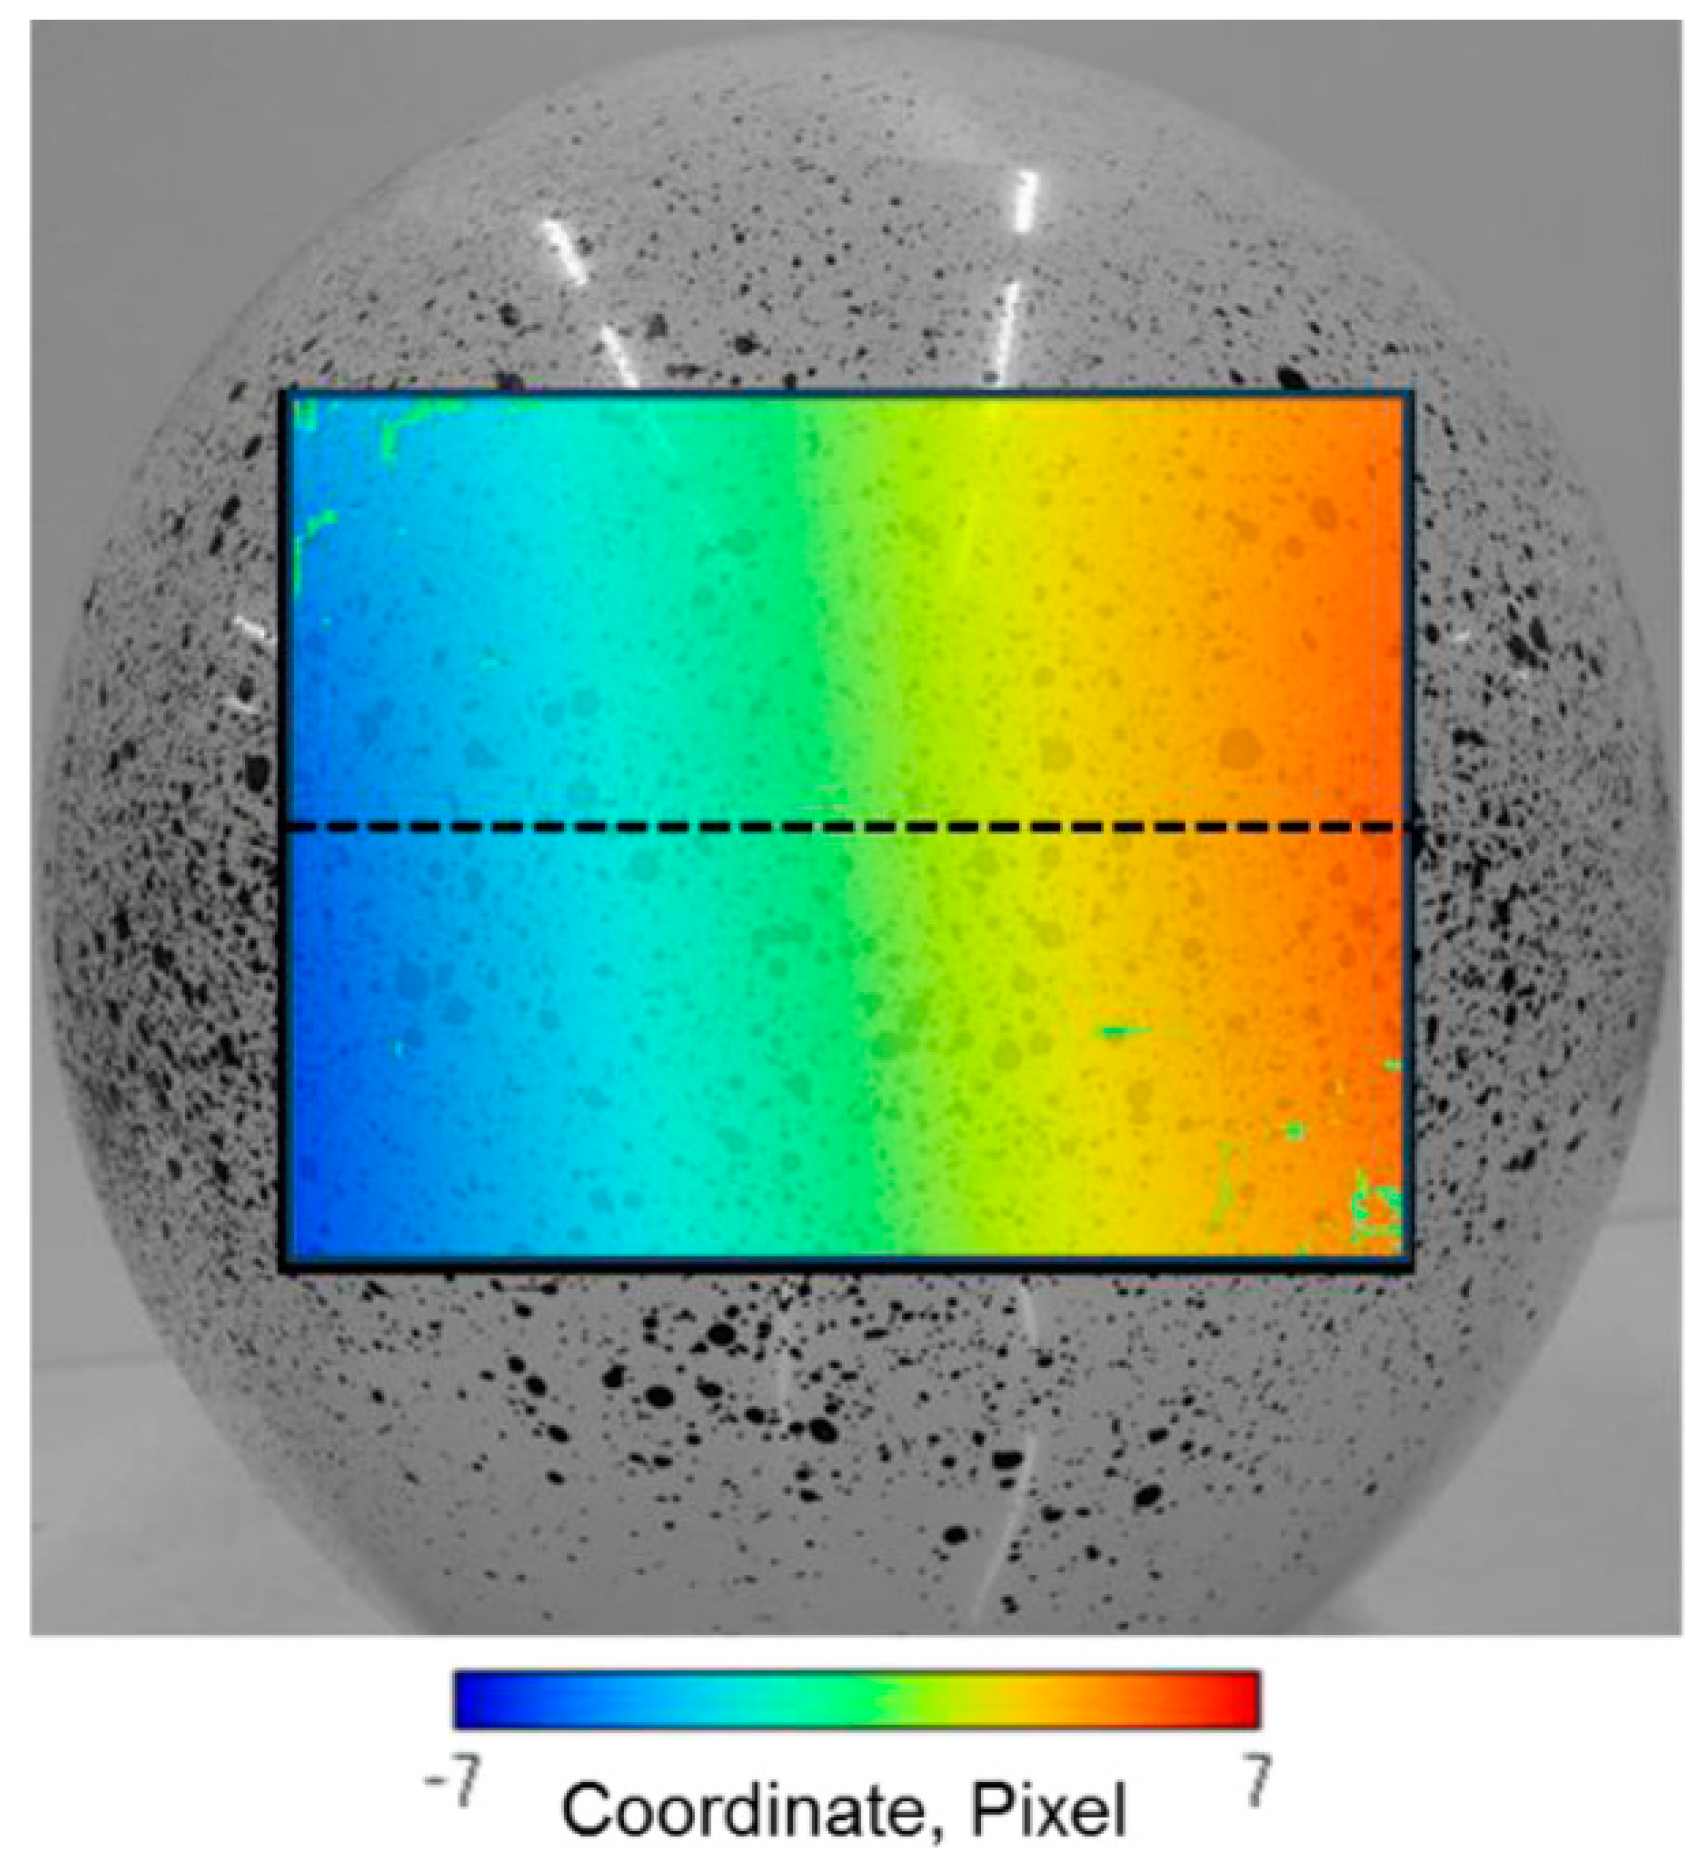
We liken the SPB to a rubber balloon. We sprayed a black pattern onto the rubber balloon and analyzed the deformation using DIC.
Figure 4 shows the displacement distribution in the x-direction obtained from the DIC analysis. It shows how much control point coordinates moved after deformation using a color scale.
From
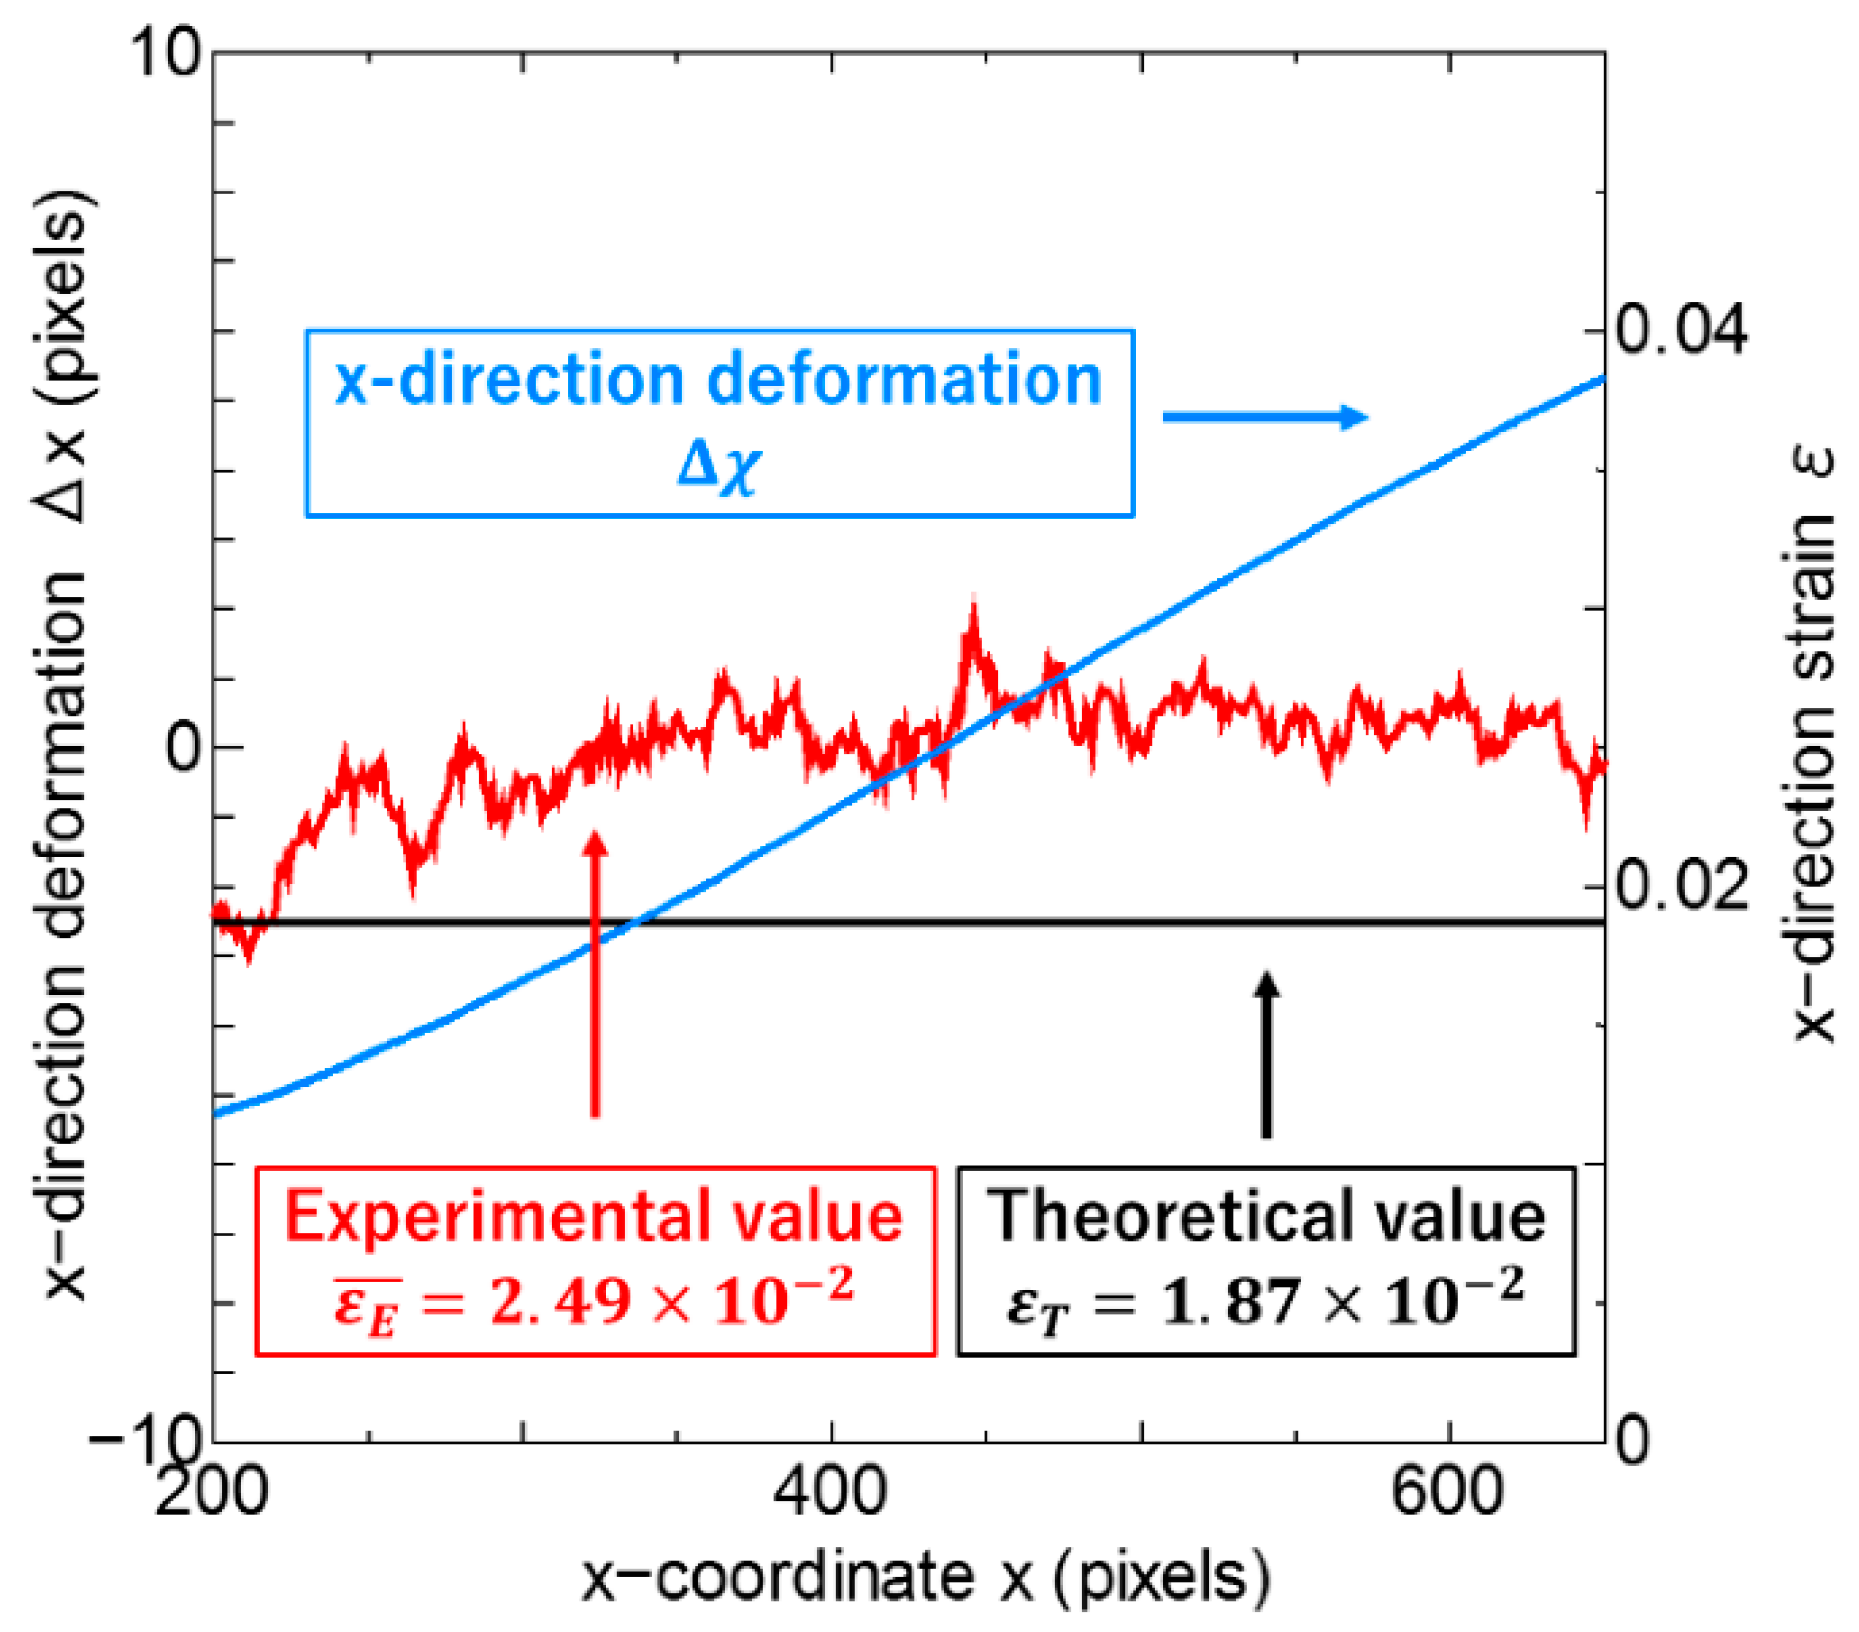
Figure 4, the displacement is clearly readable. Next, we verified the measurement accuracy of DIC. In this study, it is assumed that the balloon expands uniformly in the circumferential direction. The balloon is assumed to behave as a sphere and strain values are determined from Equations (4)–(7) by comparing the maximum radius value of the balloon before and after the deformation. To calculate the rough theoretical value, we measured the maximum radius from the pictures taken before and after deformation. After measuring the radius, we used Equation (4) to calculate the theoretical value of the strain. The radius before deformation (R) was 321 pixels, and the radius after deformation (R’) was 327 pixels. The experimental value was obtained using Equations (5) through (7). Notations “x” and “x’” indicate the x-direction deformation results by DIC. Computed strains are shown in
Figure 5. From
Figure 5, the experimental value showed a similar value compared to the theoretical value. Therefore, we found that the displacement and strain could be measured using classical DIC. The reason why the error occurred was that the balloon was assumed to be a sphere and to inflate uniformly.
3.3. Comparison of DIC and SiDIC Measurements Accuracy
Next, the measurement accuracy of SiDIC was verified by using balloon (b) in
Figure 3.
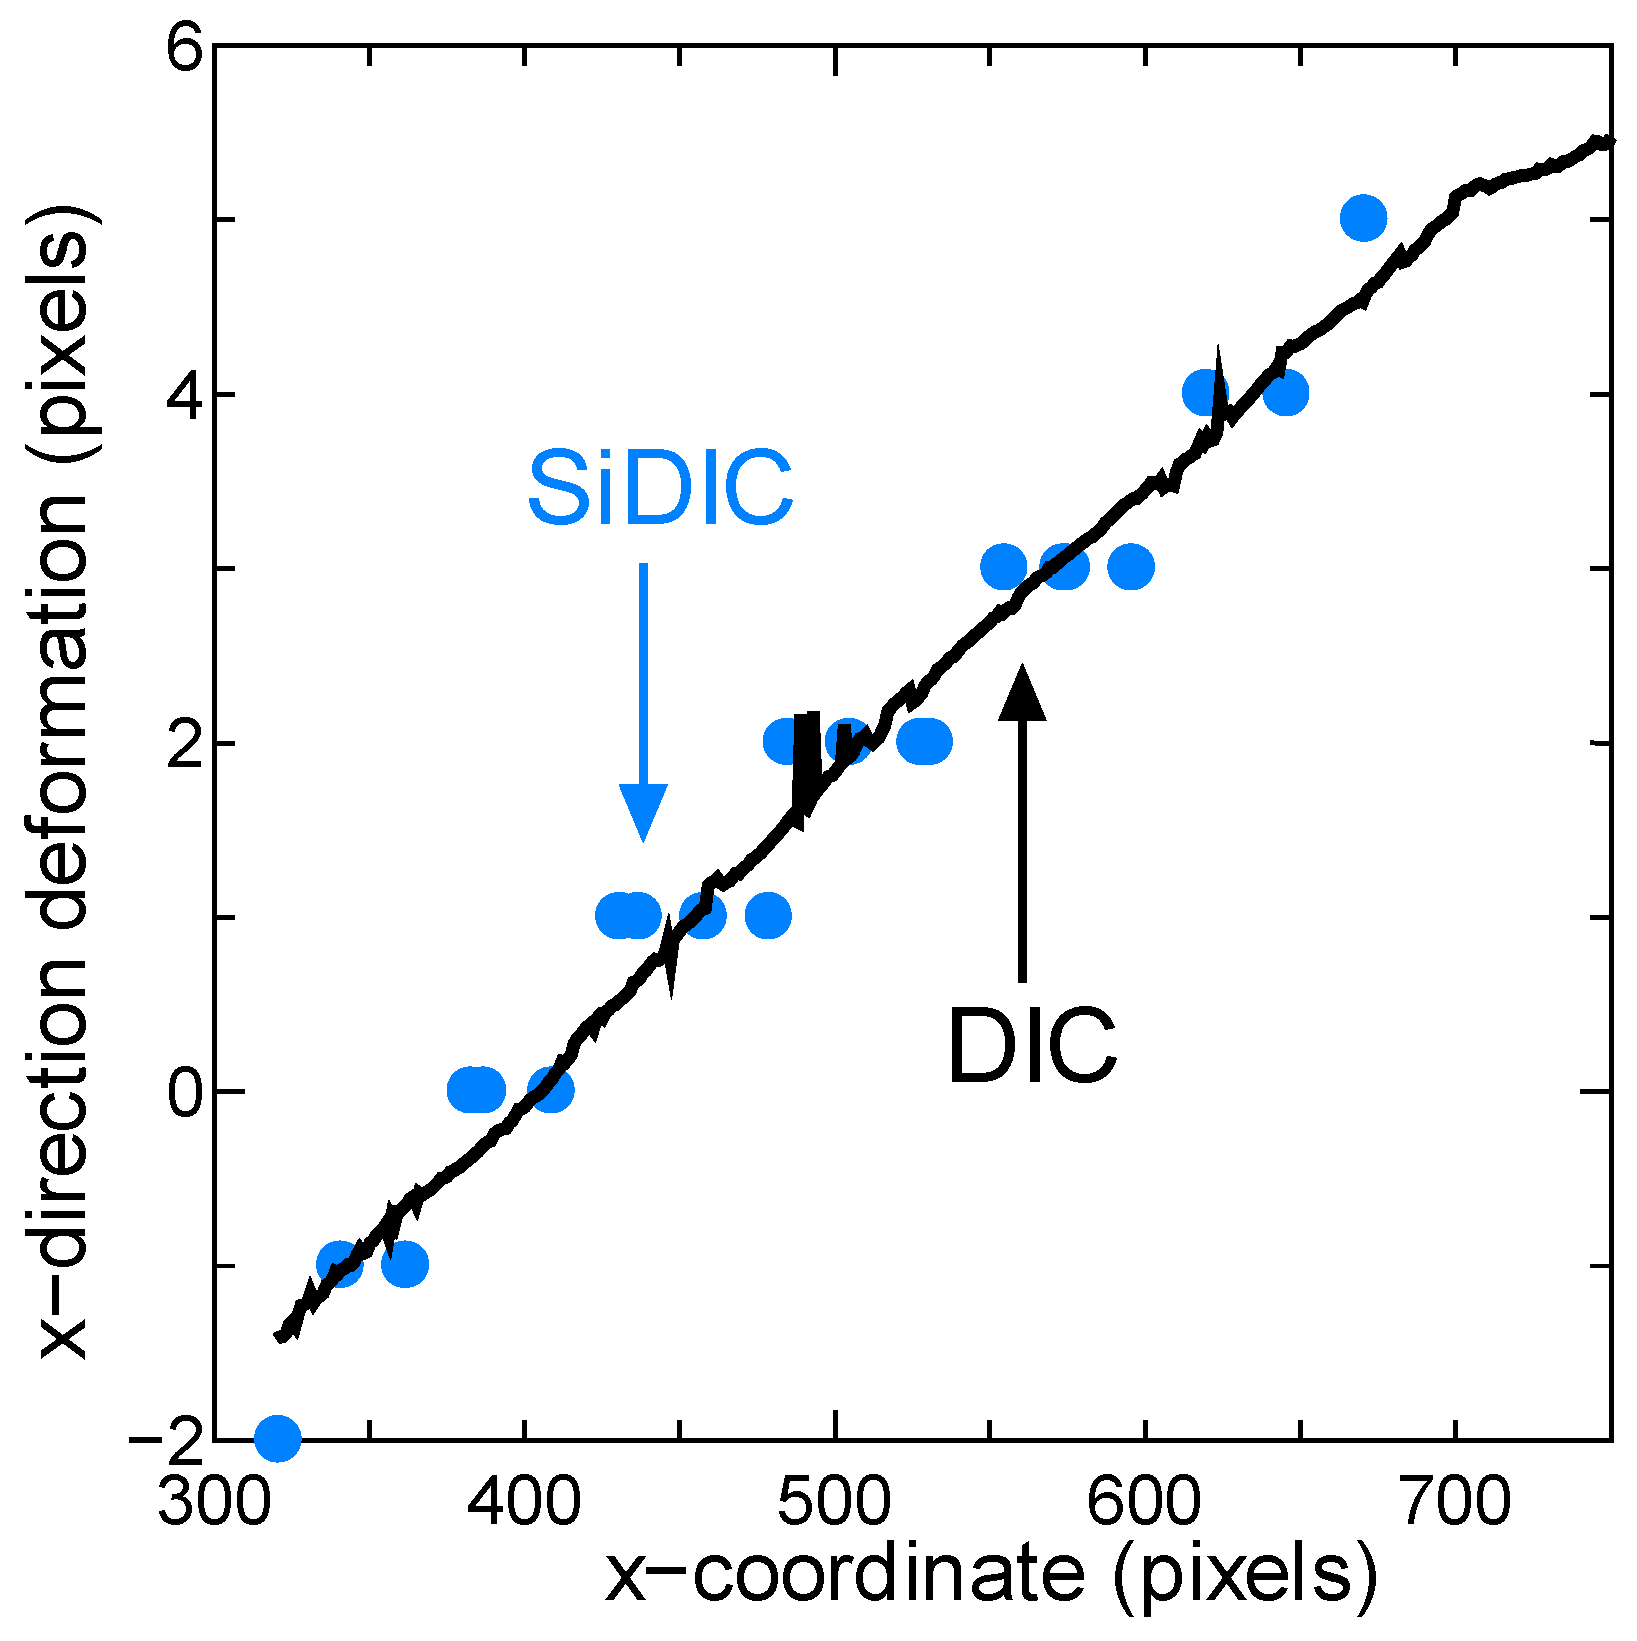
Figure 6 shows the displacement distribution in the x-direction obtained from DIC. We analyzed the deformation at the dotted line control path using SiDIC and compared the corresponding results of DIC.
Figure 7 shows the compared results. The continuous line represents DIC results while points denote SiDIC results. It can be seen that the two techniques give almost the same results, thus confirming the validity of SiDIC. In addition, similar results were obtained in the y-direction deformation. The reason for the measurement error of SIDIC is because the intersection is visually detected.
3.4. DIC and SiDIC Measurements of Net-Covered Balloon Displacements
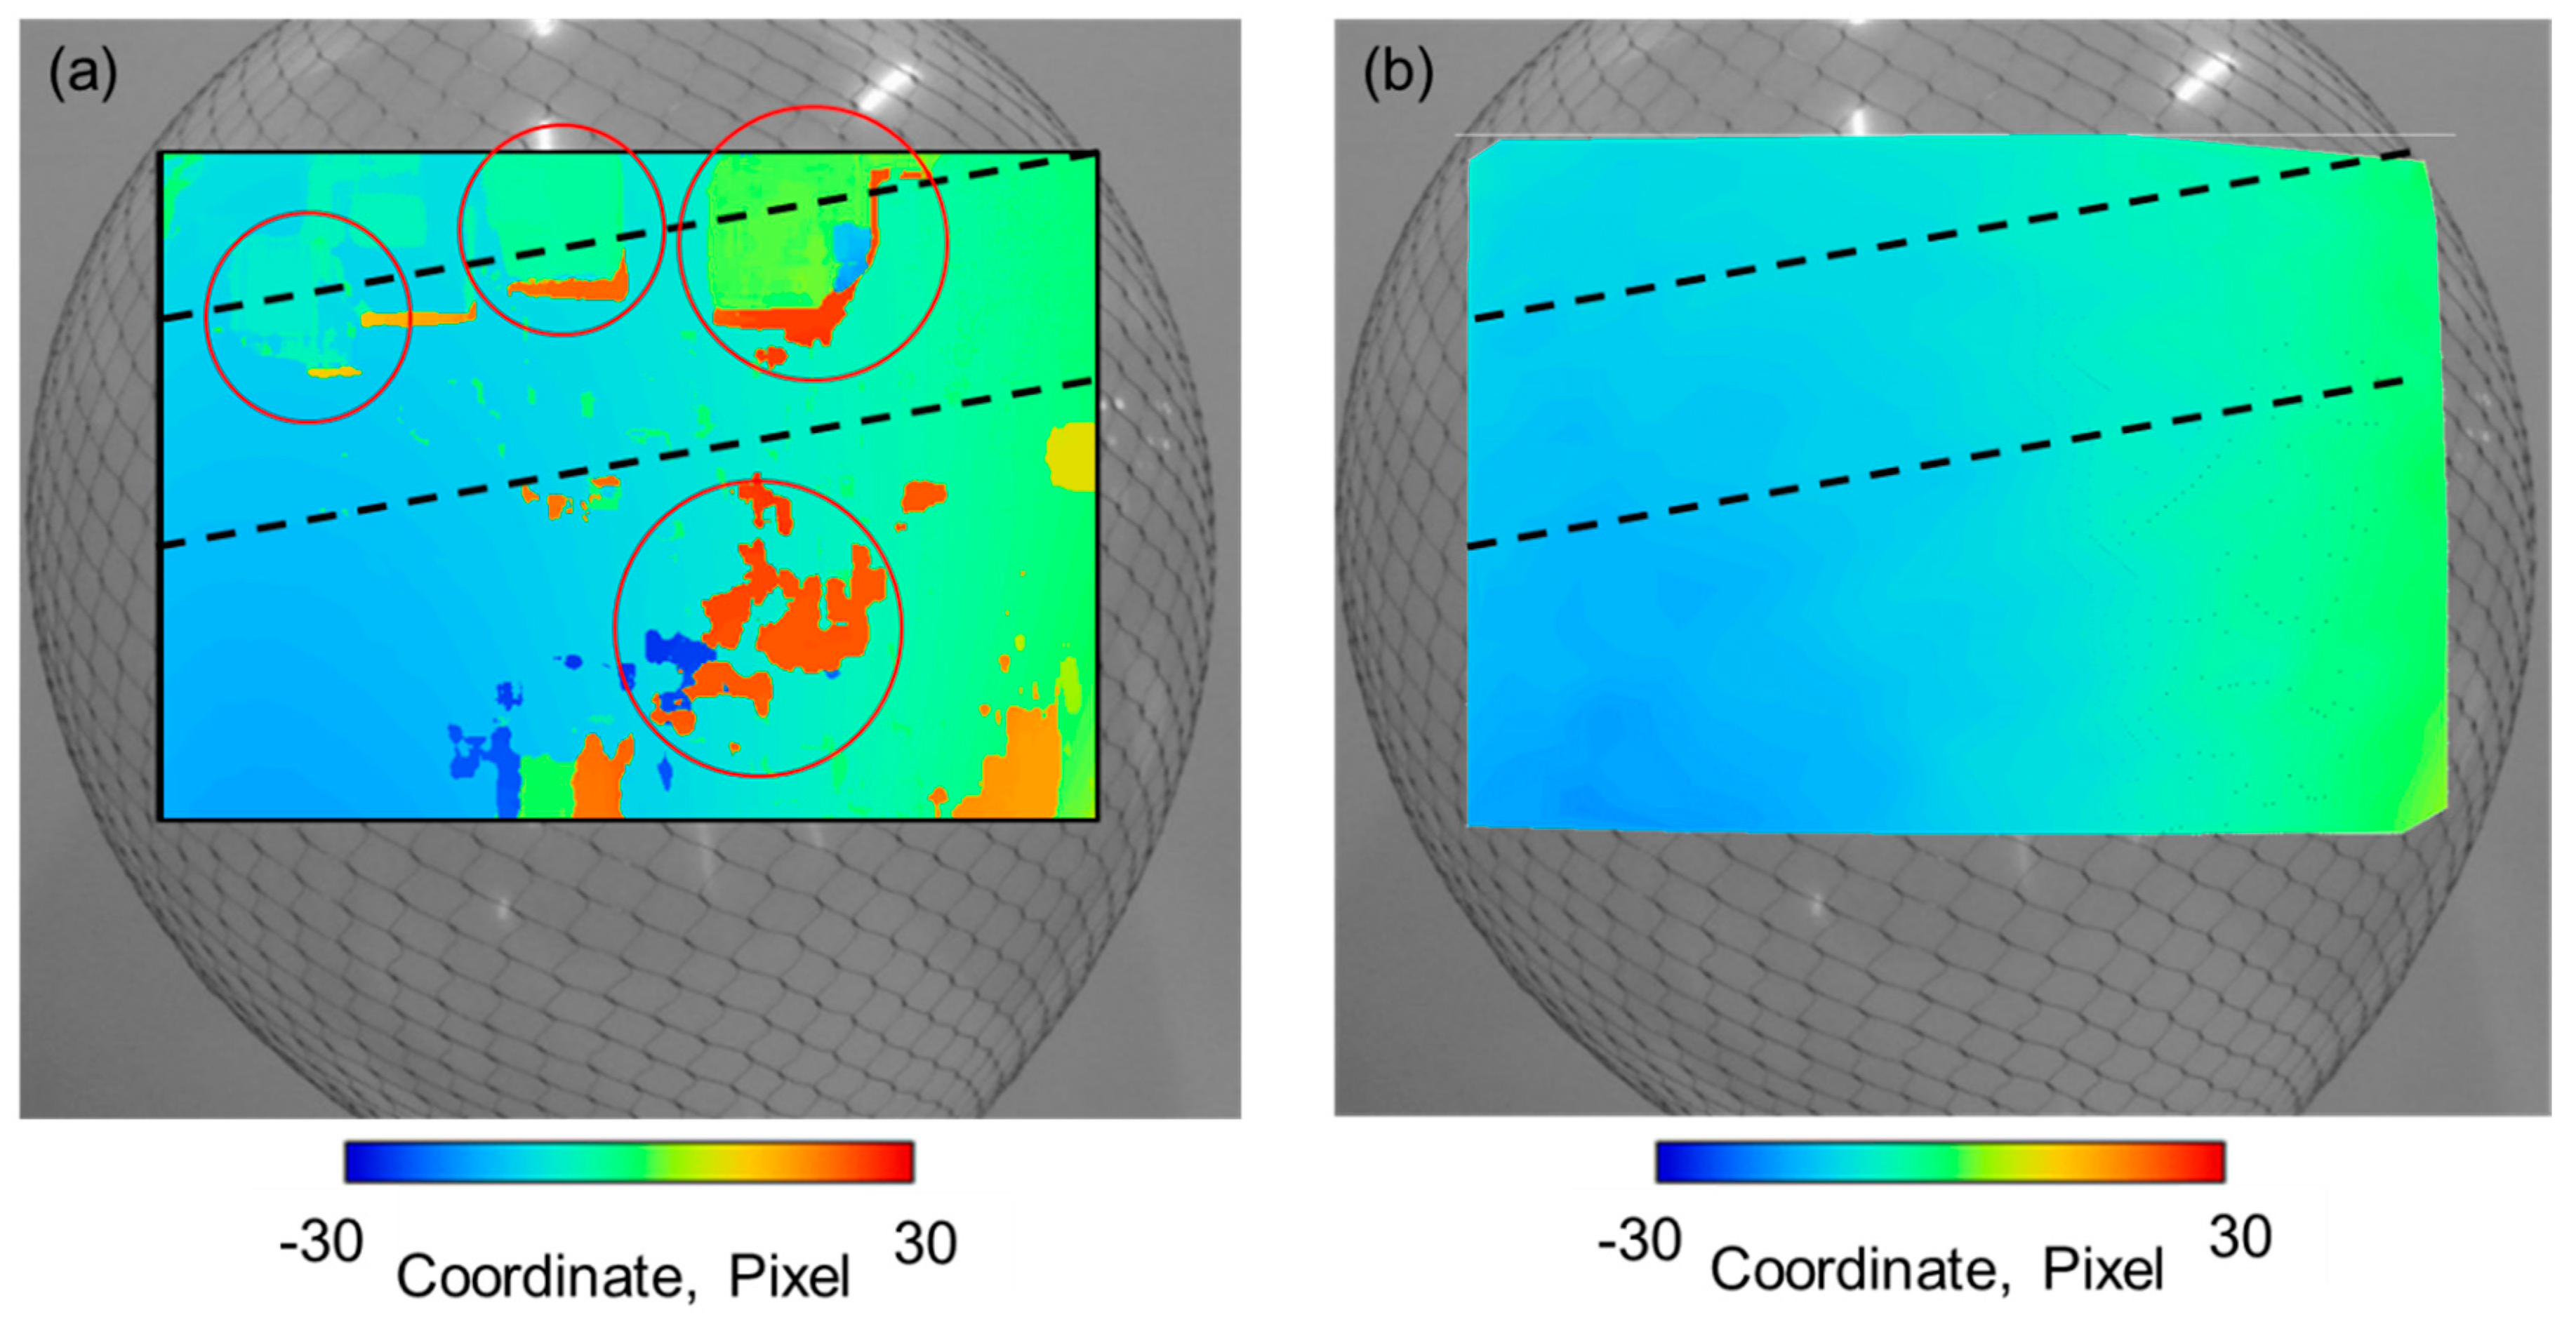
Next, DIC was applied to a balloon covered just with a net, as shown in
Figure 3c. The x-direction deformation map shown in
Figure 8a was obtained. Also, SiDIC was applied, and
Figure 8b shows the corresponding results.
Figure 8a shows that most parts of the net were well read, though some were not measured properly such as the areas limited by the red circles in the figure. In addition, similar results were obtained in the y-direction deformation. Since DIC reads light intensity values, errors arise when this quantity cannot be read properly.
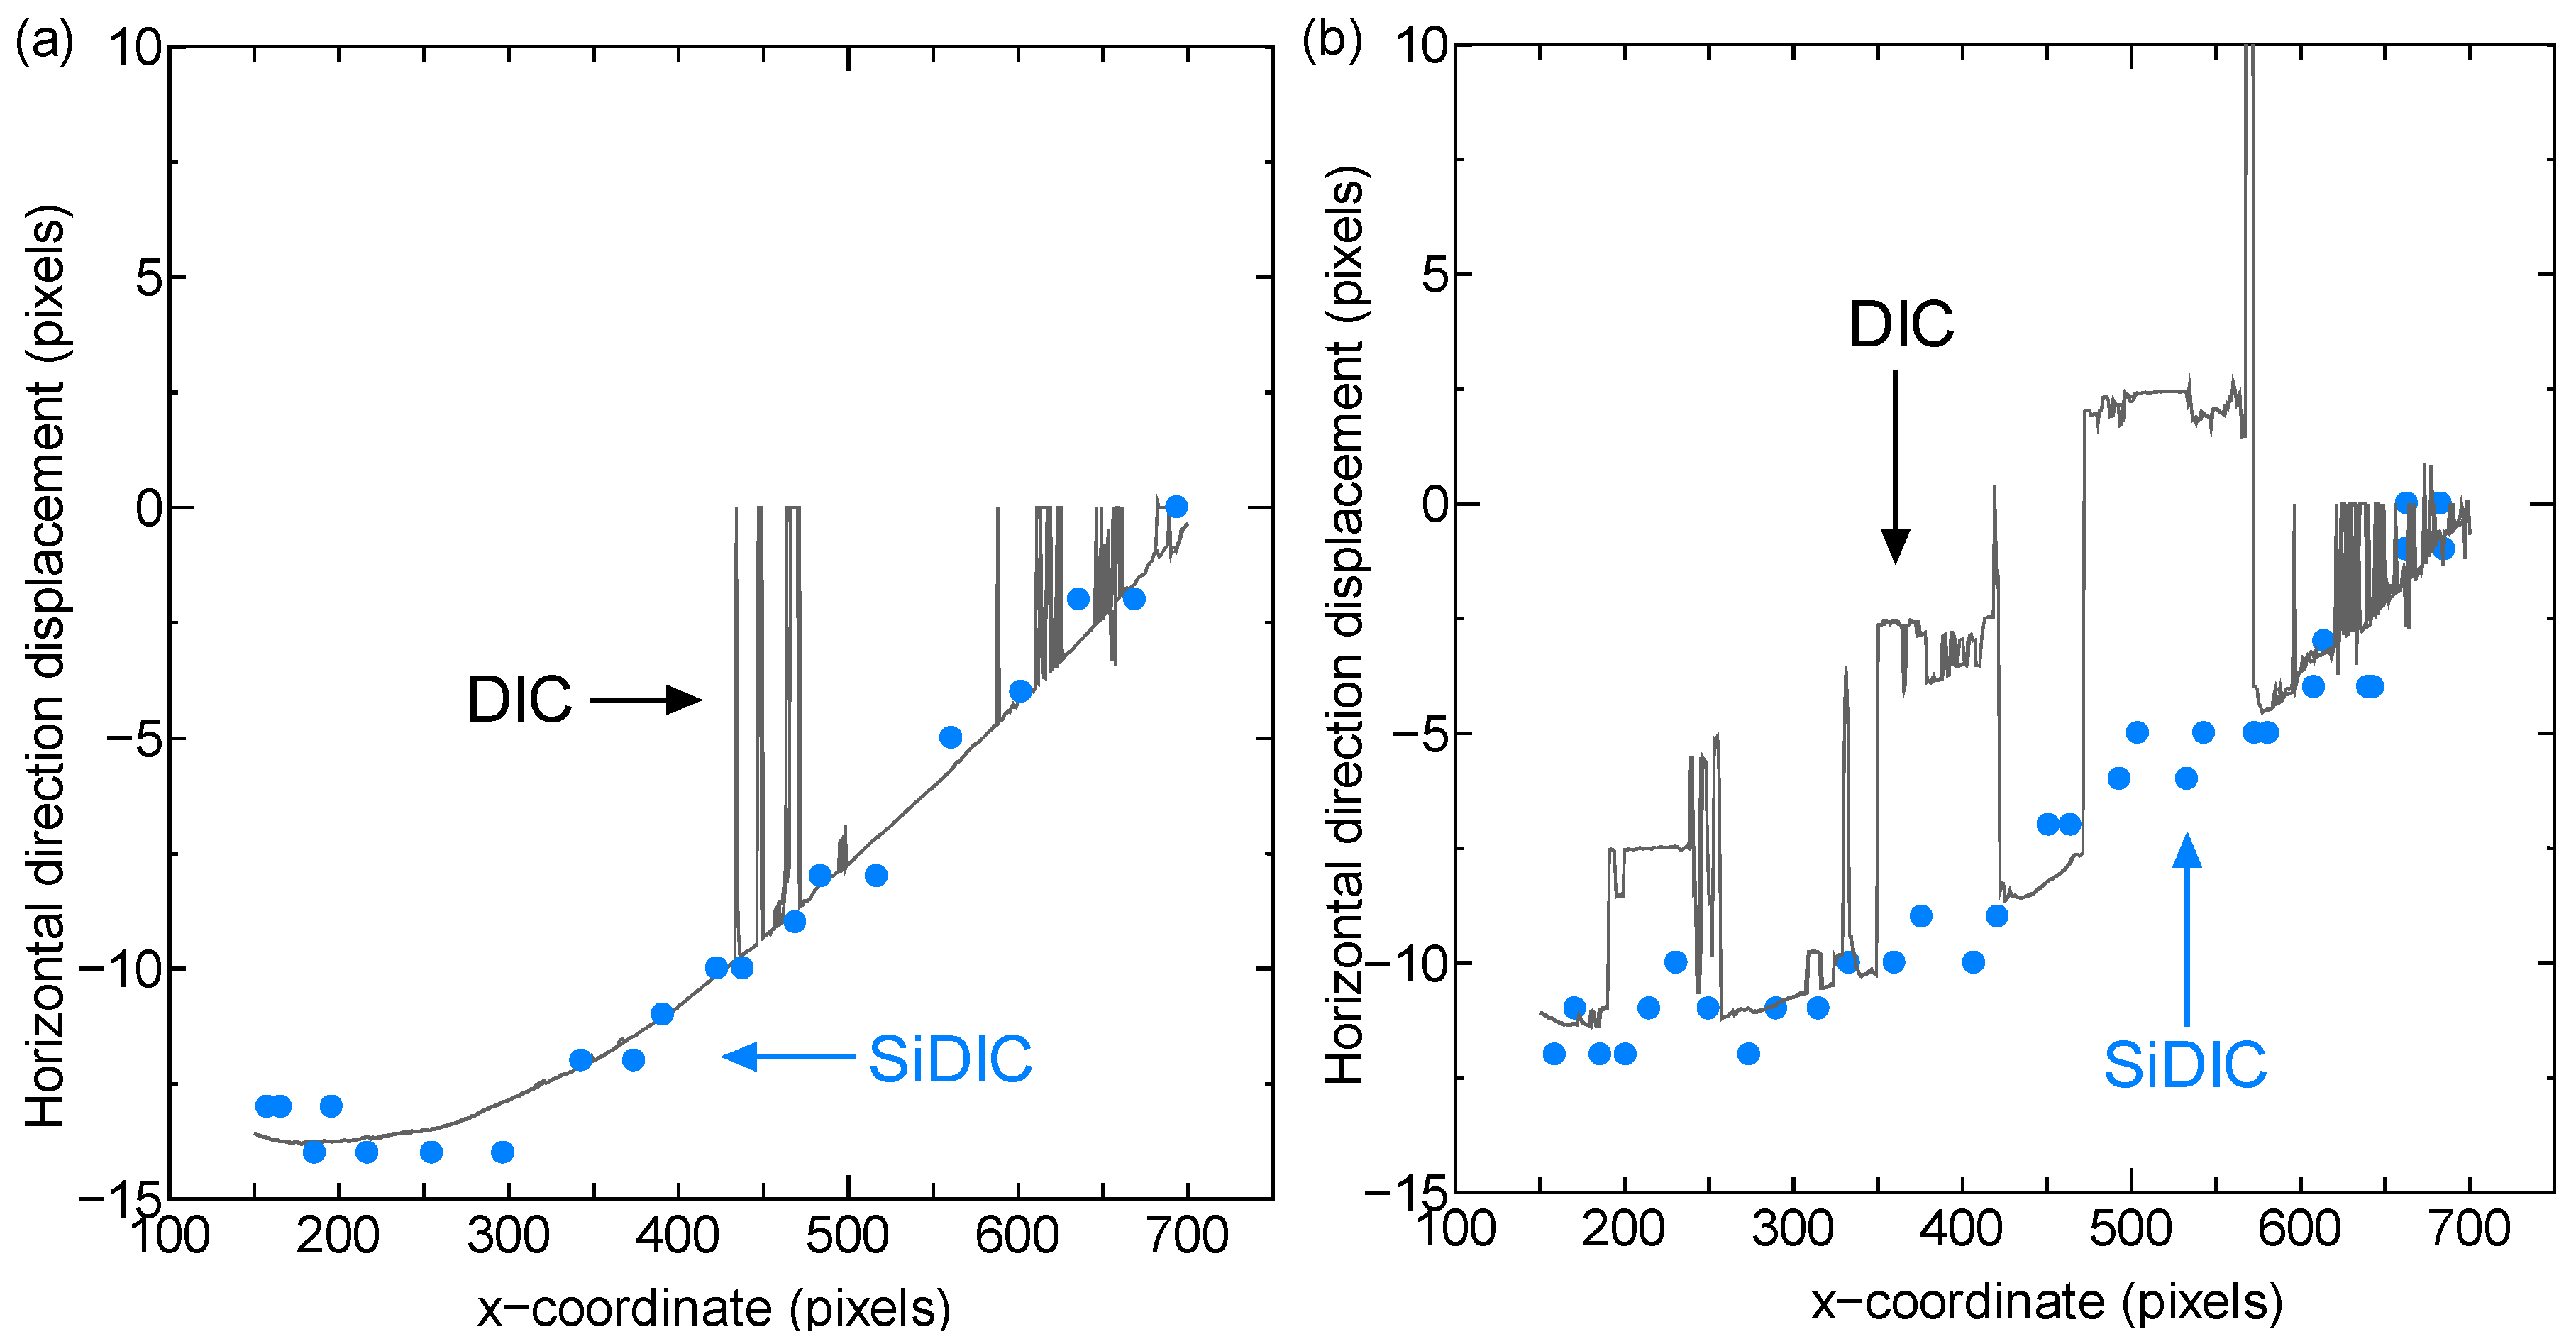
We measured the deformation field along the middle and upper dotted control lines and compared the results of DIC and SiDIC.
Figure 9a presents results for the center dotted line.
Figure 9a shows that DIC recovered fairly well on the deformation field although with some localized errors. SiDIC results were more stable yet overall consistent with those obtained by DIC. The same conclusion can be drawn from
Figure 9b for the upper control path where stronger oscillations in displacement values are present. The observed behavior occurred because SiDIC works on a smaller amount of data than DIC. Furthermore, DIC may misrecognize displacements of net intersections and it is sensitive to light reflection on the balloon surface.
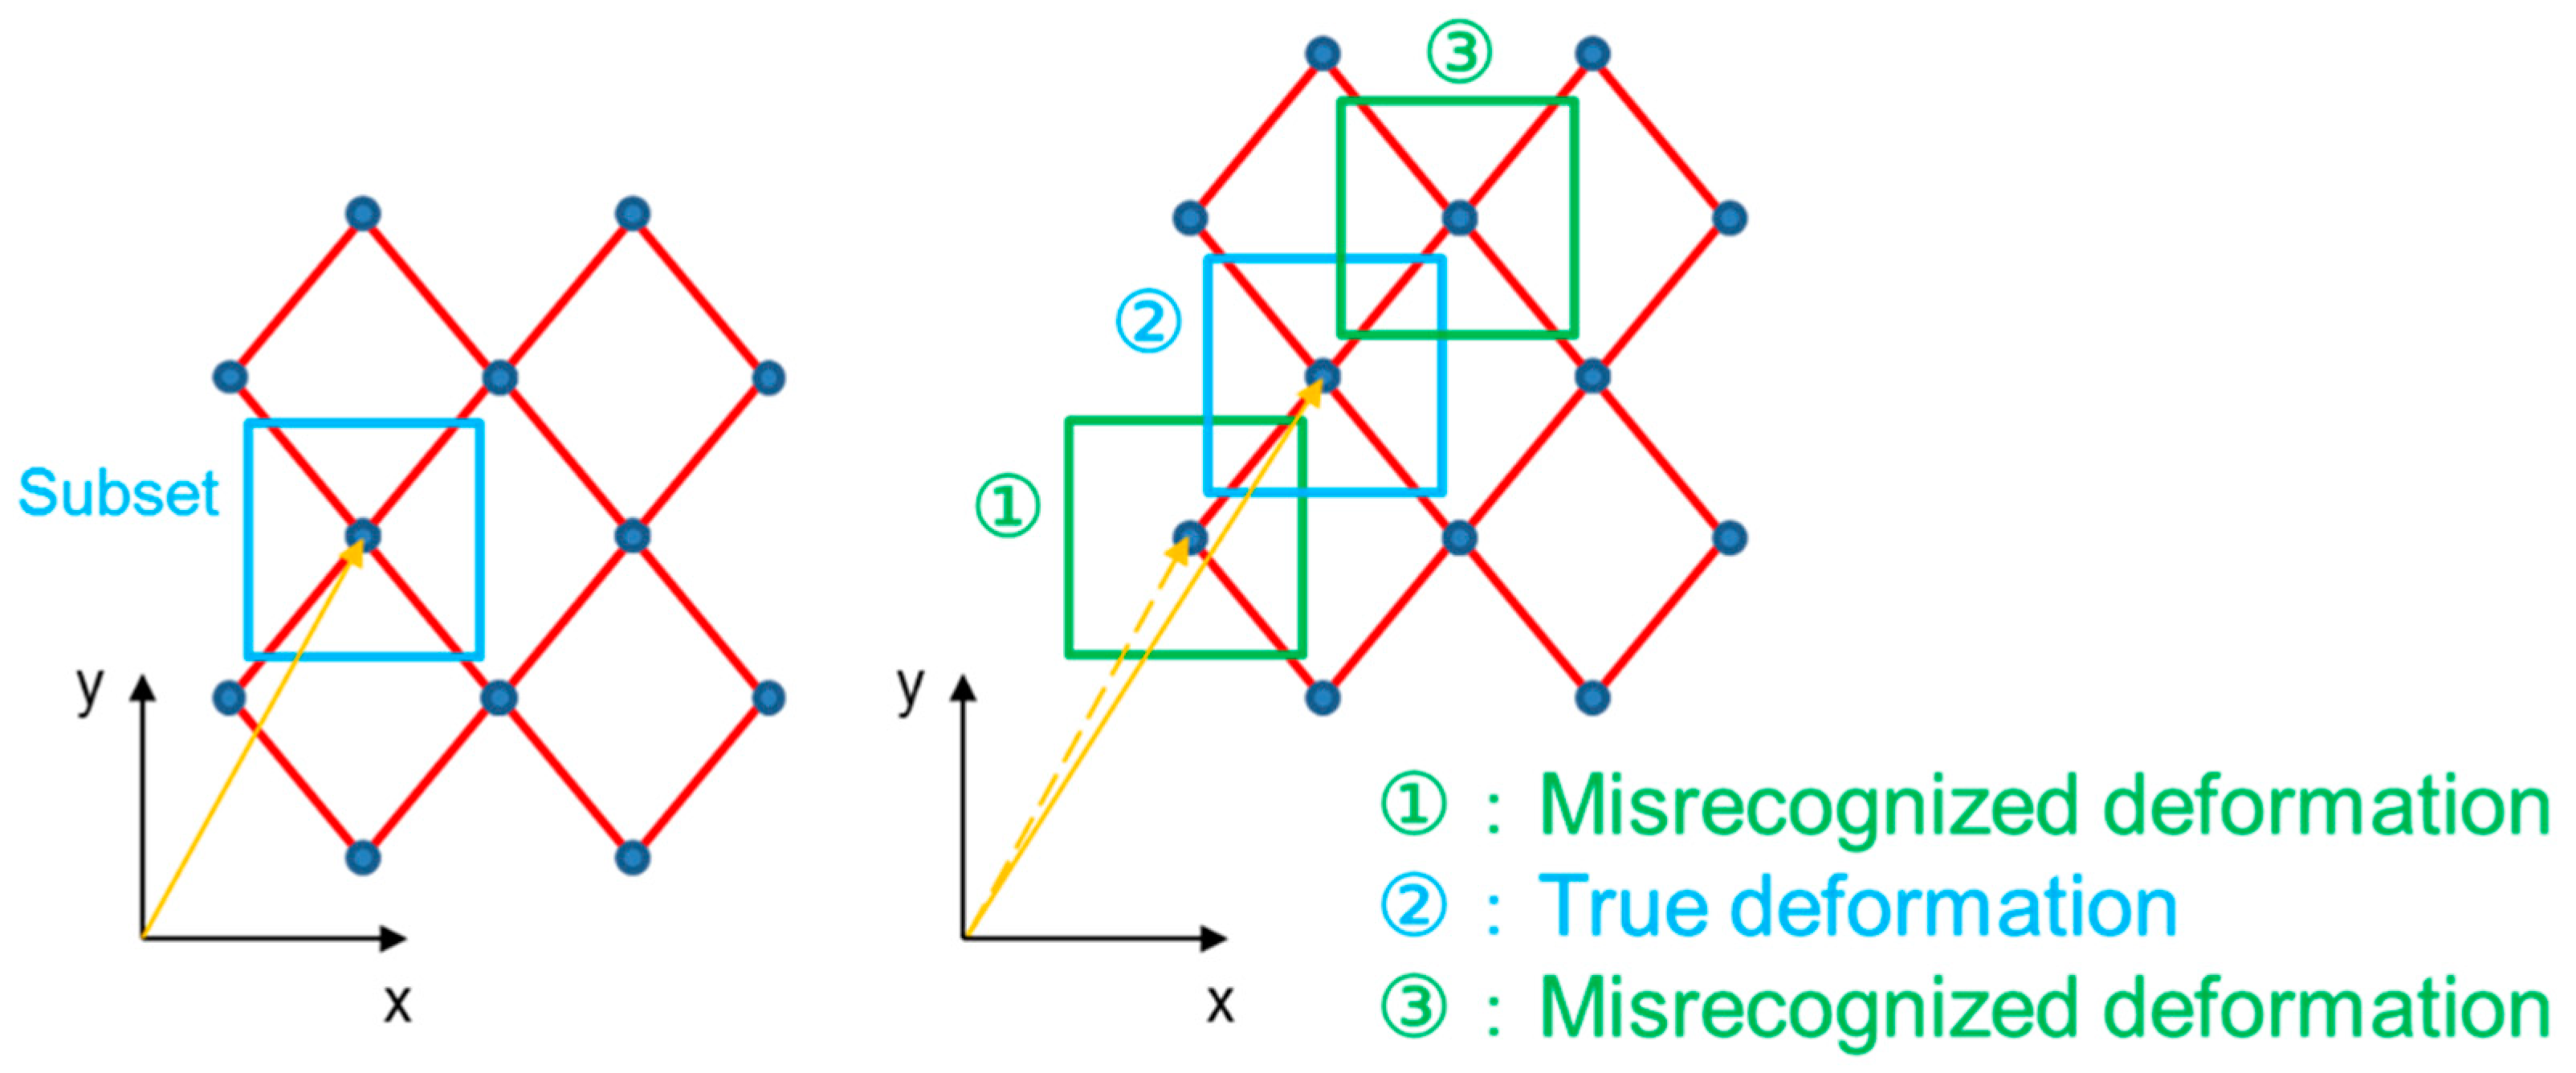
Figure 10 shows an example of the misrecognition algorithm. From
Figure 10, the intersection actually moved to point (2) after deformation. DIC errors occurred when it misrecognizes the intersections after the deformation as (1) or (3). On the other hand, the method read the coordinates of the intersections to prevent errors, thus measuring the deformation correctly.
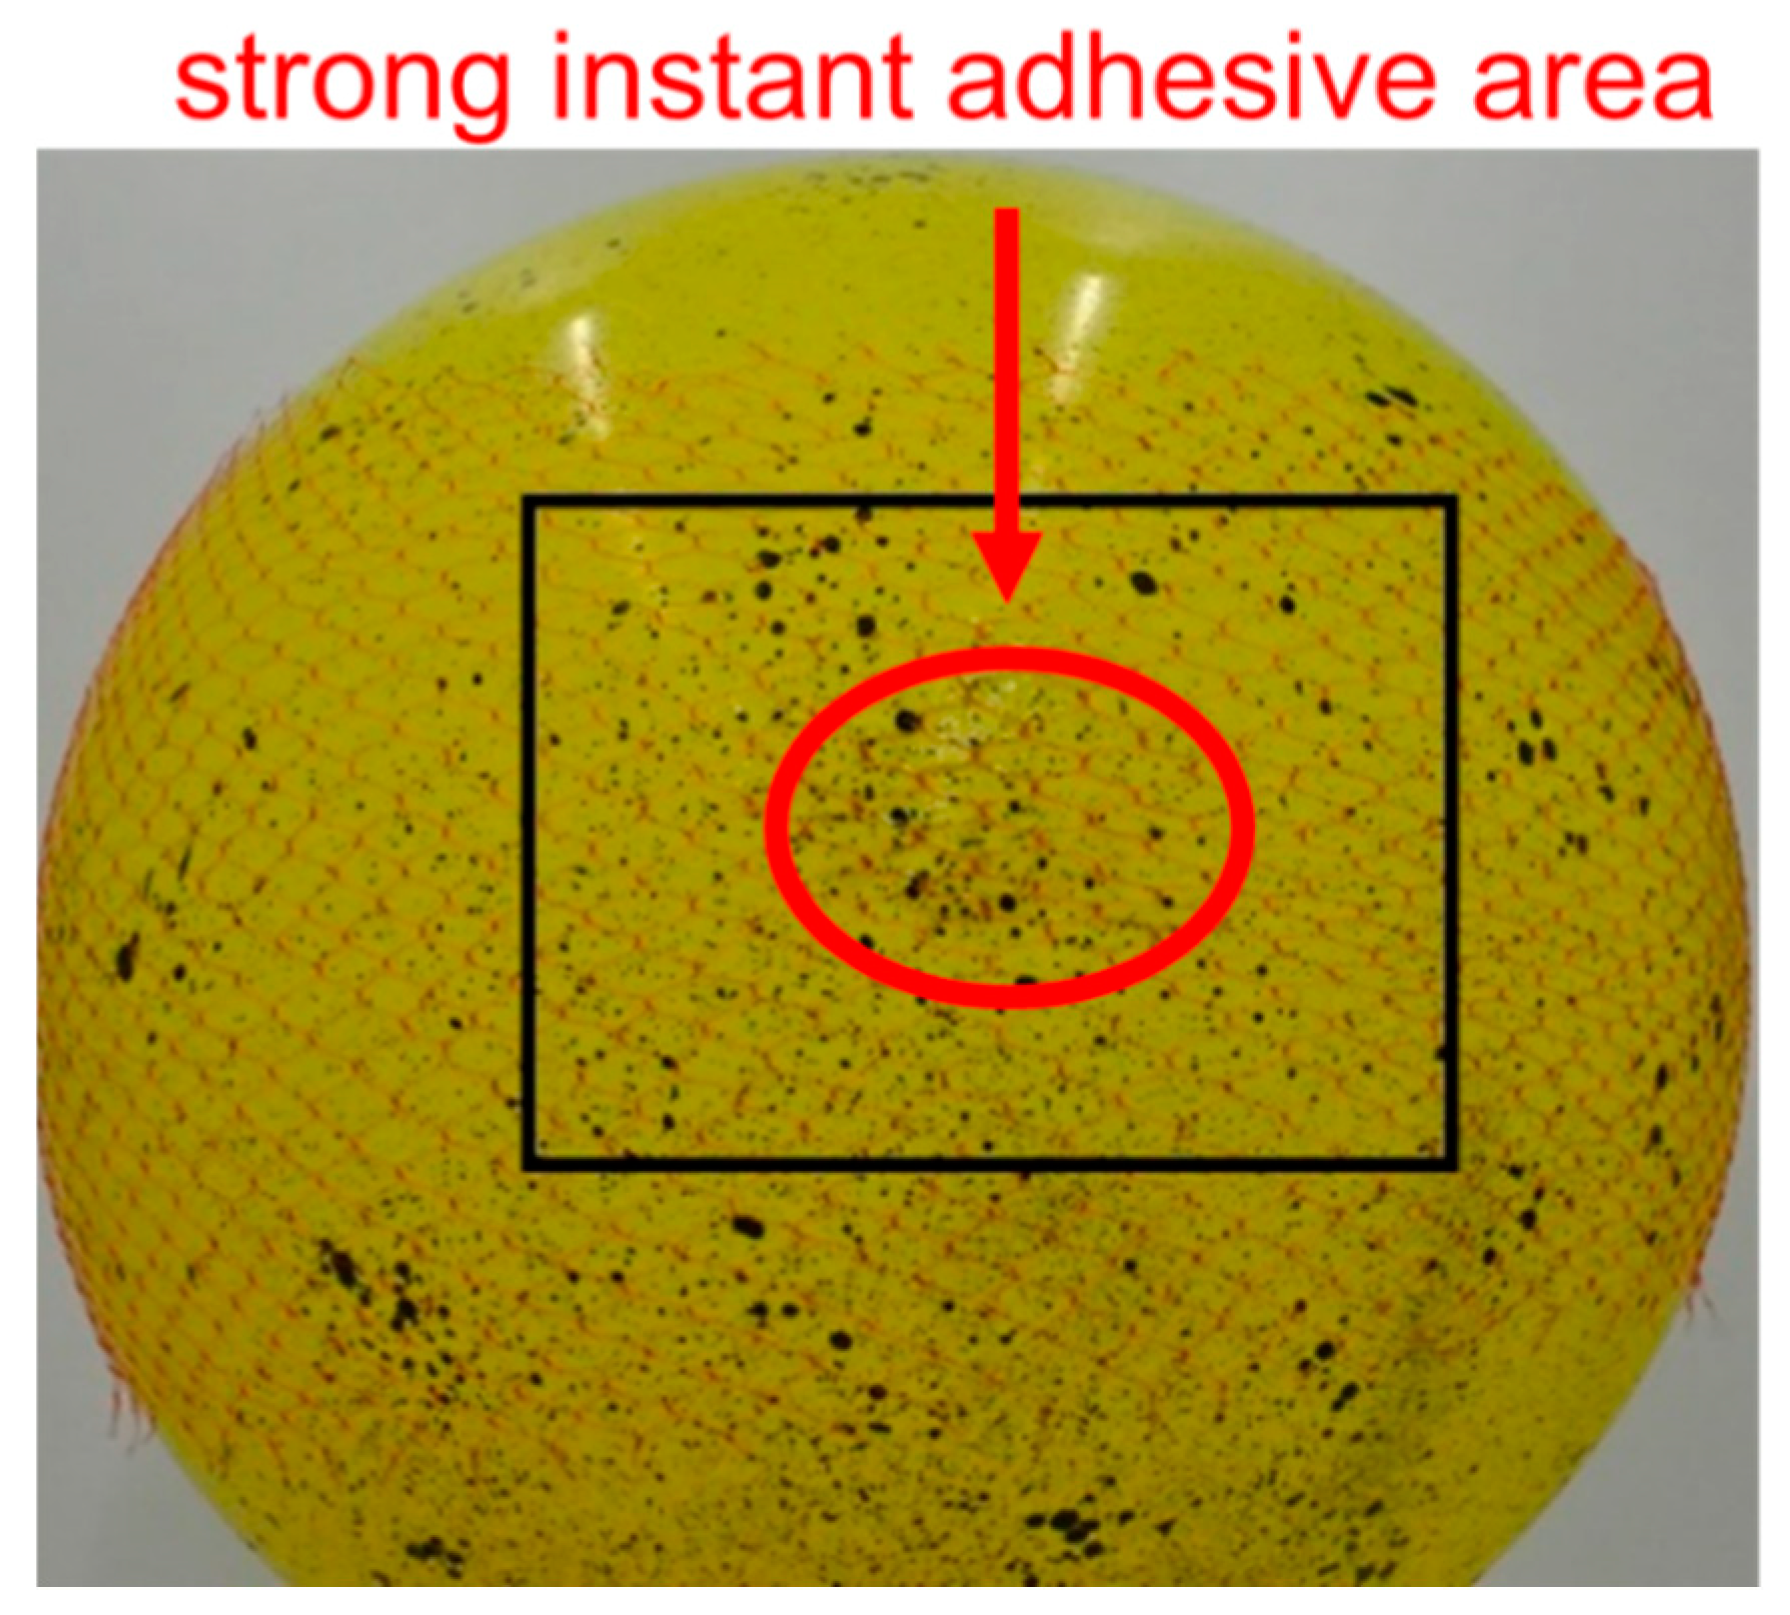
3.5. Measurements of Undeformed Regions Using SiDIC
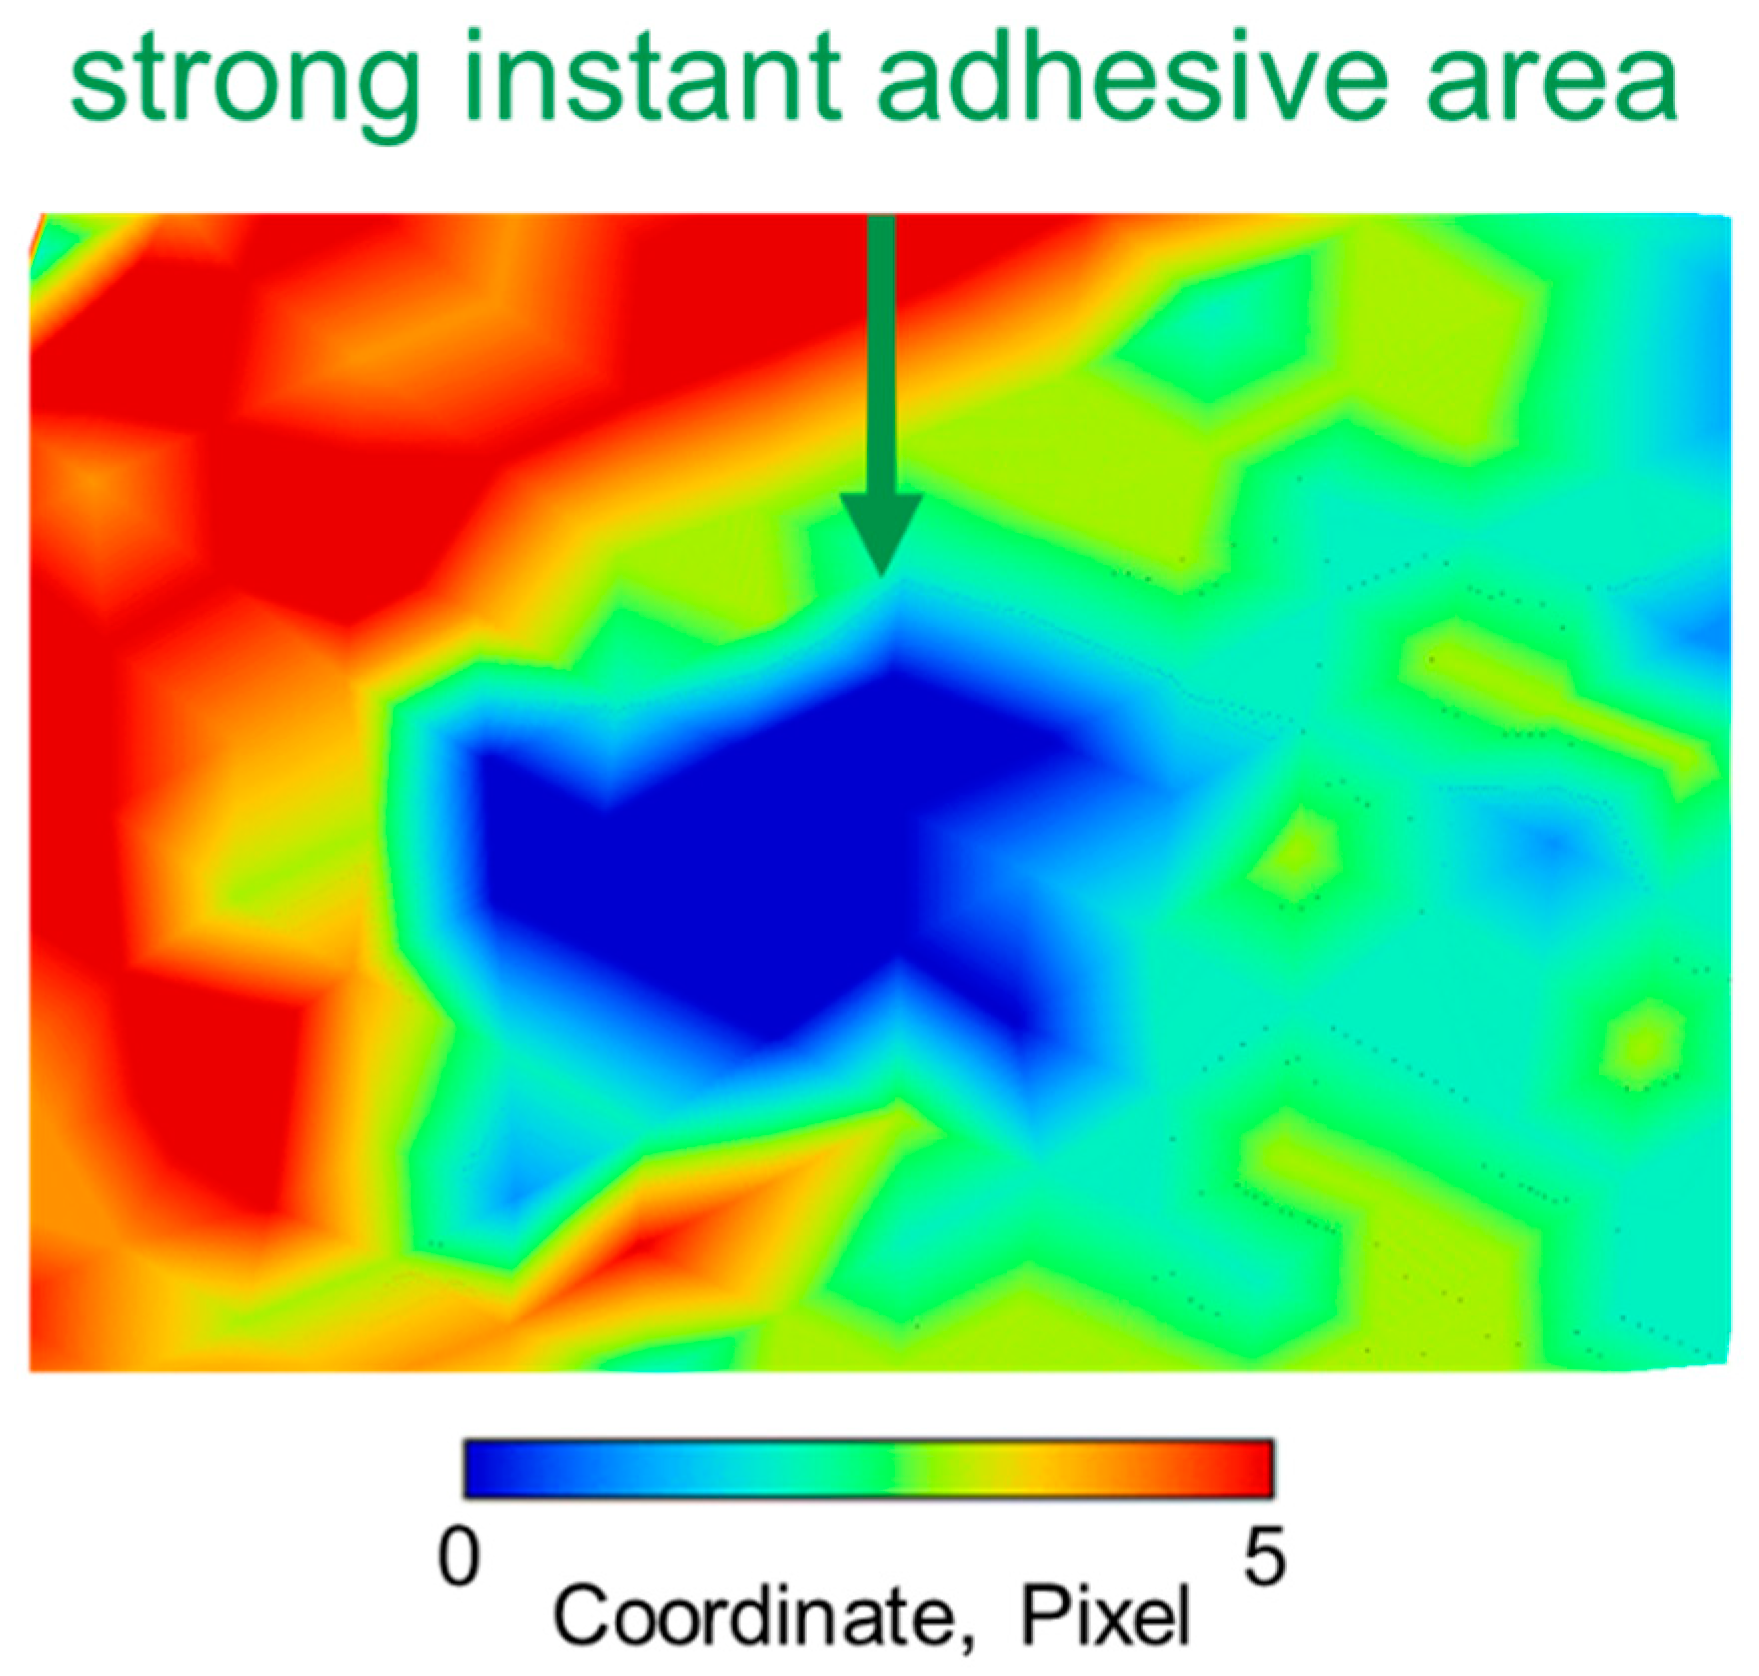
In addition, assuming stress concentration to be an important issue for the SPB design, the net was bonded to the balloon using a strong instant adhesive to restrict the deformation (
Figure 11). In this experiment, a randomly sprayed rubber balloon covered with a plastic net was used and one part of the net was boned.
Figure 12 shows the x-direction displacement map obtained by SiDIC. From
Figure 12, the bonded area shows “0” deformation. This experiment confirmed that SiDIC could properly identify undeformed regions. Hence, SiDIC can detect anomalies and asymmetry of the deformation field.
4. Conclusions
In this research, we tested a new method called “Simplified Digital Image Correlation method (SiDIC)” for detecting non-uniform deformation of the super pressure balloon. In order to confirm the measurement accuracy of the developed SiDIC, first, we assessed the measurement accuracy of DIC using a rubber balloon covered with random spray patterns. Next, we used a rubber balloon covered with both spray patterns and a net to analyze it with DIC and SiDIC. Results of SiDIC and DIC were found to be in good agreement. Next, we applied both DIC and SiDIC to a rubber balloon covered just with a net supposing as an SPB. As a result, DIC recognized the net as a pattern, although it could not measure the whole deformation accurately. On the other hand, SiDIC measured the deformation clearly. Furthermore, SiDIC was able to identify undeformed regions when balloon deformation was restricted by bonding the net to the rubber shell. Therefore, it can be used as a simple deformation measurement method for the balloon. In this research, we used a two-dimensional DIC to find out whether SiDIC could successfully measure the deformation. However, 2D-DIC cannot measure the deformation in the depth direction, which means we have not measured the real deformation of the balloon. In addition, we used visual detection to detect the intersections and the experiment we used to identify the measurement accuracy was rough. From the results, we will continuously upgrade the measurement accuracy and develop an intersection detecting program at the same time; we are attempting to measure the balloon deformation more accurately by evolving SiDIC to “3D-SiDIC”. We are planning to discuss how to fuse SiDIC and 3D-DIC in the future.
Author Contributions
K.K. conceived, designed, and performed the experiments, analyzed the data and wrote the paper. T.M. and S.A. provided the laboratory support and improved the manuscript.
Funding
This work was supported by JSPS KAKENHI Grant Number 17H01352.
Acknowledgments
The authors are grateful to Yoshitaka Saito and Ken Goto for suggesting the topic treated in this paper. We also thank them for sharing images and data of the Super pressure balloon with us.
Conflicts of Interest
The authors declare that there is no conflict of interest.
References
- Henry, C.; David, P. Development of the NASA ultra-long duration balloon. In Proceedings of the NASA Science Technology Conference (NSTC2007), East Adelphi, MD, USA, 19–21 June 2007. [Google Scholar]
- Cathey, H.M., Jr. The NASA super pressure balloon—A path to flight, Advances in Space Research. Adv. Space Res. 2007, 44, 23–38. [Google Scholar] [CrossRef]
- Saito, Y.; Shoji, Y.; Matsuzaka, Y.; Mizuta, E.; Matsushima, K.; Tanaka, S. A Super-Pressure Balloon with a Diamond-Shaped Net; JAXA-RR-010-003; JAXA Research and Development Report: Tokyo, Japan, 2011; pp. 21–40. [Google Scholar]
- Saito, Y.; Shoji, Y.; Matsuzaka, Y.; Matsushima, K.; Tanaka, S.; Kajiwara, K.; Shimadu, S. Development of a Super-pressure balloon with a diamond-shaped net. Adv. Space Res. 2014, 54, 1525–1529. [Google Scholar] [CrossRef]
- Tanaka, R.; Matsuo, T.; Saito, Y.; Akita, D.; Nakashino, K.; Goto, K. Evaluation of tensile strength of net for Supper pressure balloon. In Proceedings of the Mechanical Engineering Congress (MECJ-16), Fukuoka, Japan, 11–14 September 2016. [Google Scholar]
- Akita, D.; Saito, Y.; Goto, K.; Nakashino, K.; Matsuo, T.; Matsushima, K.; Hashimoto, H.; Shimadu, S. Development of a super-pressure balloon with a diamond-shaped net for high-altitude long-duration flights. In Proceedings of the Spatial Structures in the 21st Century IASS Annual Symposium, Tokyo, Japan, 26–30 September 2016. [Google Scholar]
- Nakashino, K.; Saito, Y.; Goto, K.; Akita, D.; Matsuo, T.; Matsushima, K.; Hashimoto, H.; Shimadu, S. Development of Super pressure balloon with diamond-shaped net and numerical study of its structural characteristics. In Proceedings of the 4th AIAA Spacecraft Structures Conference (AIAA SCITECH 2017), Grapevine, TX, USA, 9–13 January 2017. [Google Scholar]
- Nakamura, S.; Nakashino, K.; Saito, Y.; Goto, K.; Akita, D.; Matsuo, T. Deployment characteristics of Super pressure balloon with a diamond-shaped net. In Proceedings of the 25th Space Engineering Conference (SEC16), Yamaguchi, Japan, 21–22 December 2016. [Google Scholar]
- Grytten, F.; Daiyan, H.; Polanco-Loria, M.; Dumoulin, S. Use of digital image correlation to measure large strain tensile properties of ductile thermoplastics. Polym. Test. 2009, 28, 653–660. [Google Scholar]
- Jorge, A.; John, L. Investigation of crack growth in functionally graded materials using digital image correlation. Eng. Fract. Mech. 2002, 69, 1695–1711. [Google Scholar]
- Shao, X.; Dai, X.; Chen, Z.; He, X. Real-time 3D digital image correlation method and its application in human pulse monitoring. Appl. Opt. 2016, 55, 696–704. [Google Scholar] [CrossRef] [PubMed]
- Joseph, W.; Shirong, W.; Joseph, B.; Kiley, M. Super pressure balloon non-linear structural analysis and correlation using photogrammetric measurements. In Proceedings of the AIAA 5th Aviation, Technology, Integration, and Operations Conference (ATIO), Arlington, VA, USA, 28 September 2005. [Google Scholar]
- Pramod, R.; Erwin, H. Optical Methods for Solid Mechanics; Wiley-VCH: Weinheim, Germany, 2012; pp. 183–228. [Google Scholar]
© 2018 by the authors. Licensee MDPI, Basel, Switzerland. This article is an open access article distributed under the terms and conditions of the Creative Commons Attribution (CC BY) license (http://creativecommons.org/licenses/by/4.0/).

