Article

Investment Incentives in Competitive Electricity Markets

by
Jaber Valinejad
1,†,
Taghi Barforoshi
2,†,
Mousa Marzband
3,4,†,
Edris Pouresmaeil
5,*,†,
Radu Godina
6,*,† and
João P. S. Catalão
6,7,8,†
1
Bradley Department of Electrical and Computer Engineering, Virginia Tech, NVC, Falls Church, VA 24043, USA
2
Faculty of Electrical and Computer Engineering, Babol Noshirvani University of Technology, Babol 47148-71167, Mazandaran, Iran
3
Department of Physics and Electrical Engineering, Faculty of Engineering and Environment, Northumbria University Newcastle, Newcastle upon Tyne NE1 8ST, UK
4
Department of Electrical Engineering, Lahijan Branch, Islamic Azad University, Lahijan 4416939515, Iran
5
Department of Electrical Engineering and Automation, Aalto University, 02150 Espoo, Finland
6
C-MAST, University of Beira Interior, 6201-001 Covilhã, Portugal
7
INESC-ID, Instituto Superior Técnico, University of Lisbon, 1049-001 Lisbon, Portugal
8
INESC TEC and the Faculty of Engineering, University of Porto, 4200-465 Porto, Portugal
*
Authors to whom correspondence should be addressed.
These authors contributed equally to this work.
Appl. Sci. 2018, 8(10), 1978; https://doi.org/10.3390/app8101978
Submission received: 21 September 2018 / Revised: 14 October 2018 / Accepted: 15 October 2018 / Published: 18 October 2018
(This article belongs to the Special Issue Smart Home and Energy Management Systems 2019)

Abstract

:
This paper presents the analysis of a novel framework of study and the impact of different market design criterion for the generation expansion planning (GEP) in competitive electricity market incentives, under variable uncertainties in a single year horizon. As investment incentives conventionally consist of firm contracts and capacity payments, in this study, the electricity generation investment problem is considered from a strategic generation company (GENCO) s perspective, modelled as a bi-level optimization method. The first-level includes decision steps related to investment incentives to maximize the total profit in the planning horizon. The second-level includes optimization steps focusing on maximizing social welfare when the electricity market is regulated for the current horizon. In addition, variable uncertainties, on offering and investment, are modelled using set of different scenarios. The bi-level optimization problem is then converted to a single-level problem and then represented as a mixed integer linear program (MILP) after linearization. The efficiency of the proposed framework is assessed on the MAZANDARAN regional electric company (MREC) transmission network, integral to IRAN interconnected power system for both elastic and inelastic demands. Simulations show the significance of optimizing the firm contract and the capacity payment that encourages the generation investment for peak technology and improves long-term stability of electricity markets.

1. Introduction

Over the last decade, due to a shear need to improve economic efficiency and promote sustainable development in electricity generation, transmission and distribution, the power systems industry has been subjected to major interventions to optimize the core structure of electricity markets and its regulation [1,2,3,4,5,6,7]. This is envisioned as by creating a competitive environment in the generation sector, such as the operational and expansion planning strategies being out of the monopolizing effects of the market [8,9,10,11,12,13,14]. In the short-term horizon, each electricity generation expansion company GENCO determines, first, the strategies based on economic considerations, and then takes into account the parallel strategies of rival GENCOs in that market sector. In the long-term, GENCOs set their expansion planning based on economic considerations and investment strategies of their rivals, primarily [15,16,17,18]. However, decentralized decisions based on economic considerations may also lead to shortages of generating capacity and high prices of electricity in the long term, as a shortfall [10,19,20,21]. Investment in generation expansion is considered an irreversible process of practice, as it may impose substantial additional non-recoverable costs on investors because of the probability of forecasting errors in the long-term strategic framework. For investing in electricity markets, there must be assurances of return on investment [22,23,24]. Therefore, many countries have developed mechanisms to encourage and control the investment itself in the power generation and transmission sector [25,26]. Capacity payment, firm contract, capacity obligation systems, and reliability options are some of the commonly practised incentives which have been regulated in designing the frameworks of electricity markets [25]. In order to determine the core capacity which should be installed and also to study impacts of different market designs on generation capacity evaluations, an optimization and regulation model-based approach is required. For the generation expansion and studying the impact of different markets on the investment, it is critical to design and apply a fully optimized model to conceptualize the design considerations [27,28,29]. Accordingly, rigorous research has shown the attempts to postulate different models and programming methodologies to handle the investment problem [30,31,32,33,34] such as:
  • A supply function model for spot markets, which is a generalized realistic model example of spot markets compared with optimization attempts of [30,31,32,33], although these attempts have been restricted on a single-level topology approach;
  • In our study, for the first time, the investment problem is uniquely proposed on a bi-level, being critical to include factors like the transmission constraints, which have not focused thorough in previous attempts [30,31,32,33,34]. In addition, the proposed model has been considered between one strategic GENCO, compared with non-strategic GENCOs, being unique for a multi-vendor strategic framework development for global strategy implementation planning while the proposed models in [30,31,32,33,34,35] have no strategic GENCO.
  • A range of variable inter-dependency scenarios to emulate the uncertainties pertaining to non-strategic GENCOs is also addressed while the models in [31,33,34] do not have any uncertainty;
  • The capacity payment policy as per the investment incentive is also considered where this offers a unique policy feature to inter-relate the investment incentive to the capacity payment while this policy has not been considered in papers [16,30,31,32,33,35,36,37,38,39];
  • The firm contract policy is also incorporated into the central design of investment incentive which focuses uniquely on the co-existence of an inter-relating investment incentive for the firm contract for a given capacity payment schedule while the firm contract has not been considered in [16,30,31,32,33,34,35,36,37,38,39,40].
  • In this paper specifically, a unique pre-requisite for a new emerging concept of smart hybrid energy markets being central to smart energy generation and distribution, including both capacity payment and firm contract, is also encompassed in the proposed model under the simultaneous scenario existence of two independent investment incentives, being considered simultaneously. A conventional practice [16,18,30,31,32,33,34,37,41,42] to implement mathematical programming with equilibrium constraint (MPEC) framework model to evaluate power generation investment incentives exists.
  • In our case, we utilize and co-optimize the MPEC model for inter-relating the impact of both the firm contract and capacity payment on the global investment behaviour of electricity market structure.
  • Furthermore, in this context, the reliability indicators for different markets can also be monitored and compared concurrently with each other, as this approach offers a unique adaptability to apply this method to a range of power networks.
  • All demands in this paper are considered in two cases: elastic and inelastic, so that the price cap can be considered for strategic GENCO offers in market with inelastic demand. Some insight on the nature of market demands, such as elastic in [36,37,40,41,42], or as inelastic as in [18,30,31,32,33,34,37,41] have also been compared.
In this study, the effect of investment incentives and different electricity markets has been examined on a generation capacity expansion criterion, as from a strategic GENCO perspective under uncertainties in a single year horizon, which is eligible for the electricity market above, such as: the energy only (EO), capacity payments (CP), firm contract (FC) and smart hybrid (SH) markets. In particular, the hybrid category is the market subjected to unique importance that includes the investment incentives of combining a co-existing capacity payment as well as a firm contract. Therefore, this is specifically considered in this study. For this purpose of consideration, the investment criterion solution is modelled as a bi-level steps’ optimization method, with the ease of expansion and adaptability to bi-level architectures, where the first and the second-level steps are related to investment problem (planning level) and operation problem (operation planning), respectively. The hierarchy of the method is divided into different levels. The first-level that includes decisions taken by a strategic GENCO who investigates installments of new generating unit in the future possible productions, in order to maximize the total profit in the planning horizon. In this criterion of markets, a strategic GENCO competes with non-strategic GENCOS (as rival GENCOs) both in investment and operation. The second-level models the above responses provided by a competitive fringe in terms of production bids, which are sorted by a market operator, who clears the market obtaining locational marginal prices (LMPs) as dual variables of the nodal balancing constraints. It is assumed here that the contractual revenues are paid to only new generating units, whereas the capacity payments are considered to be paid to all available units. In this model, demands are considered both as elastic and inelastic to price. In addition, all competitor uncertainties on offering and investment are modelled using different sets of scenarios. In addition, add-ons of reliability indicators are obtained for each year of the planning period in the proposed markets.

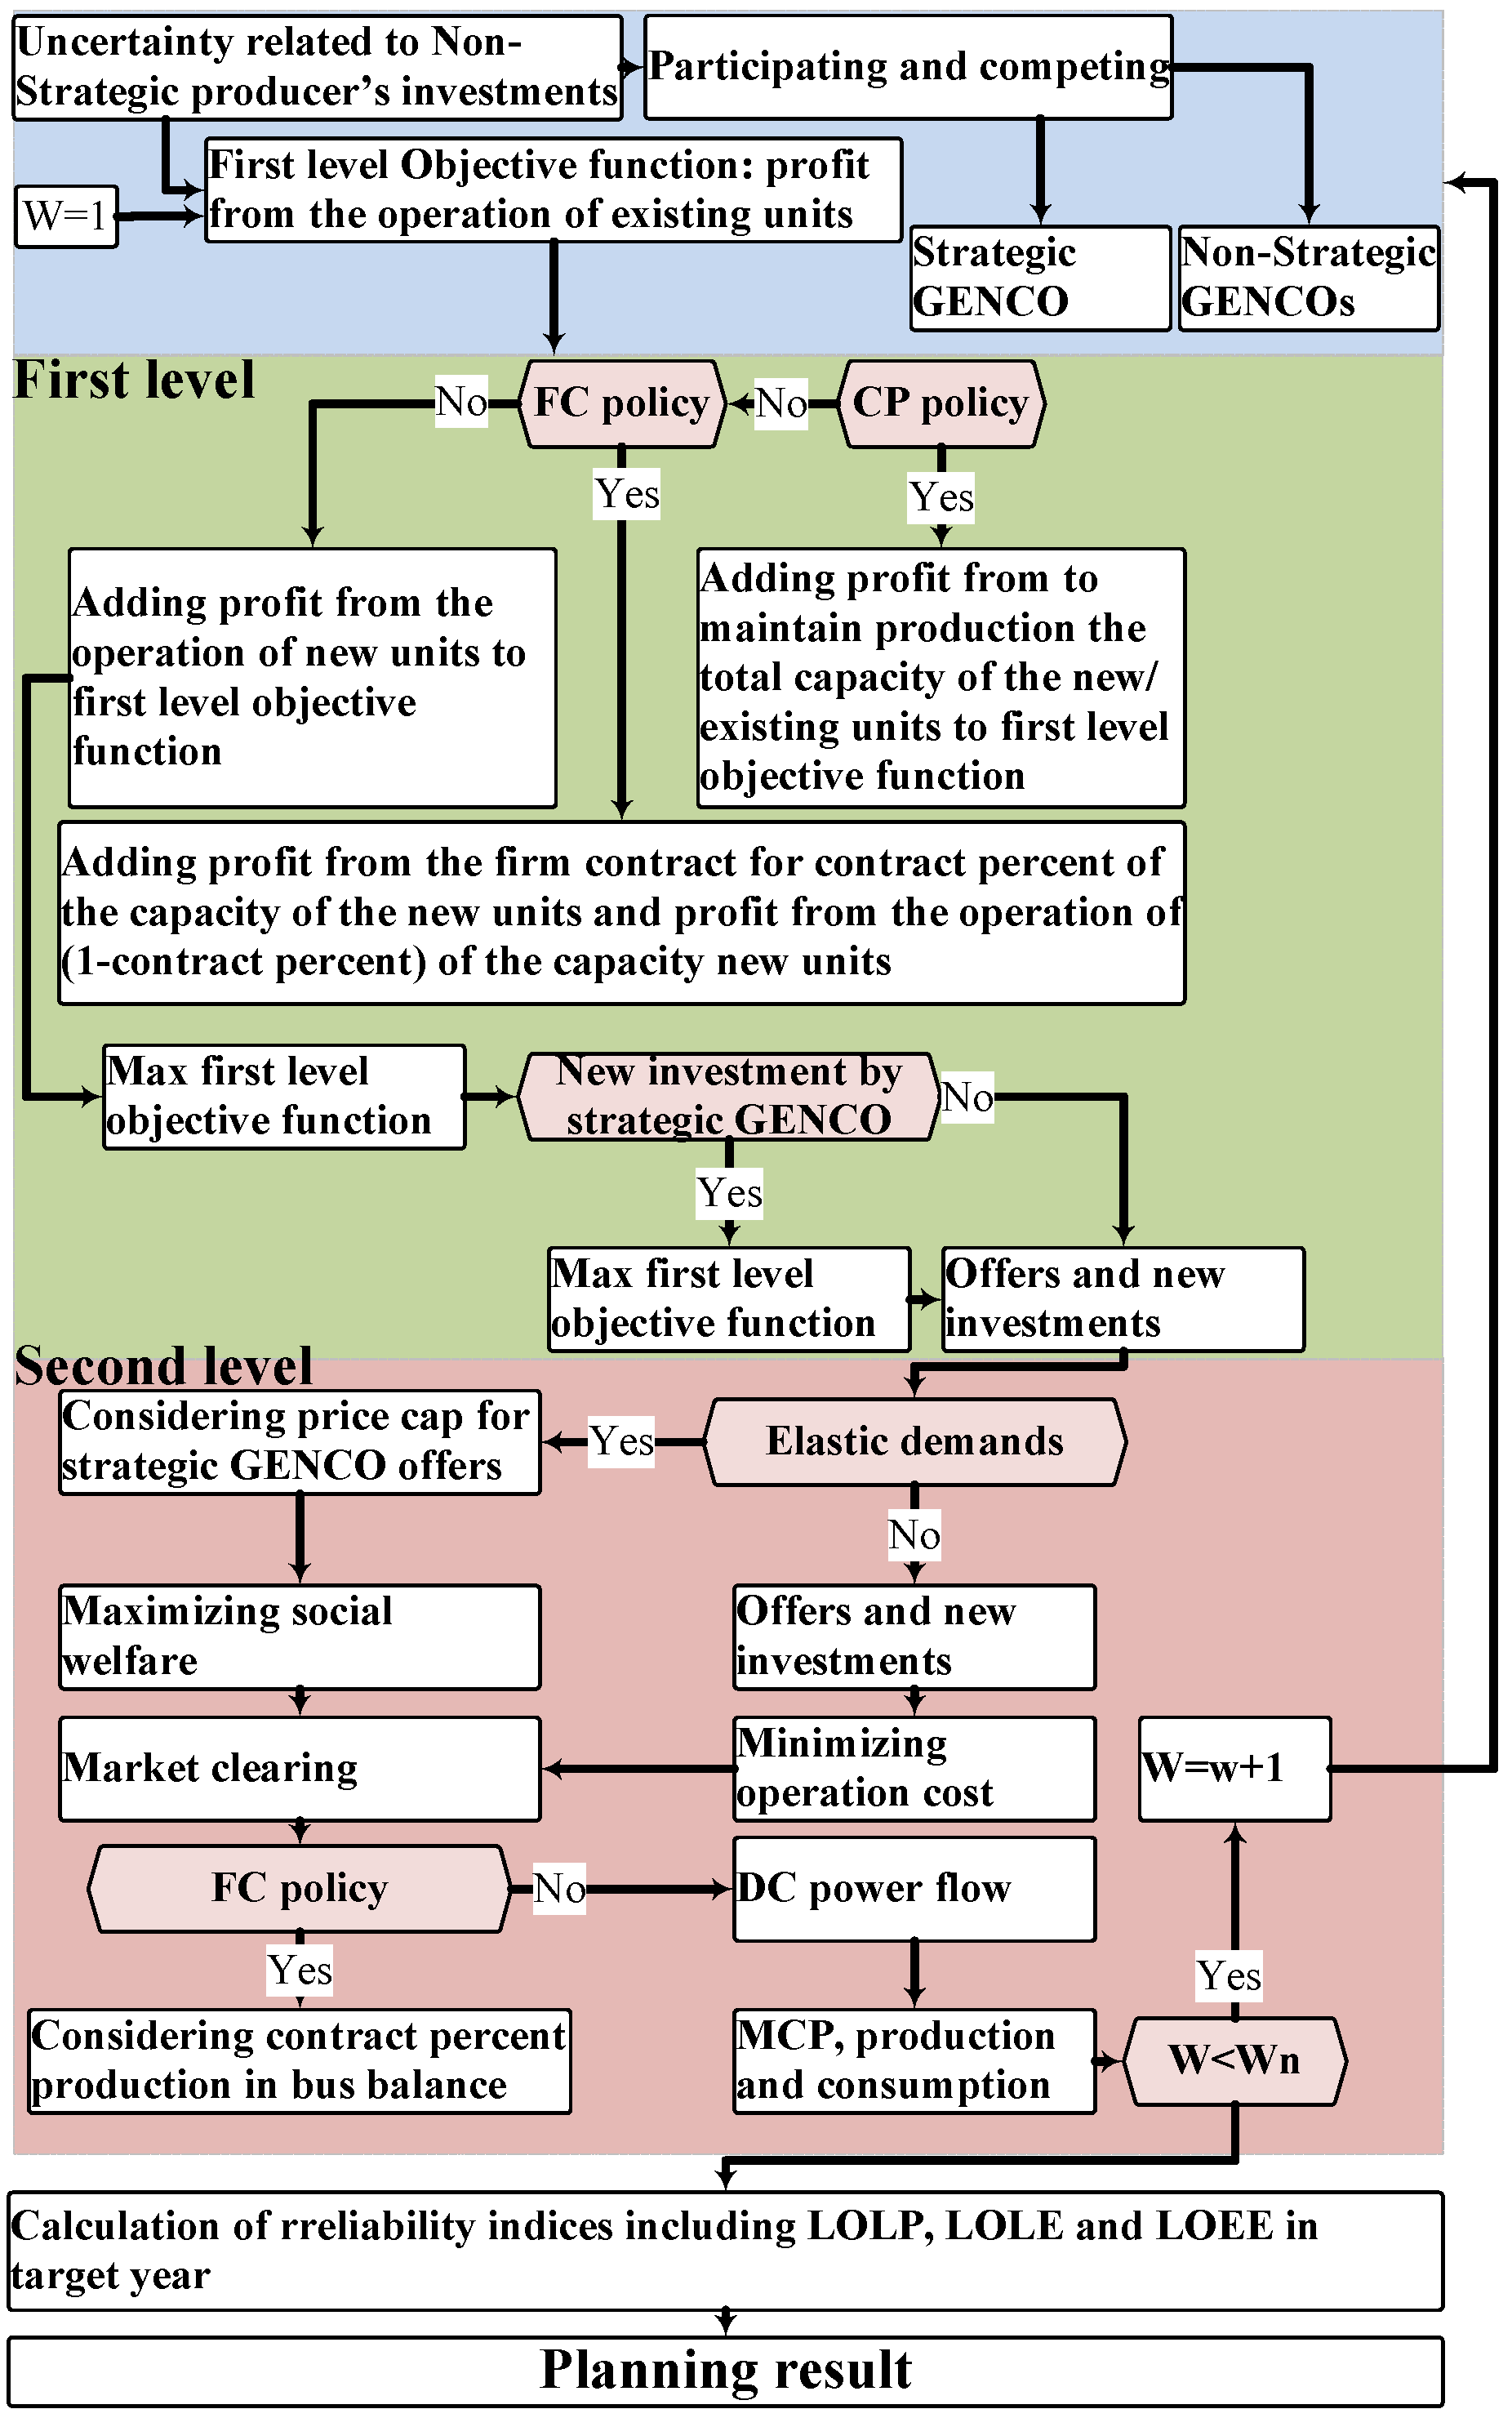
2. Proposal Algorithm for Optimizing GEP in Different Markets

The problem flow chart structure is presented in Figure 1. The functionality of the algorithm relies on initializing with decision-making on the type of energy market to be determined first at the beginning of process flow implementation. Both new and existing units and sub-units of individual elements are included in the incentive payment capacity, while, for the firm contract and hybrid markets, only new units are included in the incentive firm contract, in order to distinguish between different classes of markets, and to correlate the interoperability. The investment criterion solution in the first-level is applied with the aim of maximizing the net profit of the strategic GENCO in total planning duration of its controllable functionality. The second-level variables include investment by strategic GENCO and strategic GENCO offers for the new and existing units. These variables have a certain critical dependency on the first-level solution variables, which are parameterized at this stage for interoperability verification between first and second-level variables. The strategic GENCO can only make one investment decision as per decision step, as it is critically improbable to estimate exactly which scenario is going to occur in real-time initialization and parameterization conditions. The nature of energy demand is then also selected in the initialization stages of the second-level solution. It is noteworthy that the objective function in a second-level solution algorithm is designed to maximize the social welfare if demands are classified as elastic in nature to the energy price. In this case, demands presented bids for buying energy from the suppliers GENCOs available in the current market sector; as such, this objective function should minimize the operational cost of the total units if demands are inelastic in nature to the energy price. Inherent within the characteristics of this objective function, the numerical algorithm is optimized and regulated for any scenario of demand block phase. In this case, the firm contract and hybrid markets’ effect on the production and consumption is algorithmically balanced under any constraints experienced because they have the similar correlation with the incentive firm contract in their respective policies at the first place, and the part of consumption is matched according to the firm contract volume considered. The variables include the production, consumption, market clearing prices and angle buses, which are inter-correlated with each other. In addition, the variables in the second-level are considered as variables for the first-level. By using the above architectural algorithm implementation, the operational solution for the first-level is optimized regressively as such by already considering the second-level constraints for each scenario, along with each demand block, which their respective second-level outputs calculations are fed back to the second-level inputs, thereby closing the loop of full functionality of algorithm emulation cycle. For simplicity, the time blocks are not shown in the algorithm flow chart implementation, while it is presented in the pseudo-code structure representing Algorithm 1.
The functionality of this algorithm is specifically designed to: initialize in with decision-making on the type of energy market considering new and existing units included in the incentive payment capacity, firm contract and hybrid markets, deciding investment criterion solutions based on optimizing first and second-level solutions maximizing different attributes, for real-time initialization and parameterization for interoperability verification, maximizing the social welfare while minimizing the cost efficiency for demands under classification of elastic or inelastic nature of energy prices by numerical algorithm optimization for each demand block balanced under any constraints and consumption matched.
Algorithm 1 The proposed algorithm for investment incentives in the GEP problem.
Require: IDEA
  • Input: uncertainty related to non-strategic GENCOs investments and network data
  • Market features: participating and competing between one strategic GENCO and non-strategic GENCOs
  • W=1;        ▹ scenario of uncertainty related to investment of non-strategic GENCO
  • while w ≤ wn do
  • First-level objective function: profit from the operation of existing units
  • if market have CP policy then
  •   Adding profit from to maintain production the total capacity of the new/existing units to first-level objective function
  •   if market have FC policy then
  •    Adding profit from the firm contract for contract percent of the capacity of the new units and profit from the operation of (1-contract percent) of the capacity new units
  •   else
  •  Adding profit from the operation of new units to first-level objective function
  •   end if
  • end if
  • Max first-level objective function
  • if new unit is invested then
  •   It will be added to existing unit in network
  • end if
  • Output: investment and offers by strategic GENCO
  • while t ≤ tn do
  •   if demand is elastic to demand then
  •    Offer by demands
  •    Objective function in second-level: Max social welfare
  •   end if
  •   if demand is inelastic to demand then
  •    Considering price cap for strategic GENCO offers
  •    Objective function in second-level: Minimizing operation cost
  •   end if
  • Objective function optimization in second-level (Market clearing)
  •   if market have FC policy then
  •    Considering contract percent production in bus balance
  •   end if
  • DC power flow
  • Output: generation, consumption and price
  • w = w + 1
  •   end while
  • t = t + 1
  • end while
  • return Calculation of Reliability indices including LOLP, LOLE and LOEE

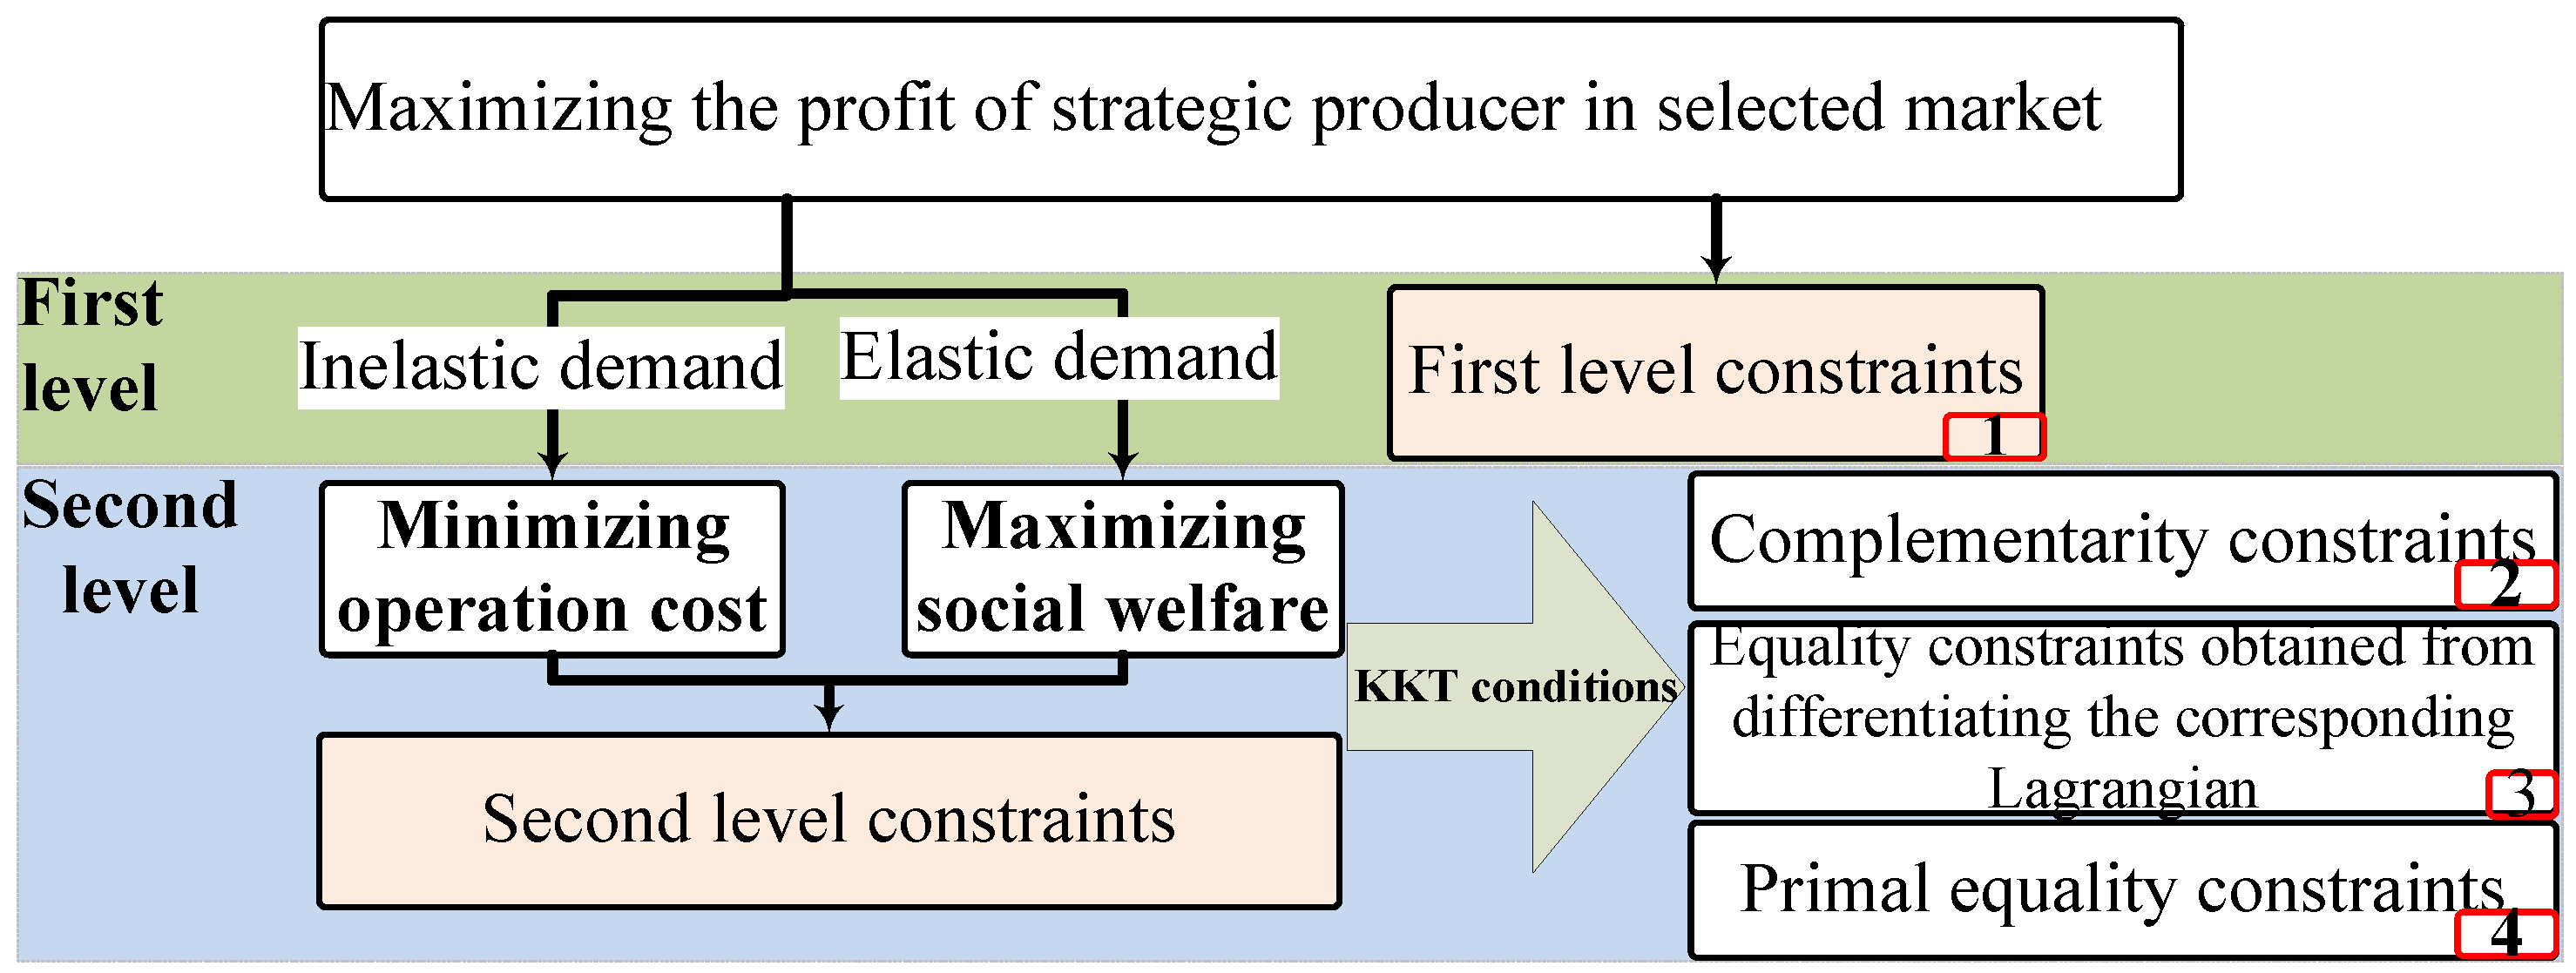
3. Converting Bi-Level to Single-Level

In this paper, the proposed market structure and logical pseudo algorithm implementation is expressed using a bi-level optimization model architecture to implement the proposed optimization of different power generation investment and planning incentives under variable uncertainties, as envisioned under an inter-operability strategy using a single-level problem (e.g., MPEC) structure, and then utilize a mixed integer linear program (MILP) linearization
The bi-level model can be solved both heuristic algorithmic methods and the General Algebraic Modeling System (GAMS, GAMS Development Corporation, Washington, DC, USA) solvers [43,44]. However, given the ability to solve model MIP by GAMS solvers, this is fundamentally used to solve the model solution as proposed in our case study. For this purpose, first, the bi-level model should be converted into a single-level linear solution, and then the optimization of these emulated solutions is obtained using the considered GAMS available solvers, as illustrated in a logical implementation structure of Figure 2. For our case, the envisioned second-level solution has inherent constraints, including the DC power flow integration, limitations of stand-alone unit production and balanced production and consumption equilibrium for the full cycle loop of algorithm; therefore, the second-level per solution is required to have a linear response, and therefore classified as a convex type algorithm. For this consideration, the bi-level optimization solutions proposed above are converted into a single-level optimization solution by using the karush kuhn tucker (KKT) conditions of second-level [28,42], by considering an implementation of a MPEC [29,45], which is then rigorously linearized by the theoretical boundaries and principles of bigM and the strong Duality theorem and then the mixed integer nonlinear problem converted to a MILP. Furthermore, complimentary constraints obtained from KKT conditions are linearized using the theoretical boundaries and principles of bigM algorithmic implementation [46]. In an overall functionality point of view, therefore, the above logical architecture of a heuristic type algorithm, along with GAMS solver implementation obtained by purely a mathematical model expression, defines the key ability of the MILP solution, which performs a full linearization of all nonlinear variable correlations, so that it is within the solvable boundaries of MILP in GAMS solver functionality.

4. Considering Uncertainty

In this research, the investment incentives by non-strategic GENCOs as suppliers are modelled as uncertainty scenarios that as shown in Figure 3. For the purpose of simplification, four different basic level scenarios are assumed for investment incentive emulation purposes by non-strategic GENCOs, while this model implementation can also be extended to a multiple integration of large number of scenarios and can be considered with ease of flexible integration and application to other models. To exemplify the unique feature of this proposed novel framework of algorithmic implementation based on MPEC structure, any given scenarios, as in our case the ones illustrated in Figure 3 supposedly considered to be identical for all energy markets, thereby choosing the above implementation for enhanced impact identification of a versatile range of different markets on their investment performance for different strategic GENCO, can be achieved. In addition, price offer of non-strategic GENCOs is assumed to be equal to a marginal cost of generation unit of non-strategic GENCOs.

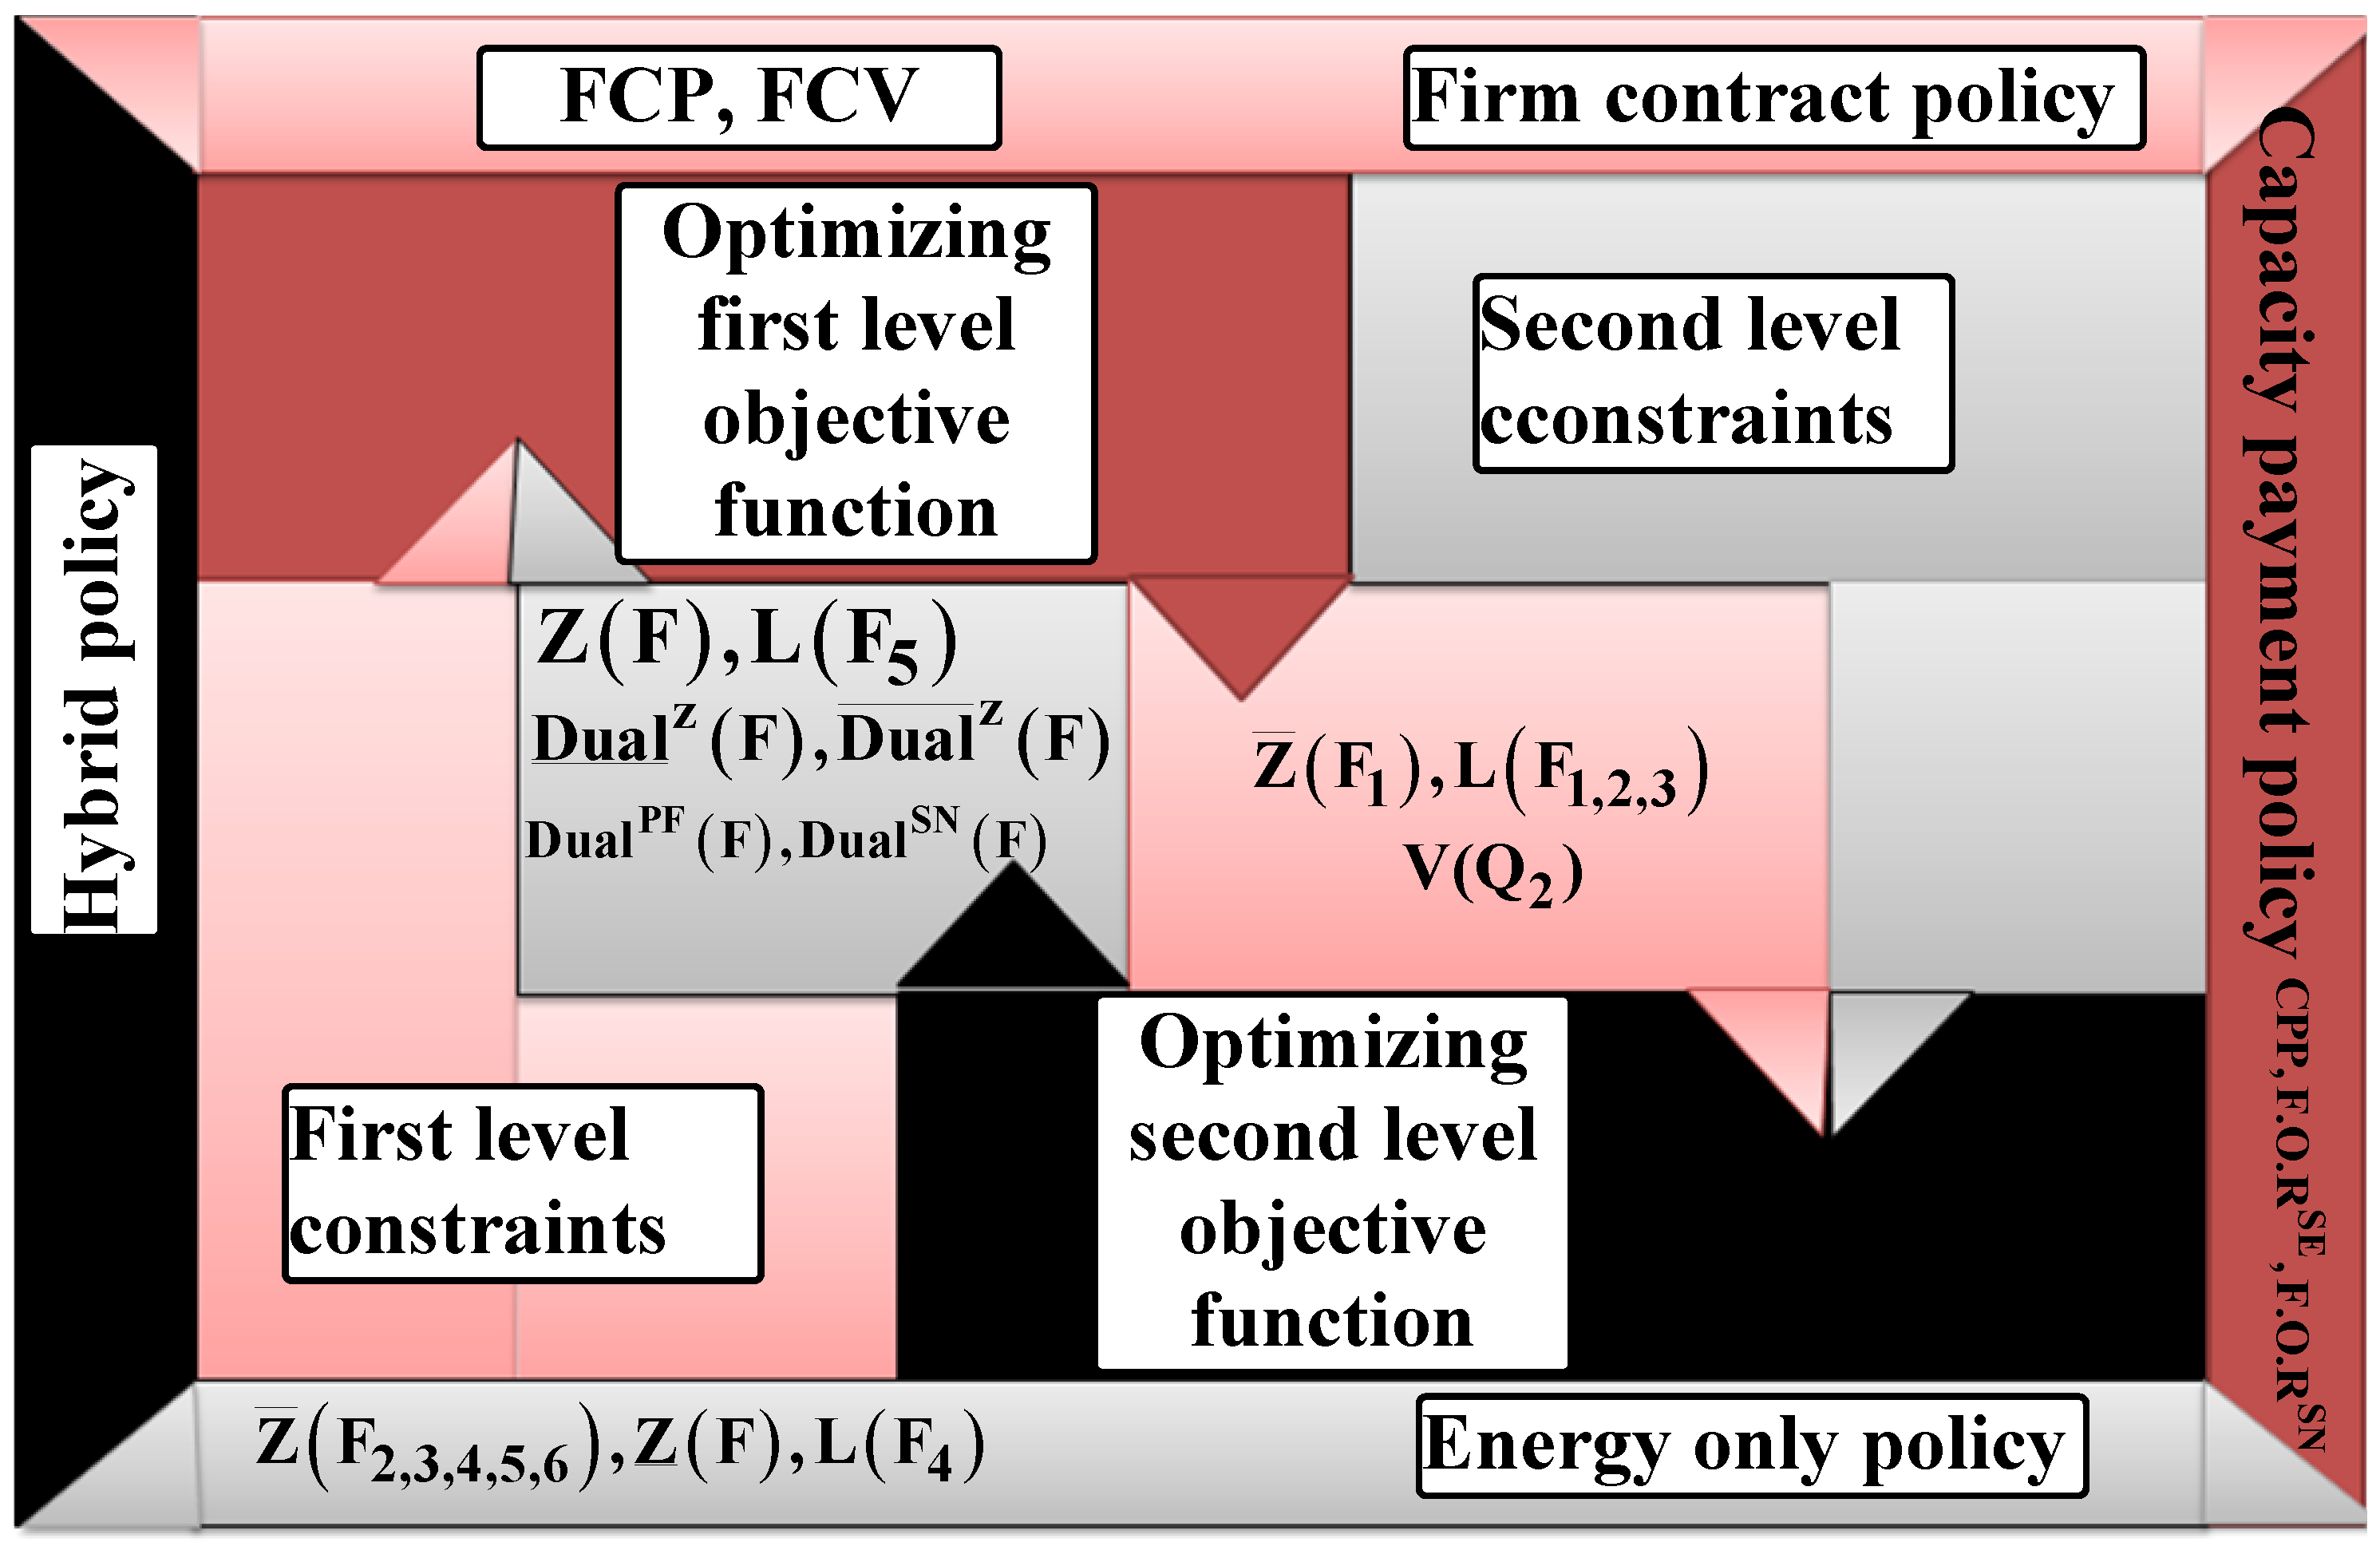
5. Relationship between the Different Levels and Variables Related to Each Level

Figure 4 shows the two-level model, the relationship between the different levels and variables related to each level. Only the first-level variables are the invested capacity by the strategic GENCO including variables Z ¯ ( F 1 ) , V ( Q 2 ) and offers of strategic GENCO on the market for the sale of electricity produced by their existing L ( F 2 ) and new units L ( F 1 ) , and offers of non-strategic GENCO L ( F 3 ) which are determined according to maximizing the profits of strategic GENCO. These variables on the second-level have a certain amount and they are parameterized. Inputs of the first-level model are IB , IC , dc , V ( Q 1 ) , C ( F ) , WDB , WSW . Only the second-level variables include the variables the production, consumption, buses angle including Z ( F ) and market clearing prices L ( F 5 ) and dual variables of second-level constraints including Dual ¯ z ( F ) , Dual ̲ z ( F ) , Dual PF ( F ) , Dual SN ( F ) which are determined by the aim of maximizing the social welfare as a constraint in the second-level problem. Only variables related to the second-level are also accounted as first-level variables. The inputs for the second-level are Z ¯ ( F 2 , 3 , 4 , 5 , 6 ) , Z ̲ ( F ) , L ( F 4 ) . Inputs of capacity payment policy are CPP, F . O . R SE , F . O . R SN .

6. Mathematical Formulation

In the following sub-sections, the algorithmic emulation and optimization of the proposed framework is detailed in the mathematical formulation:

Bi-Level Model Formulation of Markets

The stochastic nature of investment incentives solution is formulated using the following bi-level model that comprises a first-level solution phase of Equations (7)–(14), and a collection of second-level sub-solutions, Equations (15)–(19).
For all the mathematical expressions defined, all dual variables are indicated at the relevant terms of constraints by a following notation of “colon” to mark the dual input of variables.
The following describes the mathematical numerical formulation: F 1 : { t , a , w , n } , F 2 : { t , e , w , n } , F 3 : { t , o , w , n } , F 4 : { t , j , w } , F 5 : { t , n , w } , F 6 : { t , n , m , w } , Q 1 = { a , h } , Q 2 = { a , h , w } .
For the above, all variables related to F 1 include indices {t, a and w}. For the rest of the F series, everything is defined in the same way. All variables related to Q 1 and Q 2 includes indices {a, h} and {a, h, w}, respectively, as an example case study. All sets have been defined in the formulation structure as included in the pre-defined sets of Z ( F ) , L ( F ) , Z ¯ ( F ) , Z ̲ ( F ) , C ( F ) and V ( Q ) . The constitutional structure and variables of all sets are as follows:
Z ( F ) = [ G SN , G SE , G NS , D , AON , PF ] ,
L ( F ) = [ OG SN , OG SE , OG NS , UD , MCP , SL ] ,
z ¯ ( F ) = [ G ¯ SN , G ¯ SE , G ¯ NS , D ¯ , 3.14 , PF ¯ ] ,
Z ̲ ( F ) = [ 0 , 0 , 0 , 0 , 3.14 , PF ¯ ]
C ( F ) = [ MC SN , MC SE , MC NS , 0 , 0 , 0 ] ,
V ( Q ) : [ OI th , OI SNb ] .
G SN is power produced from a new generation unit of a strategic GENCO, in demand block t and scenario w (MW). For all of the above, the mathematical expressions that have been generically structured for an example Z equals the G variable for category of SN as a function of F 1 : Z ( F 1 ) = G SN . The equivalent variables Z ( F 1 ) and G SN include the indices t, a, w and n, since F 1 includes the indices t, a, w and n, respectively:
Strategic GENCO profit = max EOPROFIT + FCPROFIT + CPPROFIT .
Equation (7) is defined as starting the negation from the expected profit (investment cost minus expected revenue) of a strategic GENCO suppliers’ allocated budget in a given planning horizon, which is comprised of three expressions as: the terms of profit function (i.e., Equation (7)) is the associated net profit of strategic GENCO in EO, FC and CP markets, respectively. The net profit of a strategic GENCO in FC and CP markets is in fact equal to the net profit of that GENCO in a hybrid market environment, where EOPROFIT, FCPROFIT and CPPROFIT are defined as:
EOPROFIT = max r 1 / ( 1 + d s ) r t WDB w WSW F 1 F 3 Z ( F ) ( L ( F 5 ) C ( F ) ) : F 1 , 2 , 3 F 5 : { r , t , n , w } IC ( Z ¯ ( F 1 ) ) .
The term of Equation (8) is the net profit of strategic GENCO in the EO policy that comprises two terms in itself. The first term of the profit function (i.e., Equation (8)) is the expected profit obtained by selling energy in the spot market. The second term of profit function (i.e., Equation (8)) is associated with the investment cost for that market investment. Note that F 1 , 2 , 3 , 4 , 5 F 6 : { r , t , n , w } means that variables F 1 , 2 , 3 , 4 , 5 and F 6 are comprised of indices of variables which are the same.
max s t WDB w WSW FCP F 1 Z ¯ ( F 1 ) FCV .
The term of Equation (9) is associated with the expected profits of the strategic investor obtained by selling a pre-determined part of the production in a firm contractual market. The FCV is the percentage of the capacity of the new unit that can be purchased from the strategic GENCO, in terms of their firm contract, which is considered as a pre-requisite. In our research case study, the FCV is considered to be 10% for stability purposes:
max t WDB w WSW CPP Z ¯ ( F 1 ) ( 1 FCV ) ( 1 F . O . R SN ) + CPP Z ¯ ( F 2 ) ( 1 FCV ) ( 1 F . O . R SE ) .
The term of Equation (10) is the expected profit obtained from the capacity payments:
Z ¯ ( F 1 ) = h V ( Q 1 ) × V ( Q 2 ) ,
h V ( Q 2 ) = 1 : V ( Q 2 ) { 0 , 1 } .
The term of Equations (11) and (12) are the conditional statements for setting investment options only available to discrete blocks. For all these numerical expressions, they impose the condition that only one technology is binding and determines the new technology to be installed at each bus of the system:
IC ( Z ¯ ( F 1 ) ) < IB ,
L ( F ) 0 : F 1 , 2 .
In addition, to comply with the limitations of cost margins and positive loop implementation to reduce redundancy, the investment budget limit is represented by terms Equation (13), and the term Equation (14) makes sure that offers to strategic GENCO for its new and existing units are also always positive values, numerically.
The market clearing solutions are represented by the objective function Equation (15) along with terms of Equations (16)–(19).
For all the mathematical expressions defined, all dual variables are indicated at the relevant terms of constraints by a following notation of “colon” to mark the dual input of variables.
The unique feature of the above mathematical expression of objective functions is that both elastic and inelastic conditions can be considered. If demand is elastic to the price, the objective in the second-level maximizes the social welfare, numerically expressed by the adjoining term of:
Z ( F 4 ) L ( F 4 ) F 1 F 3 Z ( F ) L ( F ) .
However, if demand is inelastic to the price, the objective in the second-level minimizes the operation cost, numerically estimated by the summation and multiplication of GENCOs production and operation cost of GENCOs unit
F 1 F 3 Z ( F ) L ( F ) .
The optimization of the objective function in the second-level solution is obtained by considering Equation (15):
Z ̲ ( F ) Z ( F ) Z ¯ ( F ) ( Z ¯ ( F ) FCV ) | F 1 : ( Dual ̲ z ( F ) , Dual ¯ z ( F ) ) .
Equation (17) imposes power bounds for the blocks of generation constraints, the power flow and the angle bounds:
F 1 F 3 Z ( F { n } ) + Z ¯ ( F 1 ) FCV Z ( F 4 { n } ) Z ( F 6 { n } ) : L ( F 5 ) .
Equation (18) represents the energy balance at each bus, being the associated dual variables LMPs or nodal prices for global variable.
For the above, when the demand is inelastic to the energy price, the Z ( F 4 ) = Z ¯ ( F 4 ) satisfies the condition in Equation (17) and Z ( F 6 ) takes the form:
Z ( F 6 { m , n } ) = L ( F 6 { m , n } ) ( Z ( F 5 { m } ) ) Z ( F 5 { n } ) : Dual PF ( F ) .
Equation (19) defines the power flow through transmission lines using a loss-free DC model.
In addition,
Z ( F 6 { n = 1 } ) = 0 : Dual SN .
Equation (20) regulates the voltage angle at each bus for the reference bus. The following on mathematical implementation, as illustrated before in Figure 3, describes the linearization methodological conversion of the bi-level topology solution to a single-level structure by using the KKT conditions of first-level [5] based on the features of equilibrium constraints of MPEC, and linearization optimization of MILP, which is presented in the next section.
The following describes the mathematical numerical formulation describing the objective function and the associated constraints as follows:
  • Objective   Function
    To complete the conversion of bi-level solution to a single-level optimization structure, a linear expression for the term F 1 F 2 Z ( F ) L ( F 5 ) : F 1 , 2 F 5 : { t , n , w } , which is the expression for strategic incoming in the operation market, is obtained by using a strong duality theorem and dedicated KKT equalities under pre-defined KKT conditions [16]. So far, all mathematical manipulation assumes the compliance by equilibrium constraints of MPEC and linearization by MILP.
    The strong duality theorem is preferred here because it is specifically required for optimization integration of a mathematical algorithm that is convex in nature; the objective functions of this type of primal and dual solutions have the same output value at the optimum limits, which is the feature in our case. The strong duality theorem is presented as follows:
    F 1 F 3 Z ( F ) L ( F ) Z ( F 4 ) L ( F 4 ) = F Z ̲ ( F ) Dual ̲ z F ( Z ¯ ( F ) ( Z ¯ ( F ) FCV ) | F 1 ) Dual ¯ z ( F ) ,
    where rearranging and summating just for the term DUAL,
    Z ̲ ( F ) Dual ̲ Z = Dual ̲ z Z ( F ) ,
    Dual ¯ z Z ( F ) = Dual ¯ z ( Z ¯ ( F ) ( Z ¯ ( F ) FCV ) | F 1 , 3 . )
[1] First-level constraints
The above terms of constraints are expressed as follows in Equations (8)–(14) which are based on the mathematical implementation of block 1 in Figure 3 for converting a bi-level into a single-level optimization structure. The primary feature here is considering the elastic/inelastic demand input from the first-level constraints topology with the aim of maximizing the profit margin of strategic GENCOs in an energy market structure.
[2] Second-level constraints
The above terms of constraints are expressed as follows in Equations (16)–(19) which are based on the mathematical implementation of block 2 in Figure 3 for converting bi-level into a single-level optimization structure. The primary feature here is taking into account the optimization criterion of reducing operational costs which maximizes social welfare as inputs for the second-level constraints’ topology with the aim of using the KKT conditions [11] considering equilibrium constraints of MPEC and linearization by MILP to emulate output constraints to complete the linearization process.
[3] Dual constraints from enforcing Primal-dual transformations to Third-level computations
This constraint is considered in the emulation structure of block 3 of Figure 3 based on MPEC framework proposed for specific investment incentives under uncertainty scenarios as follows:
L ( F ) | F 1 , 2 , 3 L ( F 4 ) | F 4 + Dual ¯ z ( F ) Dual ̲ z ( F ) L ( F 4 { n } ) | F 1 , 2 , 3 + L ( F 5 { n } ) | F 4 , 6 + Dual PF ( F 6 { m , n } ) | F 6 + L ( F 6 { m , n } ) ( Dual PF ( F 5 { n } Dual PF ( F 5 { m } ) ) | F 5 + Dual SN = 0 .
[4] Complementarity constraints of the KKT conditions
The proposed Bi-level model can be converted to a single-level optimization structure using KKT conditions and mathematical equilibrium constraints of MPEC so that Mixed-Integer Linear Programming (MILP) by linearization. This constraint is considered of block 4 of Figure 3, which is as follows:
0 ( ( Z ¯ ( F ) ( Z ¯ ( F ) FCV ) | F 1 , 3 Z ( F ) ) Dual ¯ z ( F ) 0
0 ( Z ( F ) - Z ̲ ( F ) ) Dual ̲ z 0 .
In the above, these complementarity conditions are nonlinear and highly non-convex in implementation. For linearization, note that each complementarity condition of the form 0 a b 0 is equivalent to a , b 0 , a τ M , b ( 1 τ ) M , τ { 0 , 1 } , where M is a large enough constant to satisfy the above.

7. Case Studies

The efficiency of the earlier proposed framework and algorithmic implementation is examined through different case studies. The first case study is comprised of a differentially separated small form two area power system network with six power buses. The second case study is considered as a large form area transmission network with high voltage 400/230 KV transformers integration based on the MAZANDARAN regional electric company (MREC) transmission network, being part of IRAN’s interconnected power system innovation consortium.

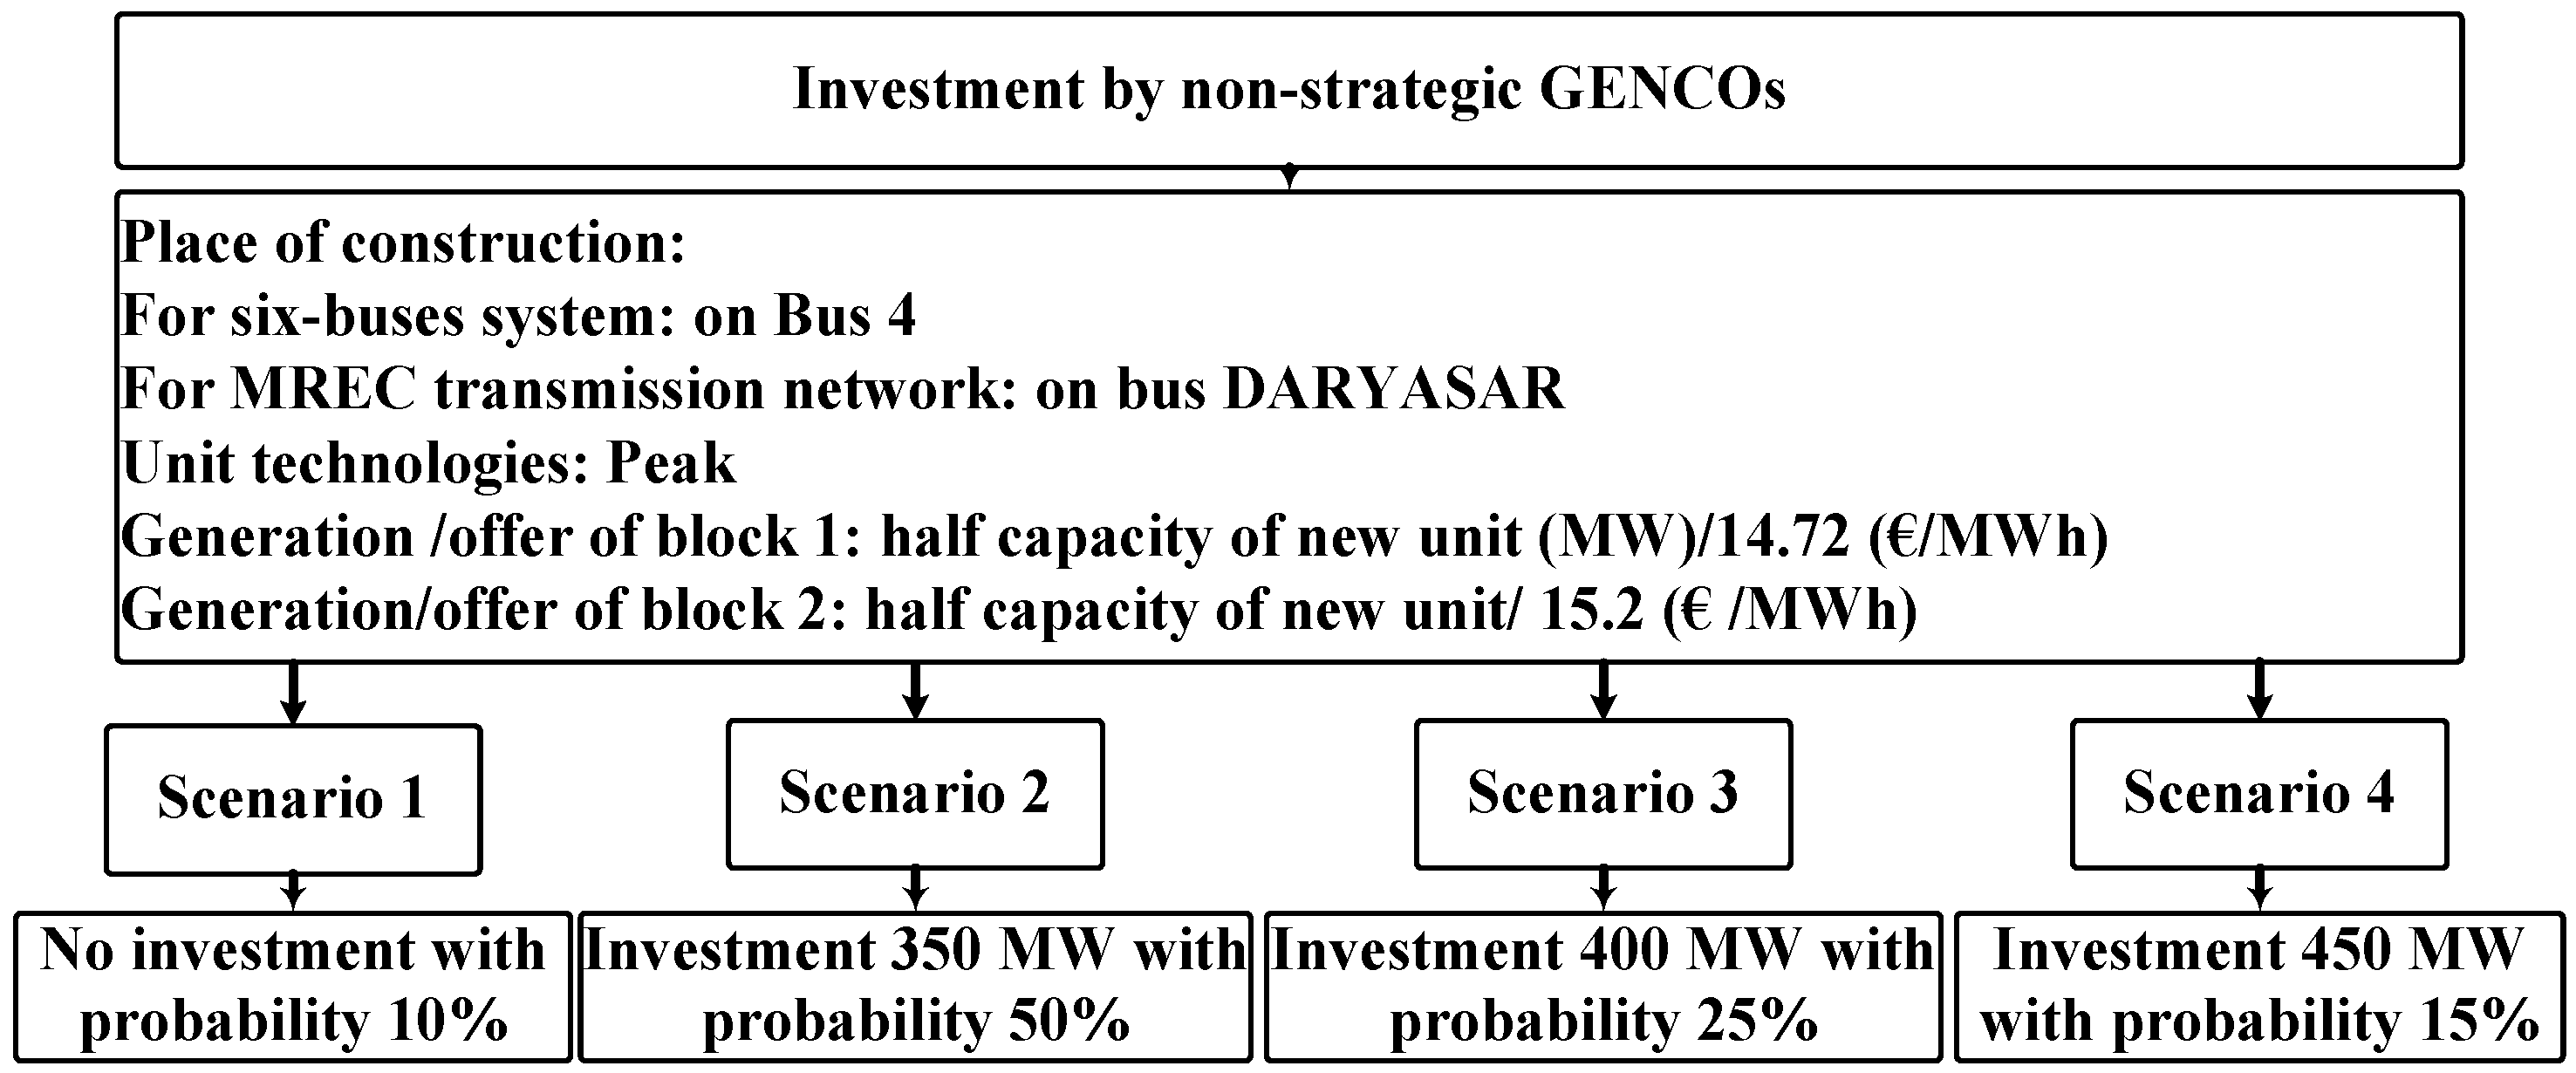
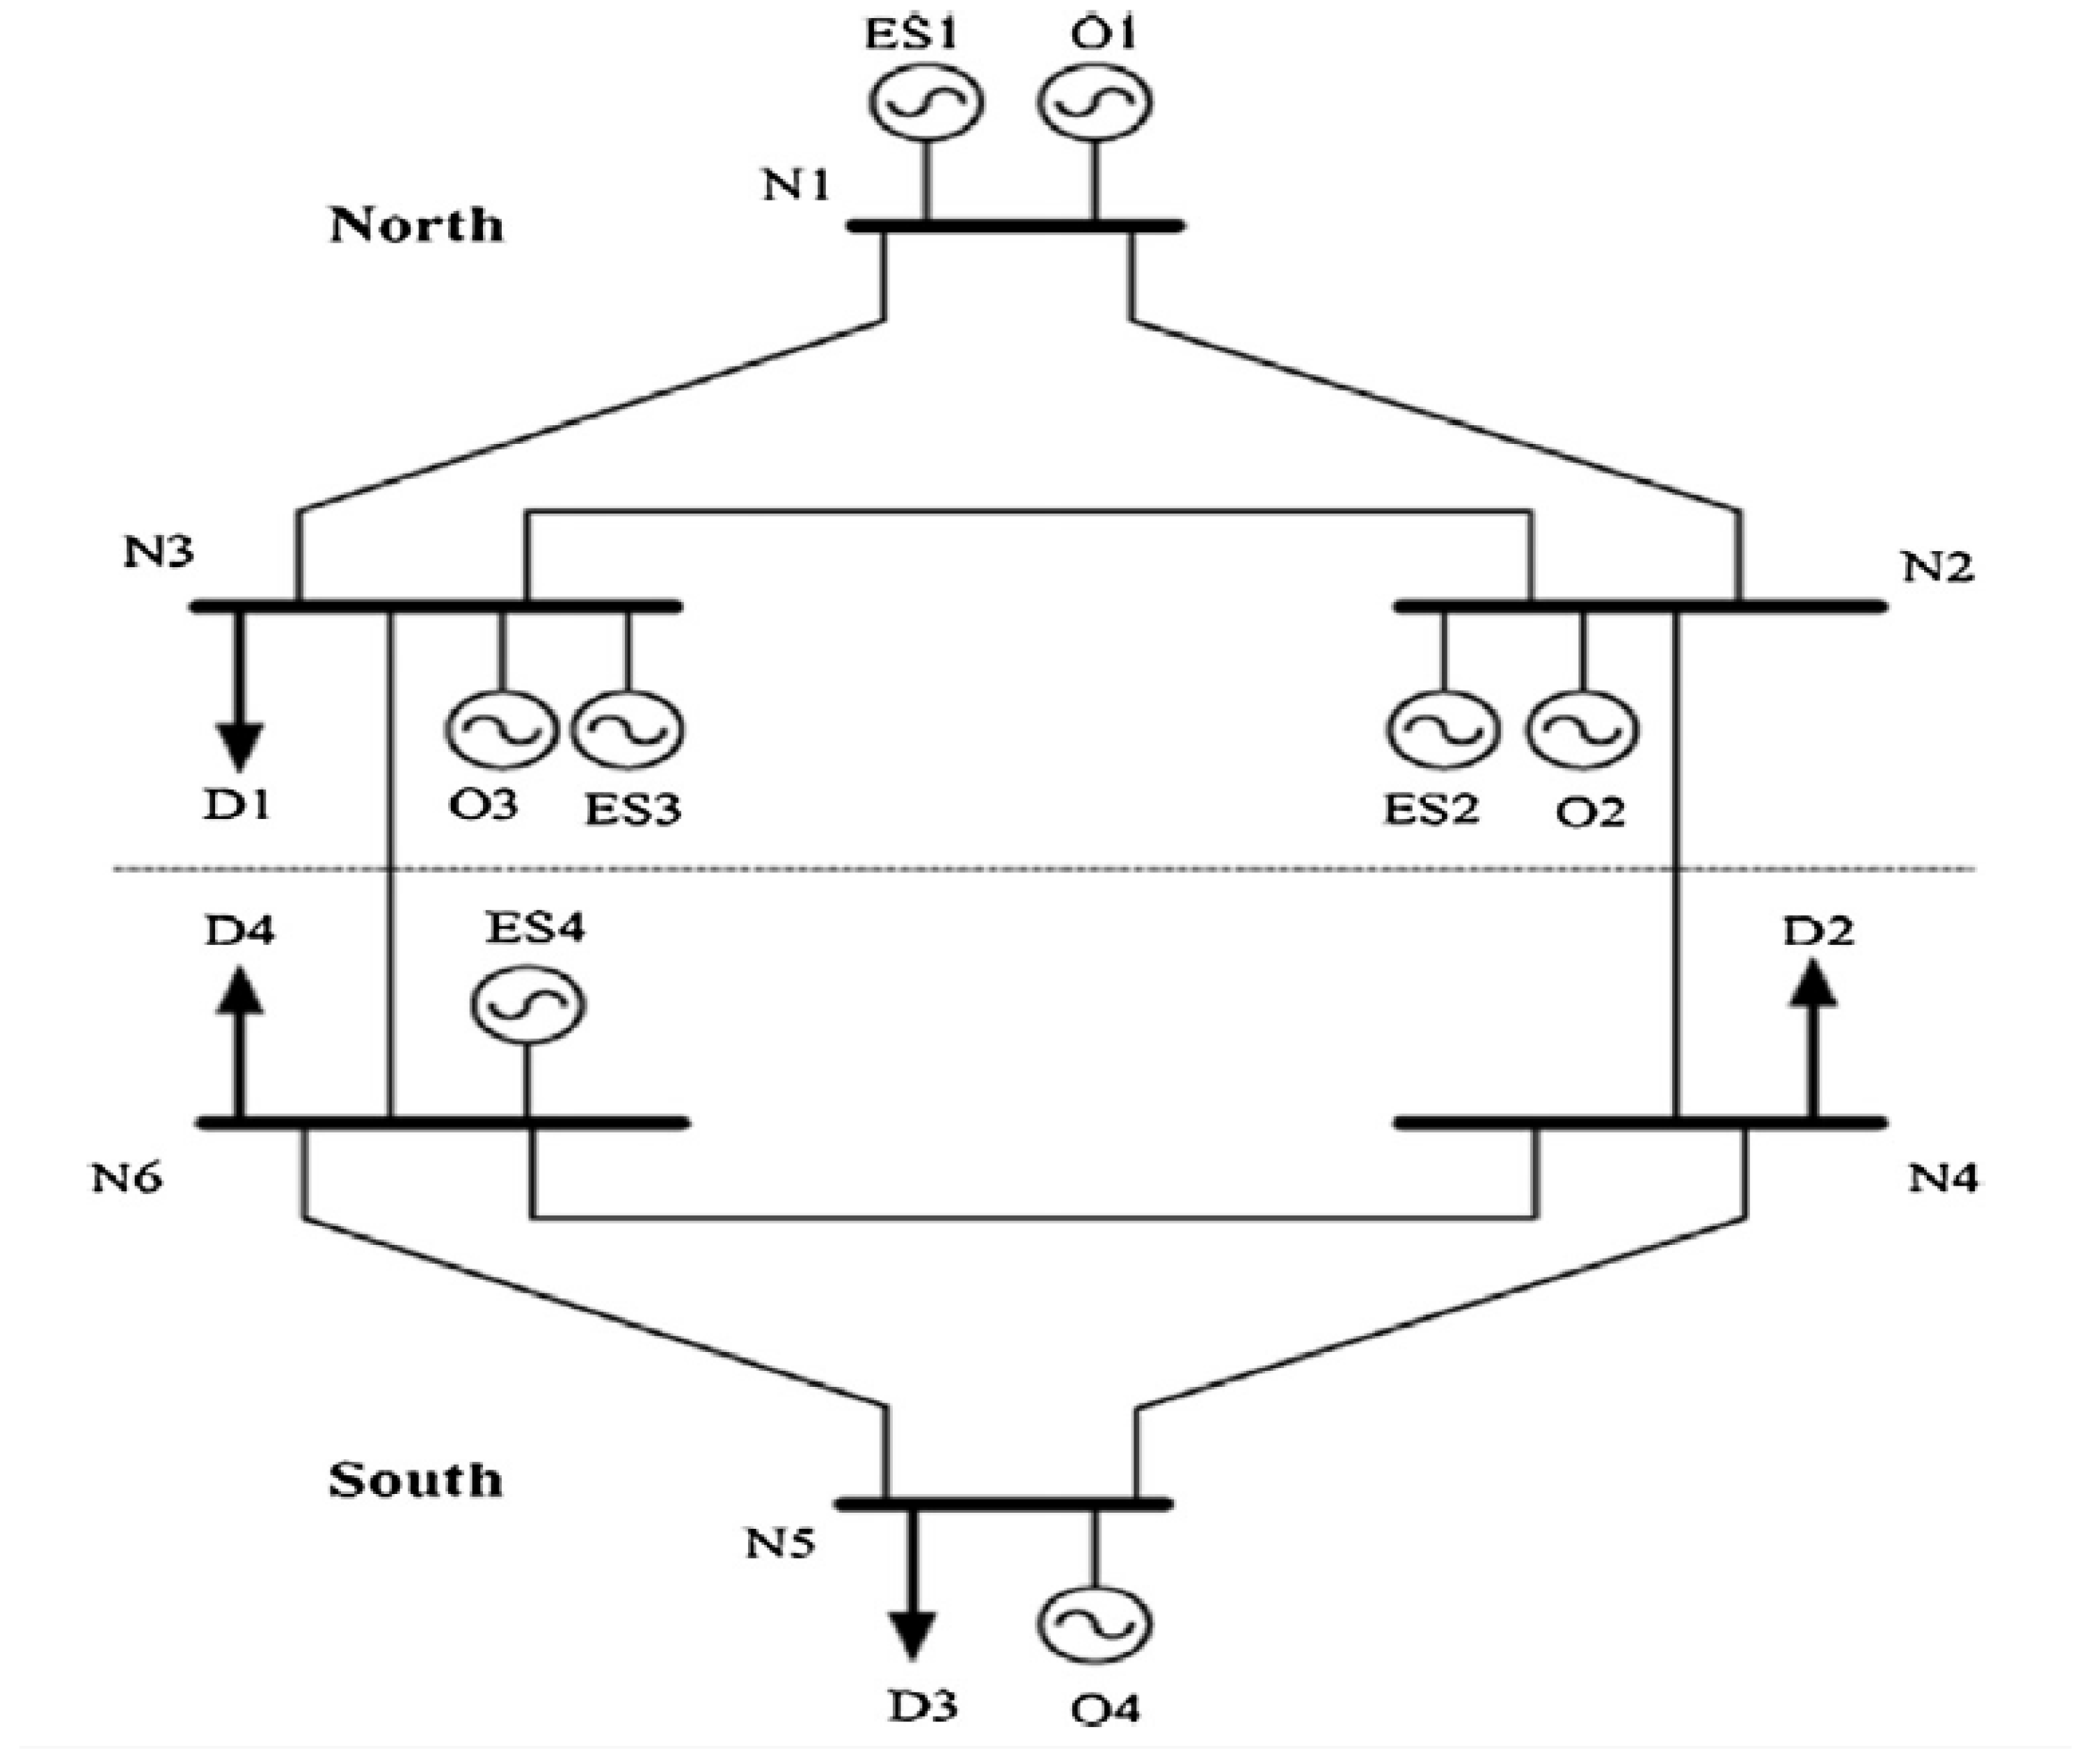
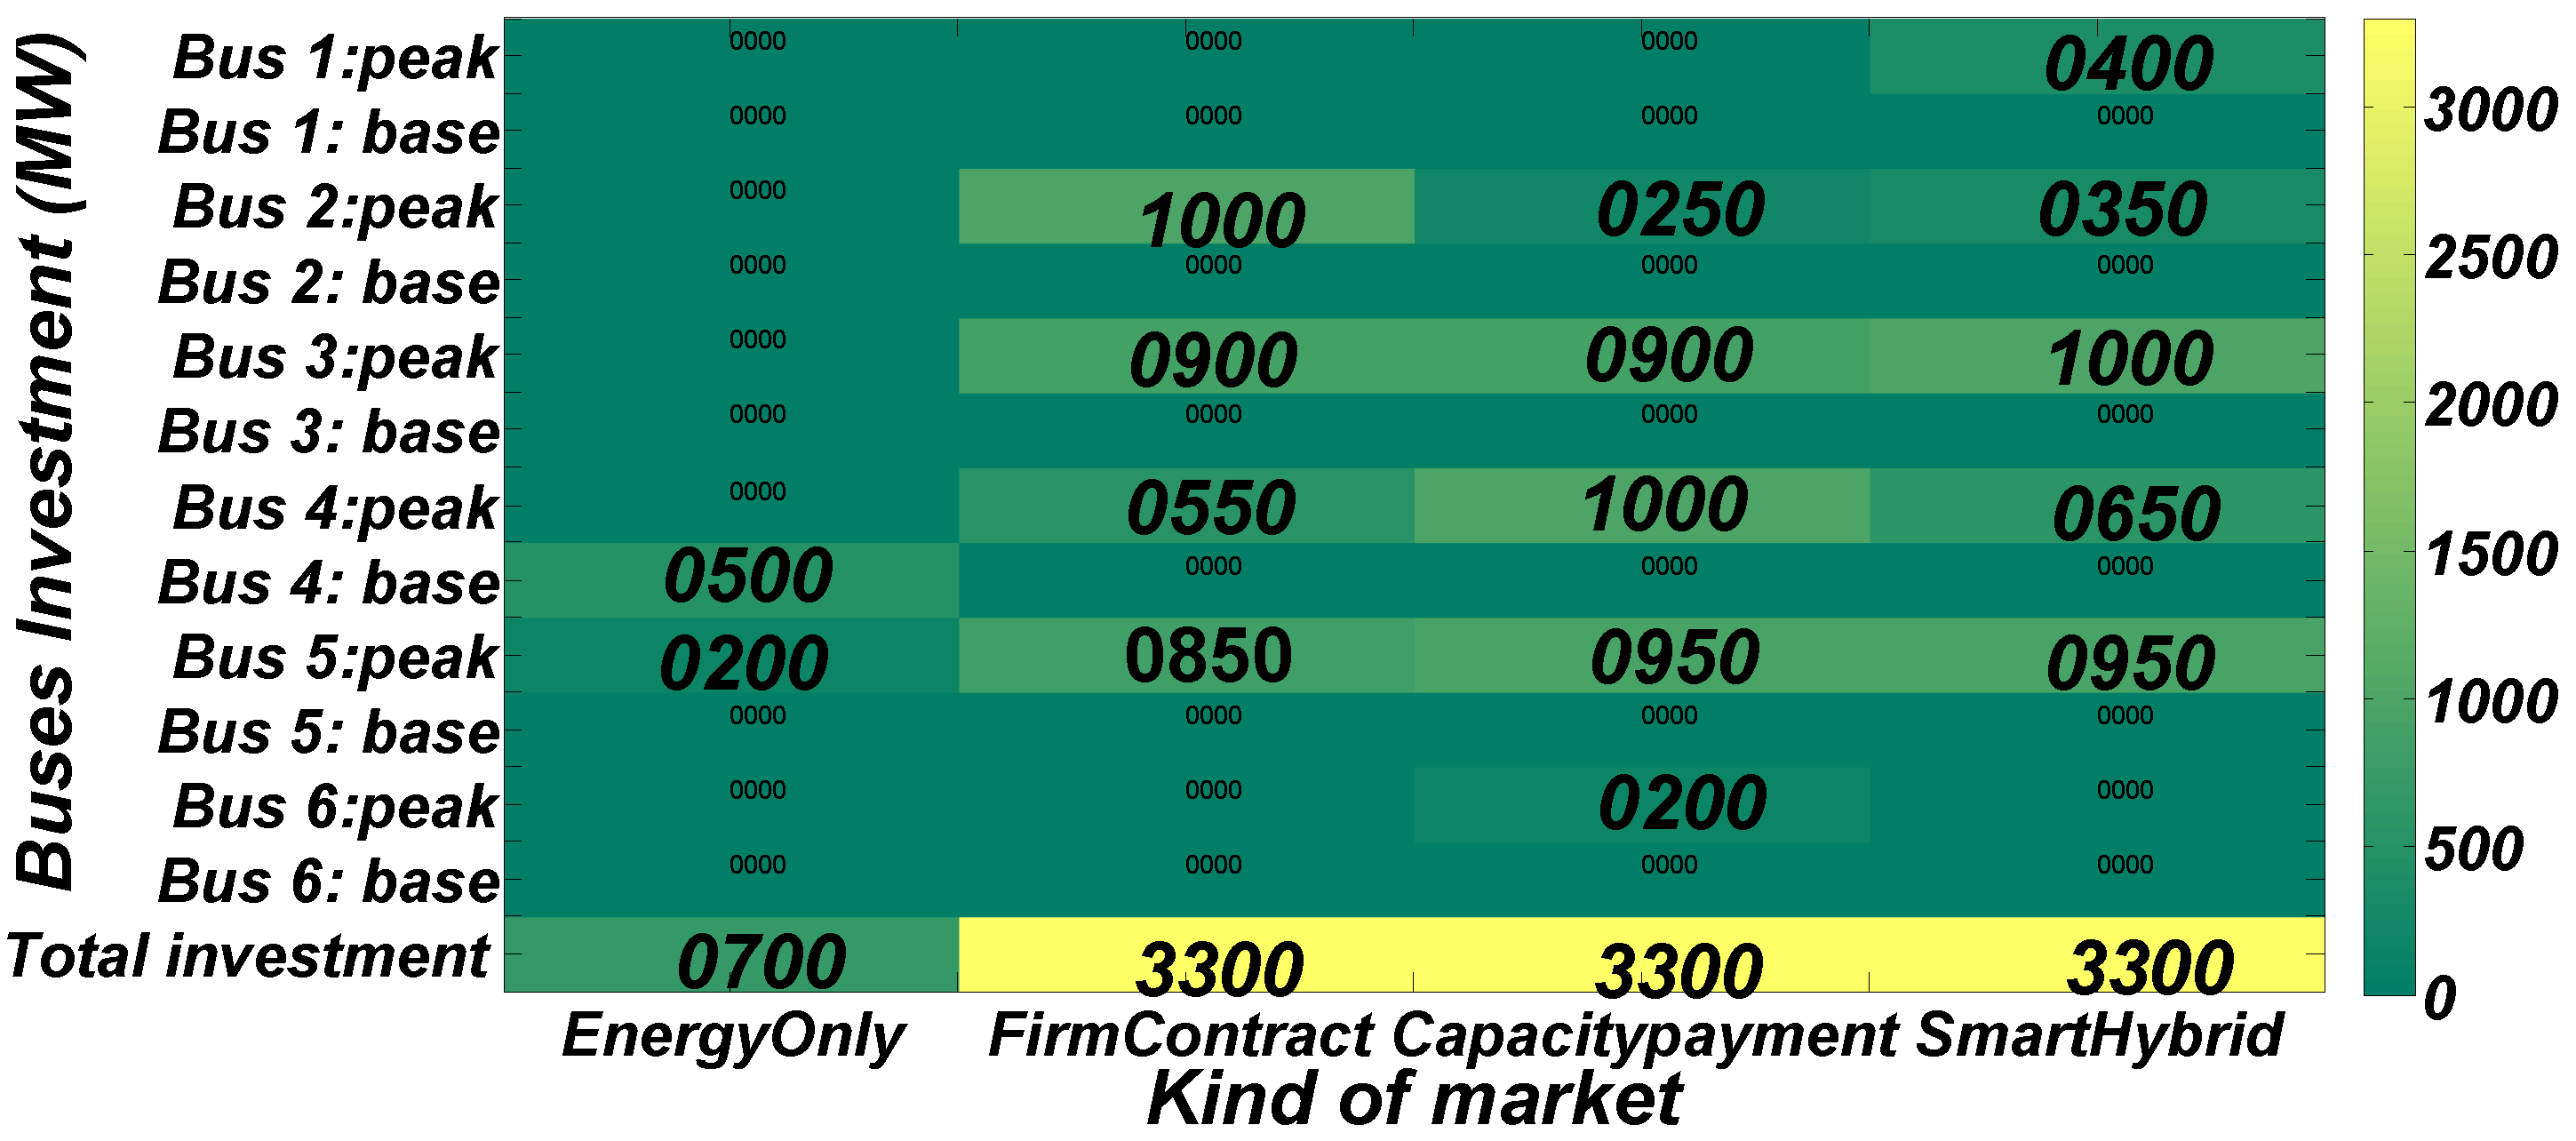
7.1. Six-Bus Power Transmission Network

The studied power network is depicted in Figure 5, which is composed of two deferentially separated areas (north and south zones) being interconnected by two tie-lines. The parameterization data associated with each unit and all demands’ characteristics for this network were adopted from [36]. Accordingly, for the purpose of simplification and optimization, it is assumed that capacities of the tie-lines are limited to 450 MVA under available investment budget assumed to be 50 million euros (€). Regarding investment considerations by the rival producers/suppliers, the selection of peak technology only and implementation of all new units on bus 4 only are assumed. It is also assumed that 10% of new capacity units are purchased in a contractual framework where contractual price is assumed to be 33 (€/MWh). Thereby, the capacity payment rate can be assumed to be 5 (€/MWh), which is applied to all available units. The Forced Outage Rate (FOR) of new and existing units are then assumed to be 0.03 and 0.05, respectively. For simplification, four different scenarios are considered for emulating investment incentive strategies and policy implementation by producers, as follows:
Scenario-1:
No investment over the planning period with the probability of 10%.
Scenario-2:
Investing 350 MW on the bus 4, with the probability of 50%.
Scenario-3:
Investing 400 MW on the bus 4, with the probability of 25%.
Scenario-4:
Investing 450 MW on the bus 4, with the probability of 15%.
In order to emulate impacts of different incentivizing policies on overall capacity expansions and economic indices of the market topology, the above four policy models are considered as: Energy Only (EO), Capacity Payment (CP), Firm Contract (FC) and Hybrid (H) (that incorporates both capacity payment and firm contract). The proposed model is solved using Solver CPELX (IBM ILOG CPLEX Solver, 11.0.1, Armonk, NY, USA) for a high performance solver for Mixed Integer Programming (MIP).
For validation of the simulation model, the static model initialization and parameterization [36] were implemented at first. Conventionally [36], the total profit and total constructed capacity over the planning period have been obtained as 32.2 M€ and 700 MW, respectively. After validation of simulation for the EO market, as the base case of initialization, the model was further extended to study impacts of investment incentives on generation capacity expansion from a dominant producer perspective.
Figure 6 illustrates the location of capacity constructed by the strategic producer as well as kinds of installed capacities. For instance, the total and the base installed capacities in the EO market are 700 MW and 500 MW, respectively, thereby resulting 200 MW investment in the peak technology. In addition, the generation expansion planning results for different market designs are given in Figure 7, which shows the average market prices, the net profit of investor, the Net surplus of strategic producer, rival, and consumers.

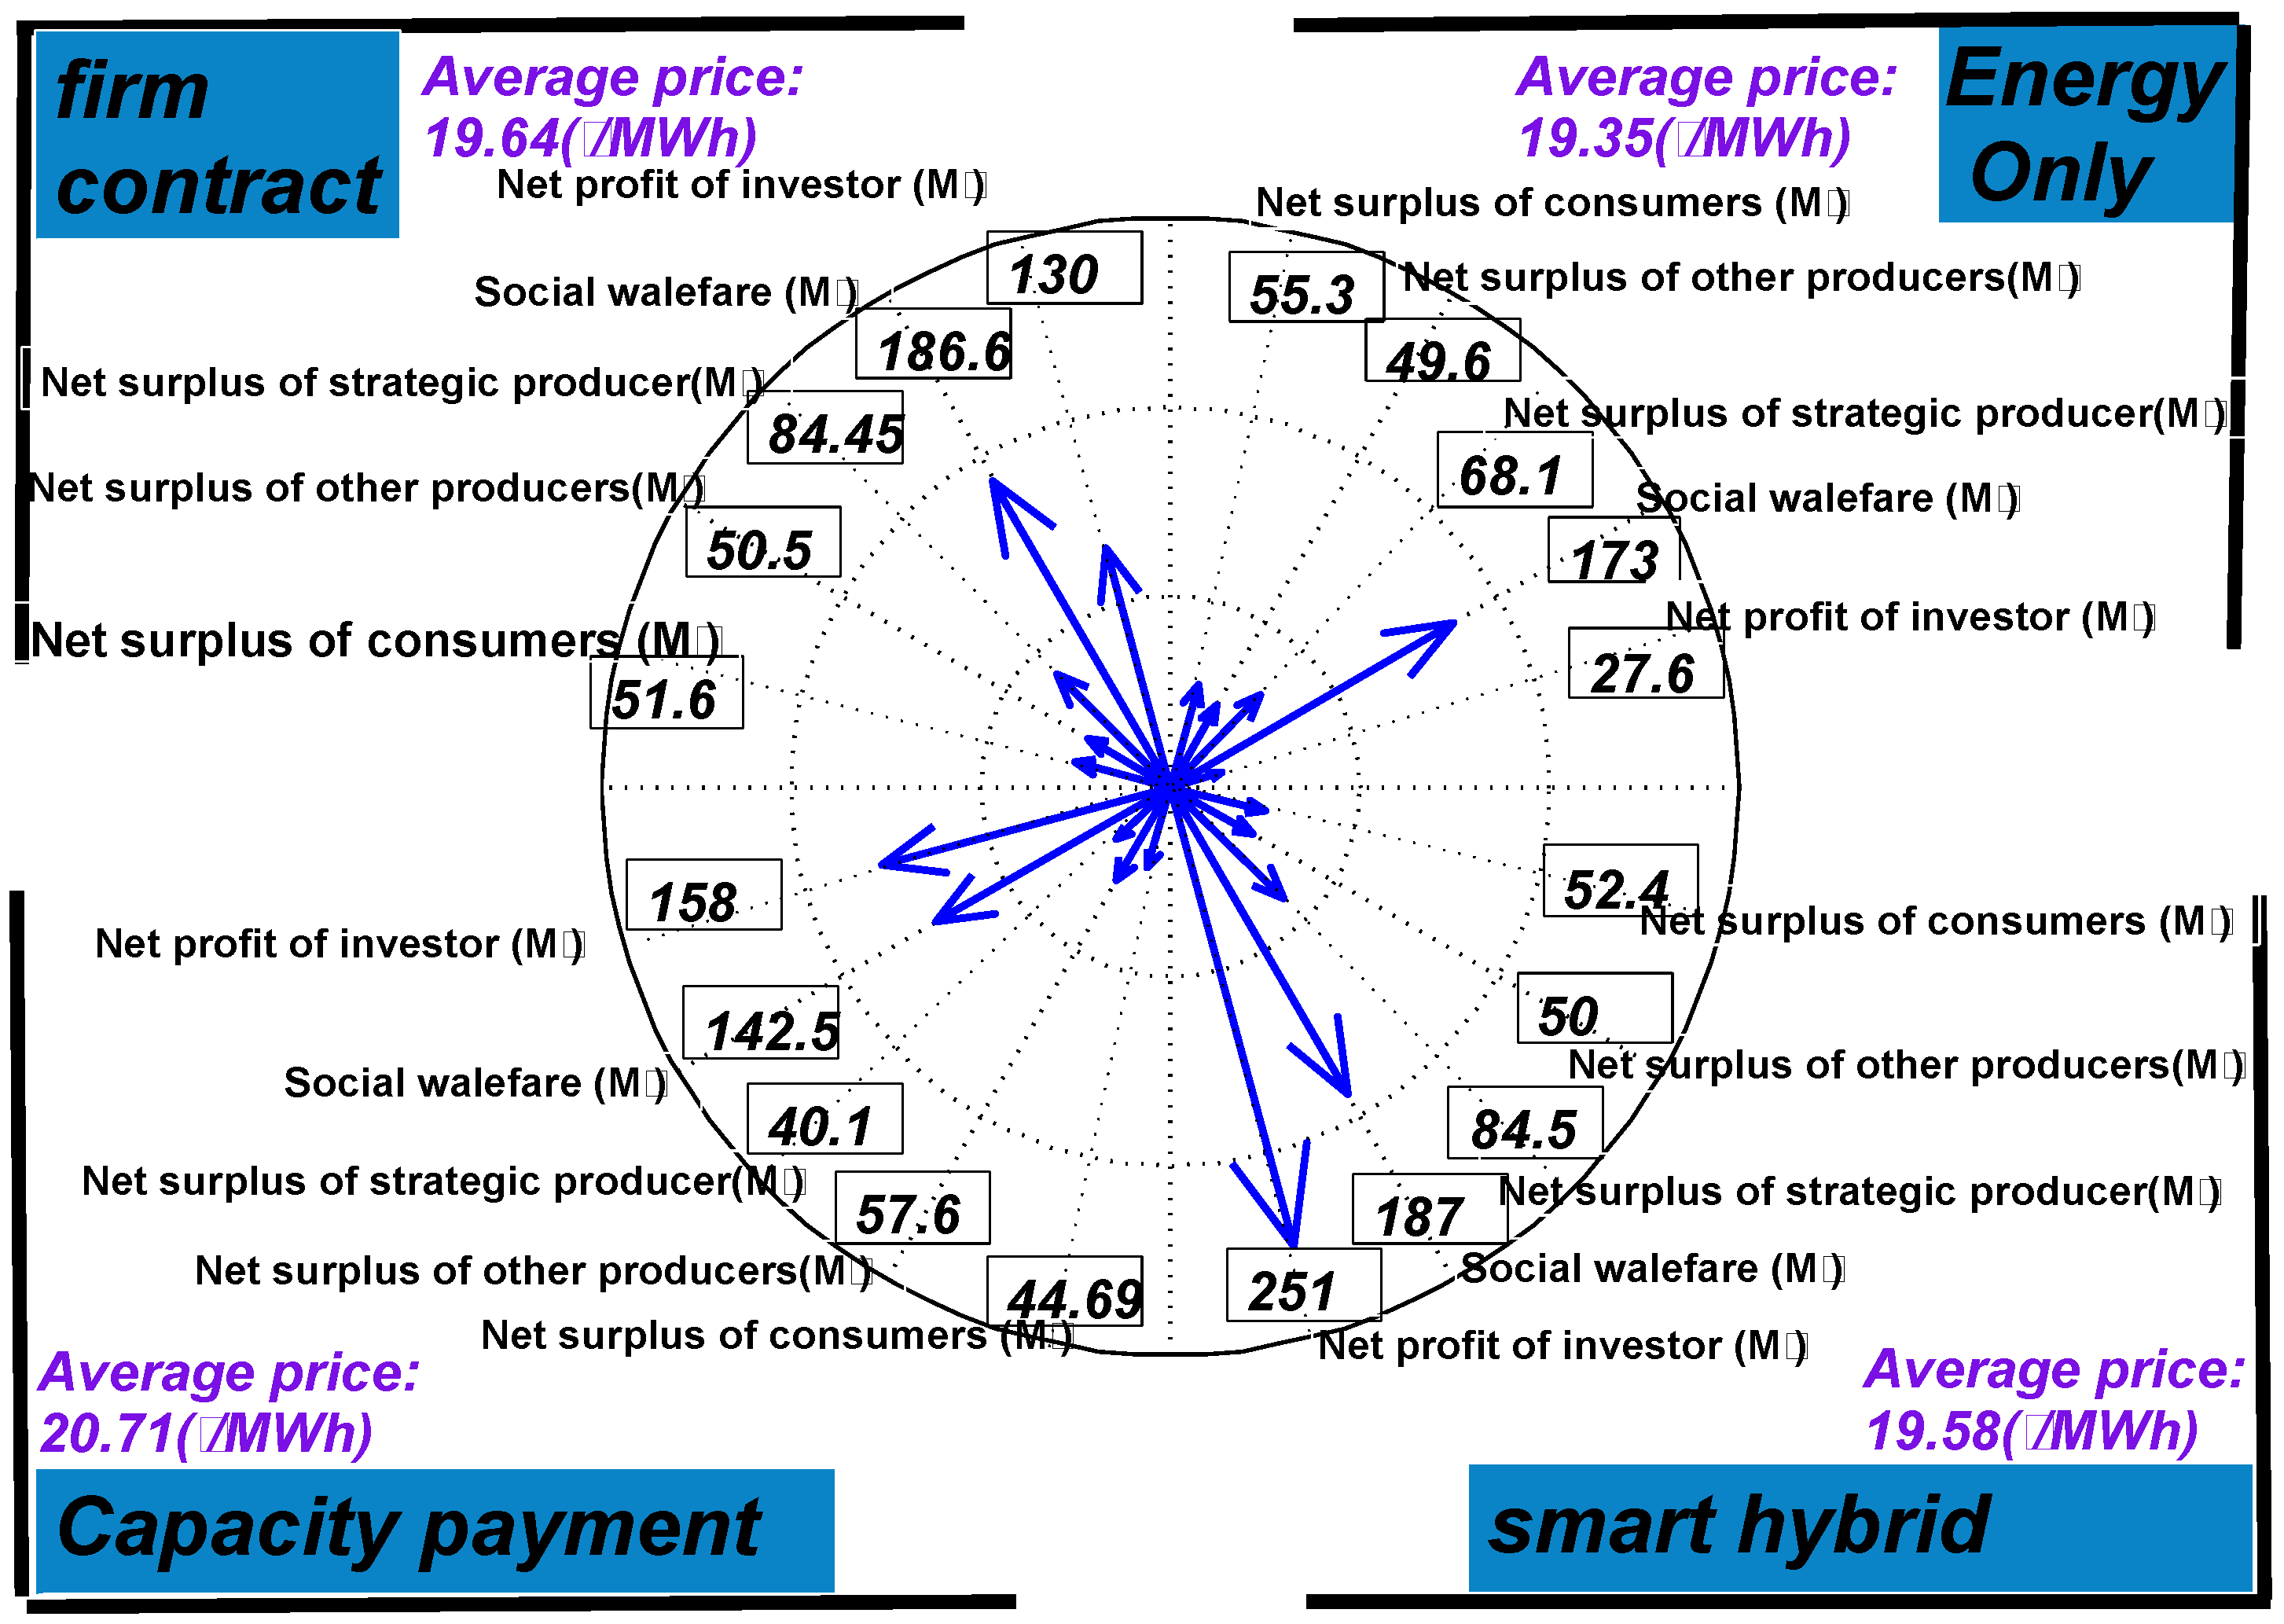
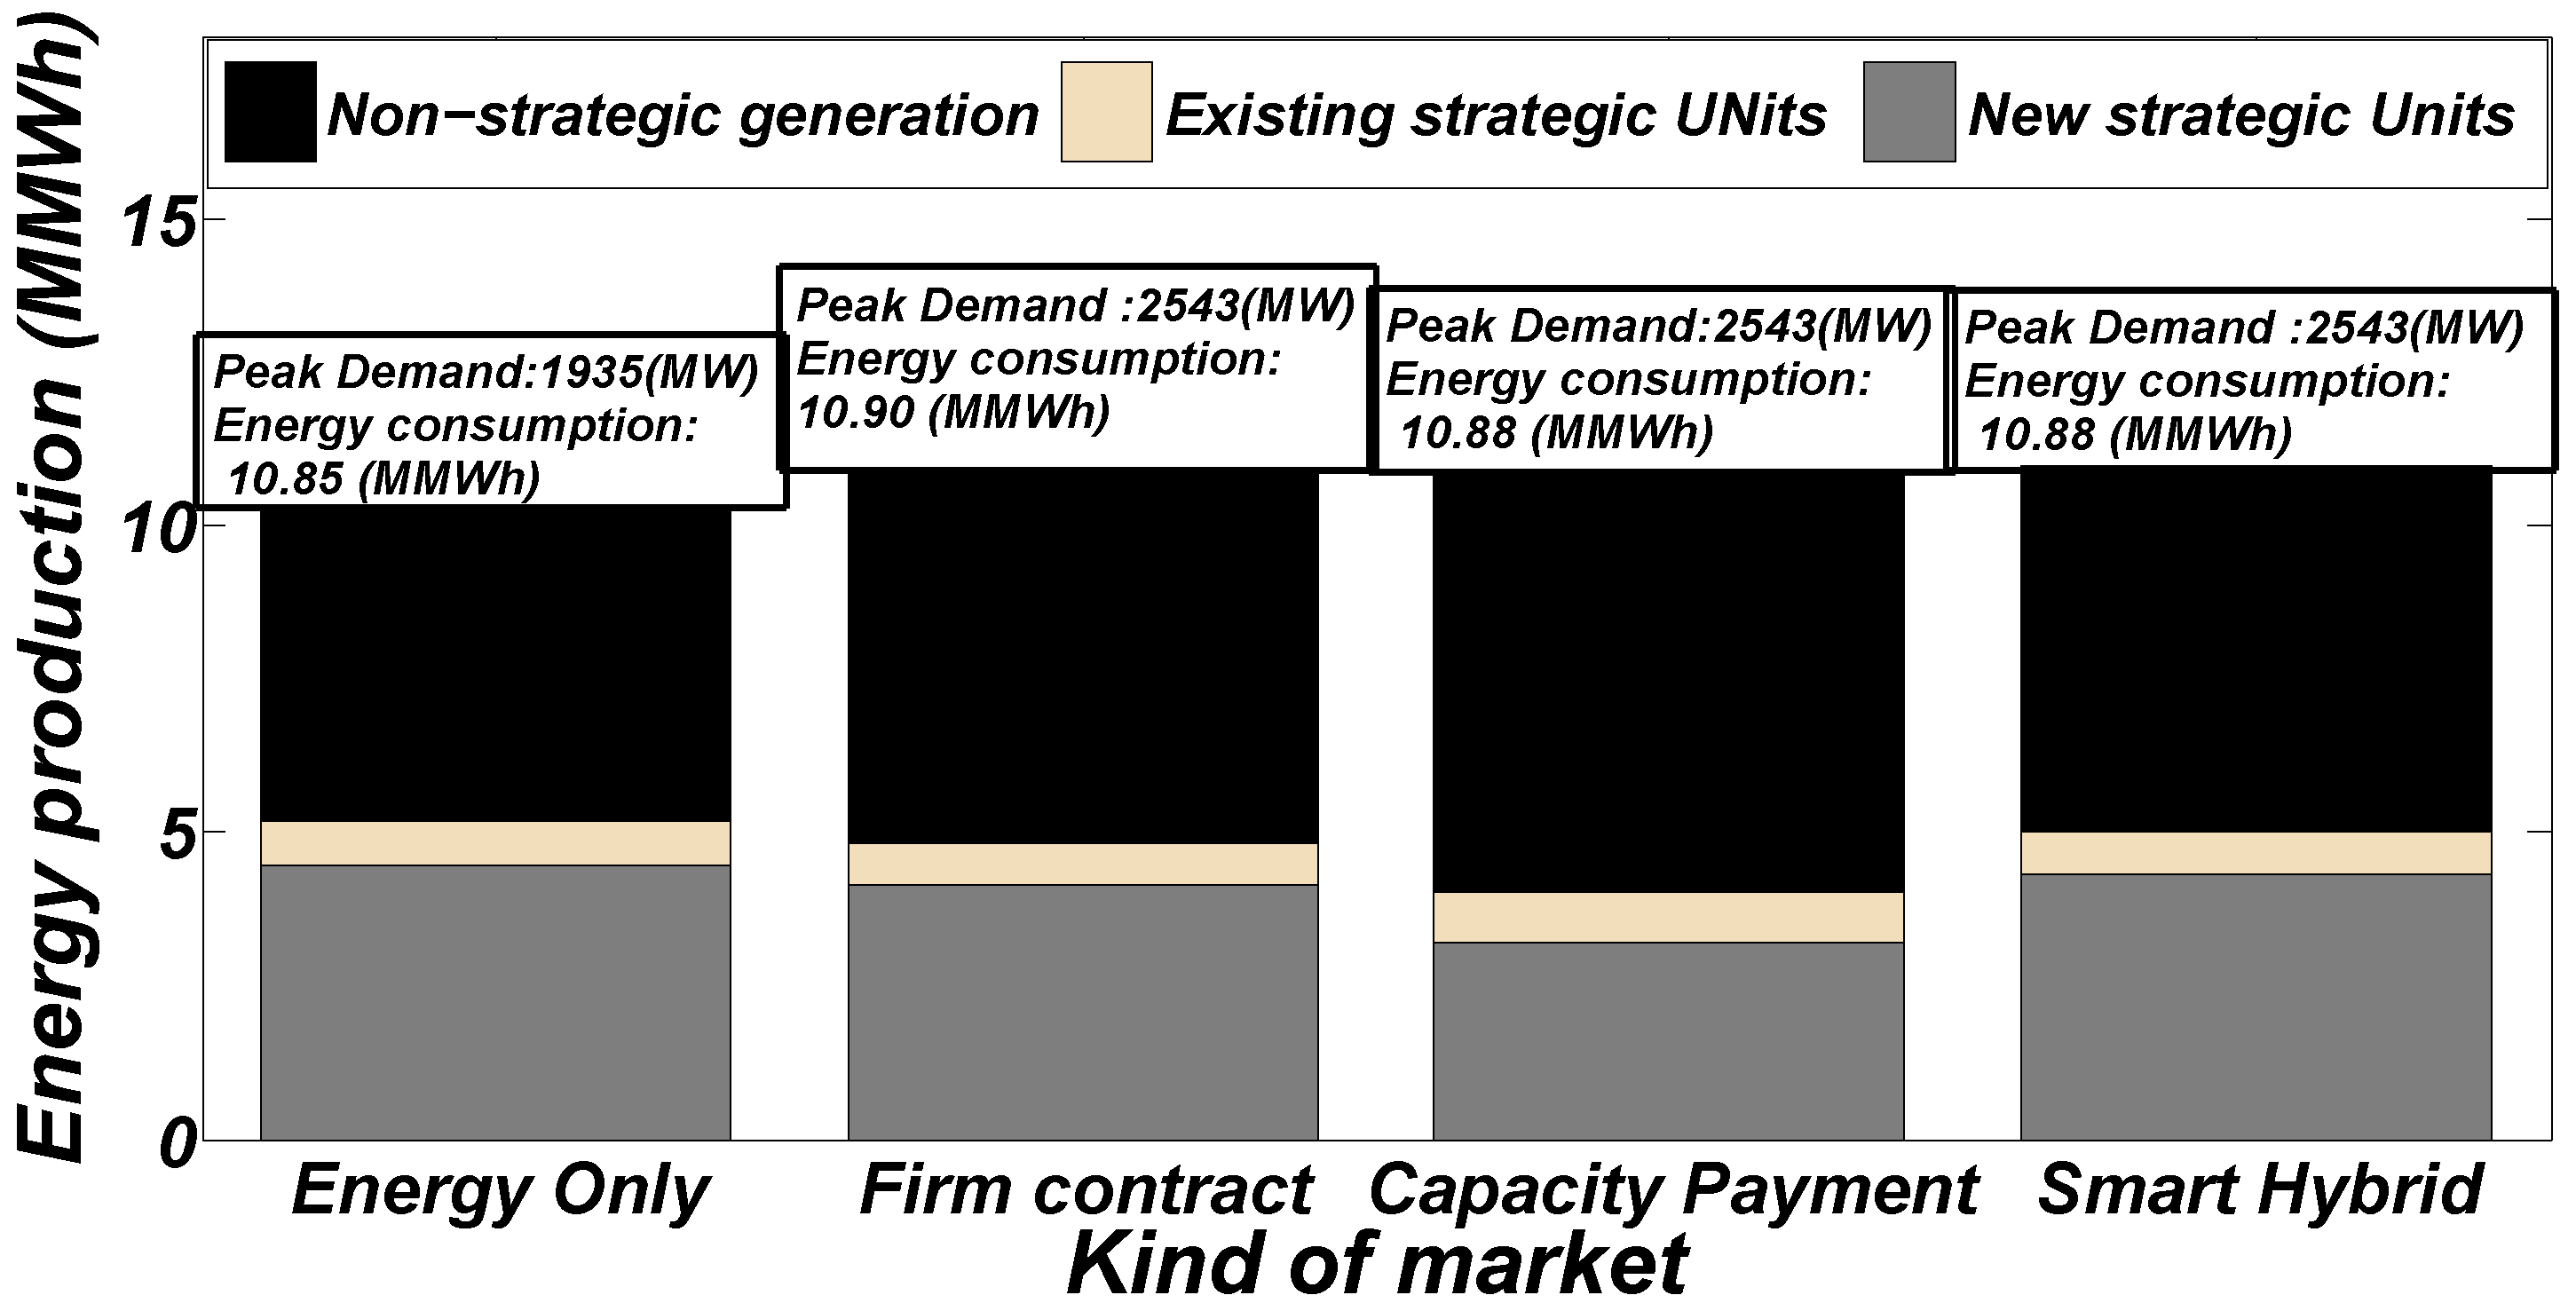
7.1.1. Energy Only Policy

In this policy, the total capacity added by the strategic producer in the planning horizon is equal to 700 MW (200 MW peak and 500 MW base technologies thresholds). In this case, 500 MW base technology is constructed by strategic producer at Bus 4 due to high energy consumption, and the absence of any generation unit. In addition, a 200 MW peak technology unit is constructed at Bus 5 because there is also a 20 MW unit with high operation cost at this bus, which is also distinctly located at the north area.
It is worth noting that the average energy market price is equal to 19.35 (€/MWh). In this case, the market-clearing price is affected by the type of generation units, transmission restrictions, localization of units/sub-units and the overall demand bid. The simulations show that the nodal prices are the same in northern and southern regions since transmission constraints are not overstepped in both regions followed from inter-regional transmission capacity that is less than the nominal value due to investments made in the southern region. Consequently, the price is the same in the entire network.
The profit of the investor (27.6 M€) consists of the expected profit obtained by selling energy of existing units and total profits associated with new units. In addition, the net surplus of consumers and the social welfare are equal to 55.3 M€ and 173 M€, respectively.

7.1.2. Firm Contract Policy

In this policy structure, the total profit of the investor is equal to 130 M€, which shows significantly an increasing trend with respect to the EO policy. In this case, the strategic producer has totally added 3300 MW over the planning period. All of the capacity constructions are peak technologies because of their lower investment costs than that of the base technologies. During the planning period, the investment in peak units leads to increasing in the overall market price due to the high cost of operation; consequently, the average market price in FC policy is increased by 1.50%. Therefore, the net surplus of the consumer is decreased by 6.69%. In addition, social welfare is increased by 7.86% compared to EO policy. This trend has the same effect on the net surplus of producers; however, in this case, the net surplus of producers is increased by 14.65% compared to the EO policy. It is worth noting that the strategic producer benefit is more than that of the rival producers in the FC policy since the net surplus of the strategic producer is increased by 24% so that that of the rival producers is increased by 1.81%. In addition, demand peak and energy consumption are also increased by 31.42% and 0.46%, respectively.
According to results of FC policy, the investment in base technologies is low, even at big contract volumes. Moreover, the energy produced by non-strategic producers is increased by 7.08% so that output of strategic units is decreased by 6.02% compared to the EO policy. Therefore, 56% of demands is successfully supplied by the non-strategic producers, where the rest of the demands can rely on the strategic producer.

7.1.3. Capacity Payment Policy

In this policy, the invested capacity by the strategic producer is equal to 3300 MW, all for the peak technology. Furthermore, the peak demand is increased by 31.42% compared to EO market design. In this case, the average market price is increased by 7.03% and 5.45%, respectively, compared to those of EO and FC policies. The social welfare and consumers surplus in CP in comparison with those of EO policy are decreased by 17.63% and 19.19%, respectively. Furthermore, in comparison with FC policy, the social welfare and consumers surplus are decreased by 23.63% and 13.39%, respectively. It is noted that social welfare depends on the demands, the market-clearing price and operation cost of units. As a result, the net surplus of producers is decreased by 16.99% in CP policy in comparison with the EO policy. This causes the net surplus of other producers to be increased by 16.13% while the net surplus of strategic producer is decreased by 41.11% in this case. The total profit of investor comprises four components: the expected profits obtained by the selling energy of existing units in the spot market, the capacity payments for maintaining production for the total capacity of the new units, maintaining productions for the total capacity of both the operational existing and new units. The simulations show that the energy produced by a non-strategic producer is increased by 13% compared to that of FC market design. In addition, the production of new strategic units compared to its total production is as much as 86% in FC policy, while this rate is limited to 79% in CP policy.

7.1.4. Smart Hybrid Market

In the hybrid market, construction of new units are increased by 3300 MW in the peak technology compared to the EO design. The average market price is decreased by 0.31% and 5.46% compared to FC and CP policies, respectively, because of different kinds of investment. However, the market price is increased by 1.19% compared to EO policy. In addition, the social welfare is increased by 8.09%, 31.22% and 0.21%, compared to EO, CP and FC markets, respectively. On the other hand, the total profit of investors is increased by 93.07% and 58.86% compared to FC and CP policies, respectively. The total profits is comprised by five terms that are the expected profit obtained by selling energy of existing units in the spot market, the expected profits of the strategic investor obtained by selling a pre-determined part of production in a firm contractual market, the expected profits obtained by the capacity payments for new units, the expected profits obtained by the capacity payments of the existing units and the cost of operation of new units. The total profit in the hybrid market is more than others so that the total profit of strategic producer in the hybrid market is 9, 1.59 and 1.93 times higher than those of EO, CP and FC markets, respectively. As a result, it can be concluded that the hybrid policy makes a strategic producer better off in the investment.
Figure 8 shows the total energy produced by units for different market design. Energy produced by the new strategic unit in CP, FC and H policies is decreased by 28.64%, 7.16% and 3.36% compared to EO designs, respectively. In addition, the energy produced by the new strategic units in FC and H markets are increased compared to the CP market. There is more interest in investing in peak technologies to benefit from investment incentives in all market designs, while the possibility of investment in base technology is very low. Energy produced by the existing strategic units is increased by 18.03% in CP policy compared to EO design. However, those of FC and H policies are decreased by 3.94% and 3.24% compared to EO policy, respectively. Energy produced by the non-strategic strategic units in CP, FC and H policies are increased by 22.26%, 7.08% and 5.43% compared to EO design, respectively.
The net surplus of non-strategic producers in the CP market are 16%, 14% and 15% more than those of EO, FC and H markets, respectively. As a result, it can be concluded that CP policy makes non-strategic better off in the long term. The net surplus of Consumers is considered as a measure of the effect of various designs of the market on consumer welfare. The net surplus of Consumers is 55.3 M€, 44.69 M€, 51.6 M€, and 52.4 M€ in the EO, CP, FC, and H designs, respectively. In terms of levelized value (present worth of consumer surplus divided by present worth of consumption), these equalled 5.09 €/MWh, 4.12 €/MWh, 4.73 €/MWh, and 4.82 €/MWh, respectively. As a result, EO policy makes consumers better off in the long term.
Table 1 shows the reliability indices of various markets. Network reliability depends on the number of invested units, their capacity and the energy consumption so that it is observed that investment incentives improve the reliability indices.

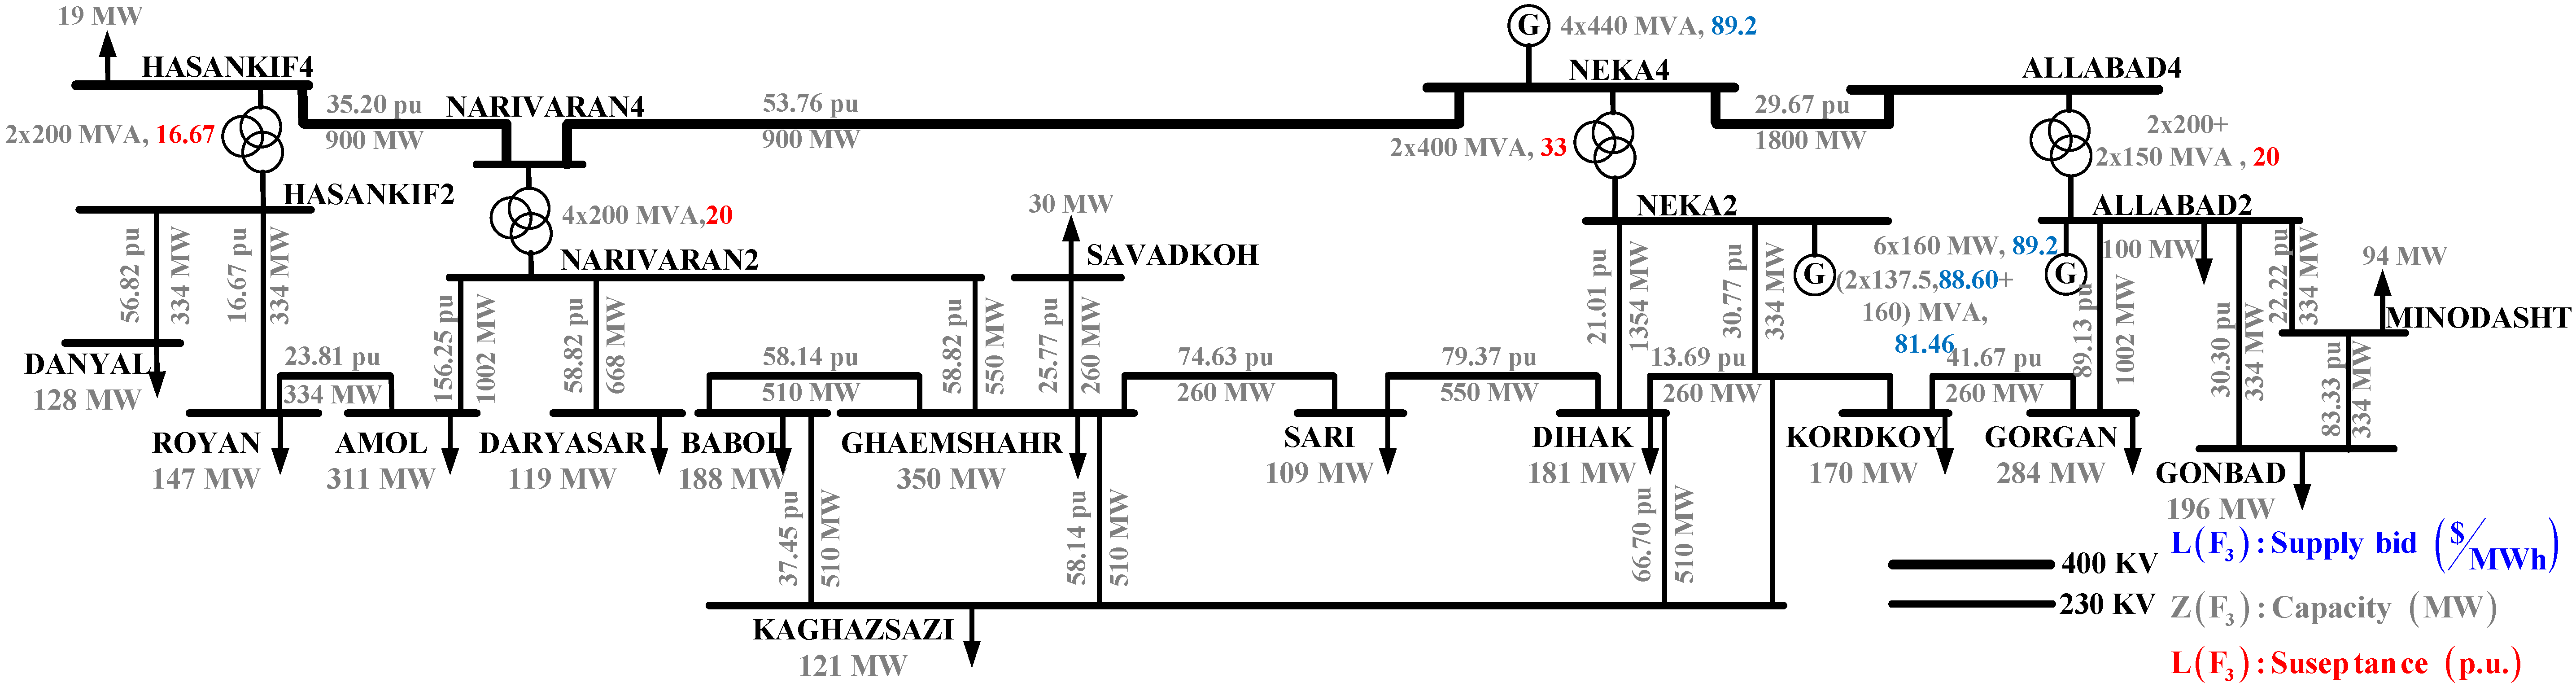
7.2. MREC Transmission Network

Single-line diagram of MREC transmission network is shown in Figure 9. The horizon year is specified with three different demand blocks, namely peak, shoulder and off-peak. The considered weighing factors associated with each demand blocks (peak, shoulder and off-peak) are assumed to be 20%, 50% and 30%, respectively. The price bids of the demands are 35.75, 28.721, and 27.357 (€/MWh) for peak, shoulder, and off-peak blocks, respectively. In the planning, the weighting factor of the off-peak and shoulder blocks is considered to be 25% and 60% of the associated forecasted peak demand. For the sake of simplicity, each demand considers one bid per block. The candidate buses for construction of the new units are assumed to be AMOL, KORDKOY, GORGAN, DARYASAR and MINODASHT, which have 230 kV voltage levels. It is assumed that the strategic GENCO has a total of 2195 MW as existing units, which are connected to busses NEKA4 and NEKA2, as indicated in Figure 9. Moreover, there is one non-strategic GENCO that has 960 MW installed capacity in total as existing units. The operation costs of the existing units are presented in Figure 10. Susceptance of the transmission lines in the base of 100 MVA. The available transmission capacity in MW and capacity of existing generation are shown in Figure 9. In addition, susceptances of existing transformers are given in this figure. The total capacity of existing units in the network is 3155 MW, where the shares of strategic and of non-strategic GENCOs are 69.6% and 31.4%, respectively. Two cases, namely elastic and inelastic demand, are simulated and analysed. The results of the above studies using Solver CPELX software GAMS are in Figure 10. Analysis of the results of the case studies is presented in the following.

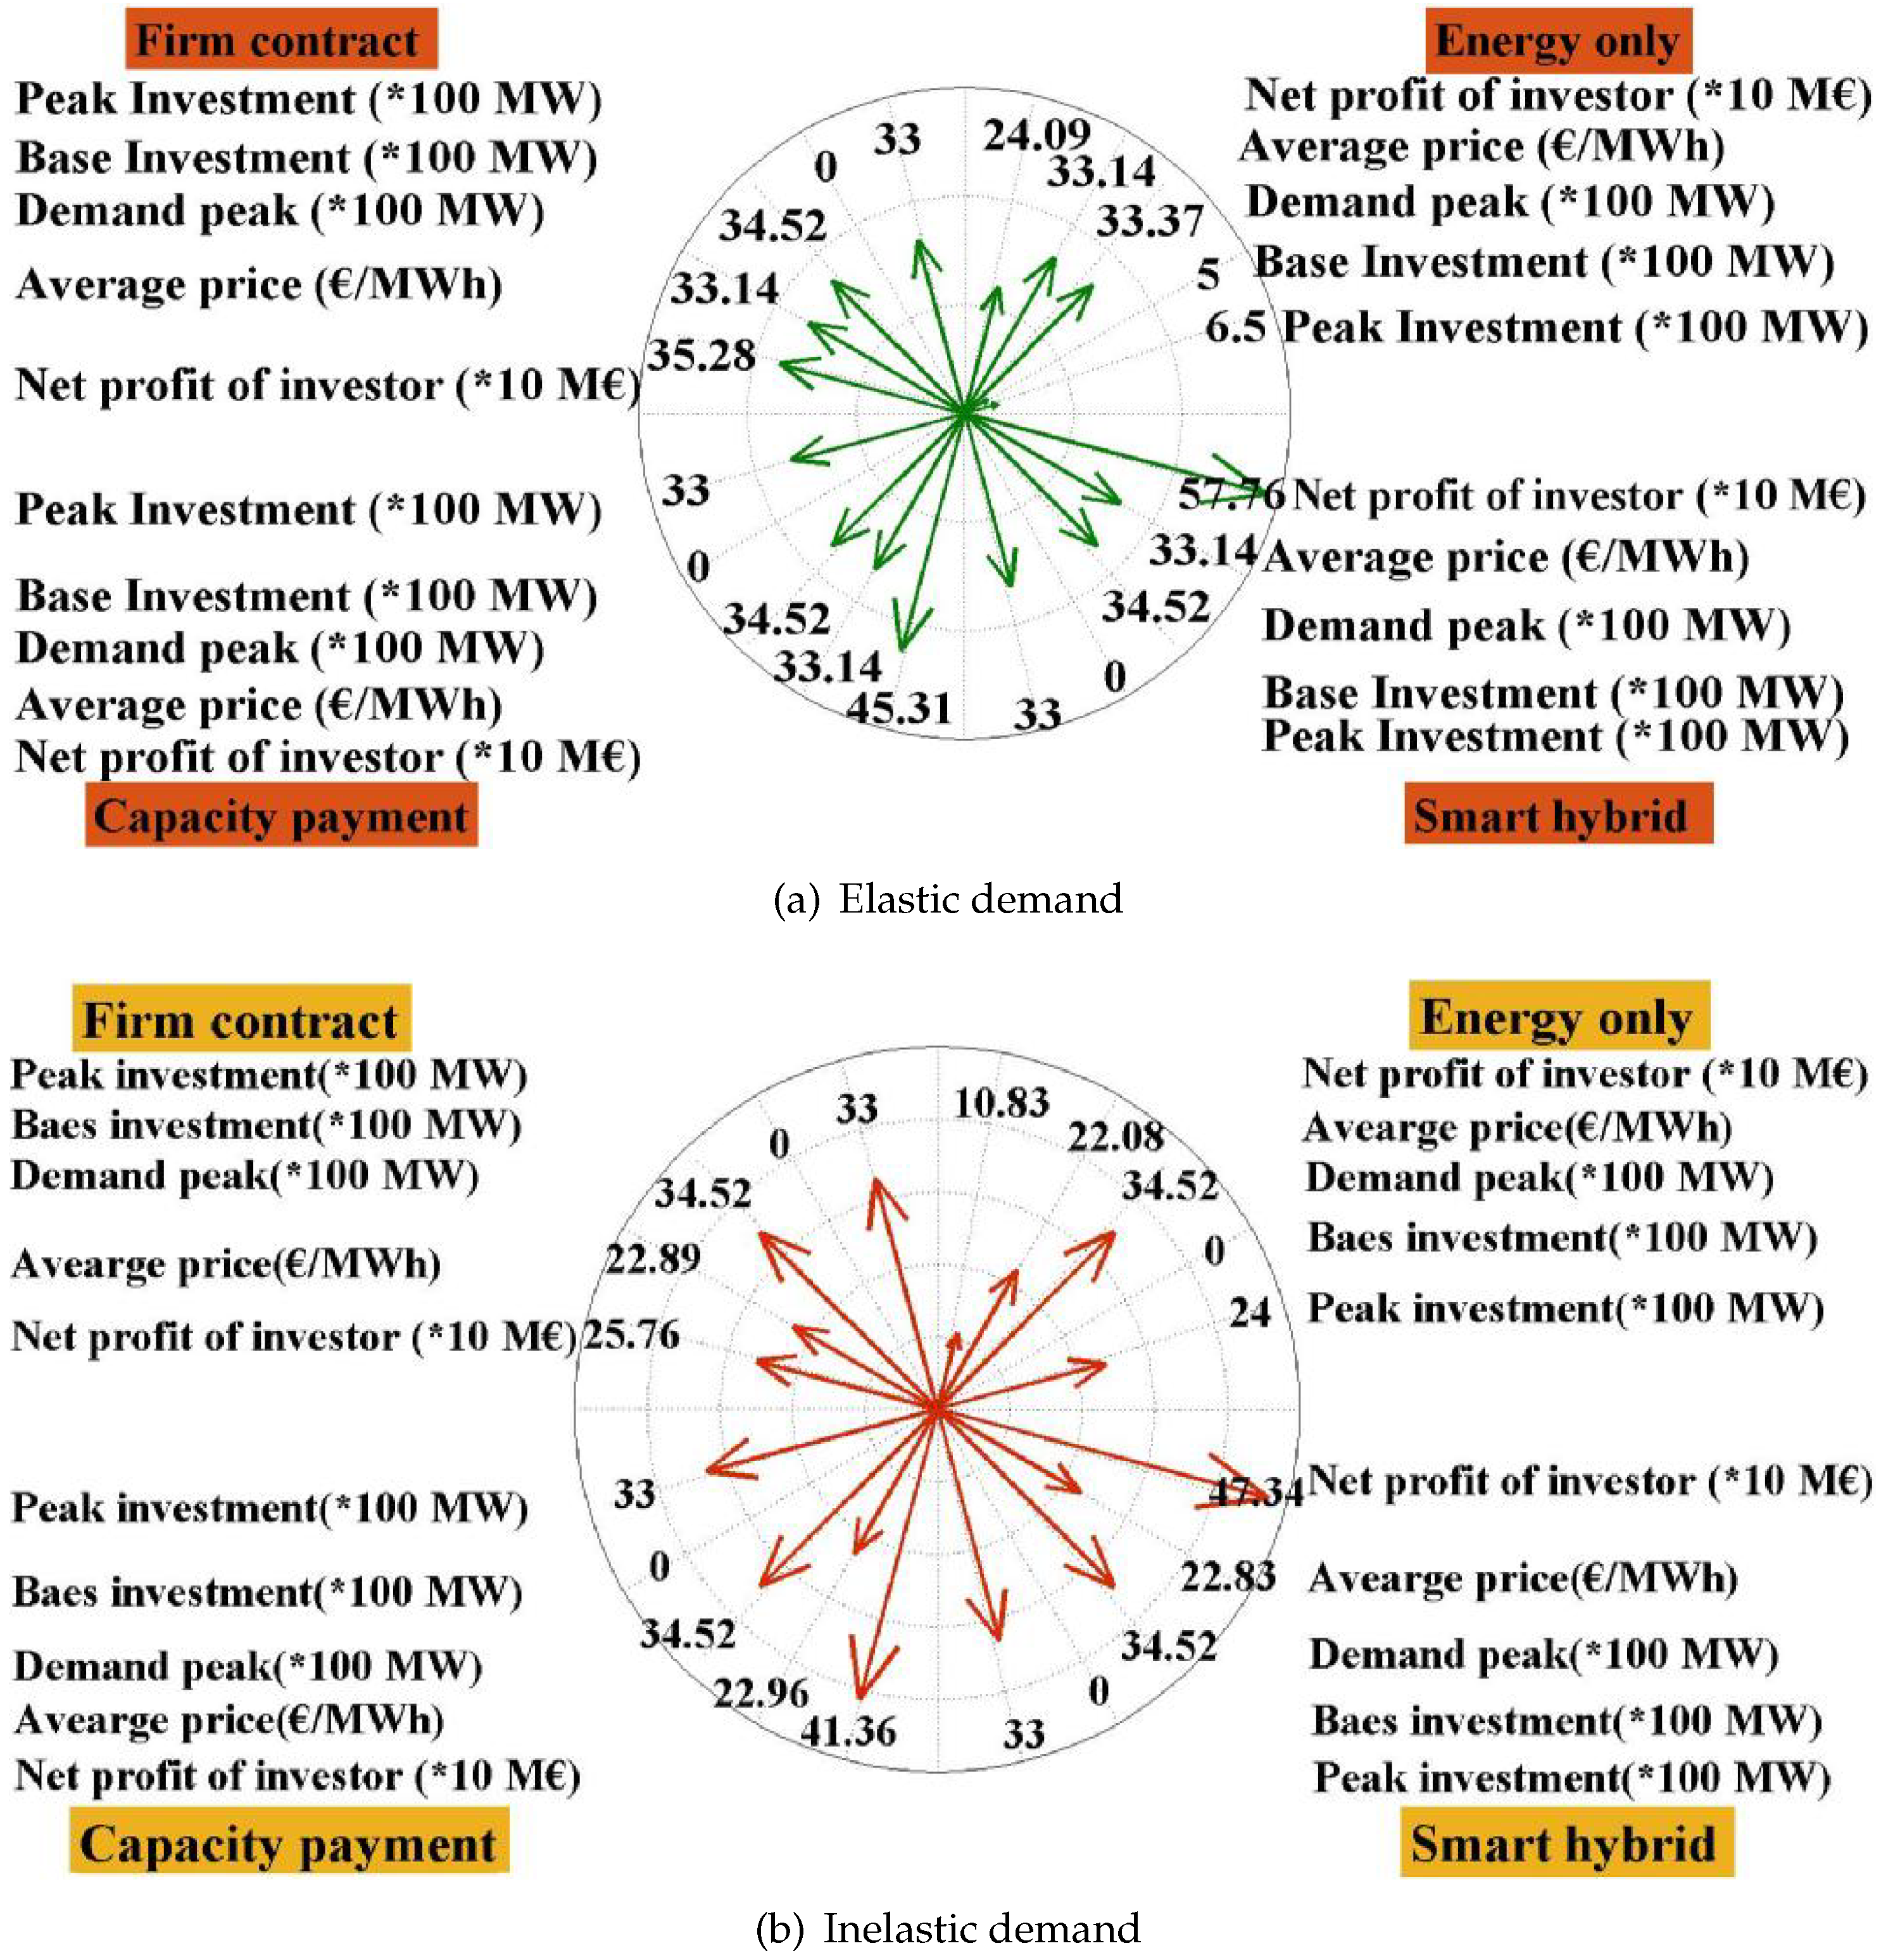
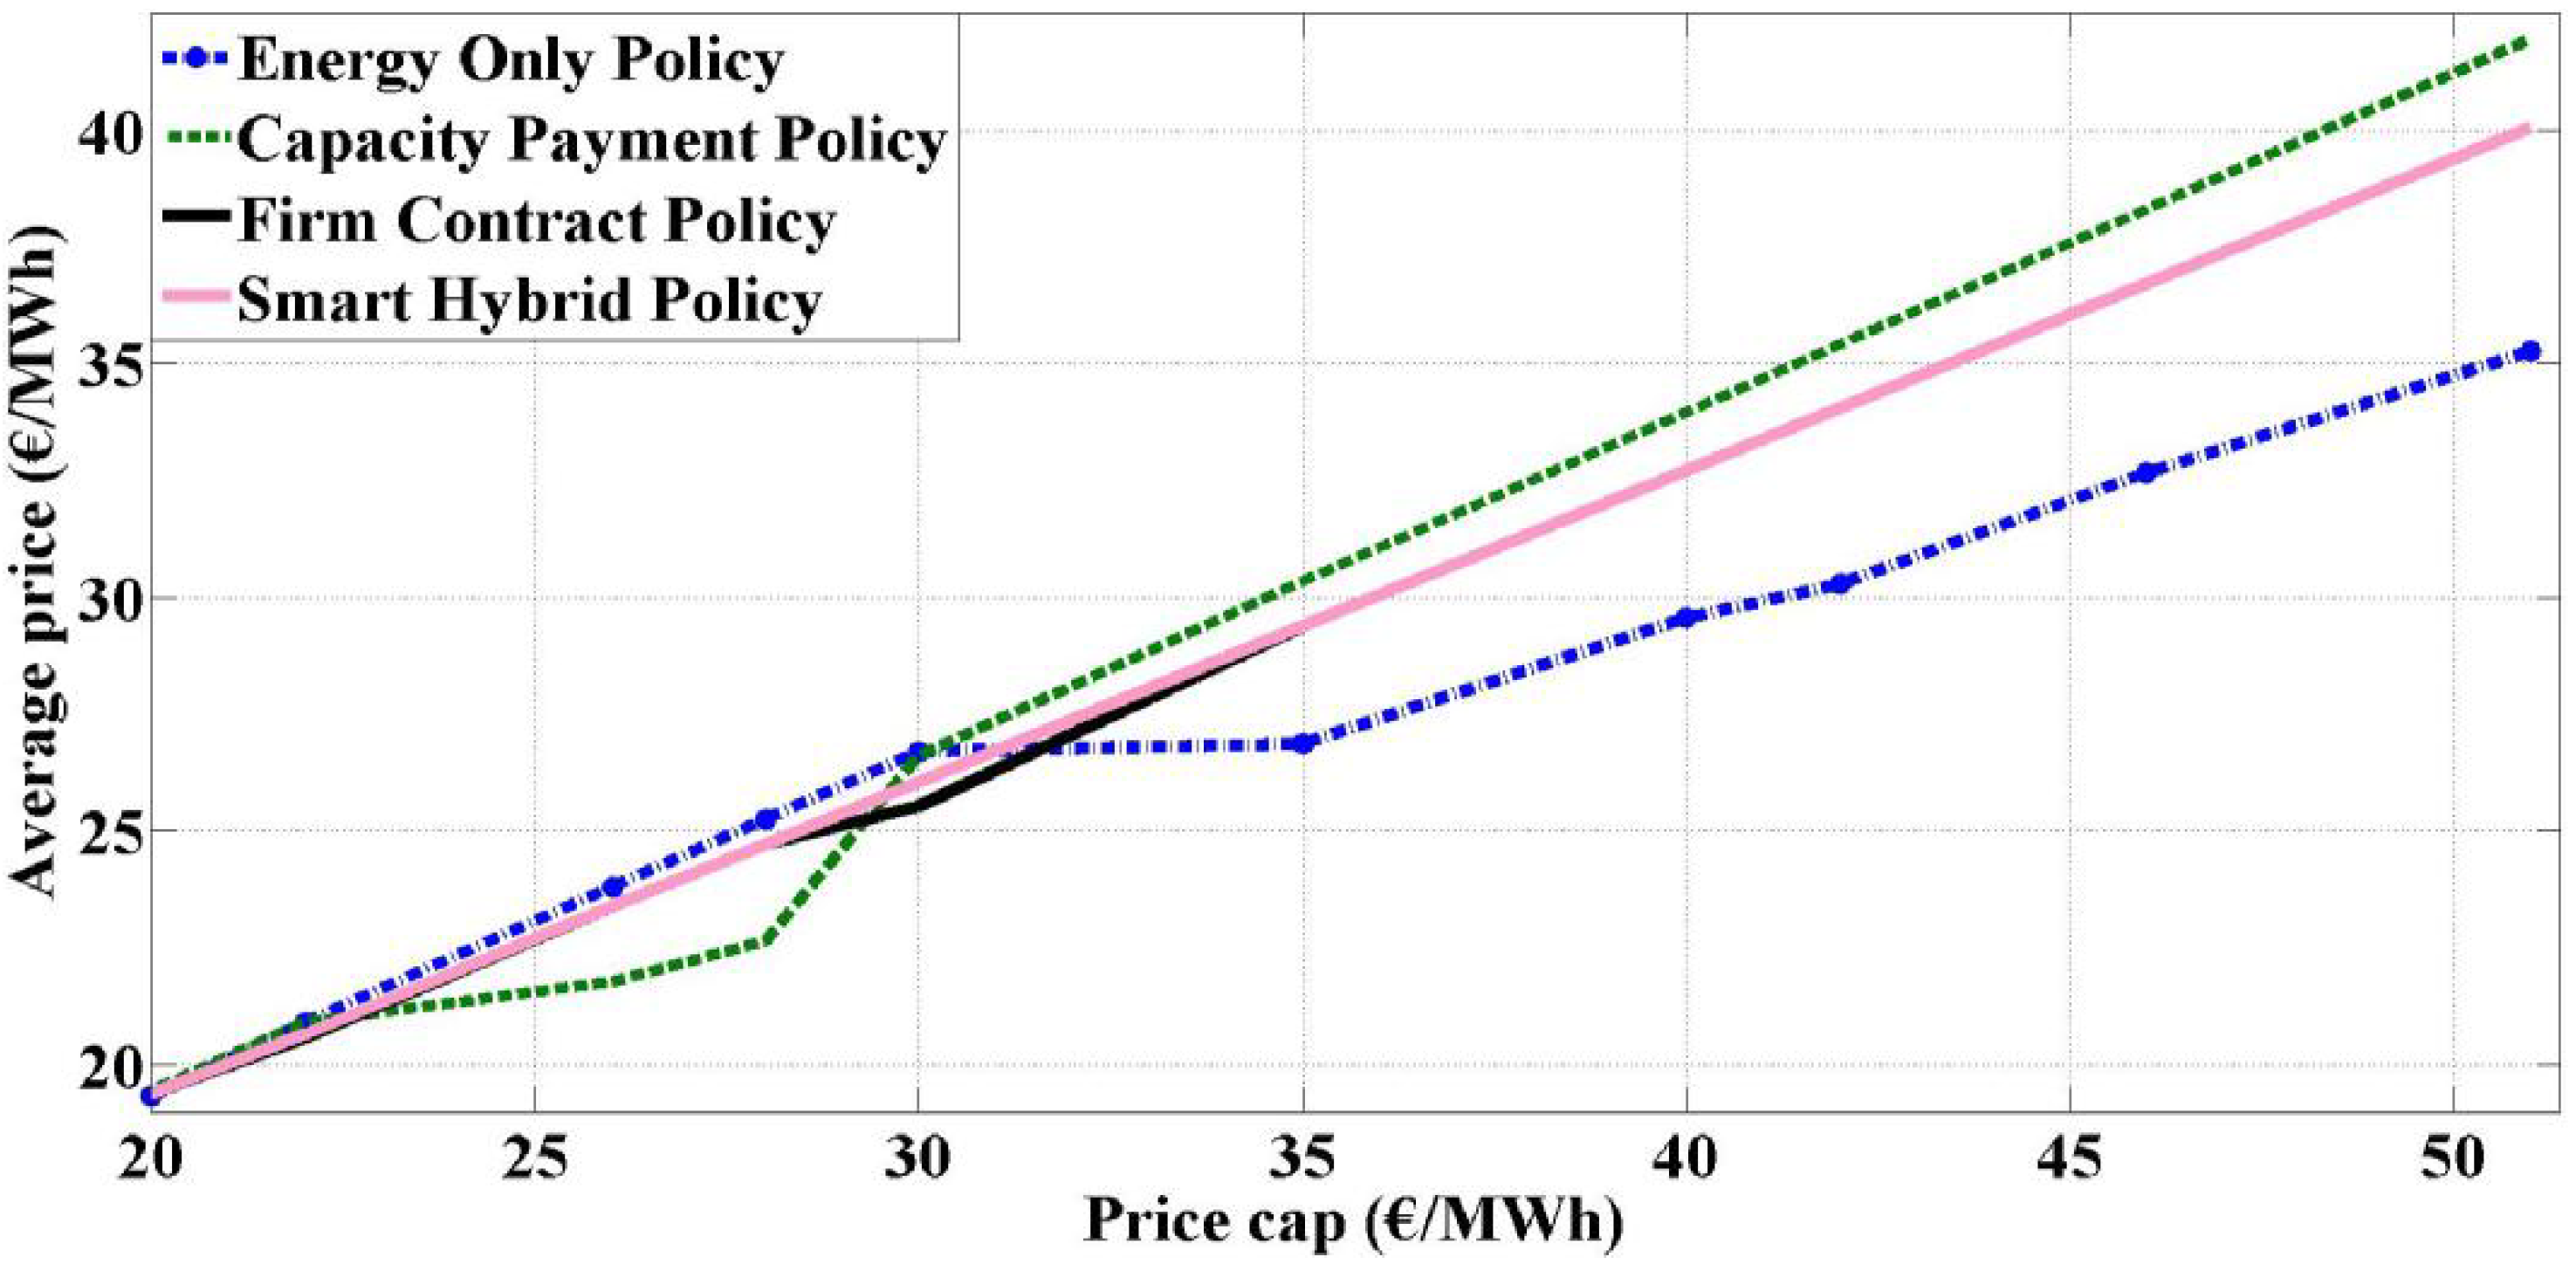
7.3. Analysis of Elastic Demands

7.3.1. Energy Only Policy

In the EO policy, the total capacity added by the strategic GENCO in the planning is equal to 1150 MW (650 MW peak technologies and 500 MW base technologies). The average market price over the planning is 33.14 (€/MWh). In addition to affecting investment decisions on the market price, the capacity additions have been reflected on the other economic measures, such as total profit. In this respect, the demand peak and the total profit of strategic GENCO are equal to 3337.167 (MW) and 240.9 (M€), respectively. Simulation results show that the average market prices of buses are different in the peak and shoulder duration because of the transmission constraints. In the off-peak period, the average market prices of the buses are the same because transmission constraints are not overstepped. In addition, under off-peak duration, units consisting second marginal costs are committed to supply consumers so that the offers of strategic GENCOs is equal to the operating costs of rival units (i.e., 18.6 (€/MWh)). The offers of strategic GENCO can decrease due to investing of rival GENCOs on peak unit having operating cost equal to 14.72 (€/MWh).

7.3.2. Firm Contract Policy

The total capacity constructed by the strategic GENCO in the planning is equal to 3300 MW all in peak technologies. The FC market design encourages investment in peak technologies, while base technologies are invested in the EO policy. Moreover, among peak technologies, the investor tends to construction of units having maximum capacity. Therefore, the peak unit is preferred to be constructed. It should be mentioned that this interest to build high-capacity units is constrained by available investment budget. The total profit of the strategic GENCO is increased by 46.45% compared to EO policy. The demand peak is increased by 3.45% compared to EO policy. The average market price in the FC policy is the same as that of the EO policy. Simulation results show that the strategic GENCO s offer may be decreased to the offer of rival units in the shoulder and especially in the off-peak duration.

7.3.3. Capacity Payment Policy

In this case, the strategic GENCO has totally constructed 3300 MW all in peak technologies in the planning horizon. Thus, CP design encourages investment in peak technologies. All of the capacity constructions are peak technologies because its investment cost is lower than than that of base technologies. Moreover, among peak technologies, the investor tends to construct units having maximum capacity. Therefore, the peak unit has been preferred to be constructed, which is also constrained by available investment budget. During the planning period, investment in peak units leads to an increase in the market price due to their high operation cost. The total profit of the strategic GENCO has been significantly increased compared to EO policy (i.e., 1.88 times higher than that of in the EO market). The demand peak has been increased by 3.45% compared to EO policy. The average market price in the CP policy is the same as those of the EO and FC policies.

7.3.4. Hybrid Policy

The total capacity constructed by the strategic GENCO in the planning horizon is equal to 3300 MW all in peak technologies. Thus, H design encourages investment on peak technologies. Moreover, among peak technologies, the investor tends to construction of units having maximum capacity. In this case, all budgets are used for the construction of new units. In the presence of investment incentives, 49.5 M€ were spent for construction of 3300 MW. It is noted that combinations of constructed capacity are different in various markets. The total profit of the strategic GENCO is increased by 140%, 27% and 64%, compared to the EO, CP and FC markets, respectively. The demand peak is increased by 3.45% with respect to EO policy. The average market price in the FC policy is the same as the EO policy. The strategic GENCO s offer may be decreased to offer of rival units in the shoulder and especially in the off-peak.

7.3.5. Analysis of Inelastic Demands

Figure 10b shows the results with the assumption of a price cap of 25 (€/MWh) for this case. The average market prices are equal to 22.08, 22.89, 22.96 and 22.84 (€/MWh) for EO, FC, CP and hybrid policies accordingly. The market-clearing prices in the presence of inelastic demands are lower than those in the presence of elastic demands. Figure 11 shows the market-clearing price as a function of changing in the price cap. Offers of the strategic GENCO have been equal to price cap, especially in peak duration when the price cap is increased; consequently, the market price is increased. However, in off-peak, offer of strategic GENCO is less than that of non-strategic GENCO, i.e., operating costs of non-strategic GENCO. Therefore, the average market price increases when the price cap is increased in peak and shoulder duration. The total profit of the strategic GENCO is equal to 108.34, 257.68, 413.656 and 473.424 (M€) for EO, FC, CP and hybrid policies. It is observed that the total profit of the strategic GENCO in the presence of inelastic demands is lower than the case of elastic demands. Therefore, the price cap can affect the willingness to invest, net profit and net surplus of demands.

8. Conclusions

A novel bi-level framework was presented to study impacts of investment incentives on GEP in restructured power systems under uncertainty from the perspective of the price maker GENCO for both elastic and inelastic demands. Investment incentives are capacity payment and firm contract. In this paper, a new emerging concept of smart hybrid energy markets including both capacity payment and firm contract is introduced. In this model, supply function and different scenarios have been used for spot markets and investment of non-strategic GENCOs, respectively. Two case studies have been considered and analyzed in detail. The features of the proposed model and the simulations carried out allow for deriving the following conclusions:
The investment incentives including the markets CP, FC and smart hybrid increase the willingness to invest, the total profit of investor and energy consumption in comparison with EO policy. In addition, investment incentives encourage investment in peak technologies. All budgets are used for constructing new units in the CP, FC and smart hybrid market. However, the composition of investment options is different in CP, FC and hybrid design. The investor tends to construction of units having larger capacities which have constrained investment budgets. The energy produced by new strategic units in FC and smart hybrid markets increases compared to CP policy. In addition, the smart hybrid policy improves system reliability as well as other incentives. The total profit in the smart hybrid market is more than the other market designs. In all designs with the inelastic demand, the willingness to invest in new units and the total profit has been influenced by the price cap and total profit of the strategic GENCO is second to elastic demands.

Author Contributions

All authors worked on this manuscript together and all authors have read and approved the final manuscript.

Funding

J.P.S.C. acknowledges the support by FEDER funds through COMPETE 2020 and by Portuguese funds through FCT, under Projects SAICT-PAC/0004/2015—POCI-01-0145-FEDER-016434, POCI-01-0145-FEDER-006961, UID/EEA/50014/2013, UID/CEC/50021/2013, UID/EMS/00151/2013, and 02/SAICT/2017 - POCI-01-0145-FEDER-029803.

Conflicts of Interest

The authors declare no conflict of interest.

Nomenclature

Indices
w/w index for scenario
tindex for demand blocks
a/e//oindex for new/existing//generation unit of strategic GENCO/other GENCOs
jindex for demand
hindex for size of investment option
n/mindex for bus
Acronyms
FCV/FCPfirm contract volume/price
CPPcapacity payment price
WDBweight of demand block t
WSWweight of scenario w in demand block t
IBtotal budget of strategic GENCO for investment
ICthannual investment cost of new generating unit (€/MW)
OIthoption h for investment capacity of new unit a (MW)
G ¯ eu / G ¯ NS Capacity of existing /generation unit e/j
of strategic GENCO/non-strategic GENCOs (MW)
MC SE /MC SN //MC NS marginal cost of new/existing//generation unit
of strategic GENCO//non-strategic GENCOs (€/MWh)
D ¯ maximum load of demand j in block t (MW)
UDprice bid of demand k in demand block t and scenario w (€/MW)
SLsusceptance of line n-m (p.u.)
PF ¯ Transmission capacity of line n-m (MW)
F . O . R SN / F . O . R SE forced outage rate of new/existing unit
Decision   variables
DPower consumed by demand d in demand block t and scenario w (MW)
AONVoltage angle of bus n in demand block t and scenario w
G ¯ SN capacity investment of new unit a (MW)
G SN /G SE // G NS Power produced of new/existing//generation unit a/e//o strategic GENCO//by
non-strategic GENCOs, in demand block t and scenario w (MW)
OI SNb binary variable that is equal to 1 if the hth
investment option of technology a is selected, otherwise it is equal to 0
OG SN / OG SE // OG NS price offer of new/existing//generation unit of strategic GENCO//non-strategic
GENCOs (€/MWh), in demand block t and scenario w

References

  1. Meneguzzo, F.; Rosaria, C.; Lorenzo, A.; Mario, P. The remarkable impact of renewable energy generation in Sicily onto electricity price formation in Italy. Energy Sci. Eng. 2016, 4, 194–204. [Google Scholar] [CrossRef] [Green Version]
  2. Albanese, L.; Rosaria, R.; Ciriminna, F.; Meneguzzo, P.; Pagliaro, M. The impact of electric vehicles on the power market. Energy Sci. Eng. 2015, 4, 300–309. [Google Scholar] [CrossRef]
  3. Nowak, J.W.; Sarkani, S.; Mazzuchi, T.A. Risk Assessment for a National Renewable Energy Target Part I: Developing the Model. IEEE Syst. J. 2015, 9, 1045–1056. [Google Scholar] [CrossRef]
  4. Wu, J.; Wu, Z.; Wu, F.; Mao, X. A power balancing method of distributed generation and electric vehicle charging for minimizing operation cost of distribution systems with uncertainties. Energy Sci. Eng. 2017, 5, 167–179. [Google Scholar] [CrossRef] [Green Version]
  5. Shivaie, M.; Ameli, M.T. Risk-constrained multi-level framework for coordination of generation and transmission expansion planning in liberalised environments- part I: Theory and formulation. IET Gener. Transm. Distrib. 2016, 10, 3183–3197. [Google Scholar] [CrossRef]
  6. Wang, J.; Yang, S.; Jiang, C.; Zhang, Y.; Lund, P.D. Status and future strategies for Concentrating Solar Power in China. Energy Sci. Eng. 2017, 5, 100–109. [Google Scholar] [CrossRef] [Green Version]
  7. Valinejad, J.; Oladi, Z.; Barforoushi, T.; Parvania, M. Stochastic unit commitment in the presence of demand response program under uncertainties. IJE Trans. B Appl. 2017, 30, 1134–1143. [Google Scholar]
  8. Luo, F.; Zhang, T.; Wei, W.; Li, F.; Bai, L.; Tan, C.W.; Liu, Y.; Liu, G. Models and methods for low-carbon footprint analysis of Models and methods for low-carbon footprint analysis of grid-connected photovoltaic generation from a distribution network planning perspective. Energy Sci. Eng. 2017, 5, 290–301. [Google Scholar] [CrossRef]
  9. Zhou, L.; Xu, C.; Xu, G.; Bai, P.Y. Exergy analysis and economic evaluation of the steam superheat utilization using regenerative turbine in ultra-supercritical power plants under design/off-design conditions. Energy Sci. Eng. 2017, 5, 156–166. [Google Scholar] [Green Version]
  10. Marzband, M.; Fouladfar, M.H.; Akorede, M.F.; Lightbody, G.; Pouresmaeil, E. Framework for smart transactive energy in home-microgrids considering coalition formation and demand side management. Sustain. Cities Soc. 2018, 40, 136–154. [Google Scholar] [CrossRef]
  11. Najafi Ravadanegh, S.; Jahanyari, N.; Amini, A.; Taghizadeghan, N. Smart distribution grid multistage expansion planning under load forecasting uncertainty. IET Gener. Transm. Distrib. 2016, 10, 1136–1144. [Google Scholar] [CrossRef]
  12. Gouin, V.; Alvarez-Hérault, M.-C.; Raison, B. Innovative planning method for the construction of electrical distribution network master plans. Sustain. Energy Grids Netw. 2016, 10, 84–91. [Google Scholar] [CrossRef]
  13. Warmann, E.C.; Atwater, H.A. Energy production advantage of independent subcell connection for multijunction photovoltaics. Energy Sci. Eng. 2016, 4, 235–244. [Google Scholar] [CrossRef]
  14. Kagiannas, A.G.; Askounis, D.T.; Psarras, J. Power generation planning: a survey from monopoly to competition. Int. J. Electr. Power Energy Syst. 2004, 26, 413–421. [Google Scholar] [CrossRef]
  15. Vivadinar, Y.; Purwanto, W.W.; Saputra, A.H. Tracing the energy footprints of Indonesian manufacturing industry. Energy Sci. Eng. 2016, 4, 394–405. [Google Scholar] [CrossRef] [Green Version]
  16. Valinejad, J.; Marzband, M.; Akorede, M.F.; Barforoshi, T.; Jovanović, M. Generation expansion planning in electricity market considering uncertainty in load demand and presence of strategic GENCOs. Energy Sci. Eng. 2017, 152, 92–104. [Google Scholar] [CrossRef]
  17. Tavakoli, M.; Shokridehaki, F.; Akorede, M.F.; Marzband, M.; Vechiu, I.; Pouresmaeil, E. CVaR-based energy management scheme for optimal resilience and operational cost in commercial building microgrids. Int. J. Electr. Power Energy Syst. 2018, 100, 1–9. [Google Scholar] [CrossRef]
  18. Wilson, A.L.; Dent, C.J.; Goldstein, M. Quantifying uncertainty in wholesale electricity price projections using Bayesian emulation of a generation investment model. Sustain. Energy Grids Netw. 2017, 13, 42–55. [Google Scholar] [CrossRef]
  19. Káberger, T. Energy science during industrial transformation. Energy Sci. Eng. 2015, 3, 1–10. [Google Scholar] [CrossRef]
  20. Mavalizadeh, H.; Ahmadi, A.; Heidari, A. Probabilistic multi-objective generation and transmission expansion planning problem using normal boundary intersection. IET Gener. Transm. Distrib. 2015, 9, 560–570. [Google Scholar] [CrossRef]
  21. Guerra, G.; Martinez-Velasco, J.A. Optimum allocation of distributed generation in multi-feeder systems using long term evaluation and assuming voltage-dependent loads. Sustain. Energy Grids Netw. 2016, 5, 13–26. [Google Scholar] [CrossRef] [Green Version]
  22. Xing, H.; Cheng, H.; Zhang, Y.; Zeng, P. Active distribution network expansion planning integrating dispersed energy storage systems. IET Gener. Transm. Distrib. 2016, 10, 638–644. [Google Scholar] [CrossRef]
  23. Tavakoli, M.; Shokridehaki, F.; Marzband, M.; Godina, R.; Pouresmaeil, E. A two stage hierarchical control approach for the optimal energy management in commercial building microgrids based on local wind power and PEVs. Sustain. Cities Soc. 2018, 41, 332–340. [Google Scholar] [CrossRef]
  24. Thomsen, J.; Hussein, N.S.; Senkpiel, C.; Hartmann, A.; Schlegl, T. An optimized energy system planning and operation on distribution grid level—The Decentralized Market Agent as a novel approach. Sustain. Energy Grids Netw. 2016, 12, 40–56. [Google Scholar] [CrossRef]
  25. Macedo, L.H.; Montes, C.V.; Franco, J.F.; Rider, M.J.; Romero, R. MILP branch flow model for concurrent AC multistage transmission expansion and reactive power planning with security constraints. IET Gener. Transm. Distrib. 2016, 10, 3023–3032. [Google Scholar] [CrossRef]
  26. Marzband, M.; Javadi, M.; Pourmousavi, S.A.; Lightbody, G. An advanced retail electricity market for active distribution systems and home microgrid interoperability based on game theory. Electr. Power Syst. Res. 2018, 157, 187–199. [Google Scholar] [CrossRef]
  27. Höschle, H.; Le Cadre, H.; Belmans, R. Inefficiencies caused by non-harmonized capacity mechanisms in an interconnected electricity market. Sustain. Energy Grids Netw. 2018, 13, 29–41. [Google Scholar] [CrossRef] [Green Version]
  28. Cui, H.; Li, F.; Fang, X.; Chen, H.; Wang, H. Bilevel Arbitrage Potential Evaluation for Grid-Scale Energy Storage Considering Wind Power and LMP Smoothing Effect. IEEE Trans. Sustain. Energy 2018, 9, 707–718. [Google Scholar] [CrossRef]
  29. Cui, H.; Li, F.; Fang, X.; Hu, Q.; Bai, L.; Fang, X. Day-ahead coordinated operation of utility-scale electricity and natural gas networks considering demand response based virtual power plants. Appl. Energy 2016, 176, 183–195. [Google Scholar] [CrossRef] [Green Version]
  30. Murphy, F.H.; Smeers, Y. Generation capacity expansion in imperfectly competitive restructured electricity markets. Oper. Res. 2005, 53, 646–661. [Google Scholar] [CrossRef]
  31. Botterud, A.; Ilic, M.D.; Wangensteen, I. Optimal investments in power generation under centralized and decentralized decision making. IEEE Trans. Power Syst. 2005, 20, 254–263. [Google Scholar] [CrossRef]
  32. Barforoushi, T.; Moghaddam, M.P.; Javidi, M.H.; Sheikh-El-Eslami, M.K. Evaluation of Regulatory Impacts on Dynamic Behavior of Investments in Electricity Markets: A New Hybrid DP/GAME Framework. IEEE Trans. Power Syst. 2010, 25, 1978–1986. [Google Scholar] [CrossRef]
  33. Wogrin, S.; Barquin, J.; Centeno, E. Capacity Expansion Equilibria in Liberalized Electricity Markets: An EPEC Approach. IEEE Trans. Power Syst. 2013, 28, 1531–1539. [Google Scholar] [CrossRef]
  34. Kaymaz, P.; Valenzuela, J.; Park, C.S. Transmission Congestion and Competition on Power Generation Expansion. IEEE Trans. Power Syst. 2007, 22, 156–163. [Google Scholar] [CrossRef]
  35. Valinejad, J.; Marzband, M.; Busawona, K.; Kyyrä, J.; Pouresmaeil, E. Investigating Wind Generation Investment Indices in Multi-Stage Planning. In Proceedings of the 5th International Symposium on Environment Friendly Energies and Applications (EFEA), Rome, Italy, 24–26 September 2018. [Google Scholar]
  36. Jalal Kazempour, S.; Conejo, A.J.; Ruiz, C. Strategic Generation Investment Using a Complementarity Approach. IEEE Trans. Power Syst. 2010, 26, 940–948. [Google Scholar] [CrossRef]
  37. Valinejad, J.; Barforoushi, T. Generation expansion planning in electricity markets: A novel framework based on dynamic stochastic MPEC. Int. J. Electr. Power Energy Syst. 2015, 70, 108–117. [Google Scholar] [CrossRef]
  38. Xu, M.; Wilson, A.; Dent, C.J. Calibration and sensitivity analysis of long-term generation investment models using Bayesian emulation. Sustain. Energy Grids Netw. 2015, 5, 58–69. [Google Scholar] [CrossRef] [Green Version]
  39. Valinejad, J.; Marzband, M.; Barforoushi, T.; Kyyrä, J.; Pouresmaeil, E. Dynamic stochastic EPEC model for Competition of Dominant Producers in Generation Expansion Planning. In Proceedings of the 5th International Symposium on Environment Friendly Energies and Applications (EFEA), Rome, Italy, 24–26 September 2018. [Google Scholar]
  40. Jalal Kazempour, S.; Conejo, A.J. Strategic Generation Investment Under Uncertainty via Benders Decomposition. IEEE Trans. Power Syst. 2015, 27, 424–432. [Google Scholar] [CrossRef]
  41. Wogrin, S.; Centeno, E.; Barquán, J. Generation Capacity Expansion Analysis: Open Loop Approximation of Closed Loop Equilibria. IEEE Trans. Power Syst. 2013, 28, 3362–3371. [Google Scholar] [CrossRef]
  42. Facchinei, F.; Pang, J.-S. Finite-Dimensional Variational Inequalities and Complementarity Problems. IEEE Trans. Power Syst. 2003, 28, 3362–3371. [Google Scholar]
  43. Brooke, D.; Kendrick, A.; Meeraus, R.; Raman, R. GAMS: A User’s Guide; GAMS Development Corporation: Washington, DC, USA, 1998. [Google Scholar]
  44. Facchinei, F.; Pang, J.-S. A bi-level robust optimization model to determine retail electricity price in presence of a significant number of invisible solar sites. Sustain. Energy Grids Netw. 2017, 28, 3362–3371. [Google Scholar]
  45. Hobbs, B.F.; Metzler, C.B.; Pang, J.S. Strategic gaming analysis for electric power systems: An MPEC approach. IEEE Trans. Power Syst. 2000, 15, 638–645. [Google Scholar] [CrossRef]
  46. Fortuny-Amat, J.; McCarl, B. A Representation and Economic Interpretation of a Two-Level Programming Problem. J. Oper. Res. Soc. 1981, 32, 783–792. [Google Scholar] [CrossRef]
Figure 1. The algorithm for solving the proposed idea.
Applsci 08 01978 g001
Figure 2. The conversion of the bi-level optimization solution to a single-level.
Applsci 08 01978 g002
Figure 3. The emulation structure of four different basic levels scenarios proposed for investment by non-strategic GENCOs.
Applsci 08 01978 g003
Figure 4. Relationship between the different levels and variables related to each level.
Applsci 08 01978 g004
Figure 5. Parameters of energy generation expansion planning.
Applsci 08 01978 g005
Figure 6. Strategic producer investments’ comparisons in each localized test voltage/power bus.
Applsci 08 01978 g006
Figure 7. Parameters of energy generation expansion planning.
Applsci 08 01978 g007
Figure 8. Total energy produced by units in different market designs.
Applsci 08 01978 g008
Figure 9. Single-line diagram of the MAZANDARAN Regional Electric Company (MREC) transmission network.
Applsci 08 01978 g009
Figure 10. Results of generation expansion planning for MERC with (a) inelastic (b) elastic demand.
Applsci 08 01978 g010
Figure 11. Market-clearing price as a function of price cap.
Applsci 08 01978 g011
Table 1. Reliability indices of six-bus system.
Kind of MarketLOLP%LOLE (day/year)LOEE (MMWh)
Energy only4.2415.490.066643
Firm contract0.002860.01050.0000420
Capacity payment0.001690.00620.0000316
Hybrid0.00210.00770.0000796

