An Integrated Object Tracking and Covert Visual MIMO Communication Service for Museum Security System Using Single Vision Sensor


Abstract
:Featured Application
Abstract

1. Introduction
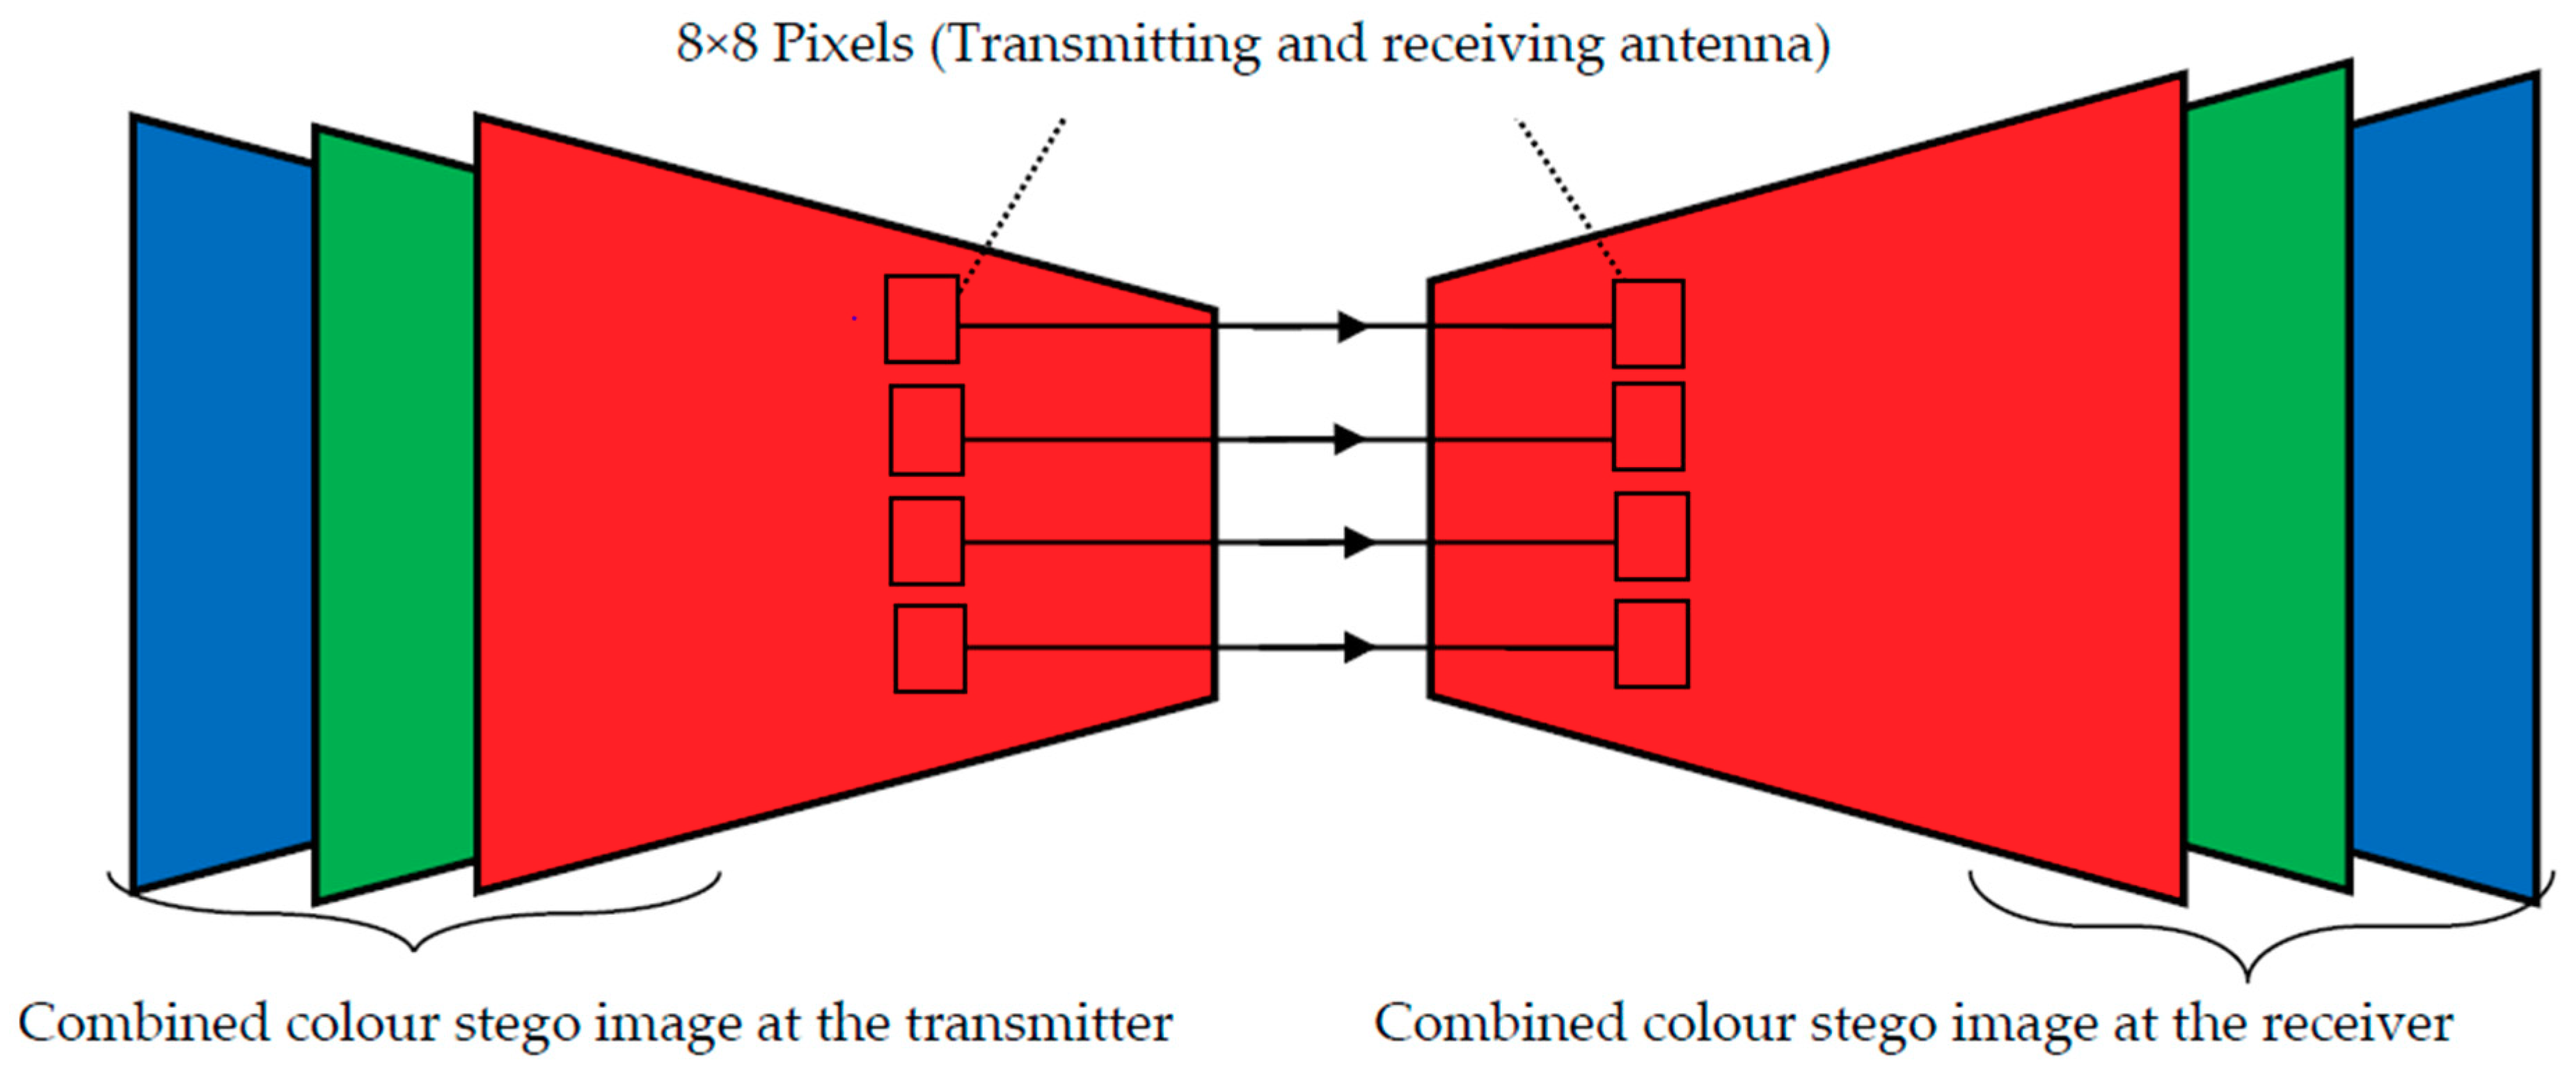
2. System Model
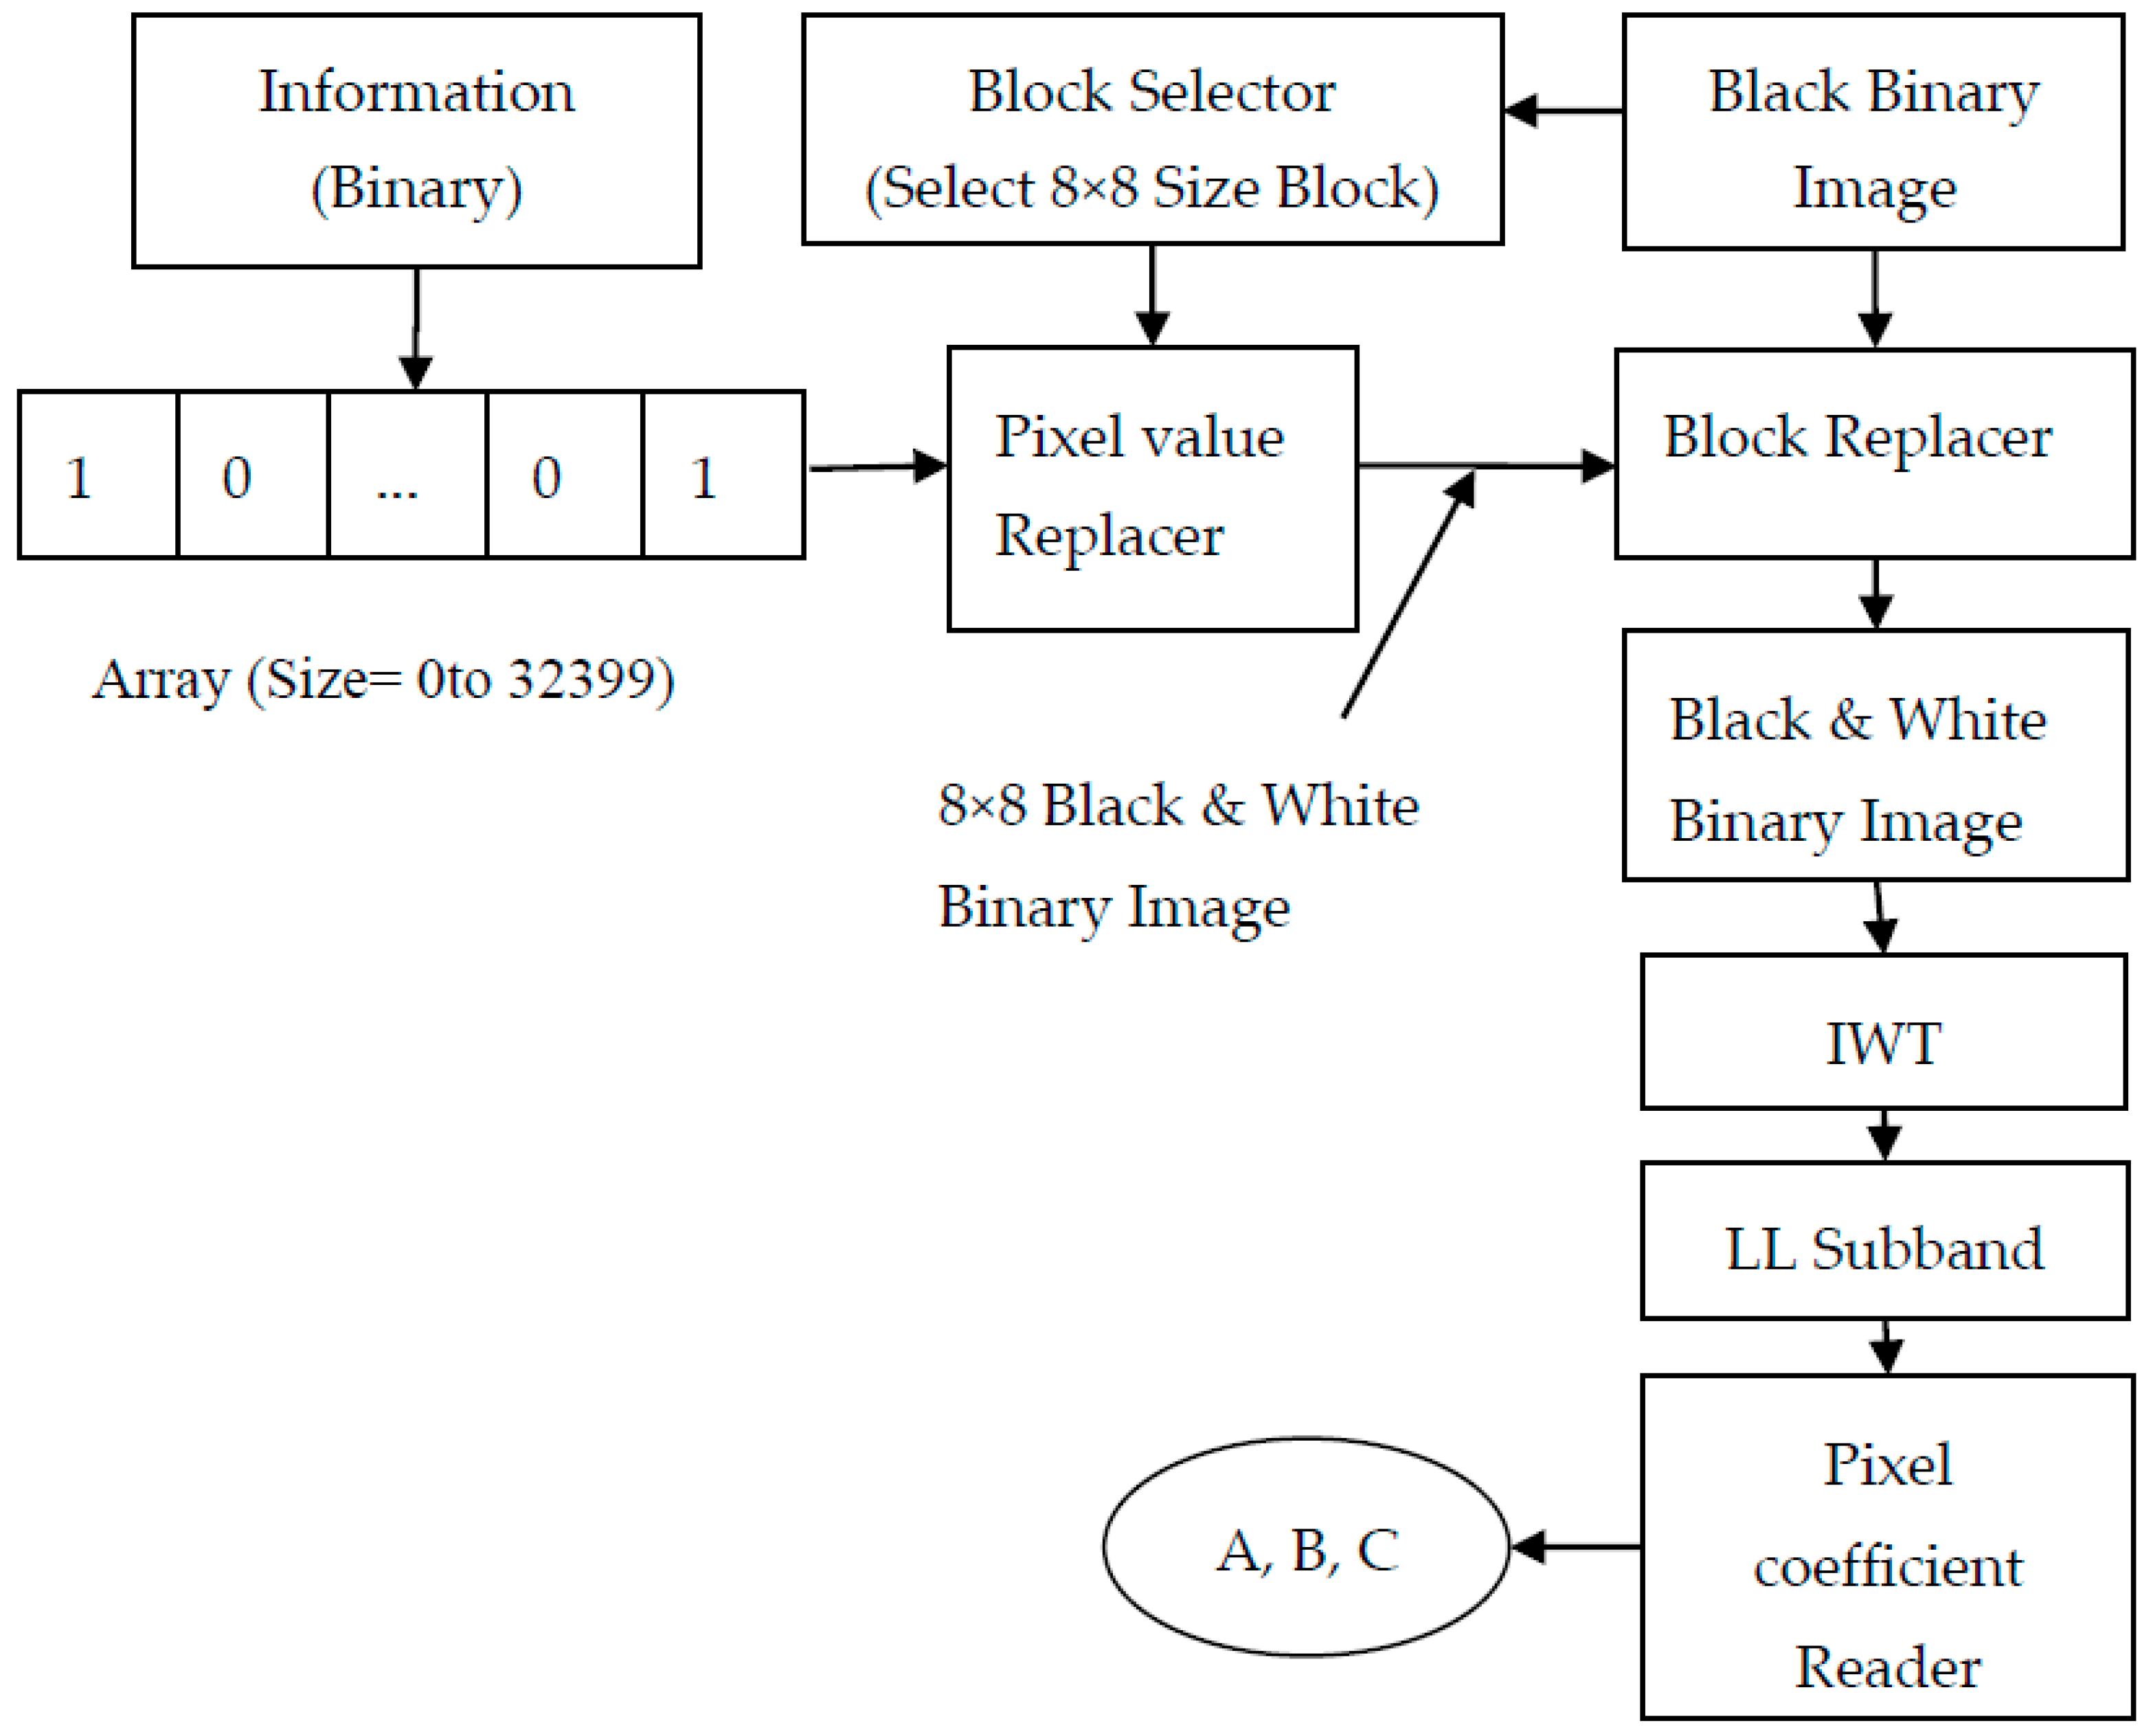
2.1. Data Image Creation
- Step 1: Create a binary image of size 1920 × 1080 by assigning ‘0’ value to all the pixels. This obtained image is called a black binary Image.
- Step 2: The black binary image is divided into 8 × 8 blocks.
- Step 3: Select the first 8 × 8 block (containing 64 pixels).
- Step 4: If the incoming data bit is ‘1’, replace all 64-pixel values in that block by ‘1’. Otherwise, the pixel values in that block are unchanged.
- Step 5: Select the next block in the same row and repeat Step 3 for that block. If the previous block is the last block in that row, then the next block is the first block in next row.
- Step 6: Repeat Step 4 until every 8 × 8 block in the black binary image is modified based on the incoming binary data bit stream.
- Step 7: This process generates a black and white binary data image.
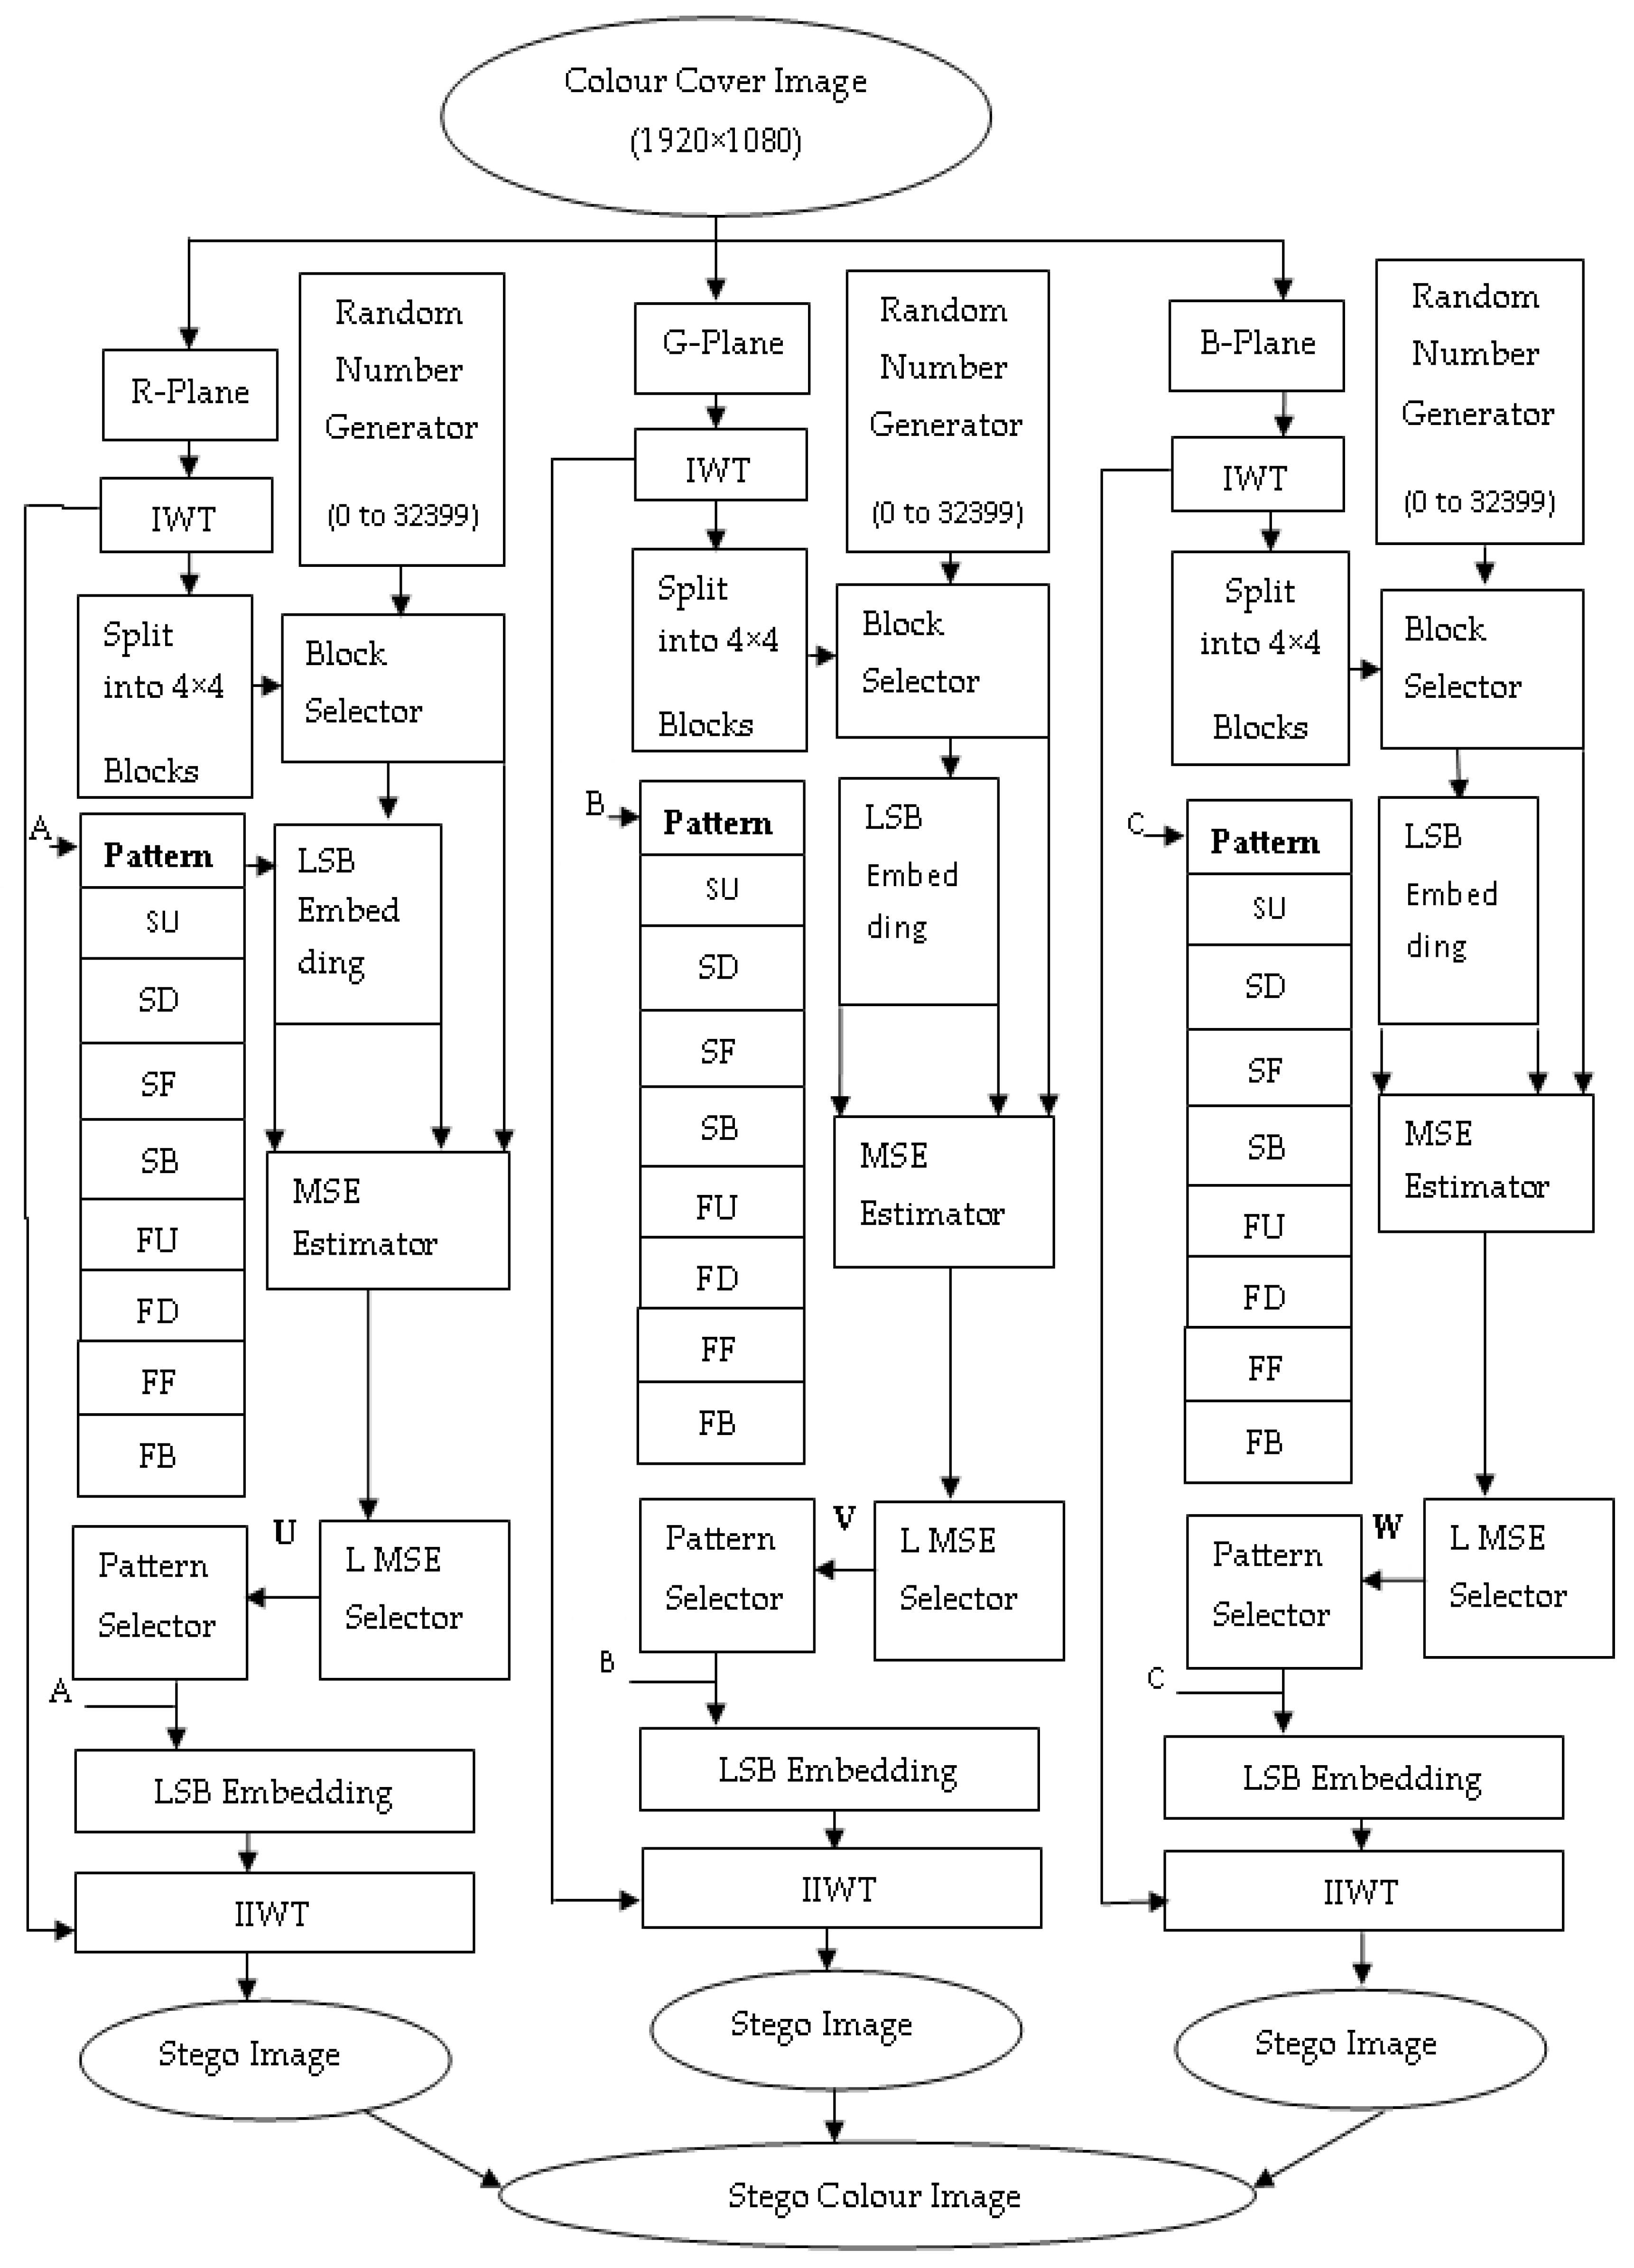
2.2. Embedding Algorithm
- Step 1: Read the color cover image (1920 × 1080).
- Step 2: Divide the color image into Red (R), Green (G) and Blue (B) Planes.
- Step 3: Apply 2D-Haar IWT to R-plane of the cover image and generate LL, LH, HL and HH band.
- Step 4: Select the HH band in R-plane of the cover image.
- Step 5: Divide HH band into 4 × 4 blocks and select one block at a time randomly, using a random number generator.
- Step 6: Read the black and white binary data image (1920 × 1080).
- Step 7: Apply IWT. This gives LL, LH, HL and HH sub-bands. Select LL band.
- Step 9: Calculate Mean Square Error of each pattern and apply pattern with Least MSE for that block.
- Step 10: Select 3-bit key for the applied pattern from Table 1 and shift the selected key to left by three bits.
- Step 11: Repeat from Step 8 to Step 10 for the selected block until all data blocks of LL sub-band are embedded within HH sub-band of cover image in R-plane.
- Step 12: Apply IIWT for LL, LH and HL subbands of R-Plane and modified HH band and create R-plane of the stego image.
- Step 13: Repeat Step 4 to Step12 for G&B planes by using black and white binary data image2&3.
- Step 14: Combine the all these layers into single stego image.
- Step 15: Transmit the created stego image to display screen.
- Step 16: Transmit the generated key secretly.
2.3. Key Generation and Reception
- Step 1: Start the embedding algorithm for Red plane
- Step 2: Select the pattern with the least MSE for the selected block. Let this be U.
- Step 3: Look for the 3-bit key from Table 1 based on U.
- Step 4: Shift the selected key to left by three times.
- Step 5: Repeat Step 2 and Step 3 for the next selected block.
- Step 6: Replace the three LSBs of the key with the selected 3-bit key from Step 3.
- Step 7: Repeat Step 4.
- Step 8: Repeat from Step 5 to Step 7 until the key is generated for every4 × 4 block of the red plane.
- Step 9: Repeat from Step 1 to Step 8 for green and blue planes based on V and W respectively and generate keys for the green plane and blue plane.
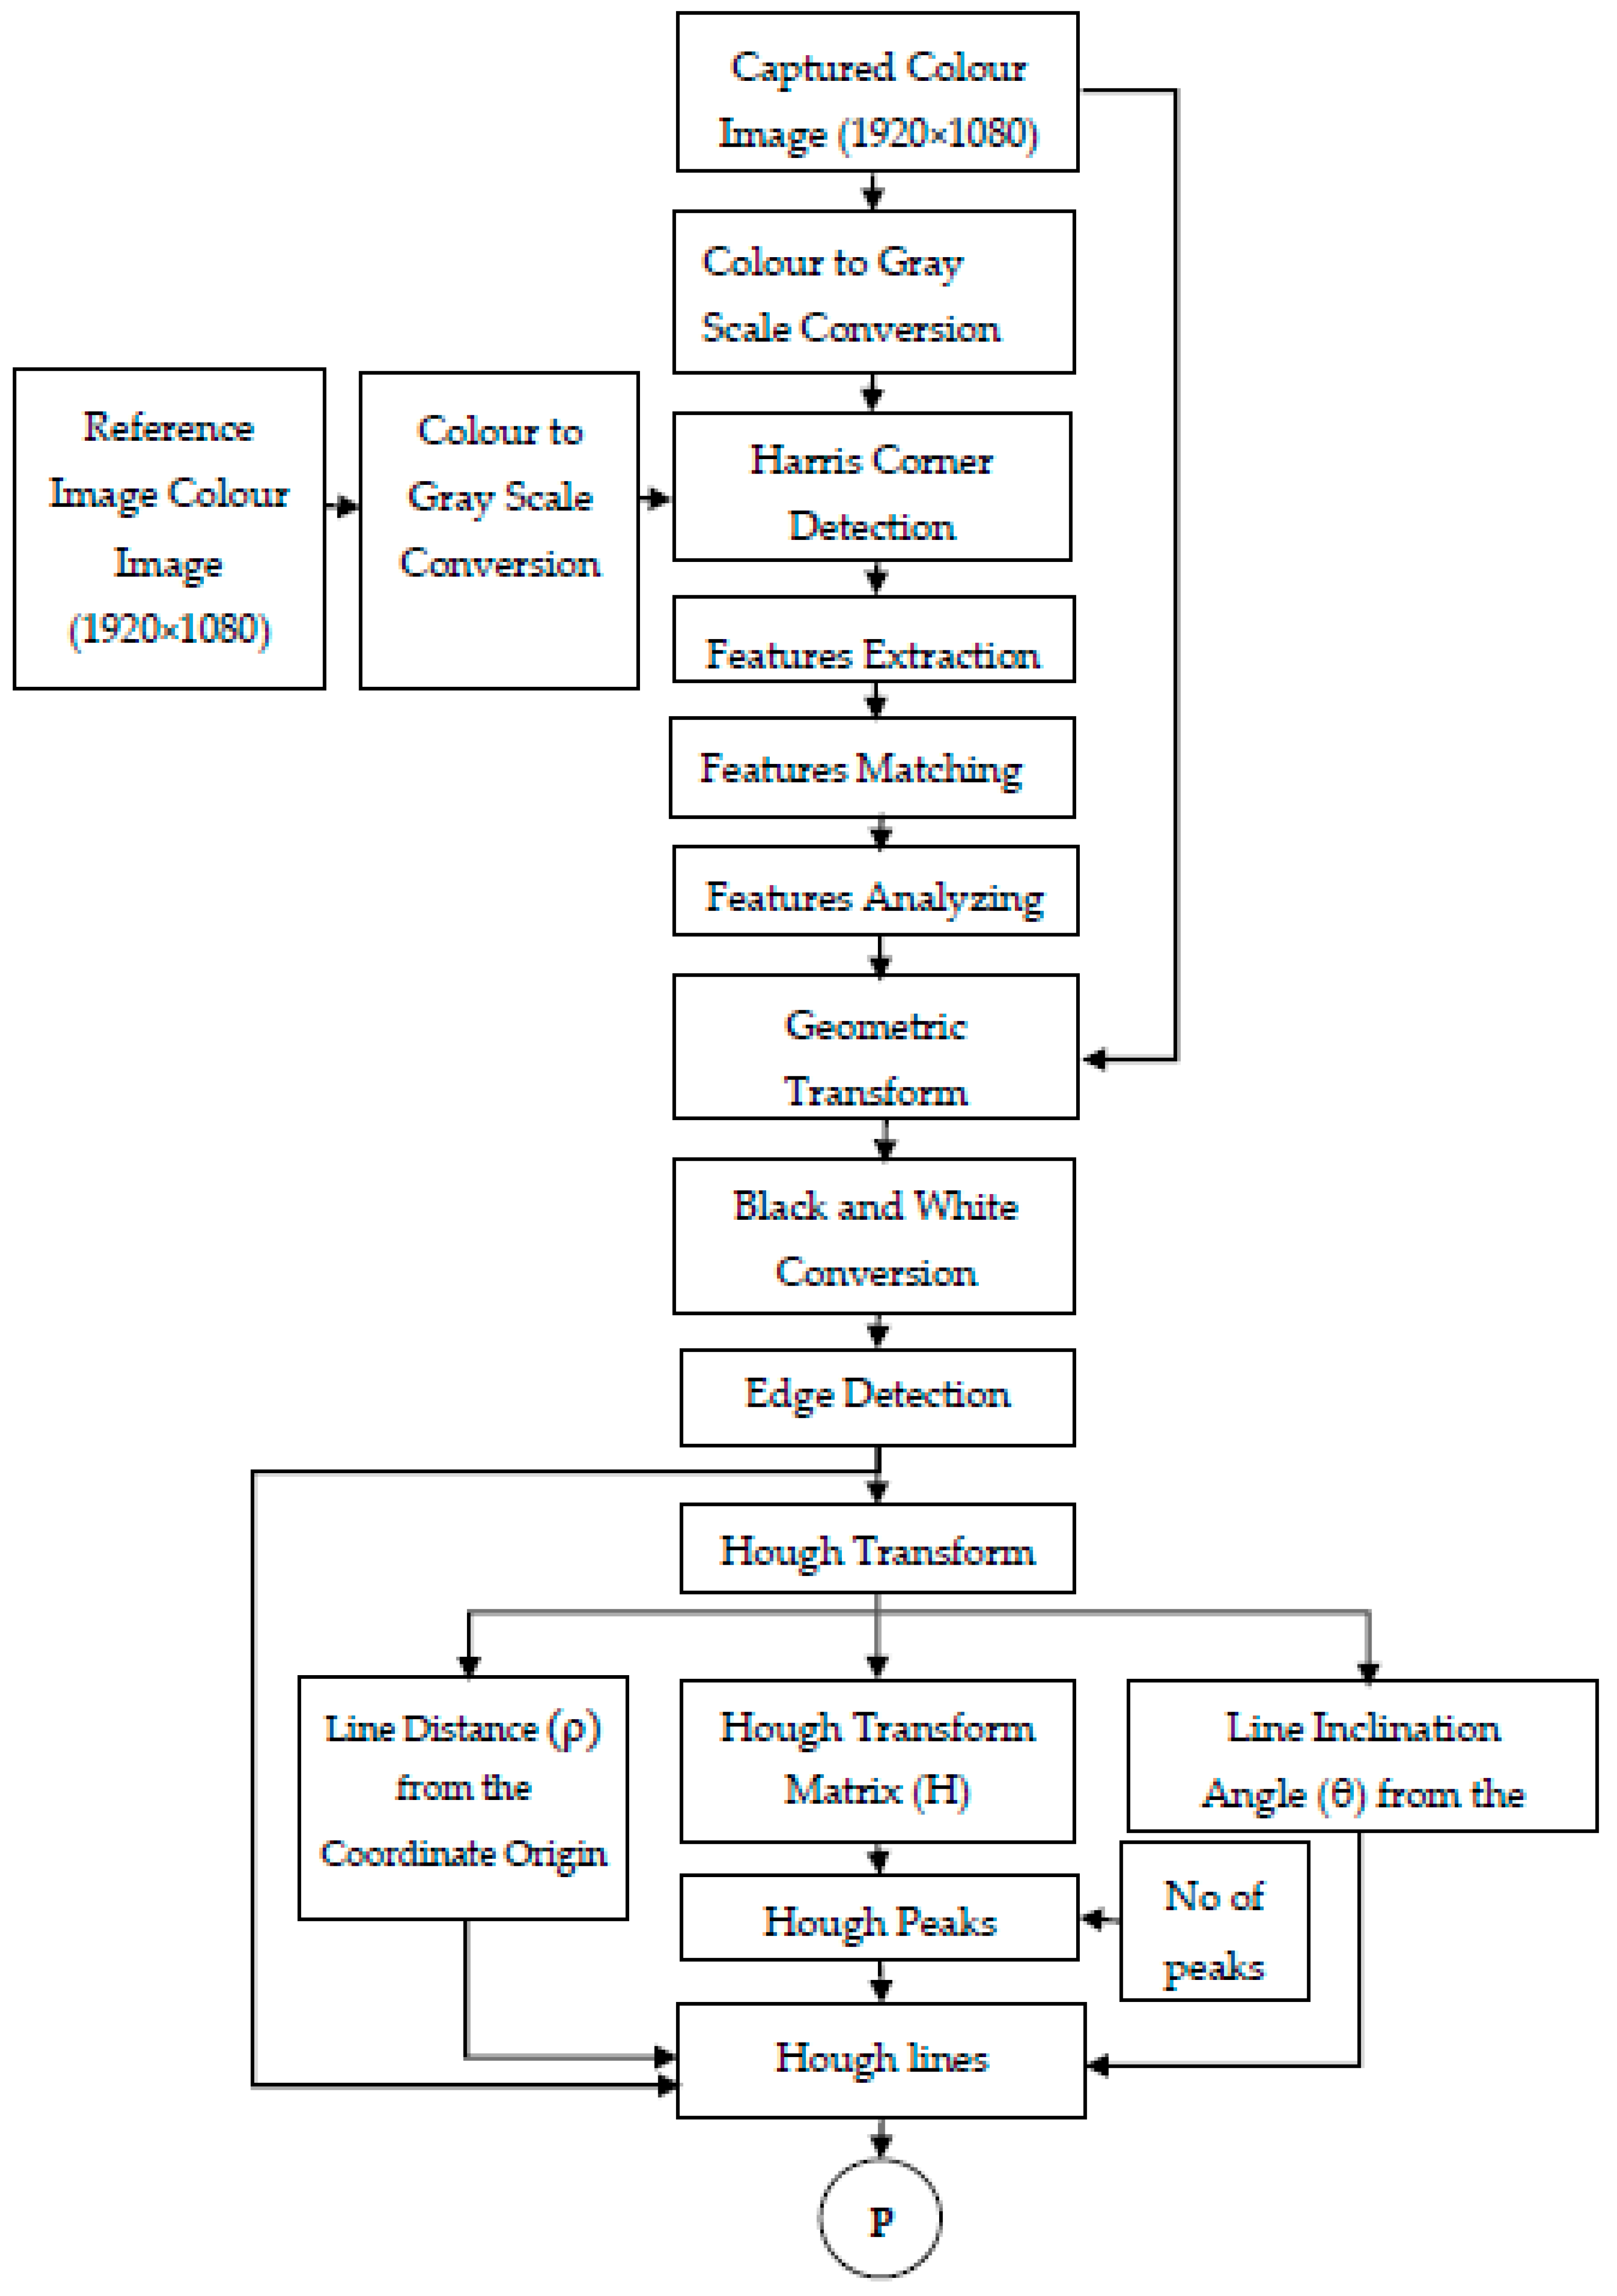
2.4. Display Screen Extraction
- Step 1: Store the captured image containing a display screen with minimum geometric distortion as a reference image in the grayscale form.
- Step 2: Capture the image containing the display screen and convert into its grayscale form.
- Step 3: Apply Harris corner detection for reference and captured images. This step gives the corner features of both the images.
- Step 4: Extract the detected corner features of both images into two variables F1 and F2.
- Step 5: Match the features between the two images using the variables F1 and F2. Let the matched features of the two images be M1 and M2.
- Step 6: Find the valid matched points from the set of M1 and M2. Let the valid points be V1 and V2.
- Step 7: Estimate the geometric transform required to restore the captured image as a reference image using V1 and V2.
- Step 8: Apply the geometric transform to the captured color image.
- Step 9: Perform edge detection on the restored image and find all the edges in the image.
- Step 10: Apply Hough transform based on the results of edge detection. This gives Hough transform matrix H, line distance ρ and line inclination θ.
- Step 11: Find Hough peaks in the obtained Hough transform.
- Step 12: Select lines having minimum line distance (borders of the display screen) inclining 0 ± 5° (vertical lines) or 90 ± 5° (horizontal lines).
- Step 13: Lines obtained from Step 12 are used to extract the display screen from the captured image.
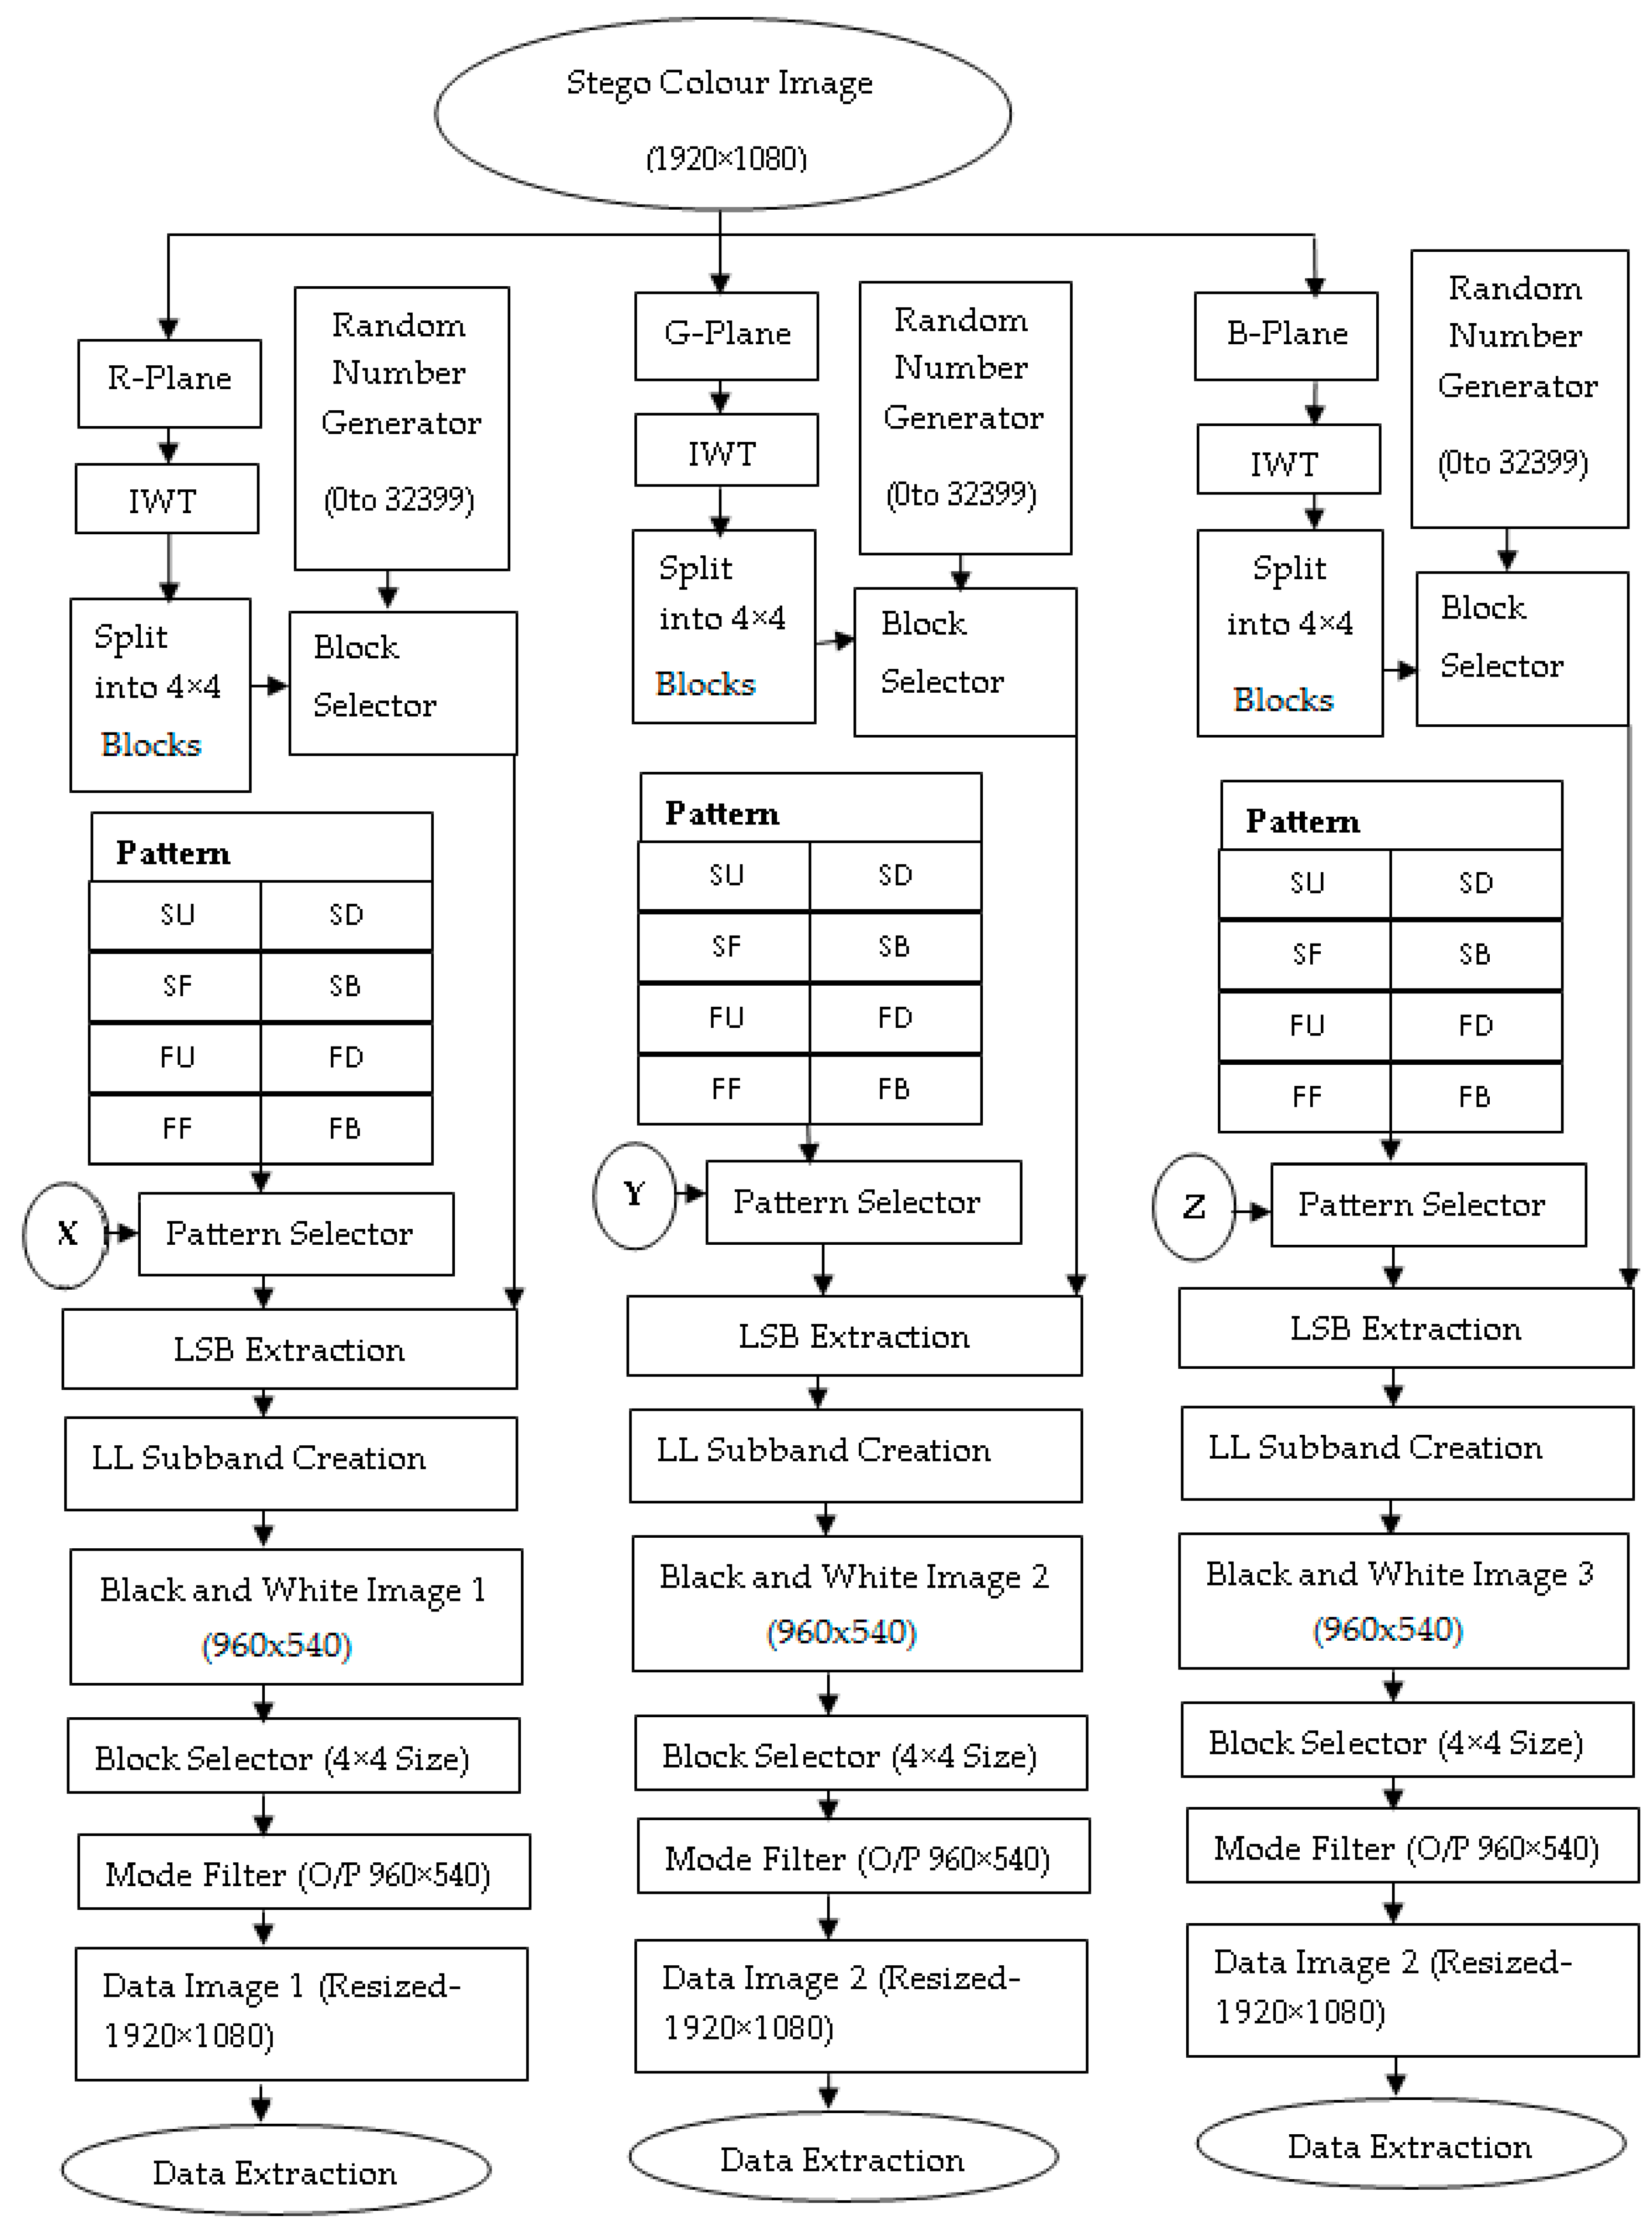
2.5. Extraction Algorithm
- Step 1: Read the 1920 × 1080 stego image obtained from display screen extraction.
- Step 2: Divide the stego image into its three layers red, green and blue.
- Step 3: Apply 2D-Haar IWT to R-Plane of the stego image and generate LL, LH, HL and HH band.
- Step 4: Select the HH band.
- Step 5: Divide HH band into 4 × 4 blocks and select one block at a time randomly using same random number generator used at the transmitter.
- Step 6: The key stream received for the red layer is given to 3-bit splitter, and consecutive 3 LSB bits of the key are selected.
- Step 7: Shift the key to right by 3-bits.
- Step 8: The three bits of the key obtained from Step 6 is used to determine the pattern applied to that block by looking at Table 1.
- Step 9: Extract LSB of integer coefficients based on the selected pattern and create a 4 × 4 block in the LL band of black and white binary data image respectively.
- Step 10: Select the next block and repeat from Step 6 to Step 9 until all data blocks of LL band are extracted from the HH band of the R-plane
- Step 11: Obtained LL subband gives black and white binary data image 1(960 × 540).
- Step 12: Divide the obtained black and white data image into 4 × 4 blocks.
- Step 13: Select the first block and apply mode filter to that block. Mode filter finds the most number of occurrences of ‘1’ and ‘0’ and replaces all the pixels in that block with ‘1’ or ‘0’, whichever is most prevalent.
- Step 14: Select next block in the same row and repeat Step 13 for that block. If the previous block is the last block in that row then, the next block is the first block from the next row.
- Step 15: Repeat Step 14 for all 4 × 4 blocks and create restored black and white binary data image (960 × 540).
- Step 16: Resize the restored black and white data image (960 × 540) into the size of (1920 × 1080).
- Step 17: Repeat from Step 3 to Step 16 for green and blue layers using respective received key streams and create resized black and white binary data images.
- Step 18: Extract a secret message from the obtained black and white binary data image.
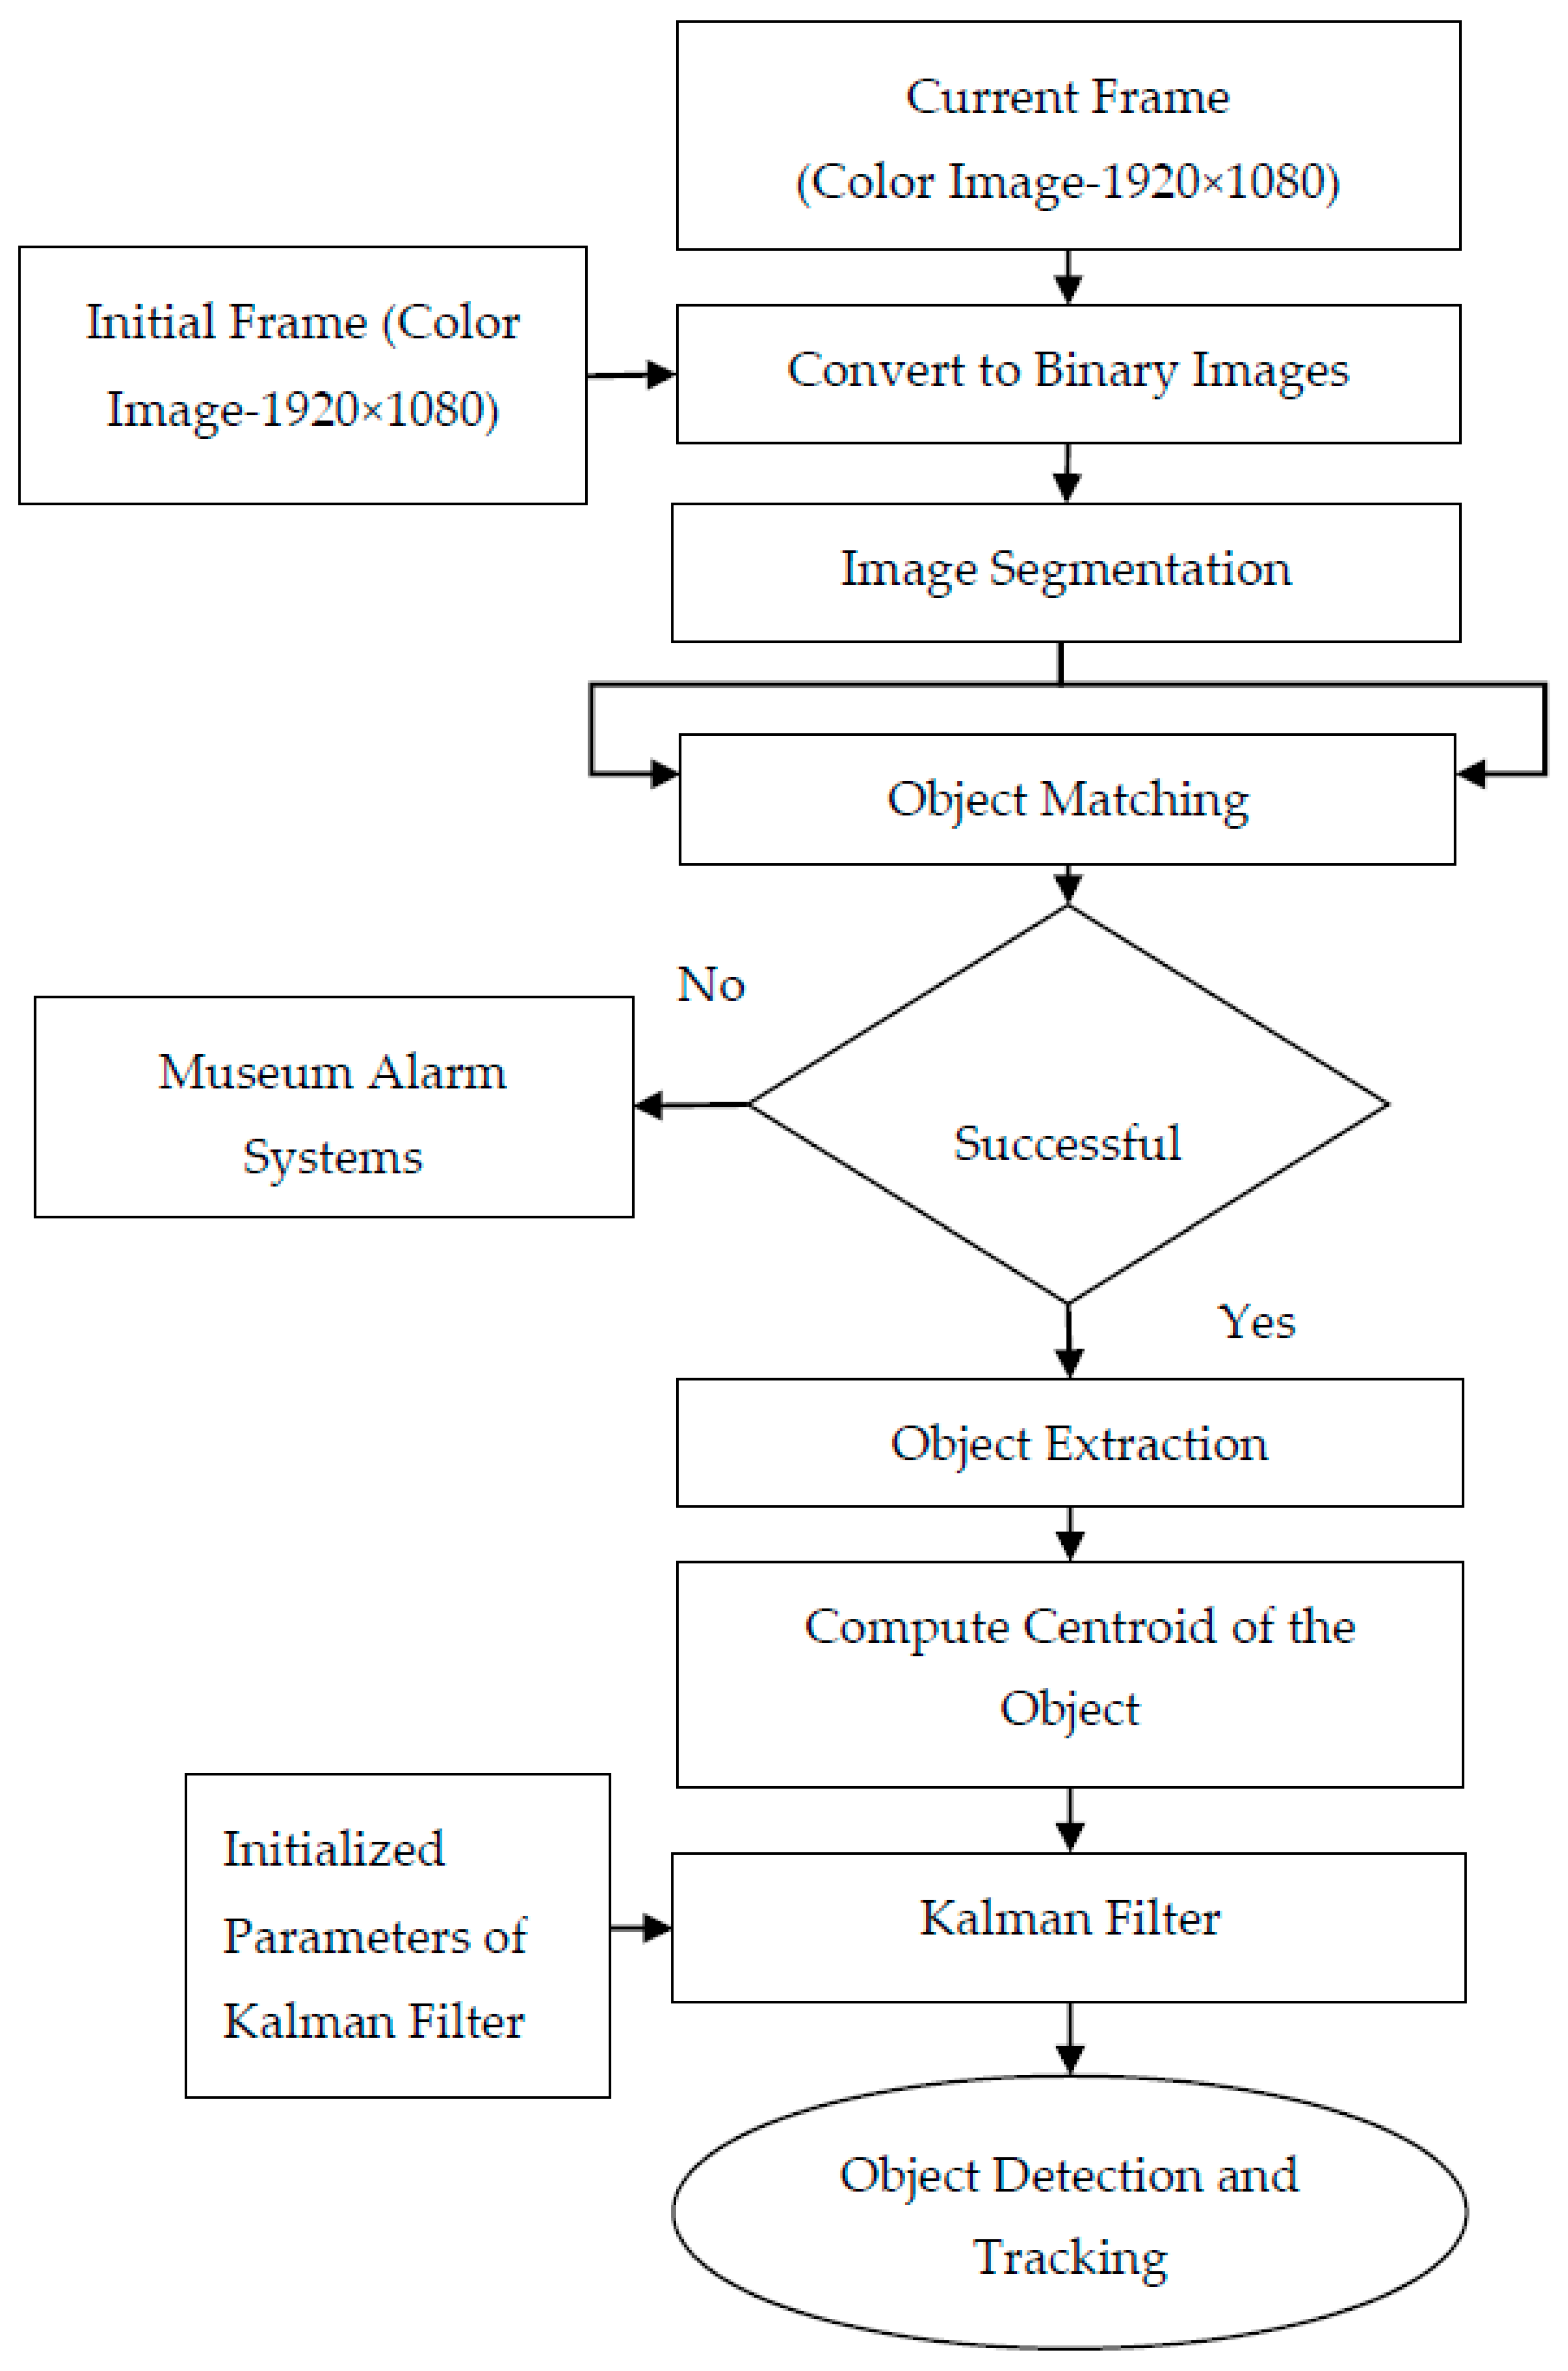
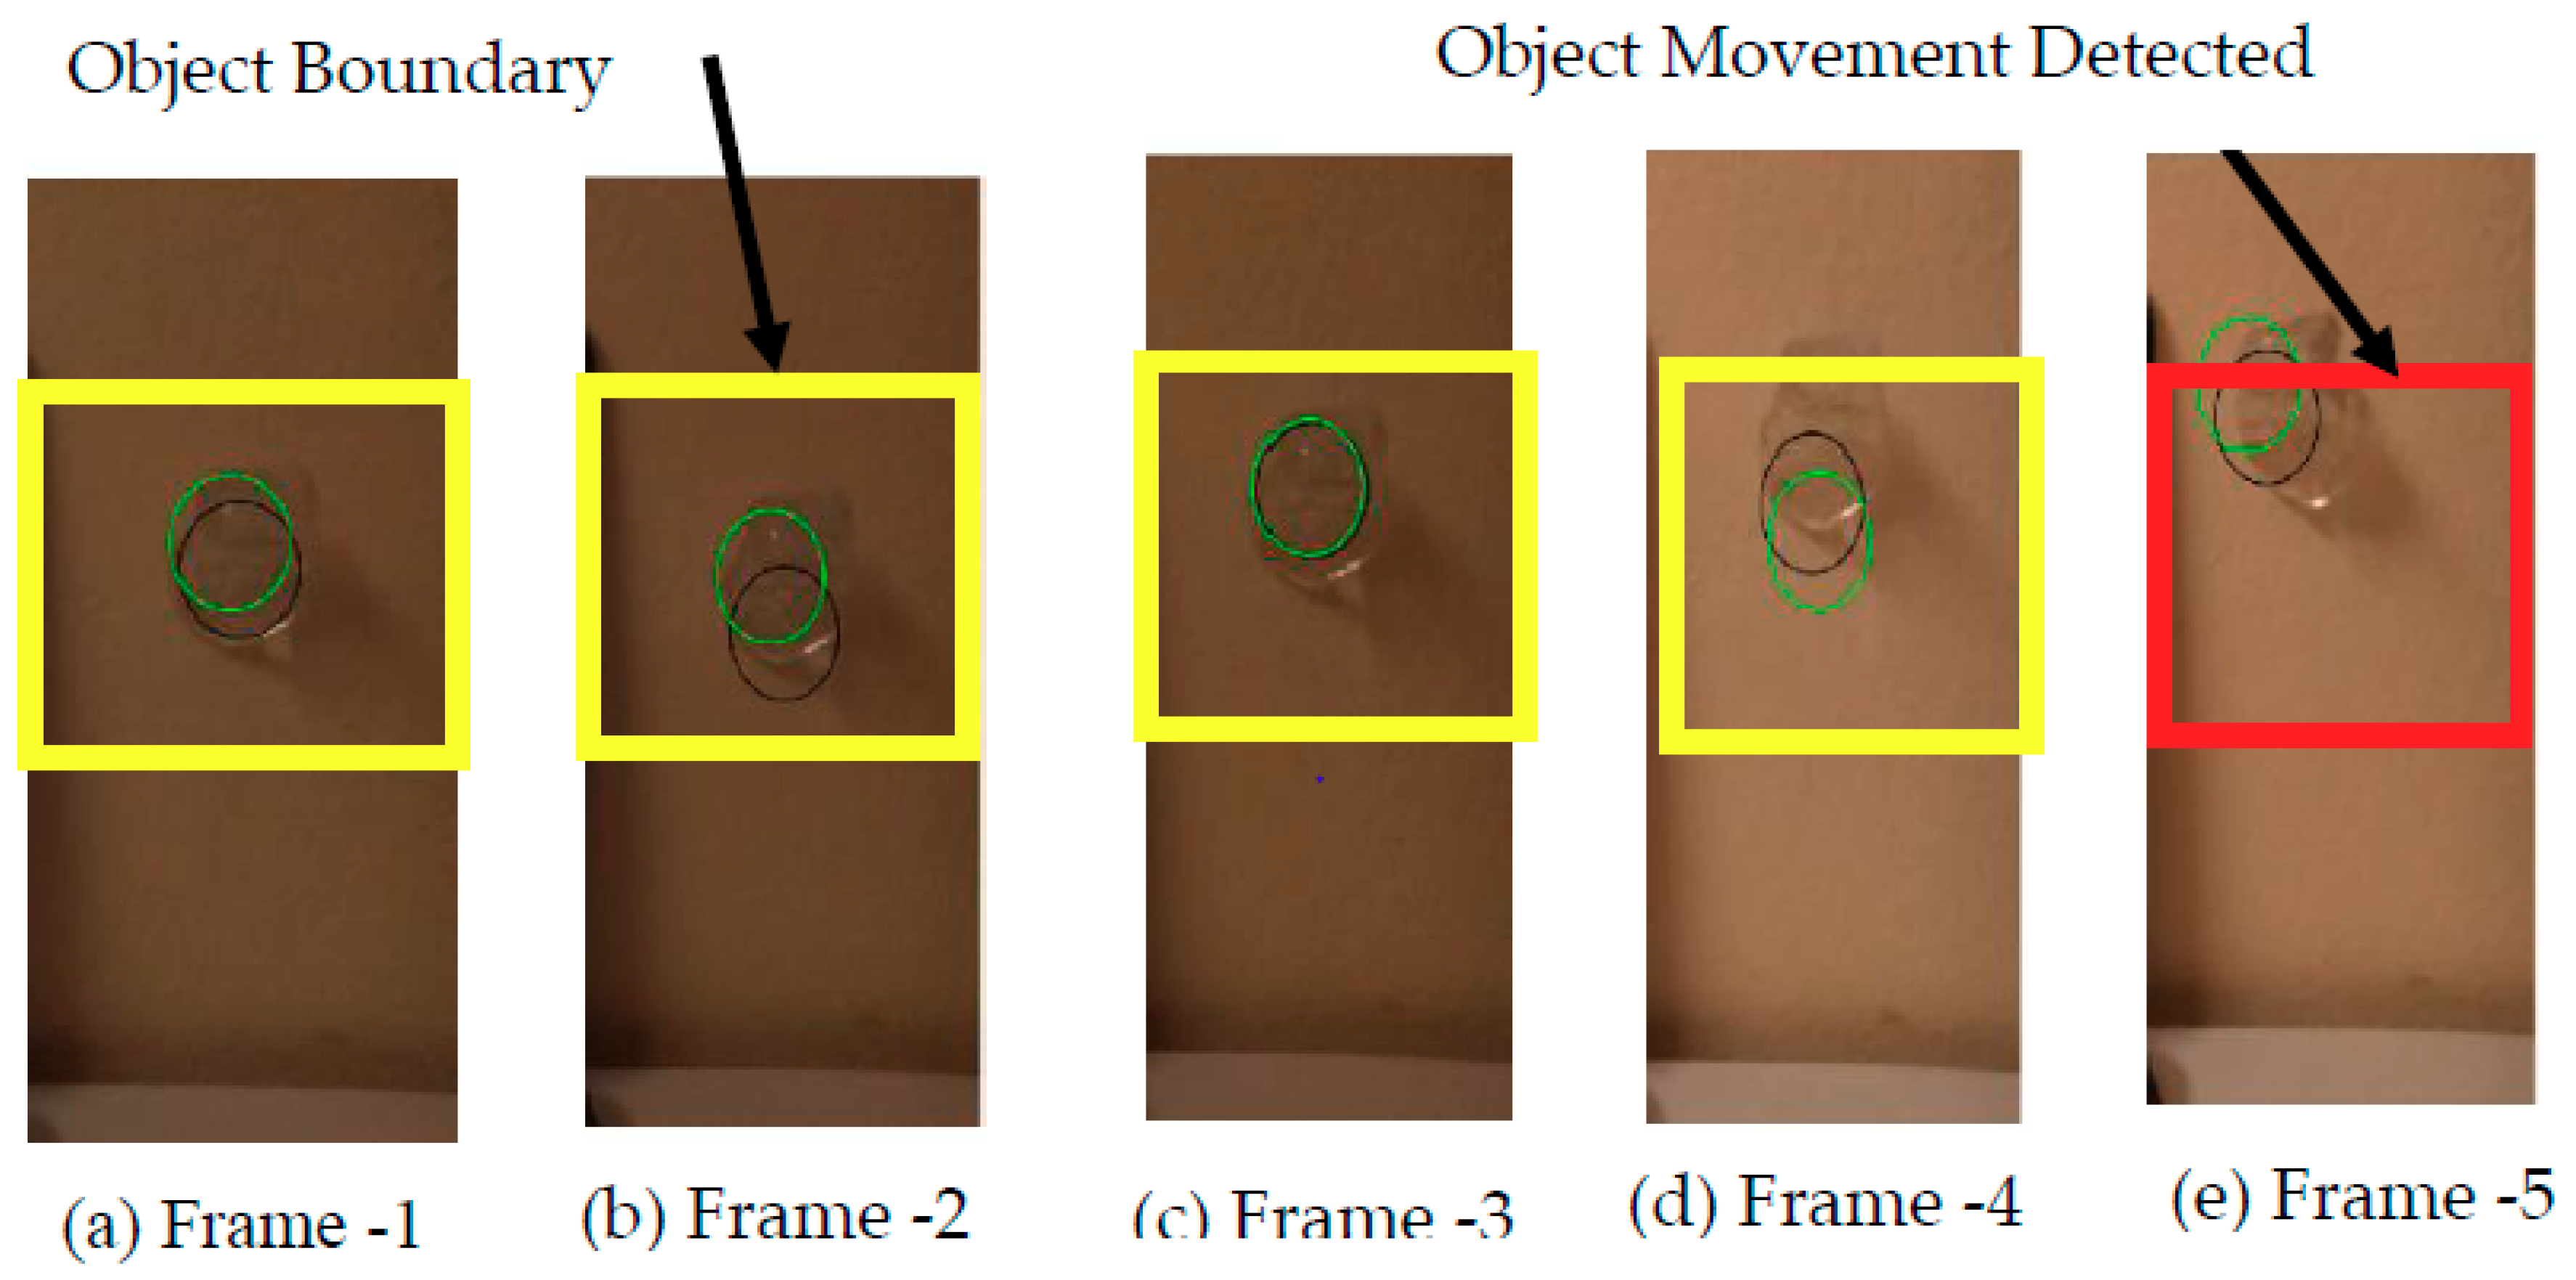
2.6. Object Detection and Tracking
- Step 1: Read the initial or beginning image frame received from the surveillance camera.
- Step 2: Read the next or current image frame received from the surveillance camera.
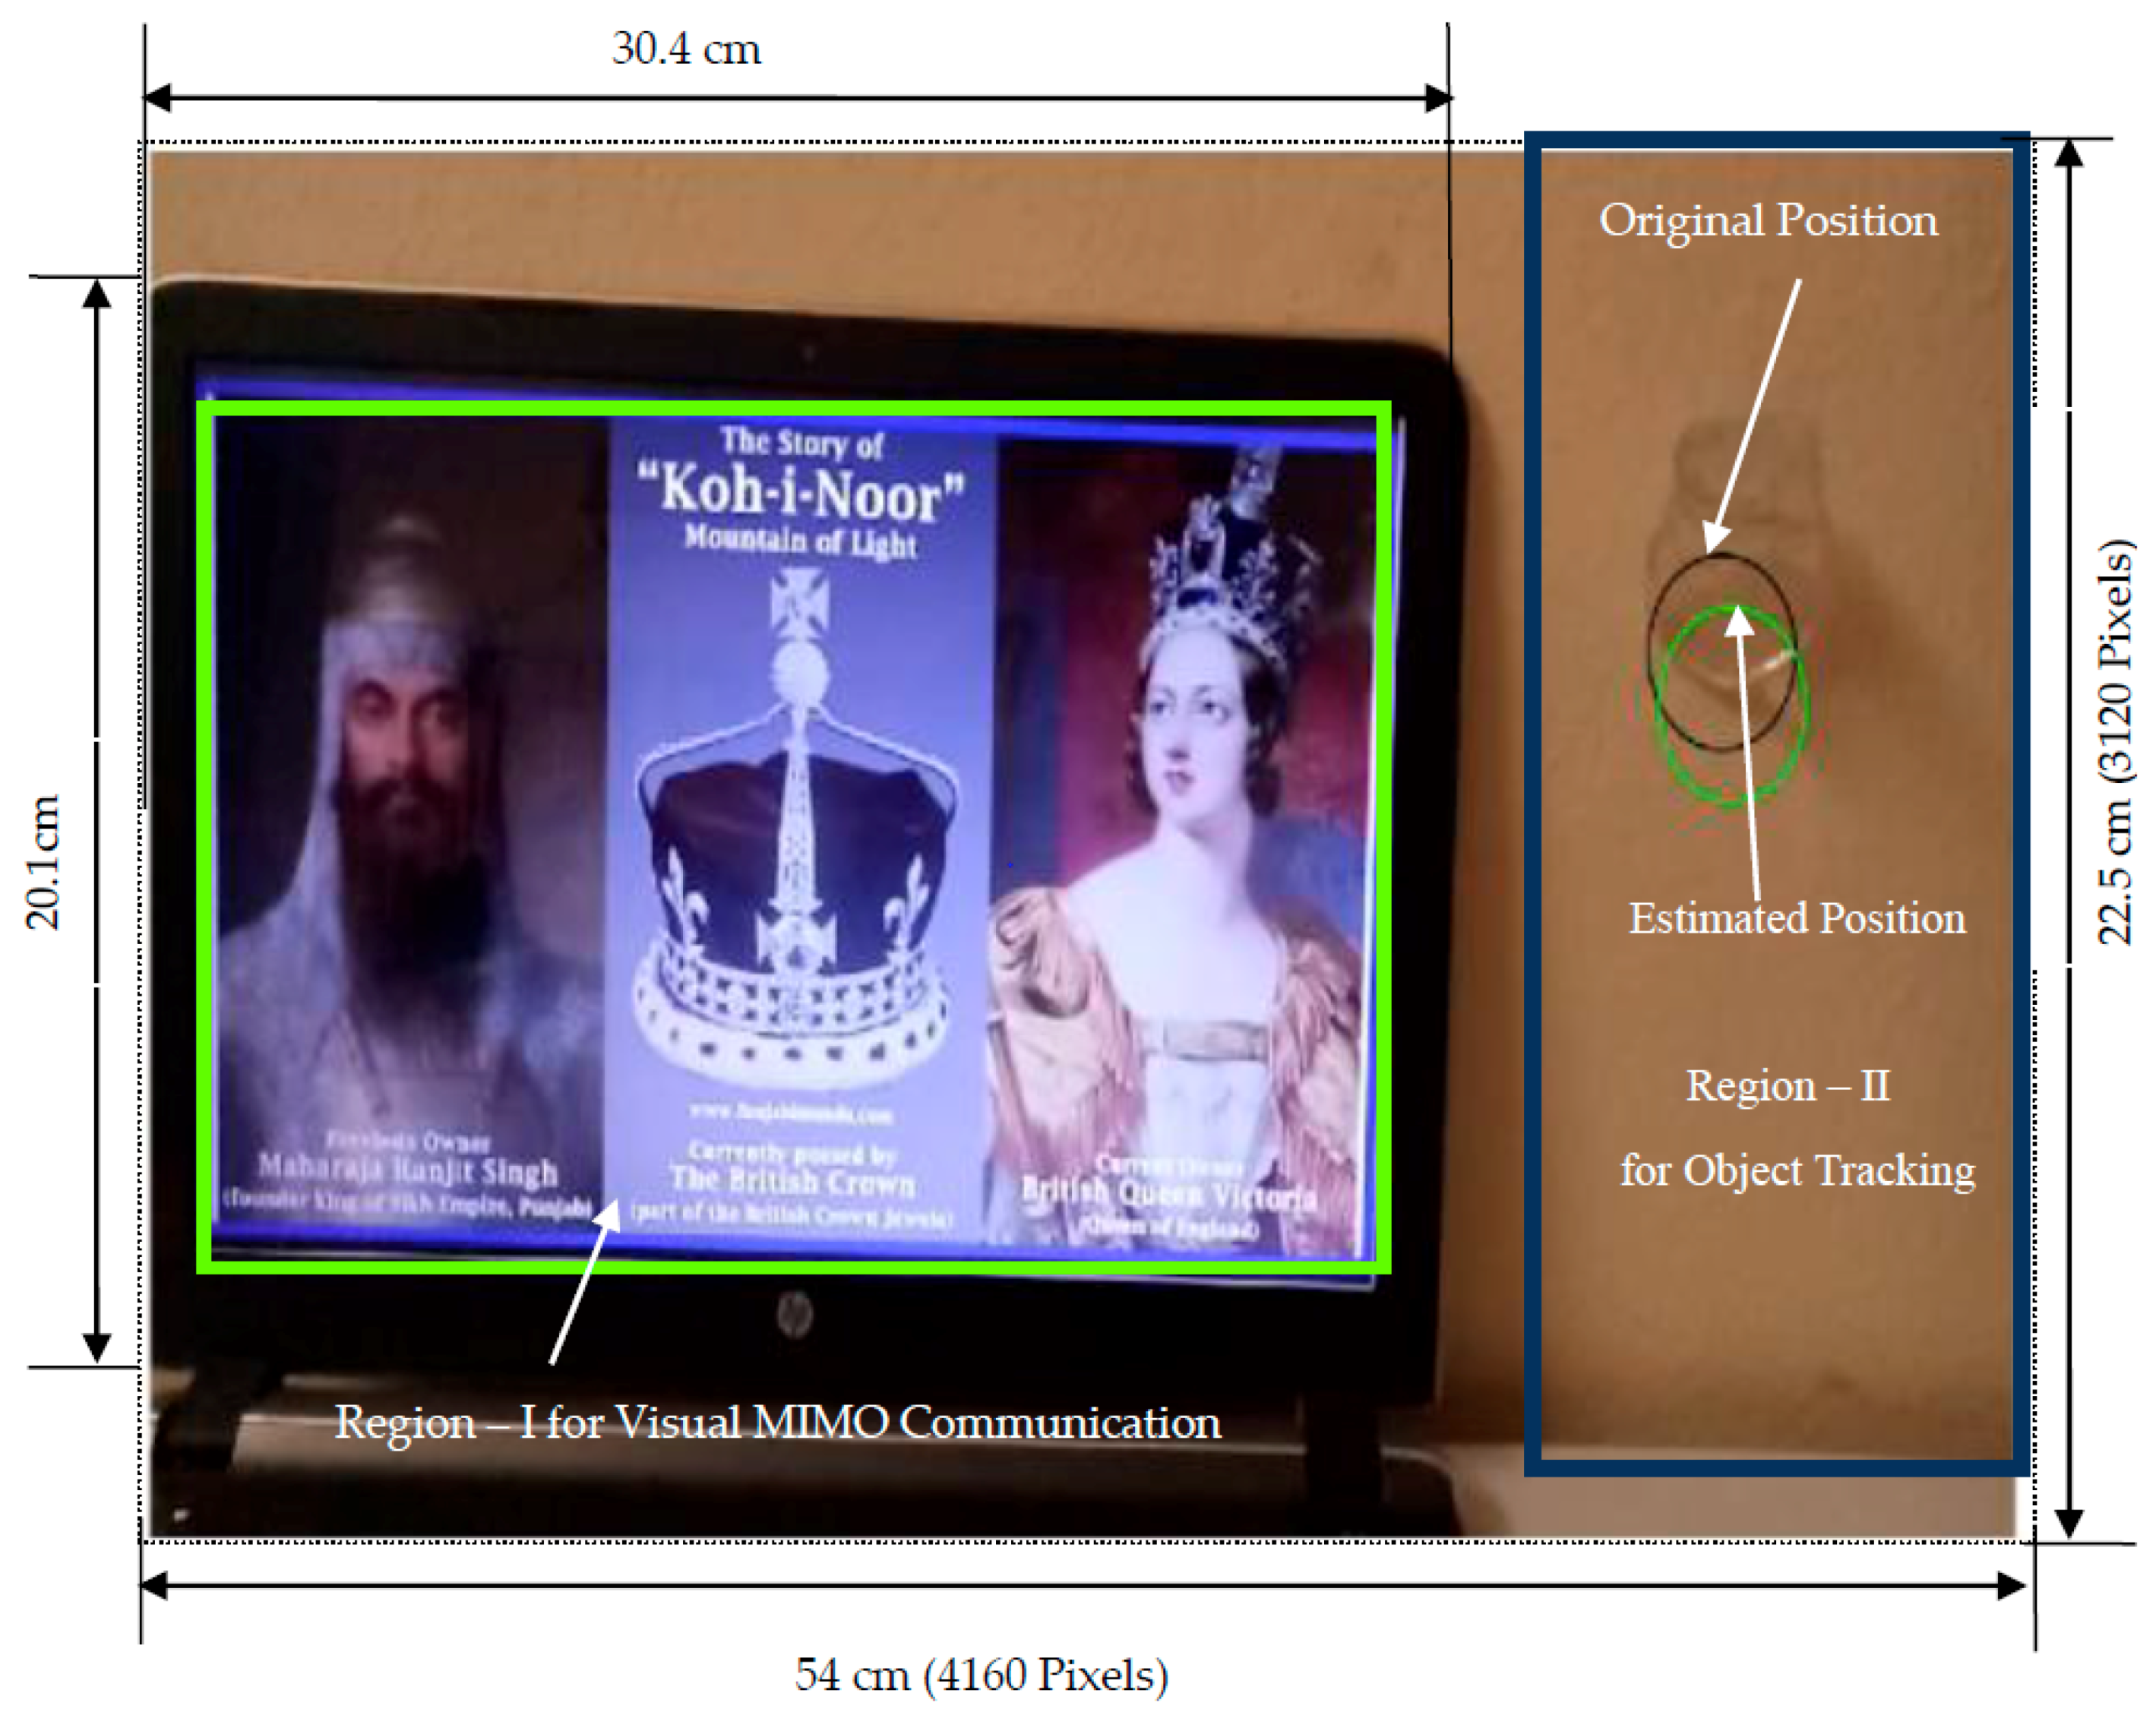
- Step 3: Perform image segmentation for the obtained black & white image and select only the region that does not contain a display screen or region that contains the precious object.
- Step 4: Find the absolute difference between an initial frame and the current frame. This gives the distortions or disturbances between the two image frames. i.e., the movement of the precious object. This step results in a black and white image with the disturbances represented by white pixels and stationary locations represented by black pixels.
- Step 5: The white pixels in the black & white image represent movement of the precious object. Compute the centroid of all the white pixels in that image, i.e., the centroid of the precious object.
- Step 6: If there are no white pixels in the black & white image. Then, it is not possible to determine the centroid of the object.
- Step 7: Alert the museum alarm systems and send command information to the object protection system through the current stego image.
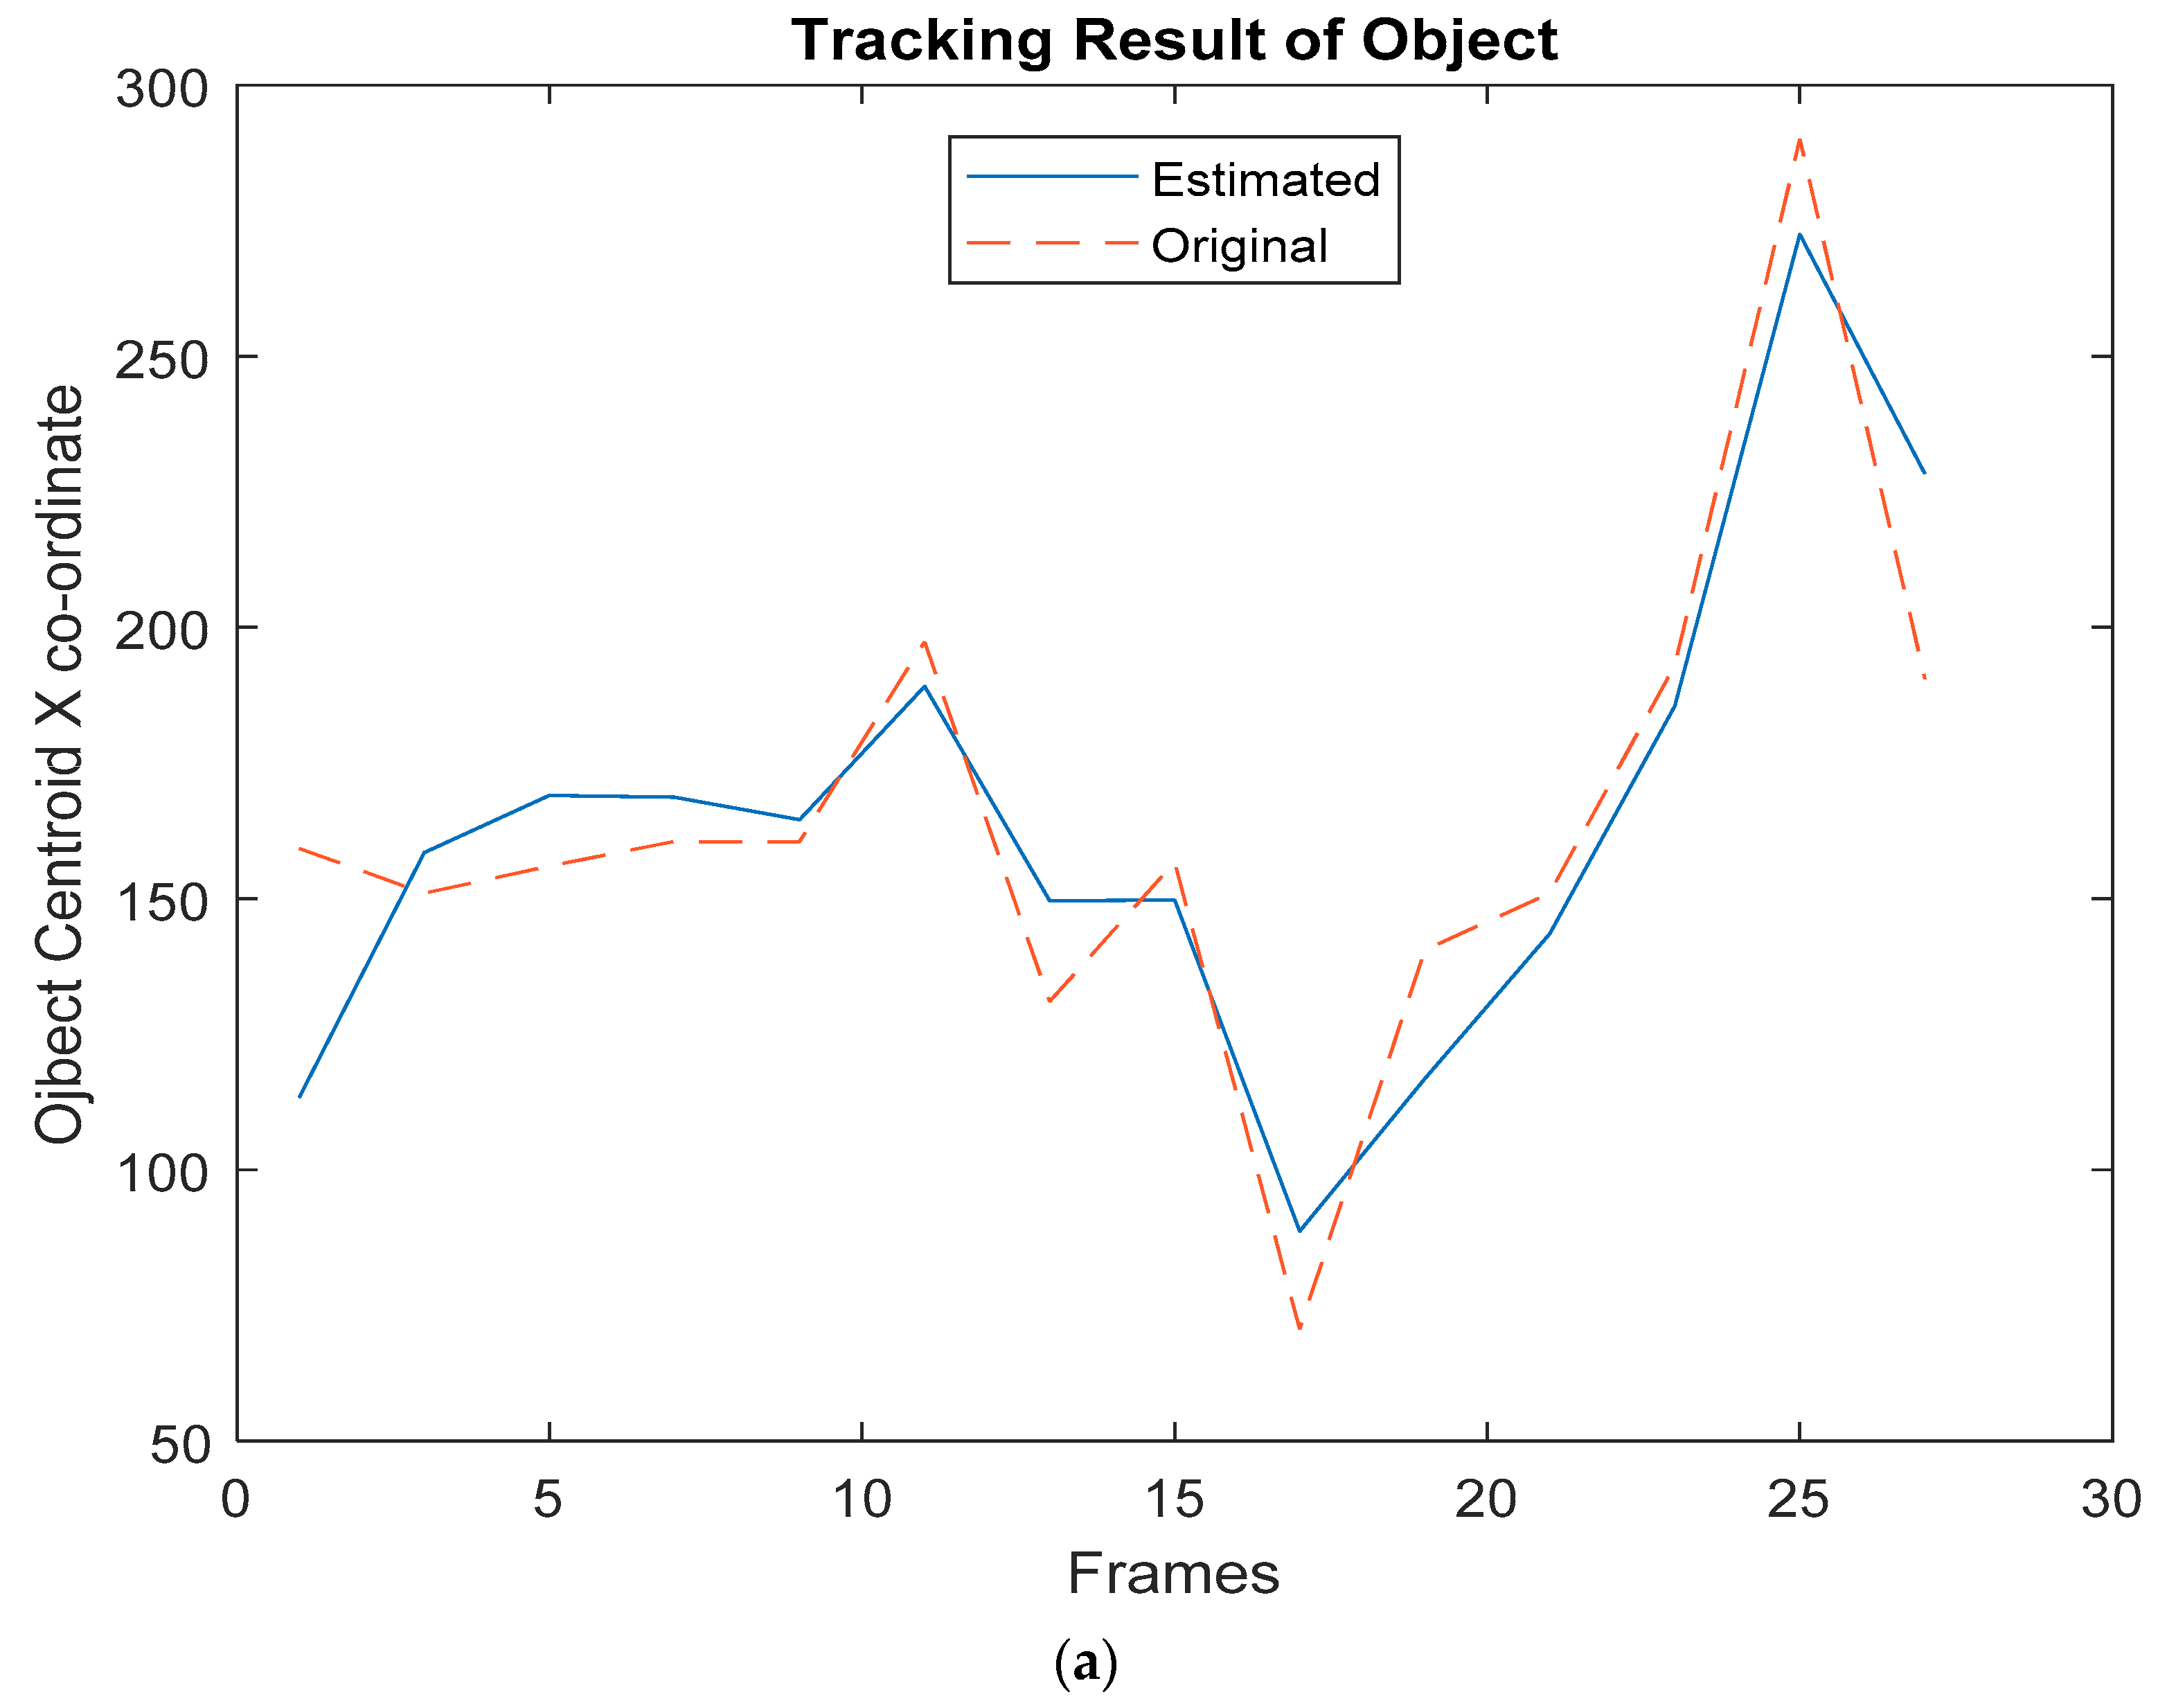
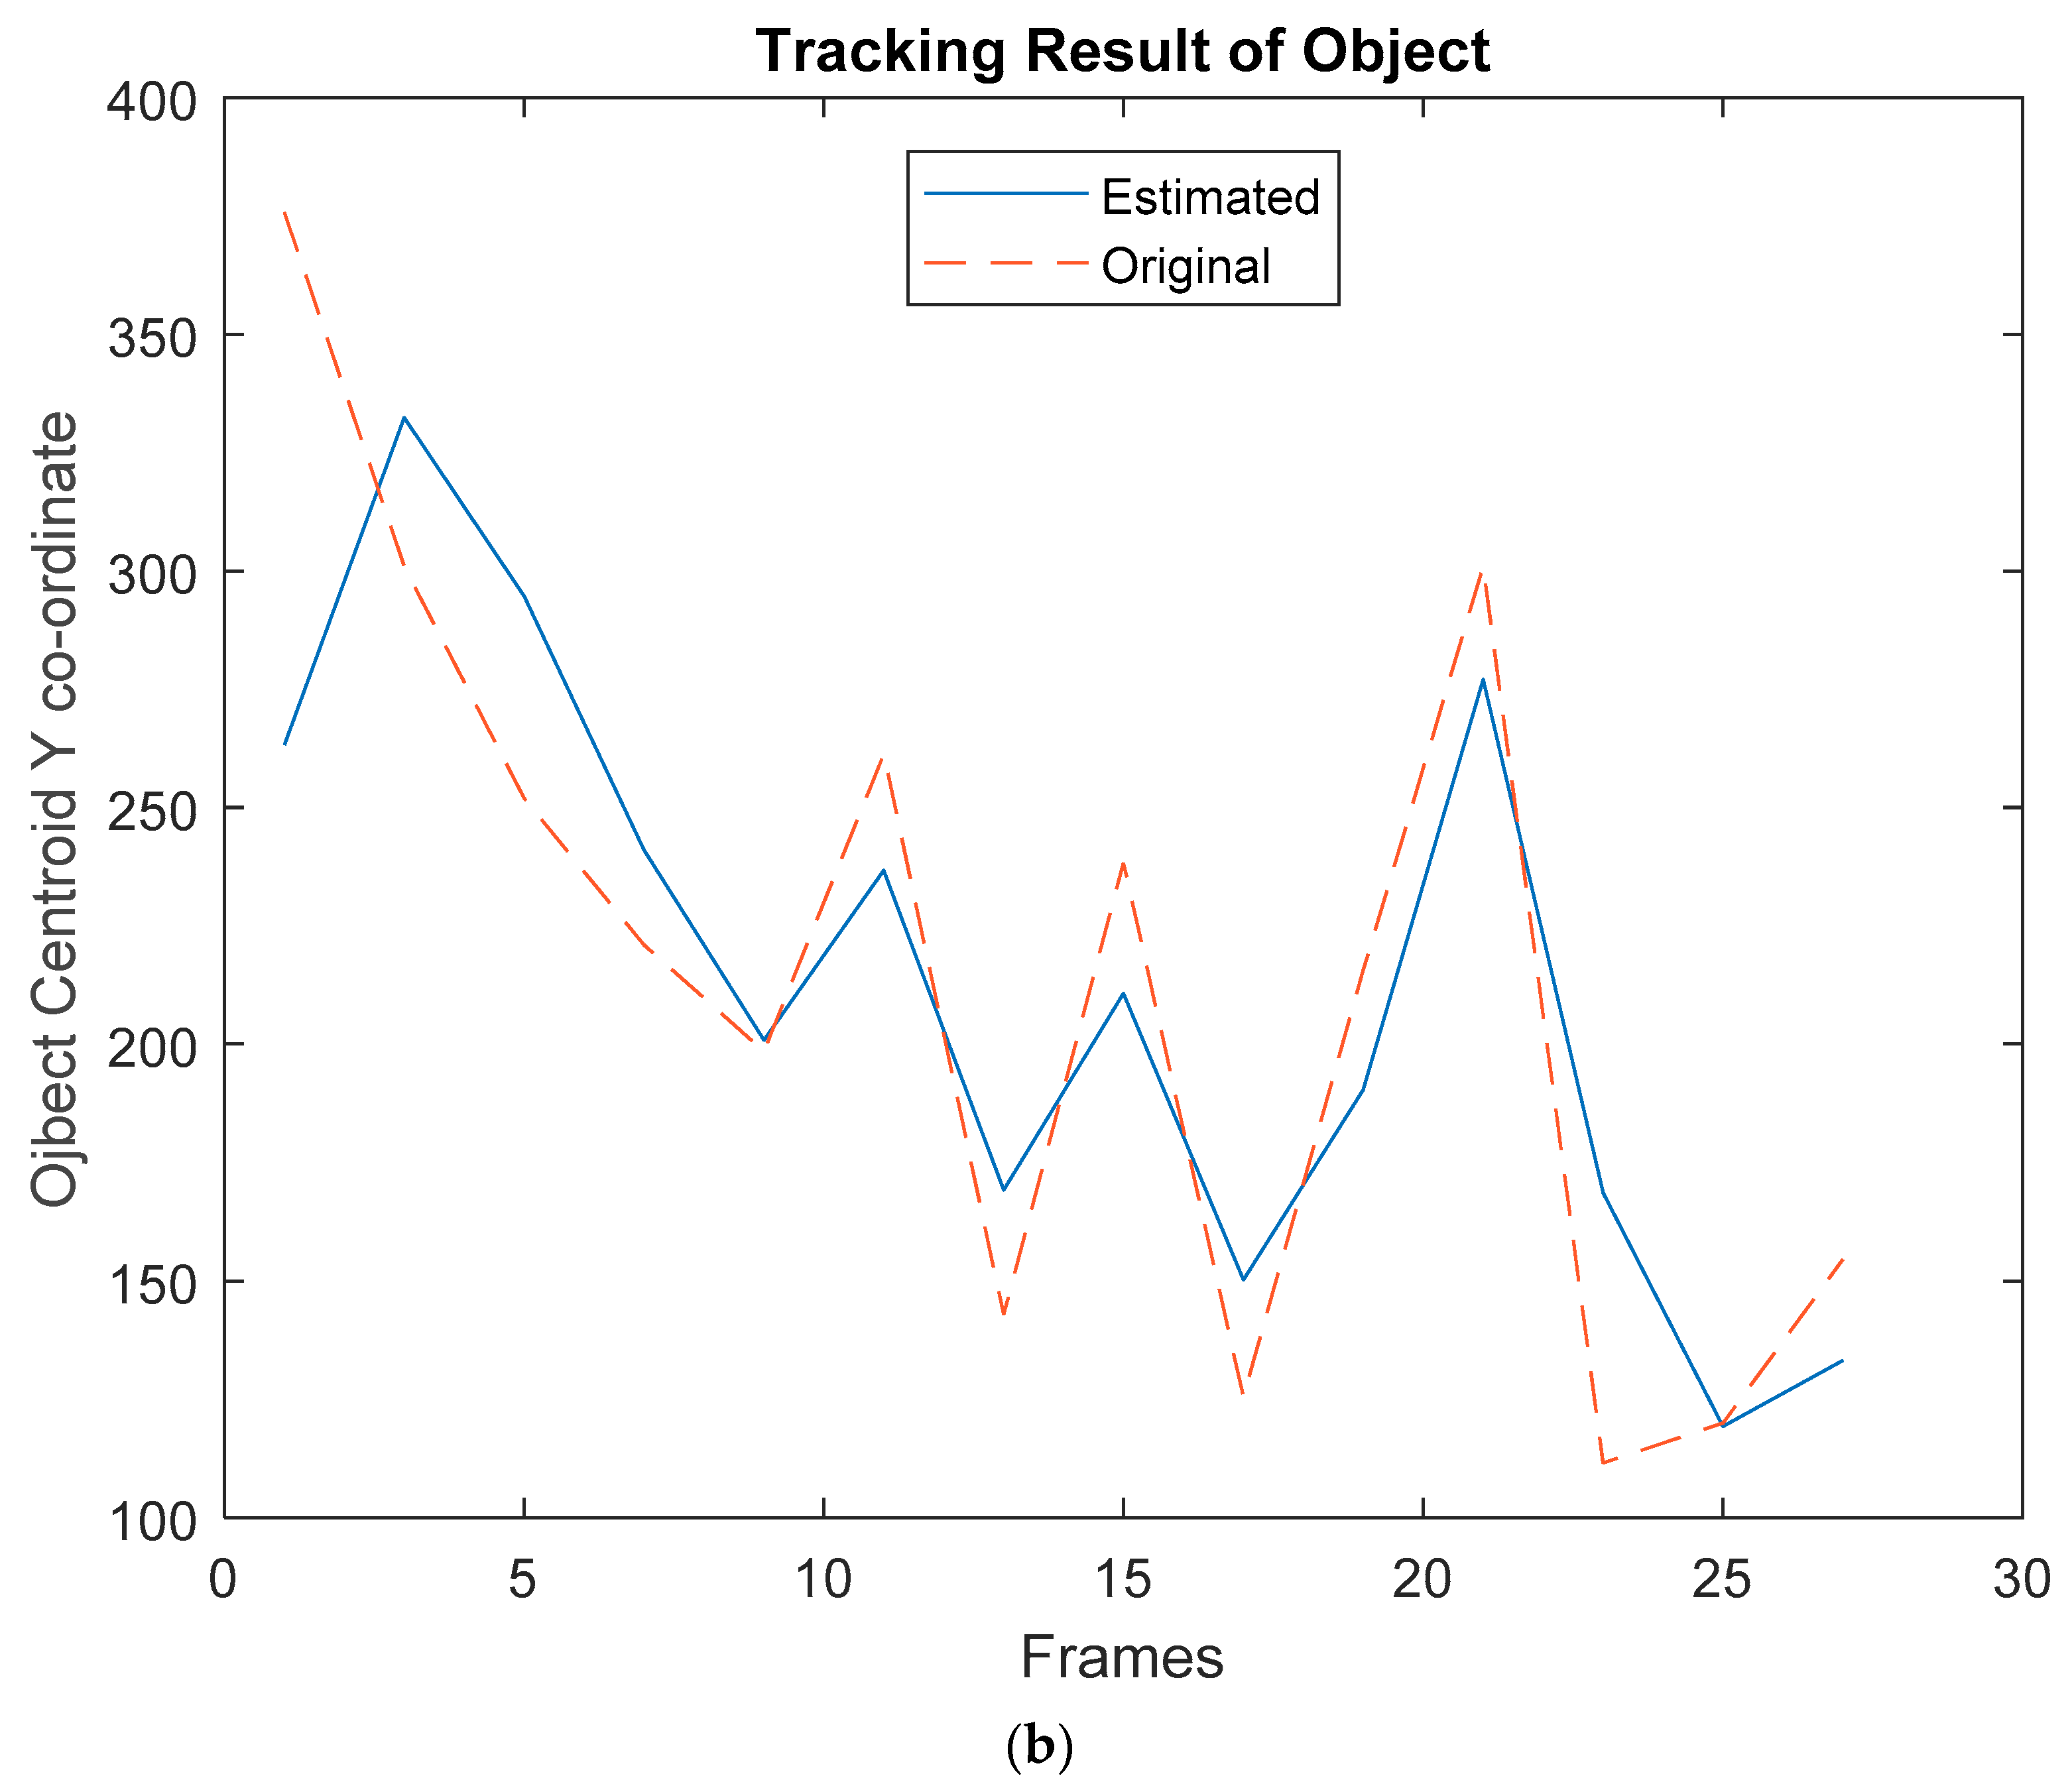
- Step 8: Initialize the Kalman filter parameters [27] such as the covariance matrix, error in measurement matrix, error in estimation matrix, initial object location (centroid), and so on.
- Step 9: Give the measured centroid value of the object to the Kalman filter; the output obtained is the estimated centroid value of the object.
- Step 10: Assign the current image frame as an initial image frame for the next iteration.
- Step 11: Repeat from Step 2 to Step 10 for continuous tracking of the precious object.
3. Results and Discussion
4. Conclusions
Author Contributions
Funding
Acknowledgments
Conflicts of Interest
References
- Hashim, A.F.; Taib, M.Z.F.; Alias, A. The Integration of Interactive Display Method and Heritage Exhibition at Museum. Procedia Soc. Behav. Sci. 2014, 44, 308–316. [Google Scholar] [CrossRef]
- Tsiropoulou, E.E.; Thanou, A.; Paruchuri, S.T.; Papavassiliou, S. Modelling Museum Visitors’ Quality of Experience. In Proceedings of the IEEE 11th International Workshop on Semantic and Social Media adaptation and Personalization (SMAP), Thessaloniki, Greece, 20–21 October 2016; pp. 1–6. [Google Scholar] [CrossRef]
- Tsiropoulou, E.E.; Thanou, A.; Papavassiliou, S. Self-organizing museum visitor communities: A participatory action research based approach. In Proceedings of the IEEE 12th International Workshop on Semantic and Social Media Adaptation and Personalization (SMAP), Bratislava, Slovakia, 7–9 July 2017; pp. 1–5. [Google Scholar] [CrossRef]
- Lykourentzou, L.; Claude, X.; Naudet, Y.; Tobias, E.; Antoniou, A.; Lepouras, G.; Vasilakis, C. Improving museum visitors’ Quality of Experience through intelligent recommendations: A visiting style-based approach. In Proceedings of the Workshop of the 9th International Conference on Intelligent Environments, Athens, Greece, 16–17 July 2013; pp. 507–518. [Google Scholar] [CrossRef]
- Tsiropoulou, E.E.; Thanou, A.; Papavassiliou, S. Quality of experience-based museum touring: A human in the loop approach. Soc. Netw. Anal. Min. 2017, 7. [Google Scholar] [CrossRef]
- Fernández, J.; Calavia, L.; Baladrón, C.; Aguiar, J.M.; Carro, B.; Sanchez-Esguevillas, A.; Alonso-López, J.A.; Smilansky, Z. An intelligent surveillance platform for large metropolitan areas with dense sensor deployment. Sensors 2013, 13, 7414–7442. [Google Scholar] [CrossRef] [PubMed]
- Sookhanaphibarn, K.; Thawonmas, R. A Movement Data Analysis and Synthesis Tool for Museum Visitors’ Behaviors. In PCM 2009: Advances in Multimedia Information Processing; Springer: Berlin/Heidelberg, Germany, 2009; pp. 144–154. [Google Scholar] [CrossRef]
- Lin, S.; Chou, S. Museum Visitor Routing Problem with the Balancing of Concurrent Visitors. In Complex Systems Concurrent Engineering; Springer: London, UK, 2017; pp. 345–353. [Google Scholar] [CrossRef]
- Saha, N.; Shareef Ifthekhar, M.; Le, N.T.; Jang, Y.M. Survey on optical camera communications: Challenges and opportunities. IET Optoelectron. 2015, 9, 172–183. [Google Scholar] [CrossRef]
- Ghassemlooy, Z.; Zvanovec, S.; Khalighi, M.A.; Popoola, W.O.; Perez, J. Optical wireless communication systems. Optik 2017, 151, 1–6. [Google Scholar] [CrossRef]
- Ashok, A.; Gruteser, M.; Mandayam, N.; Silva, J.; Varga, M.; Dana, K. Challenge: Mobile Optical Networks through Visual MIMO. In Proceedings of the Sixteenth Annual International Conference on Mobile Computing and Networking, Chicago, IL, USA, 20–24 September 2010; pp. 105–112. [Google Scholar] [CrossRef]
- Ashok, A.; Gruteser, M.; Mandayam, N.; Kwon, T.; Yuan, W.; Varga, M.; Dana, K. Rate Adaptation in Visual MIMO. In Proceedings of the 2011 8th Annual IEEE Communications Society Conference on Sensor, Mesh and Ad Hoc Communications and Networks (SECON), Salt Lake City, UT, USA, 27–30 June 2011; pp. 583–591. [Google Scholar] [CrossRef]
- Ashok, A.; Gruteser, M.; Mandayam, N.; Dana, K. Characterizing multiplexing and diversity in visual MIMO. In Proceedings of the IEEE 2011 45th Annual Conference on Information Sciences and Systems (CISS), Baltimore, MD, USA, 23–25 March 2011; pp. 1–6. [Google Scholar] [CrossRef]
- Yuan, W.; Dana, K.; Varga, M.; Ashok, A.; Gruteser, M.; Mandayam, N. Computer vision methods for visual MIMO optical system. In Proceedings of the CVPR 2011 WORKSHOPS, Colorado Springs, CO, USA, 20–25 June 2011; pp. 37–43. [Google Scholar] [CrossRef]
- Varga, M.; Ashok, A.; Gruteser, M.; Mandayam, N.; Yuan, W.; Dana, K. Visual MIMO based led-camera communication applied to automobile safety. In Proceedings of the 9th International Conference on Mobile Systems, Applications, and Services, Bethesda, MD, USA, 28 June–1 July 2011; pp. 383–384. [Google Scholar] [CrossRef]
- Kim, J.E.; Kim, J.W.; Kim, K.D. LEA detection and tracking method for color-independent visual-MIMO. Sensors 2016, 16, 1027. [Google Scholar] [CrossRef] [PubMed]
- Manikanda, C.; Neelamegam, P.; Wilfred, A.A. Visual-MIMO for vehicle to vehicle communications. In Proceedings of the IEEE 2017th Microelectronic Devices, Circuits and Systems (ICMDCS), Vellore, India, 10–12 August 2017; pp. 1–6. [Google Scholar] [CrossRef]
- Tan, J.J.; Zou, C.Q.; Du, S.H.; Tan, J.T. Simulation of MIMO channel characteristics for indoor visible light communication with LEDs. Optik 2014, 125, 44–49. [Google Scholar] [CrossRef]
- Yuan, W.; Dana, K.J.; Ashok, A.; Gruteser, M.; Mandayam, N.B. Spatially varying radiometric calibration for camera-display messaging. In Proceedings of the 2013th IEEE Global Conference on Signal and Information Processing, Austin, TX, USA, 3–5 December 2013; pp. 763–766. [Google Scholar] [CrossRef]
- Manikandan, C.; Neelamegam, P.; Rakesh Kumar, S.; Sai Siva Satwik, K. A novel visual SISO and MIMO computer Interface for process production system. Int. J. Mech. Prod. Eng. Res. Dev. 2018, 8, 181–188. [Google Scholar] [CrossRef]
- Yuan, W.; Dana, K.; Ashok, A.; Gruteser, M.; Mandayam, N. Dynamic and invisible messaging for visual MIMO. In Proceedings of the IEEE Global Conference on Signal and Information Processing, Austin, TX, USA, 3–5 December 2013; pp. 346–352. [Google Scholar] [CrossRef]
- Jambhekar, N.; Dhawale, C.; Hegadi, R. Performance Analysis of Digital Image Steganographic Algorithm. In Proceedings of the International Conference on Information and Communication Technology for Competitive Strategies, Rajasthan, India, 14–16 November 2014; pp. 1–7. [Google Scholar] [CrossRef]
- Sidhik, S.; Sudheer, S.; Pillai, V.M. Performance and analysis of high capacity steganography of color images involving wavelet transform. Optik 2015, 126, 3755–3760. [Google Scholar] [CrossRef]
- Sai Siva Satwik, K.; Manikandan, C.; Elamaran, V.; Narasimhan, K.; Raju, N. An adaptive row-column least significant bit inlay approach for image steganography. Biomed. Res. 2017, 28, 10216–10222. [Google Scholar]
- Manikandan, C.; Sai Siva Satwik, K.; Rakesh Kumar, S.; Neelamegam, P.; Venkatesh, S. Performance Analysis of Visual MIMO Communication System with Various Transform Domain Embedding Algorithms. In Proceedings of the International Conference on Electrical Sciences, Osaka, Japan, 8–9 August 2018; pp. 1–6. [Google Scholar]
- Liu, W.; Zhang, Z.; Li, S.; Tao, D. Road detection by using a generalized hough transform. Remote Sens. 2017, 9, 590. [Google Scholar] [CrossRef]
- Jeong, J.M.; Yoon, T.S.; Park, J.B. Kalman filter based multiple objects detection-tracking algorithm robust to occlusion. In Proceedings of the SICE Annual Conference (SICE), Sapporo, Japan, 9–12 September 2014; pp. 941–946. [Google Scholar] [CrossRef]


| Pattern | Key |
|---|---|
| SU | 000 |
| SD | 001 |
| SF | 010 |
| SB | 011 |
| FU | 100 |
| FD | 101 |
| FF | 110 |
| FB | 111 |
| Parameter | IWT/ARC | IWT | DWT | DCT | DFT |
|---|---|---|---|---|---|
| AD | 0.0298 | 0.0312 | 0.0487 | 0.0692 | 0.0724 |
| AAD | 0.6843 | 0.7574 | 0.7728 | 0.7822 | 0.7218 |
| IF | 0.9942 | 0.9870 | 0.9870 | 0.9868 | 0.9765 |
| MSE | 0.4815 | 0.6155 | 0.6602 | 0.6596 | 0.7432 |
| RMSE | 0.6939 | 0.7845 | 0.8125 | 0.8122 | 0.8621 |
| PSNR | 51.3048 | 50.238 | 49.934 | 49.938 | 48.775 |
| NK | 0.9985 | 0.9971 | 0.9973 | 0.9969 | 0.9965 |
| BER | 0.0198 | 0.0287 | 0.0288 | 0.0288 | 0.0315 |
| SSIM | 0.9886 | 0.9816 | 0.9714 | 0.9715 | 0.9843 |
| R | 0.9997 | 0.9989 | 0.9989 | 0.9989 | 0.9989 |
| SC | 0.9915 | 0.9868 | 0.9860 | 0.9859 | 0.9824 |
| Specification | Value |
|---|---|
| Resolution | 13 Mega Pixels |
| Frame Rate | 30 Frames per second |
| Width of the captured image | 4160 pixels |
| Height of the captured image | 3120 pixels |
| Algorithm | Cover Image 1 | Cover Image 2 | Cover Image 3 | Cover Image 4 |
|---|---|---|---|---|
| DFT | 94.6 | 95.2 | 94.9 | 95.3 |
| DCT | 93.4 | 93.2 | 93.6 | 94.0 |
| DWT | 95.8 | 96.8 | 95.6 | 95.7 |
| IWT | 96.2 | 97.1 | 96.6 | 97.2 |
| IWT/ARC | 96.8 | 97.3 | 97.6 | 97.6 |
| Block Size | 4 × 4 | 8 × 8 | 16 × 16 |
|---|---|---|---|
| Accuracy (%) | 91.1 | 97.6 | 98.2 |
| Bit Rate (bits/s) | 11,664,000 | 2,916,000 | 729,000 |
| Cover Images | Time Complexity in ms | |||
|---|---|---|---|---|
| Command1 = ‘NO’ | Command2 = ‘A1’ | Command3 = ‘A2’ | Average | |
| Image 1 | 94.7769 | 93.8743 | 95.7877 | 94.8130 |
| Image 2 | 91.0290 | 91.1963 | 90.7975 | 91.0076 |
| Image 3 | 96.1845 | 94.0191 | 96.7095 | 95.6377 |
| Image 4 | 94.5715 | 91.6055 | 93.0815 | 93.0862 |
| Mean | 93.6361 | |||
© 2018 by the authors. Licensee MDPI, Basel, Switzerland. This article is an open access article distributed under the terms and conditions of the Creative Commons Attribution (CC BY) license (http://creativecommons.org/licenses/by/4.0/).
Share and Cite
Manikandan, C.; Rakesh Kumar, S.; Sai Siva Satwik, K.; Neelamegam, P.; Narasimhan, K.; Raju, N. An Integrated Object Tracking and Covert Visual MIMO Communication Service for Museum Security System Using Single Vision Sensor. Appl. Sci. 2018, 8, 1918. https://doi.org/10.3390/app8101918
Manikandan C, Rakesh Kumar S, Sai Siva Satwik K, Neelamegam P, Narasimhan K, Raju N. An Integrated Object Tracking and Covert Visual MIMO Communication Service for Museum Security System Using Single Vision Sensor. Applied Sciences. 2018; 8(10):1918. https://doi.org/10.3390/app8101918
Chicago/Turabian StyleManikandan, C., S. Rakesh Kumar, K. Sai Siva Satwik, P. Neelamegam, K. Narasimhan, and N. Raju. 2018. "An Integrated Object Tracking and Covert Visual MIMO Communication Service for Museum Security System Using Single Vision Sensor" Applied Sciences 8, no. 10: 1918. https://doi.org/10.3390/app8101918
APA StyleManikandan, C., Rakesh Kumar, S., Sai Siva Satwik, K., Neelamegam, P., Narasimhan, K., & Raju, N. (2018). An Integrated Object Tracking and Covert Visual MIMO Communication Service for Museum Security System Using Single Vision Sensor. Applied Sciences, 8(10), 1918. https://doi.org/10.3390/app8101918