Article

Chronic Obstructive Pulmonary Disease Warning in the Approximate Ward Environment

1
Xi’an Jiaotong University Health Science Center, Xi’an 710061, China
2
School of Electronic Engineering, Xidian University, Xi’an 710071, China
3
School of Engineering, University of Glasgow, Scotland G12 8QQ, UK
*
Author to whom correspondence should be addressed.
The authors contributed equally to the work.
Appl. Sci. 2018, 8(10), 1915; https://doi.org/10.3390/app8101915
Submission received: 23 August 2018 / Revised: 1 October 2018 / Accepted: 8 October 2018 / Published: 15 October 2018
(This article belongs to the Special Issue Wearable Wireless Devices)

Abstract

:
This research presents the usage of modern 5G C-Band sensing for health care monitoring. The focus of this research is to monitor the respiratory symptoms for COPD (Chronic Obstructive Pulmonary Disease). The C-Band sensing is used to detect the respiratory conditions, including normal, abnormal breathing and coughing of a COPD patient by utilizing the simple wireless devices, including a desktop system, network interface card, and the specified tool for the extraction of wireless channel information with Omni directional antenna operating at 4.8 GHz frequency. The 5G sensing technique enhances the sensing performance for the health care sector by monitoring the amplitude information for different respiratory activities of a patient using the above-mentioned devices. This method examines the rhythmic breathing patterns obtained from C-Band sensing and digital respiratory sensor and compared the result.

1. Introduction

The future of the health sector is very much influenced by the modern 5G wireless sensing technology. The wireless sensing technology is making medical practice very convenient for medical staff by providing remote monitoring facilities to the patients at different locations. In this way, the patient does not need to move from location to location for the monitoring or detection of disease; with the wireless sensing equipment, one can manage and record the blood pressure, heart rate, and breathing pattern of the patient. The 5G sensing using C-band [1,2] is the latest technology which is helpful for any kind of sensing need, especially for the health sector. The health sector is focusing on the usage of Information and Communication Technology (ICT) to improve the patient experience and to minimize the health services cost.
Dysfunction of the cardiorespiratory system can be due to Chronic Obstructive Pulmonary Disease (COPD), arteriosclerosis and asthma. The C-band wireless technology allows the health sector to monitor the patients with these chronic diseases, especially COPD. COPD is the most common respiratory condition involving the airways and characterized by airflow limitation [3]. With COPD, the airways become obstructed and the lungs do not empty properly, leading the air to be trapped inside the lungs. So, people with COPD usually have lower Forced Vital Capacity (FVC). The change in the respiratory system is noticeable by measuring the forced expiratory volume in 1 s (FEV1). In COPD, the FEV1 level becomes lower as compared with FVC. The signs and symptoms of COPD include wheezing, caused by the opening of small airways, hypoxemia (low oxygen level in the blood), hypercapnia (high level of carbon dioxide in the blood), Dyspnea, chronic cough and sputum production and chest tightness. The main cause of COPD is smoking. Other causes include the exposure to different lung irritants, including dust, air pollution etc.
The morbidity rate increases in COPD patients at the age of 40 [4,5]. Worldwide, it is the 4th leading cause of death and it is increasing nowadays. In COPD, maintaining the breathing rate is very important for good health. Respiratory activity is an important parameter for measuring the health of any person [6]. COPD is a progressive disease and with the passage of time without any early detection or diagnosis, it leads to death. Early detection of the disease by careful monitoring of the symptoms reduces the severity of the disease. In COPD, the breathing pattern of a patient becomes worse with the passage of time so there must be some procedure or technique to measure the breathing pattern for diagnosis. The most common breathing monitoring system is invasive monitoring, which requires physical contact with the patient’s body.
Non-invasive breathing monitoring is becoming more popular in the health sector by overcoming the drawbacks of traditional invasive systems. Radio frequency techniques is the leading method due to the effective monitoring of very sensitive and small breathing patterns. There are many other techniques for this like Doppler radar, which is used to measure the shift in the signal reflected from the human body [7]. Faith Erden et al. [6], detect the breathing by using IR sensors and Accelerometer signals. In [8] Wenda Li et al. measure the breathing pattern using passive radar system, which is also a non-contact breathing monitoring system. In [9], Abdelnaseer et al. show the usage of Ubi-Breathe for the harnesses of the (received signal strength indicator) RSSI on WiFi devices. Another approach which proposed the idea of using a (channel state information) CSI-based breathing monitoring system is [10] by Liu et al. This proposes the technique for respiratory monitoring and utilizes periodogram for spectral analysis due to this method requiring longer duration for completing the task.
In our work we propose a non-invasive technique to measure the breathing patterns and coughing of COPD patients. This system can monitor the patient in a timely manner and can carefully detect breathing activity and coughing. Our system leverages the usage of wireless devices operating at 4.8 GHz frequency, Omni directional antenna connected with RF signal generator and the network interface card (NIC) for the 5G wireless technology. The breathing activity and coughing induces different imprints for wireless channel information (WCI), which helped in the monitoring of breathing patterns of patients. We also used an invasive sensor for monitoring breathing and compared the results with WCI data.
The organization of the paper is as follows. Section 1 introduces COPD, Section 2 presents the fundamentals of breathing, Section 3 explains the implementation of the proposed system with C-Band, Section 4 mentions the monitoring of breathing and its analysis, Section 5 explains the Spearman’s rank correlation and Section 6 explains the conclusion.
Table 1 shows the comparison of different approaches to monitor the breathing activities of the human body. Our approach is more feasible for monitoring respiratory activities by utilizing less equipment and C-Band 5G technology.

2. Fundamentals of Breathing

Breathing sound has a complex nature, which drags it to the higher order statistical analysis (HOSA). For this, the spectral, respiratory and phase components are involved [15]. The specific function known as Bi-coherence is used for this analysis.
γ 3 ( s 1 , s 2 ) = | B ( s 1 , s 2 ) | 2 P ( s 1 ) P ( s 2 ) P ( s 1 + s 2 )  
where the B ( s 1 , s 2 ) is represented as bi-spectrum for the process { X ( n ) } and is shown as,
B n ( s 1 , s 2 ) = X n ( s 1 ) X n ( s 2 ) X n * ( s 1 + s 2 )  
where X n ( s i ) ,   i = 1 , 2 is called the complex coefficient for the process { X ( n ) } at some frequencies s i and the X * ( s i ) represents the complex conjugate [15]. On the other hand, P ( s i ) ,   i = 1 ,   2 is the representation of the power spectrum at the given frequencies   s i [15]
P n ( s ) = | X n ( s ) | 2  
The process phase structure is the defining point for the bi-coherence function. There is the quadrature phase coupling in the signal due to some nonlinearities so through the magnitude of bi-coherence function, | γ 3 ( s 1 , s 2 ) | we can measure the quadrature phase coupling.
The nonlinearities result in the quadrature phase coupling and the reason for the occurrence is the presence of s1 and s2 with their corresponding phase φ1 and φ2 in the main signal with other frequency component s 3 = s 1 ± s 2 and its corresponding phase φ 3 = φ 1 ± φ 2 . The bi-coherence index has a boundary between 0 and 1. According to this, if the magnitude of (Bi-coherence function) BF is equal to 1 then there exists phase coupling between the frequency components and if the magnitude of BF is equal to 0, then there will be 0 coupling [16].
The skewness coefficient calculation is the main process involved in the analysis for the breathing sound. It is represented as,
c 3 = K 3 σ 2  
σ 2 Represents the variance and K3 represents the third order cumulate.

2.1. WCI System Dynamics

WCI has a unique response without the environmental dynamics and the subcarrier a at some given time t represents the channel information denoted as Ha (t),
H a ( t ) = l = 1 M ζ l e j 2 π L 1 λ a + e a ( t )  
Here a represents the subcarriers and M represents the total number of multipath components, ζ l representing the complex gain for the multipath components, L represents the length for the multipath components and λa represents [17] the wavelength for a and given by,
λ a = c f c + a N D F T T s  
Here c represents the speed of light, carrier frequency is denoted by fc, Ts represents the total sampling interval and the size of Discrete Fourier Transform is given by NDFT. The noise signal is considered as thermal noise and can be represented as e a ( t ) . The delays and gains of multipath components have time invariant nature.

2.2. WCI System with Breathing

The time invariance property of multipath components also holds for breathing. Assuming only one multipath component got affected by breathing, from [18] we can write that,
ζ 1 ( t ) = ζ 1 ( 1 + Δ L 1 L 1 sin θ sin 2 π b 60 t + ϕ ) ψ  
In Equation (7), ζ 1 gives us the gain of the multipath component (MPC) number 1 and L1 gives the length for that MPC. The breathing causes the MPC 1 to be displaced or change its position and is represented by Δ L 1 . The path loss exponent is represented by ψ and the angle between the EM wave and the subject is represented by θ. The breathing rate is also very important and measured in breath per minute and represented by b and the breathing initial phase is represented by ϕ.
Breathing shows significant effects on the MPC 1 and varies its path length L1(t), which is represented as,
L 1 ( t ) = L 1 + Δ L 1 sin θ sin ( 2 π b 60 t + ϕ )  
The channel information which we showed in Equation (5) will be represented as,
H a ( t ) = ζ 1 e j 2 π L 1 ( t ) λ a + l = 2 M ζ l e j 2 π L l λ a + e a ( t )  
Further explanation of Equation (9) is shown as,
H a ( t ) = ζ 1 e j 2 π L 1 ( t ) λ a e j 2 π Δ L 1 sin θ sin ( 2 π b 60 t + ϕ ) λ a + l = 2 M ζ l e j 2 π L l λ a + e a ( t )  
Jacobi-anger expansion plays an important role in Equation (10) and by decomposing the first term of Equation (10) into finite summation [19], we get,
e j 2 π Δ L 1 sin θ sin ( 2 π b 60 t + ϕ ) λ a = n = ( 1 ) n J n ( v a ) e j n 2 π b 60 t e j n ϕ  
The value for v a = 2 π sin θ Δ L 1 / λ a and the nth order Bessel function is shown as Jn (z) with argument z.
The practice shows that if the value of |n| ≥ 2 then the function Jn ( v a ) decays in faster manner by giving the ordinary v a values. With this information our Equation (11) shows the approximation with the values of n as ±1 and the DC component where n = 0. So, the new Ha (t) can be represented as,
H a ( t ) ζ 1 e j 2 π L 1 λ a n = 1 + 1 ( 1 ) n J n ( v a ) e j n 2 π b 60 t e j n ϕ U a + l = 2 M ζ l e j 2 π L l λ a + e a ( t ) T I a  
In the above equation, the Ua represents the signal for the monitoring of breathing activity on the subcarrier a. On the other hand, time invariant part is represented by TIa, which exists as the response of a static environment and is considered as the interference.

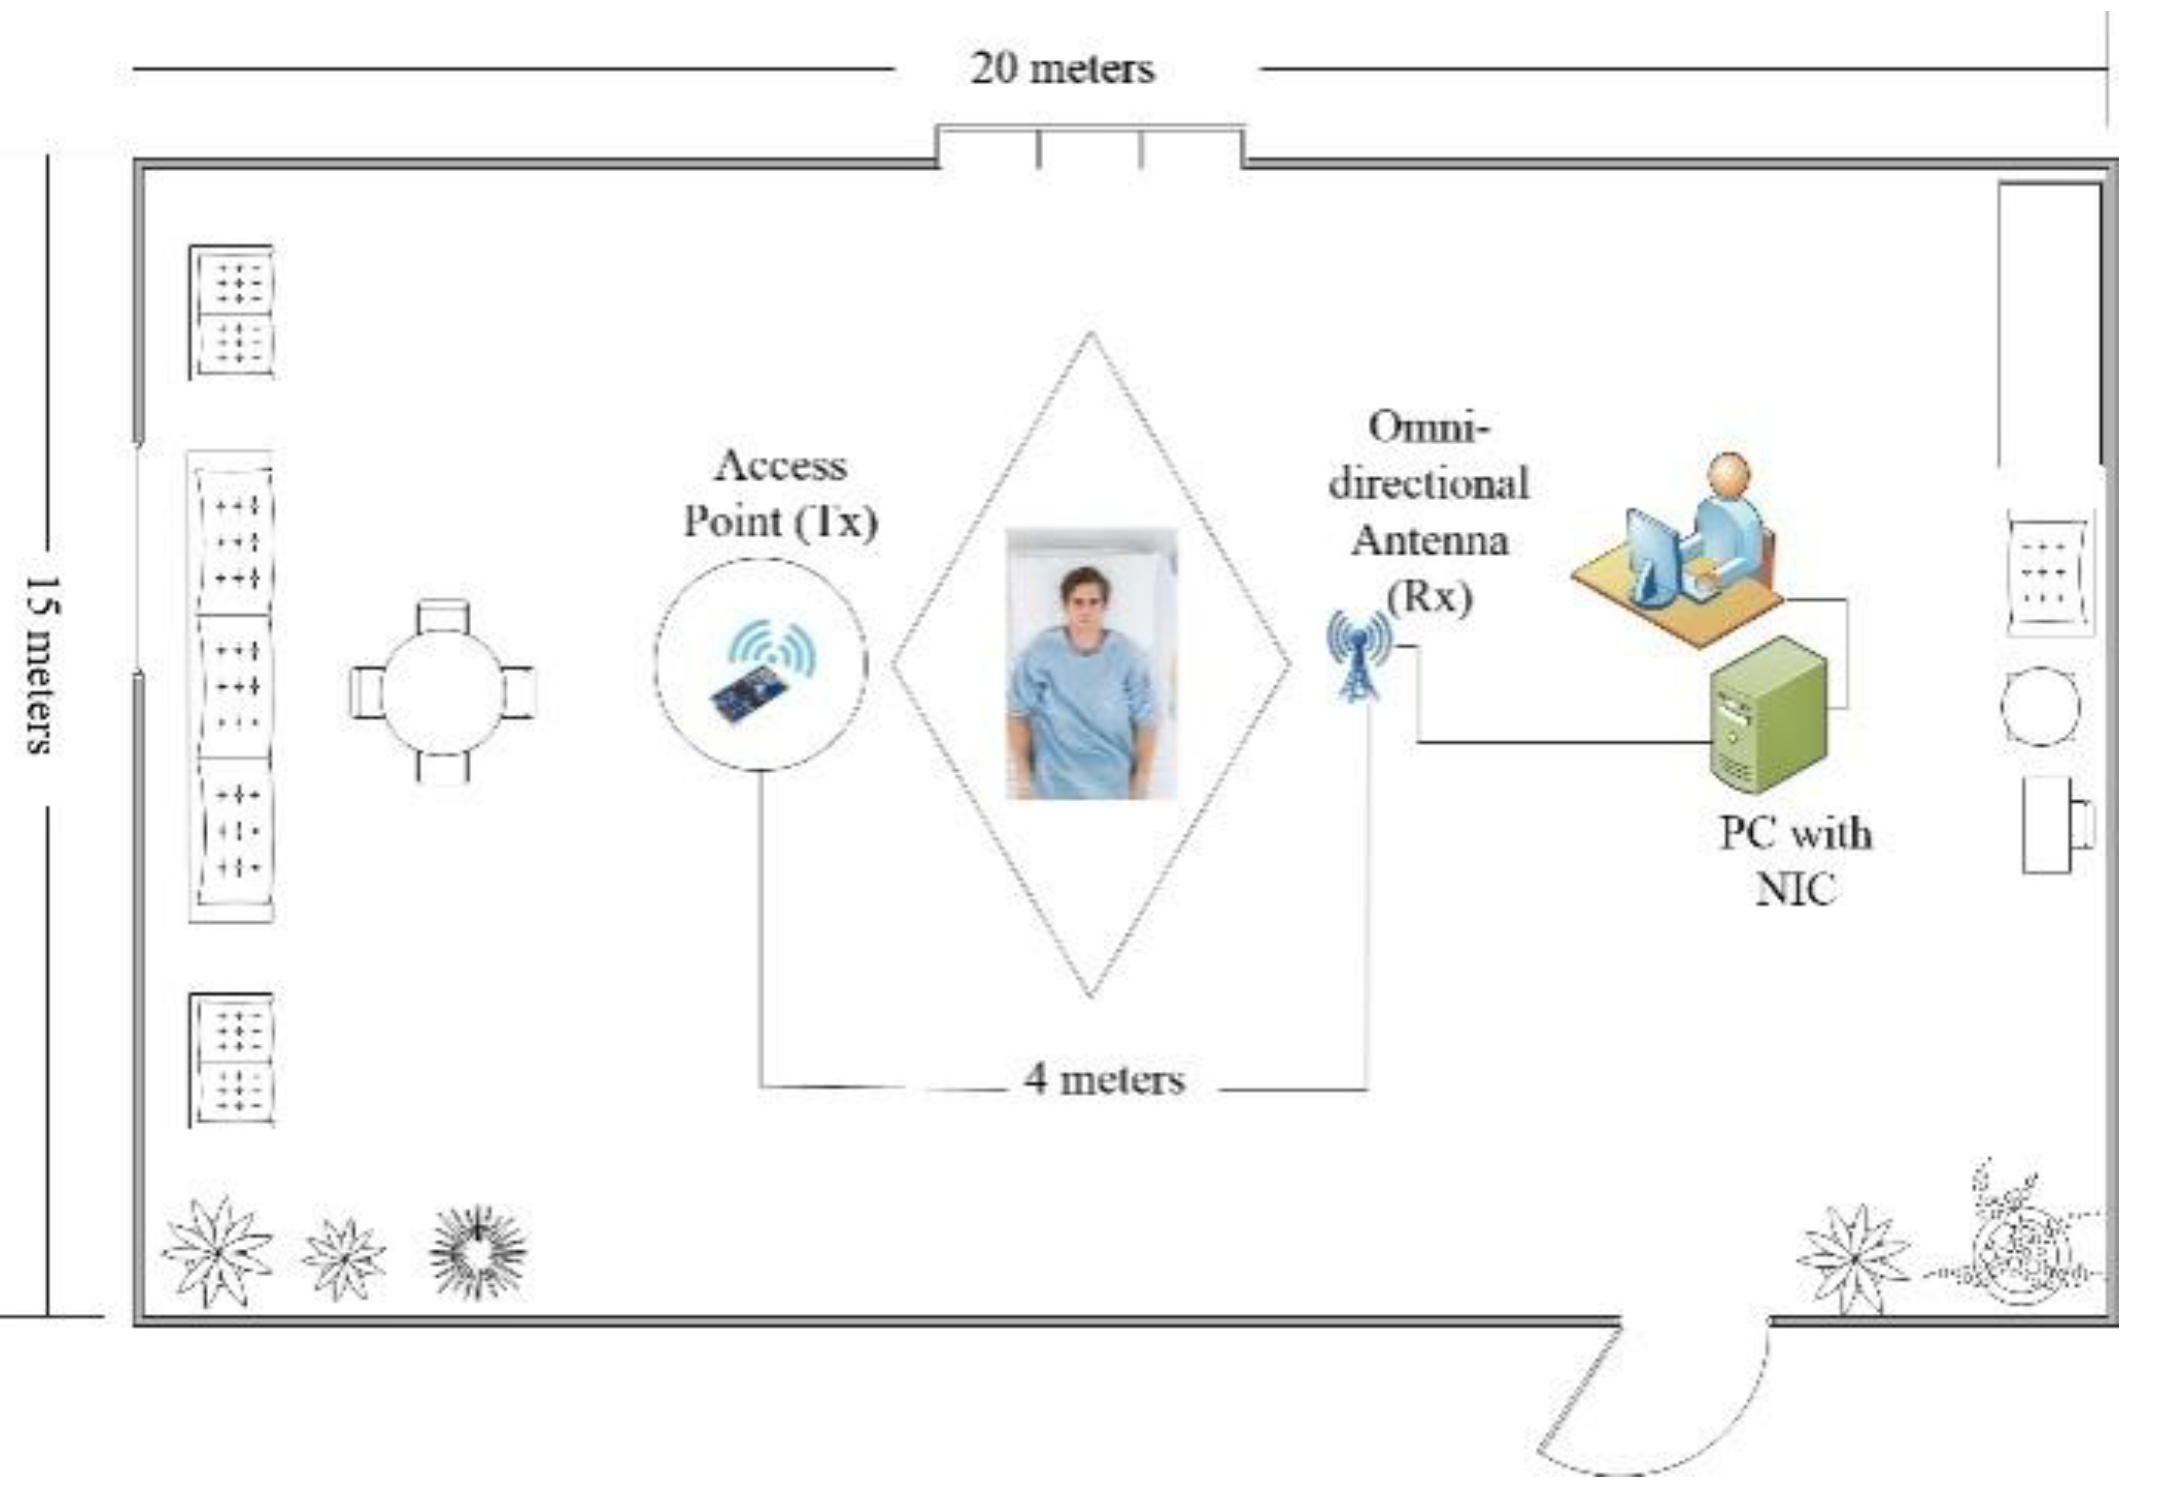
3. Design Implementation and C-Band Sensing

In a communication link, the channel properties must be known in advance, which could be analyzed with the help of wireless channel information (WCI). There exist multiple effects like scattering, fading, and multipath propagation [20], which affect the WCI of RF signal and which propagate between transmitter and receiver. The RF signal could be represented as follows,
H ( a ) = | | H ( a ) | | e ( b H ( a ) )  
In Equation (13) H(a) represents the WCI and the phase and amplitude are represented as, ||H(a)|| and H(a) respectively. This experiment was performed using C-Band operating at 4.8 GHz frequency. In our research we have used an RF signal generator (DSG 3060) connected to an omnidirectional antenna (Rubber duck) at the transmitter side with an output power of 100 mW (20 dBm) and with typical phase noise of <−110 dBc/Hz at 20 KHz. This antenna propagates the RF signal to 360 degrees horizontally with ¼ dipole length of 26 mm. At the receiver side, a desktop mounted with network interface card (MCX416A-BCAT), worked as a receiver. The experiment was performed in different indoor environments. We used microwave absorbing material to reduce the multipath propagation. The WCI then extracted [21] using this NIC mounted in a modified desktop PC. The NIC card revealed only 30 subcarriers’ information represented as single WCI packet. After successful pinging of an AP, we received 10 WCI packets per second. The received WCI was in the form of matrix of 30 × 1 represented as channel frequency response (CFR) and shown as,
C F R ( 30 x 1 ) m a t r i x = [ h 1 , h 2 , , h n ]  
In the above equation the h 1 represents the CFR of subcarrier number 1 and h n represents the CFR for the 30th subcarrier as there are only 30 subcarriers.
Figure 1 shows the experimental settings for the proposed methodology. We have adjusted the distance between the devices and patient according to system feasibility. The height of the transmitter, receiver and patient was adjusted around 1.5 m from the ground and 4.5 m from the ceiling. The total height to the ceiling is 6 m from the ground.
We obtained the raw WCI for breathing activity of a person imitating a COPD patient. There are 30 subcarriers in total but for the correct breathing information subcarrier #19 and 21 show better results for normal and abnormal breathing and for coughing, subcarrier number 7 gives a reasonable result. We examined all 30 subcarriers [22] and compared their results with our digital respiratory sensor. We performed that experiment multiple times and in all cases the mentioned subcarriers showed better results very near to the digital respiratory sensor’s results. In our research we focused on the efficient monitoring of breathing by exploiting the 5G technology. As C-Band is operating on 4.8 GHz frequency, it can be easily integrated with the 5G system. The internet of things (IoTs) operate at a similar frequency band. This way we can easily perform the efficient spectrum utilization regarding 5G. Table 2 shows the numbers of subjects involved in the experiment.

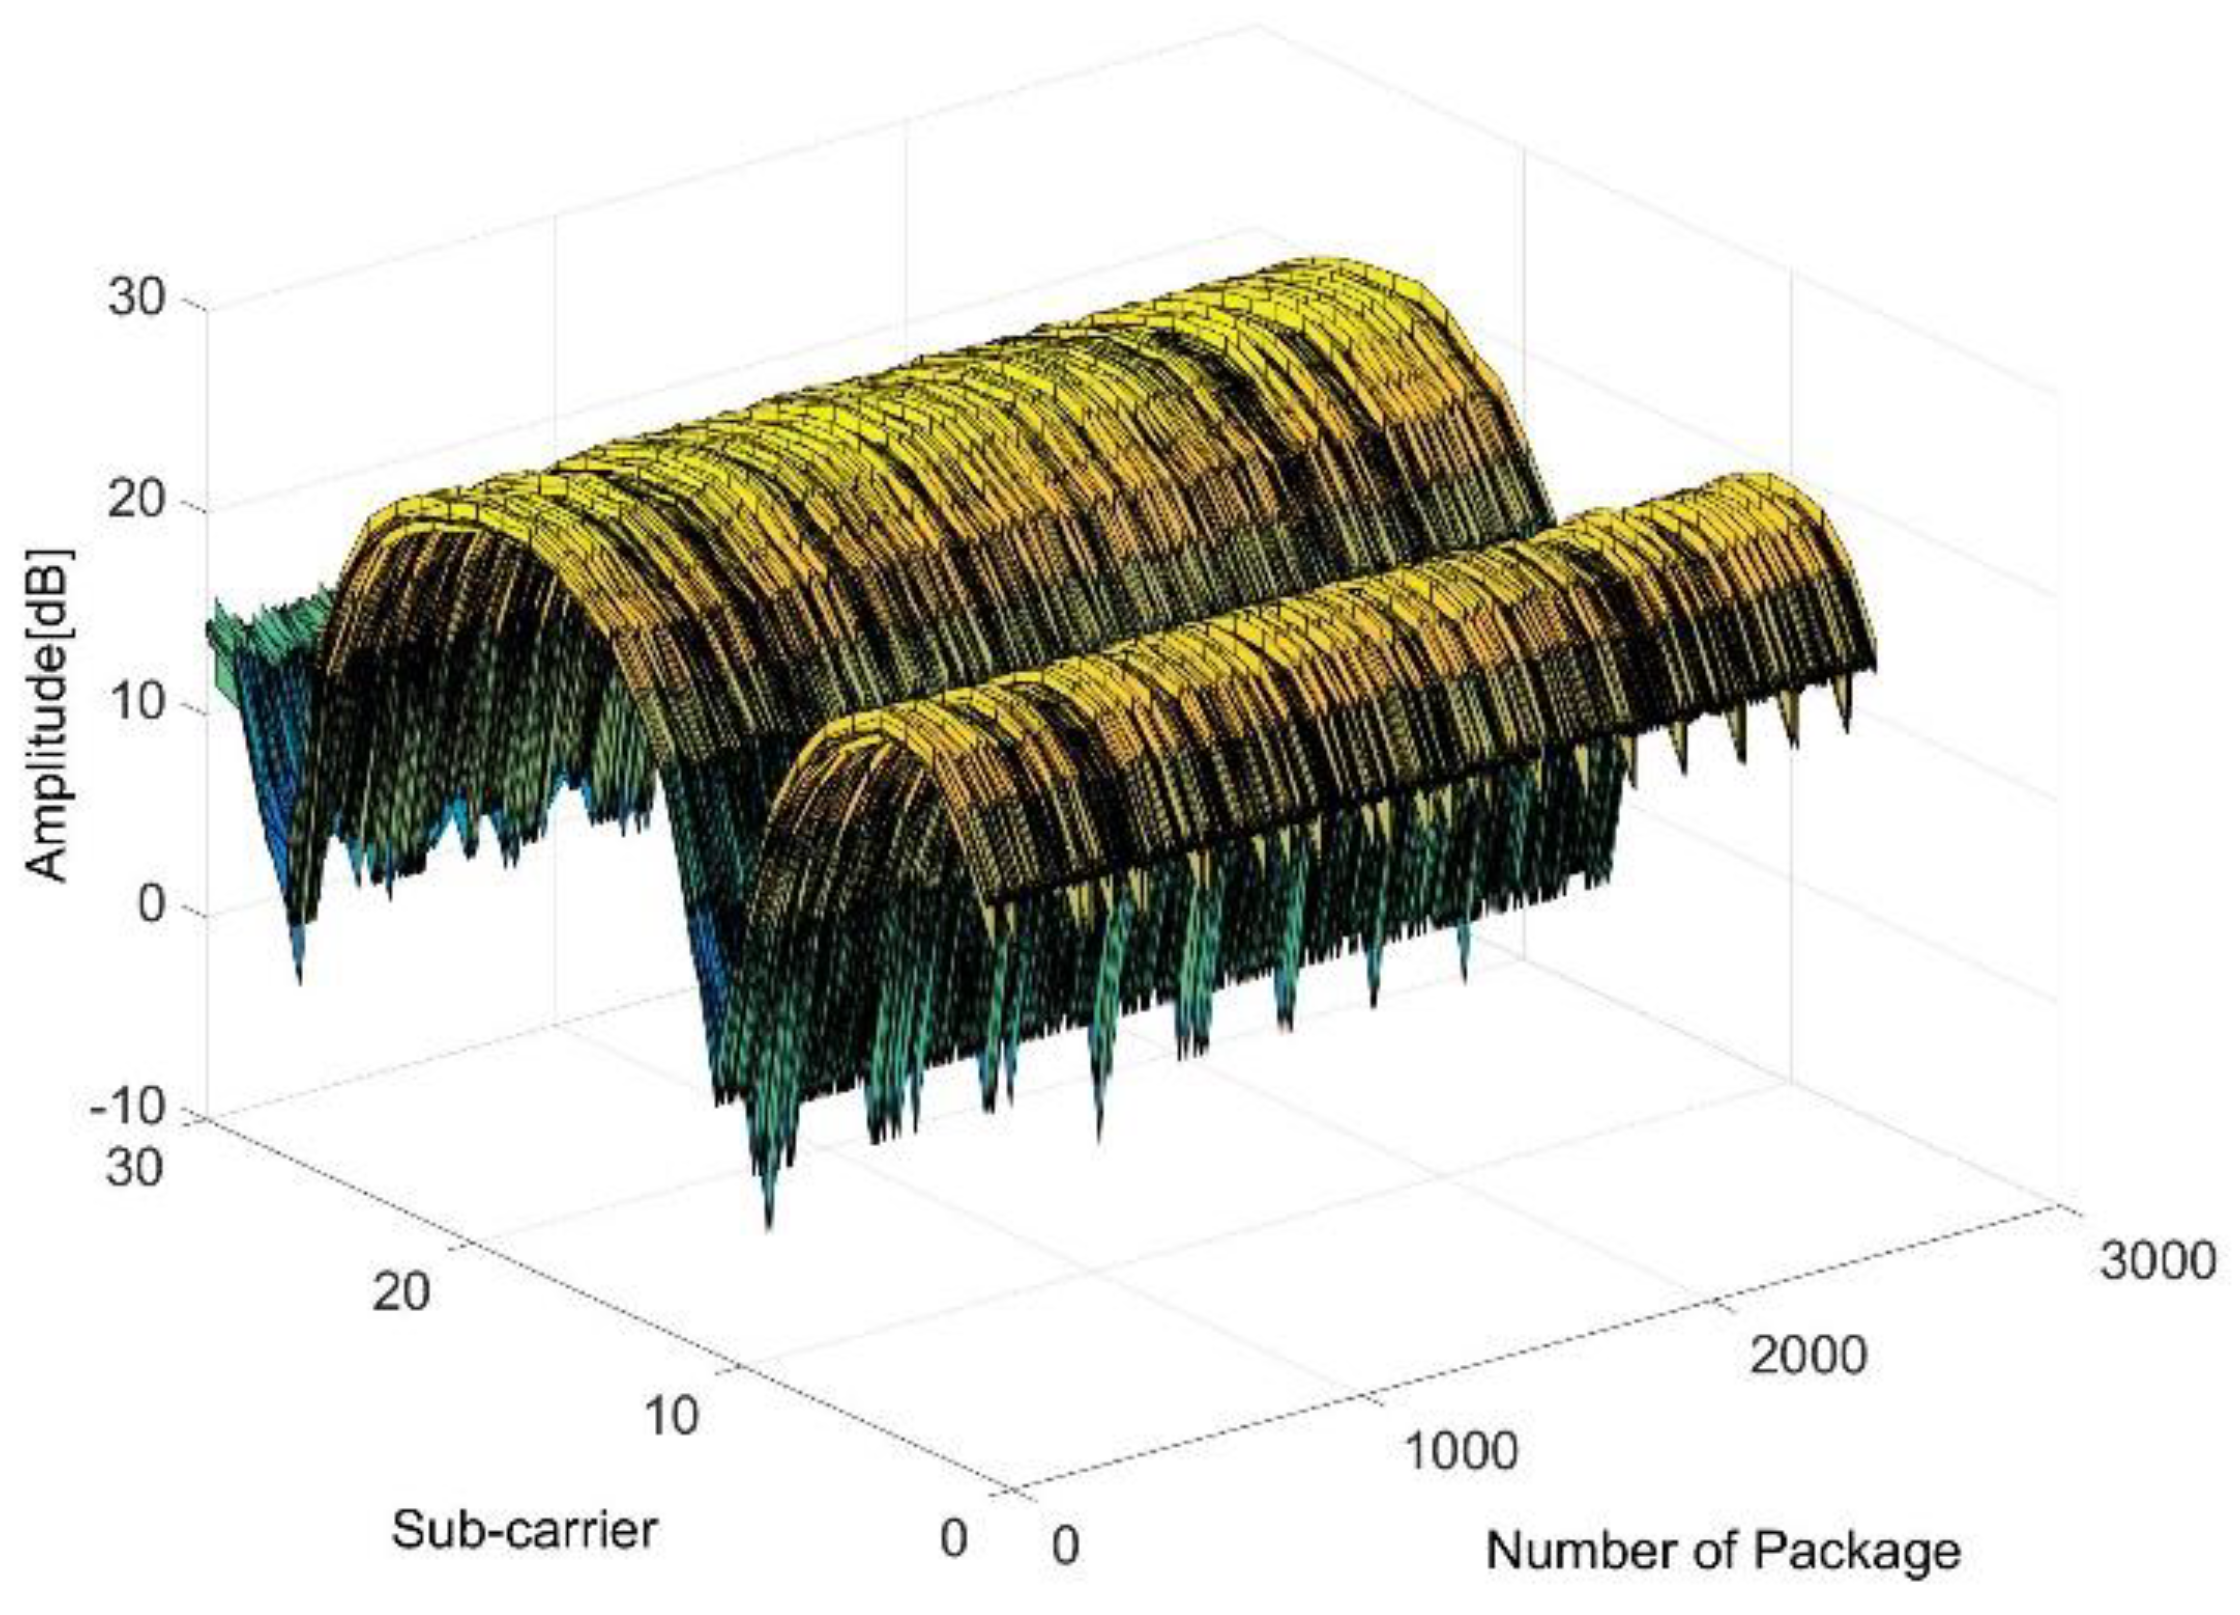
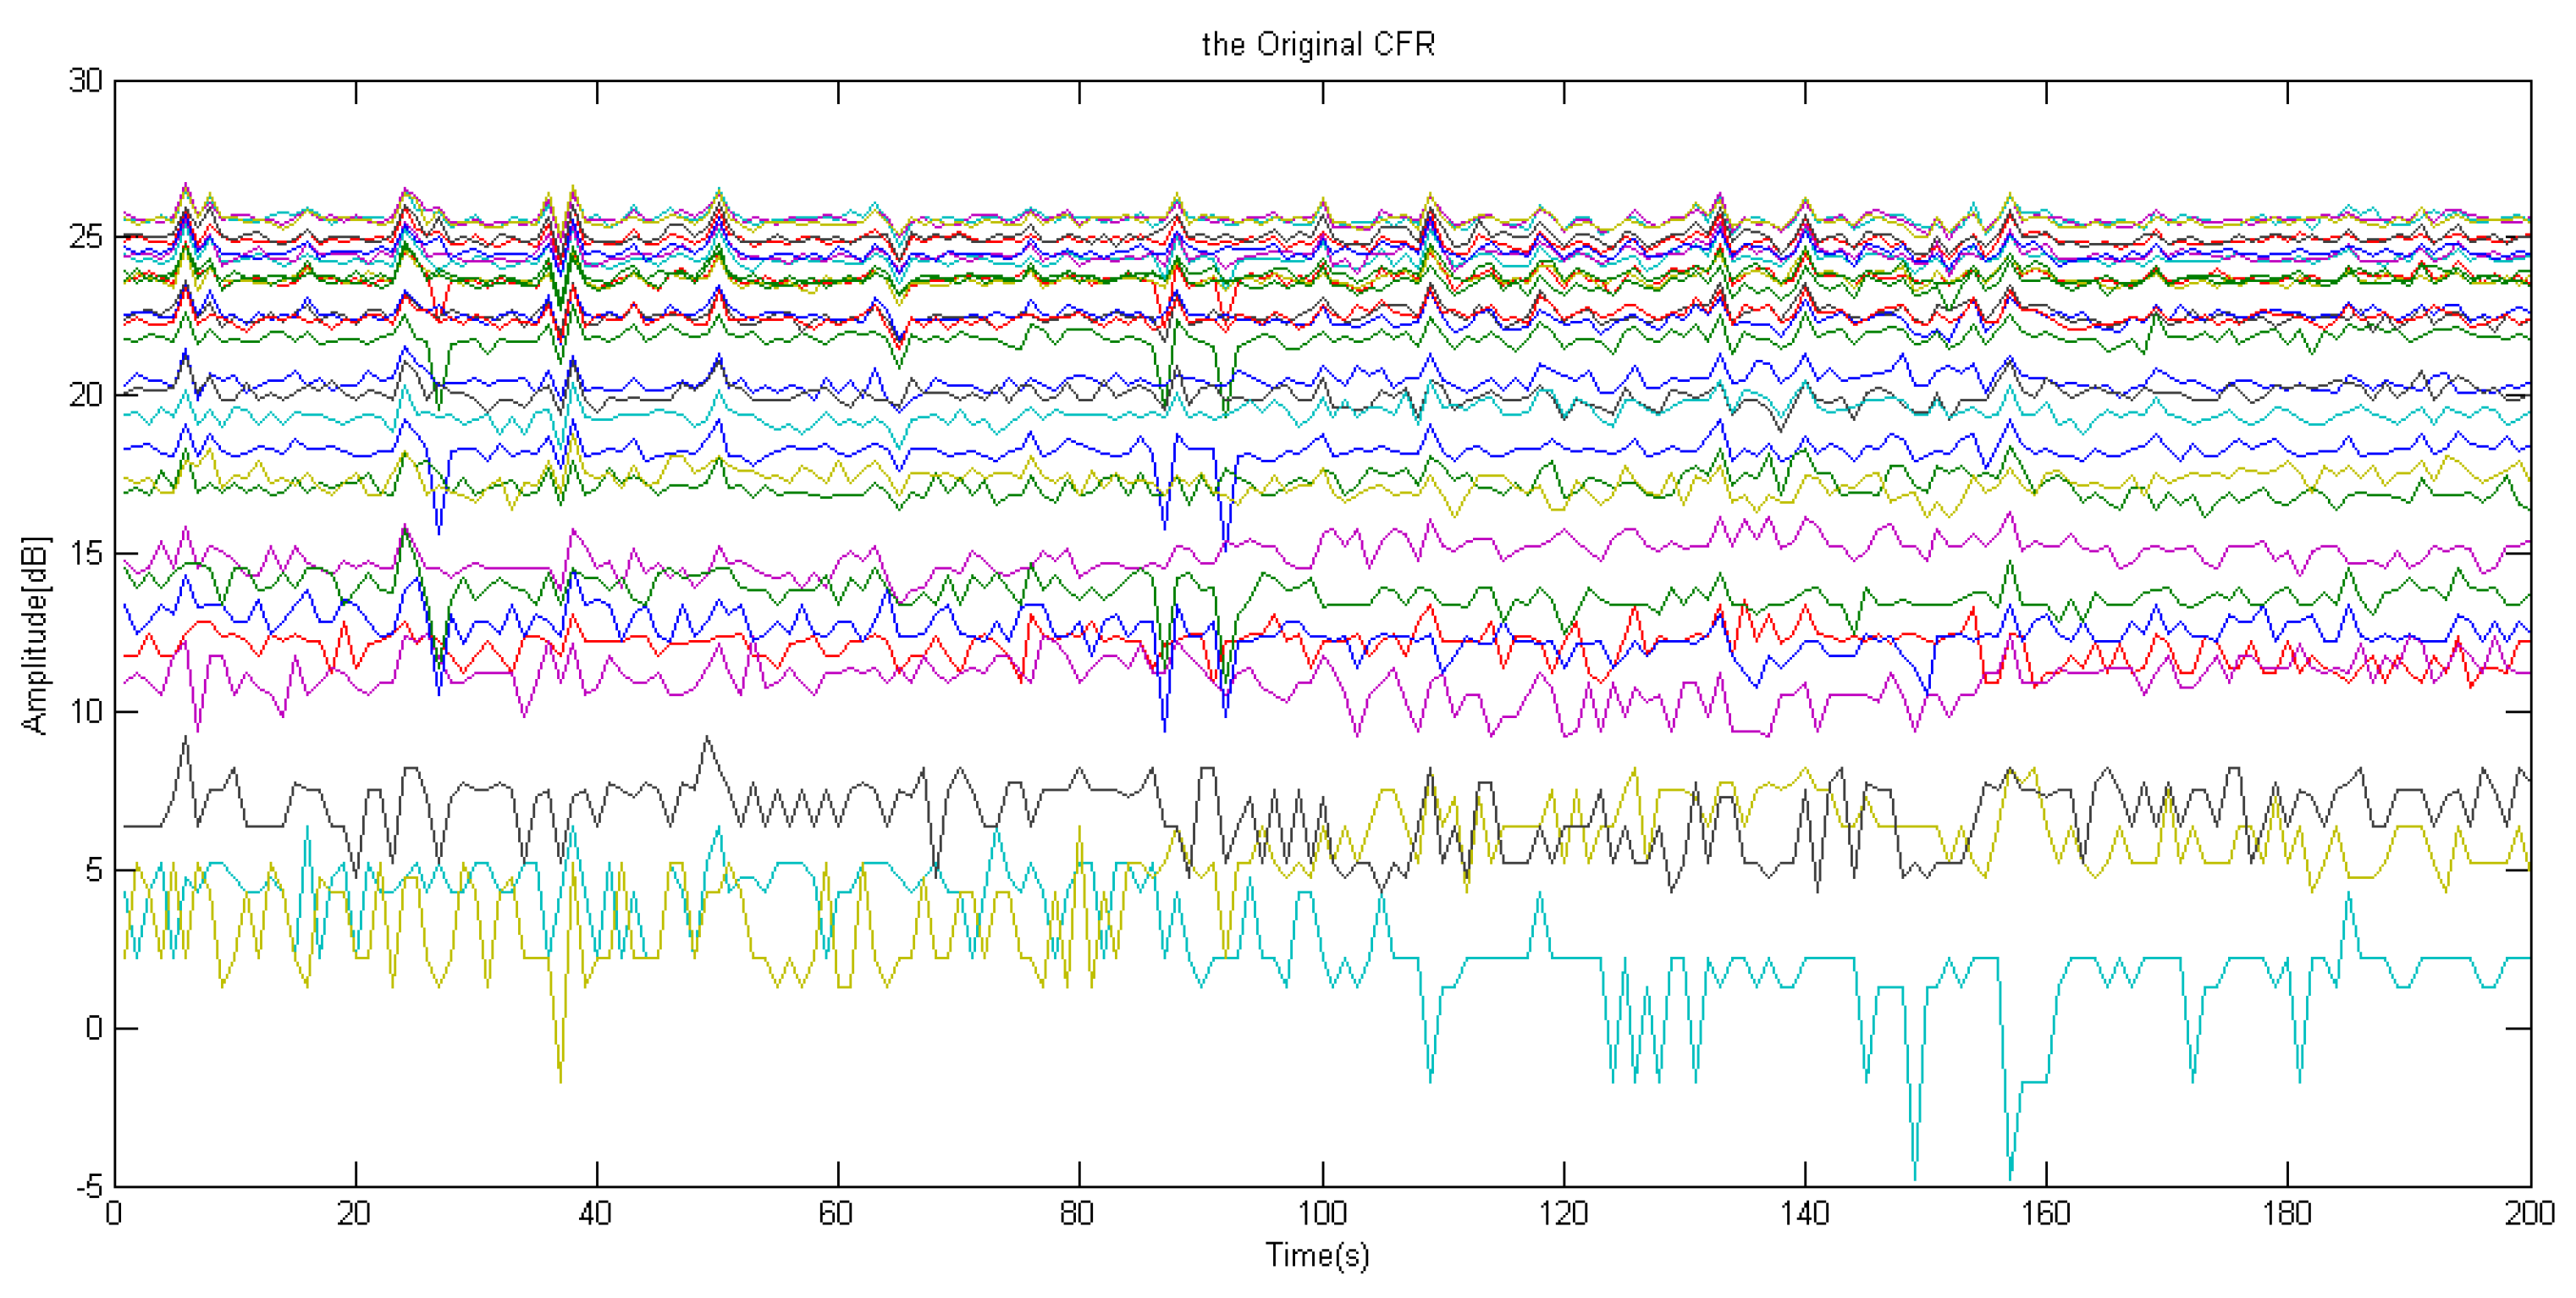
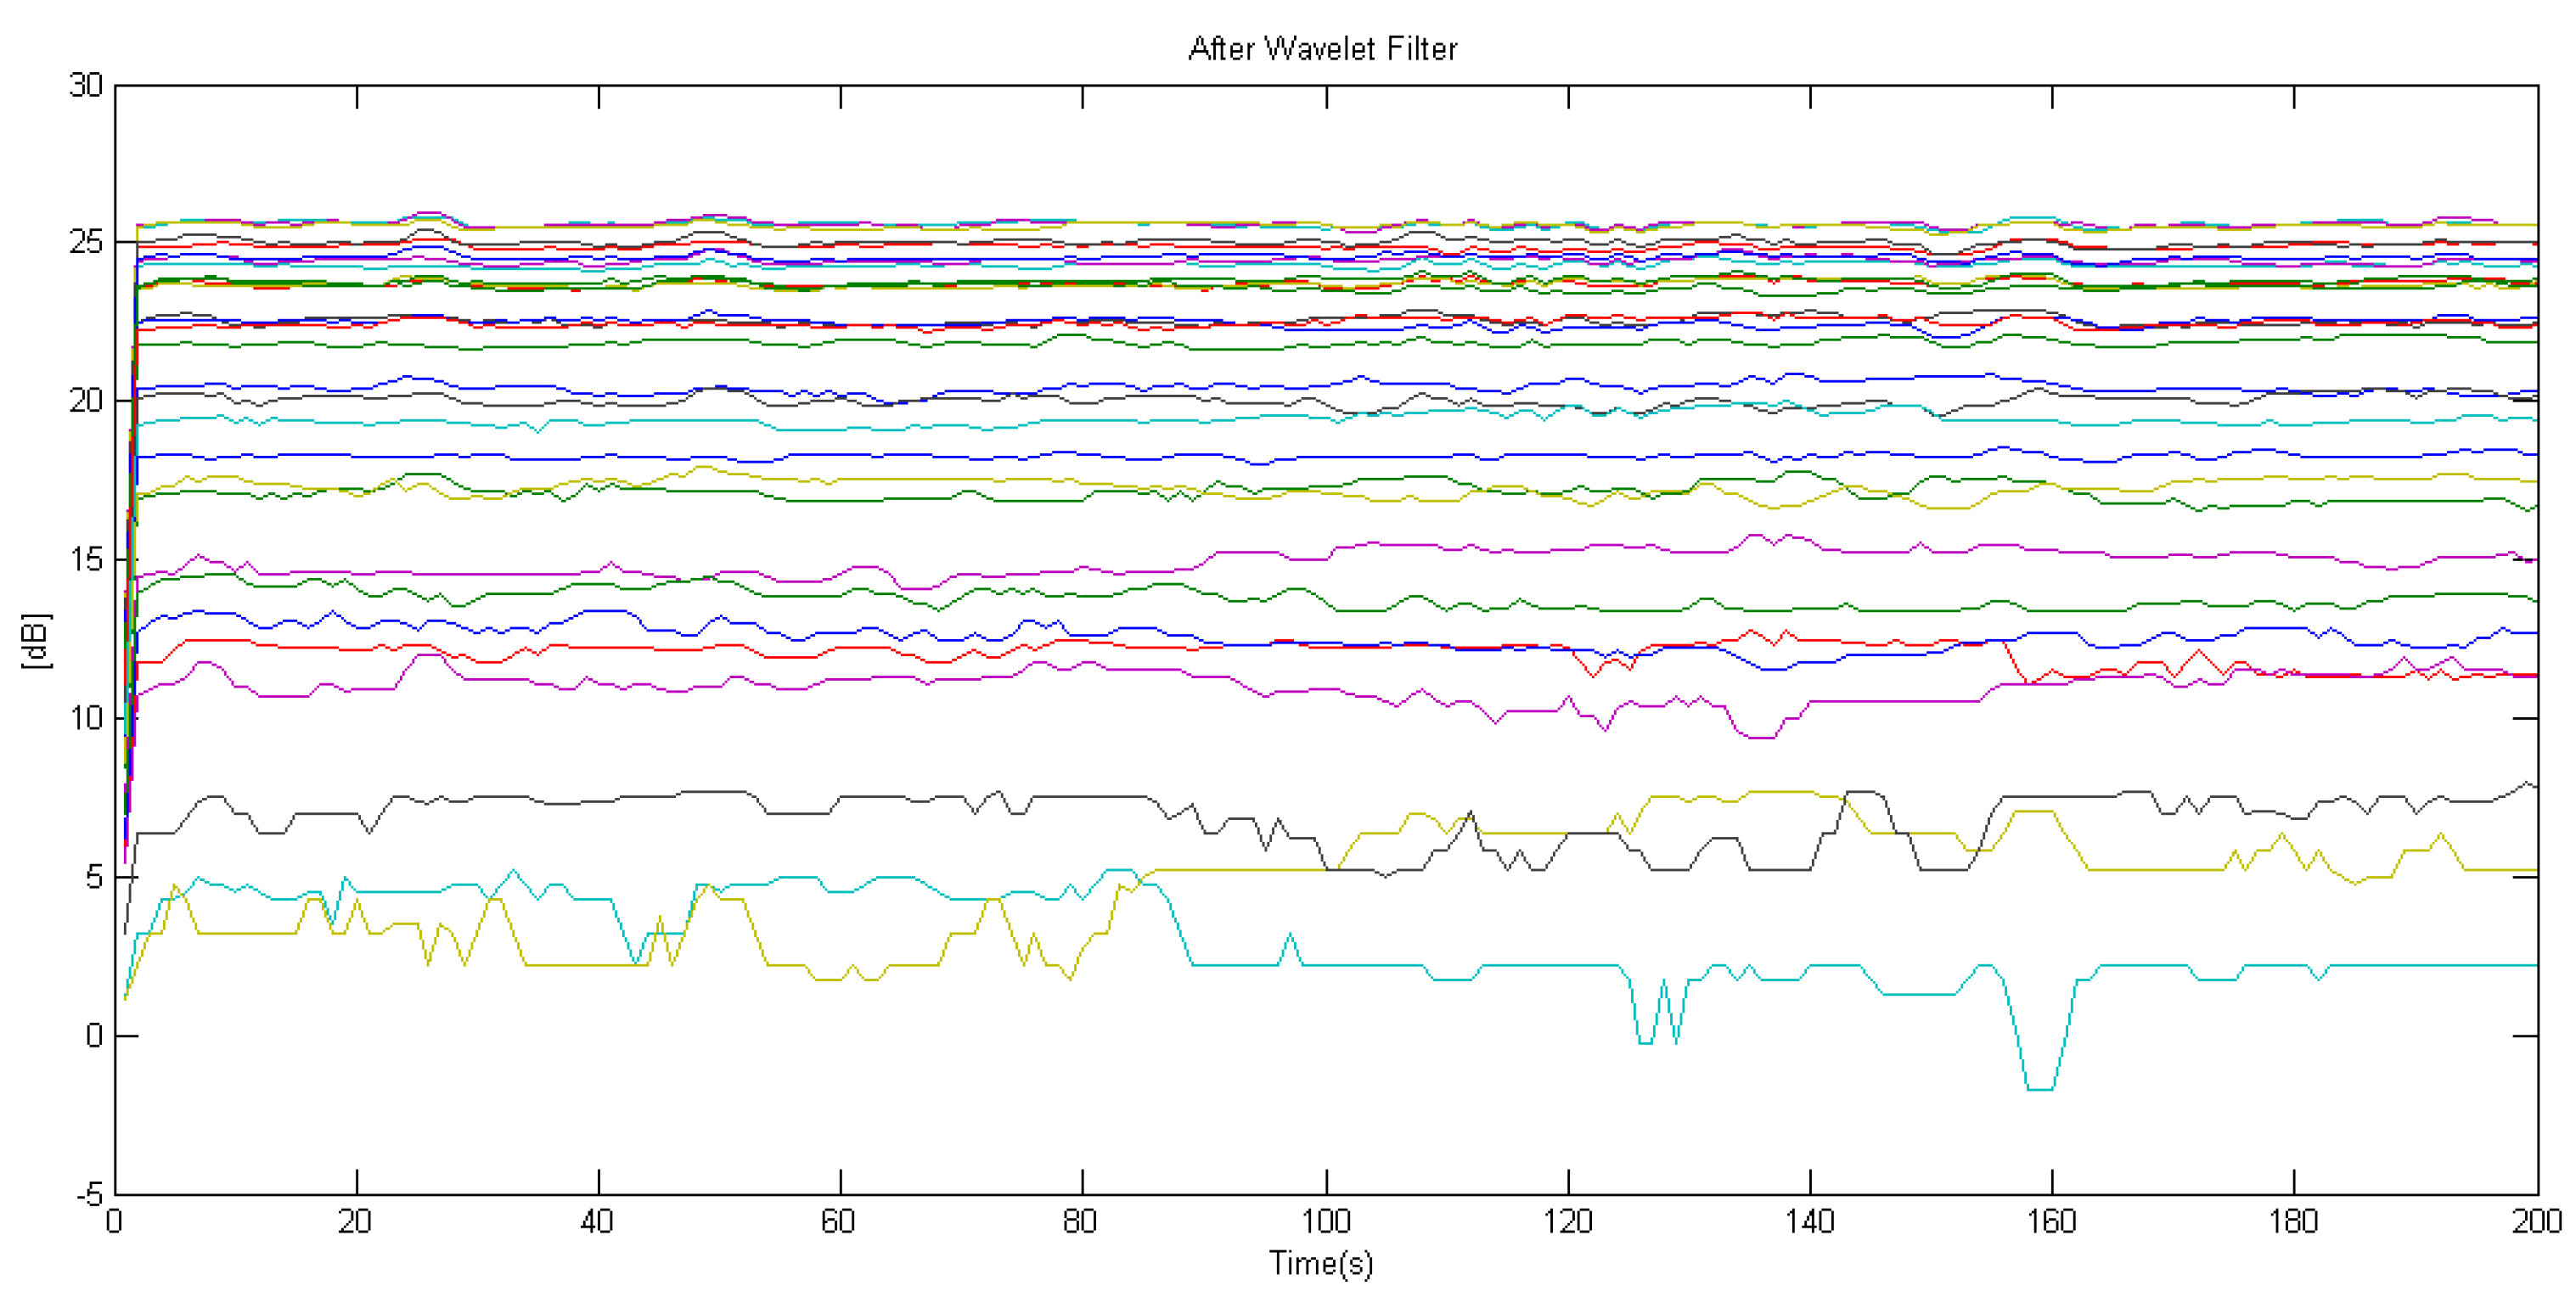
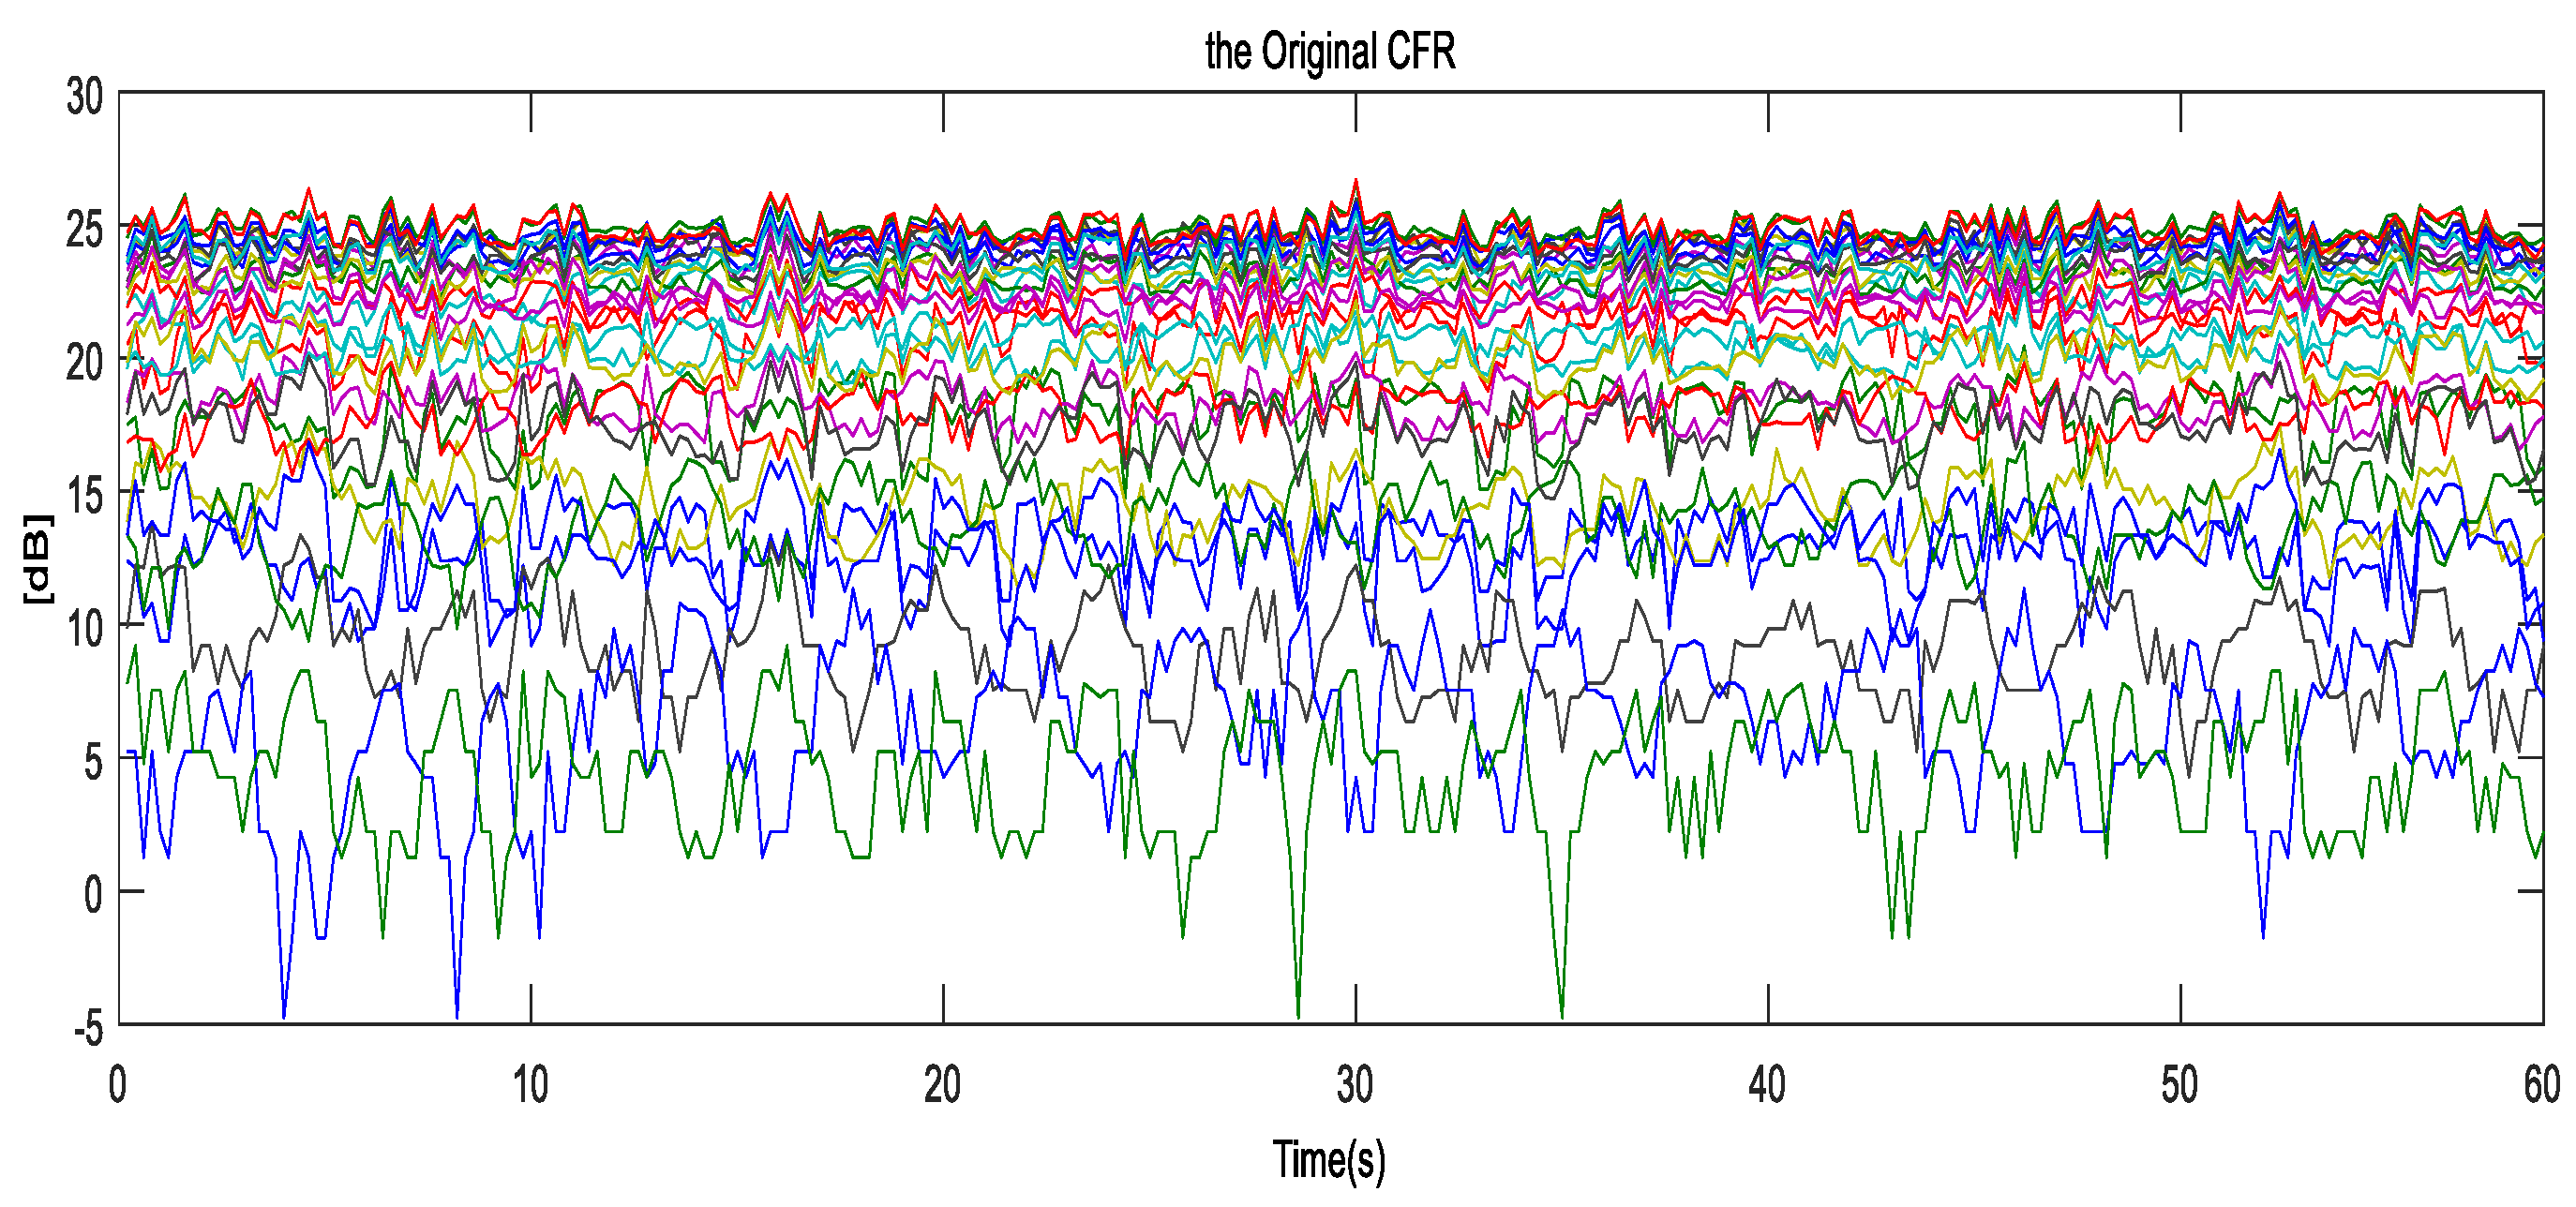
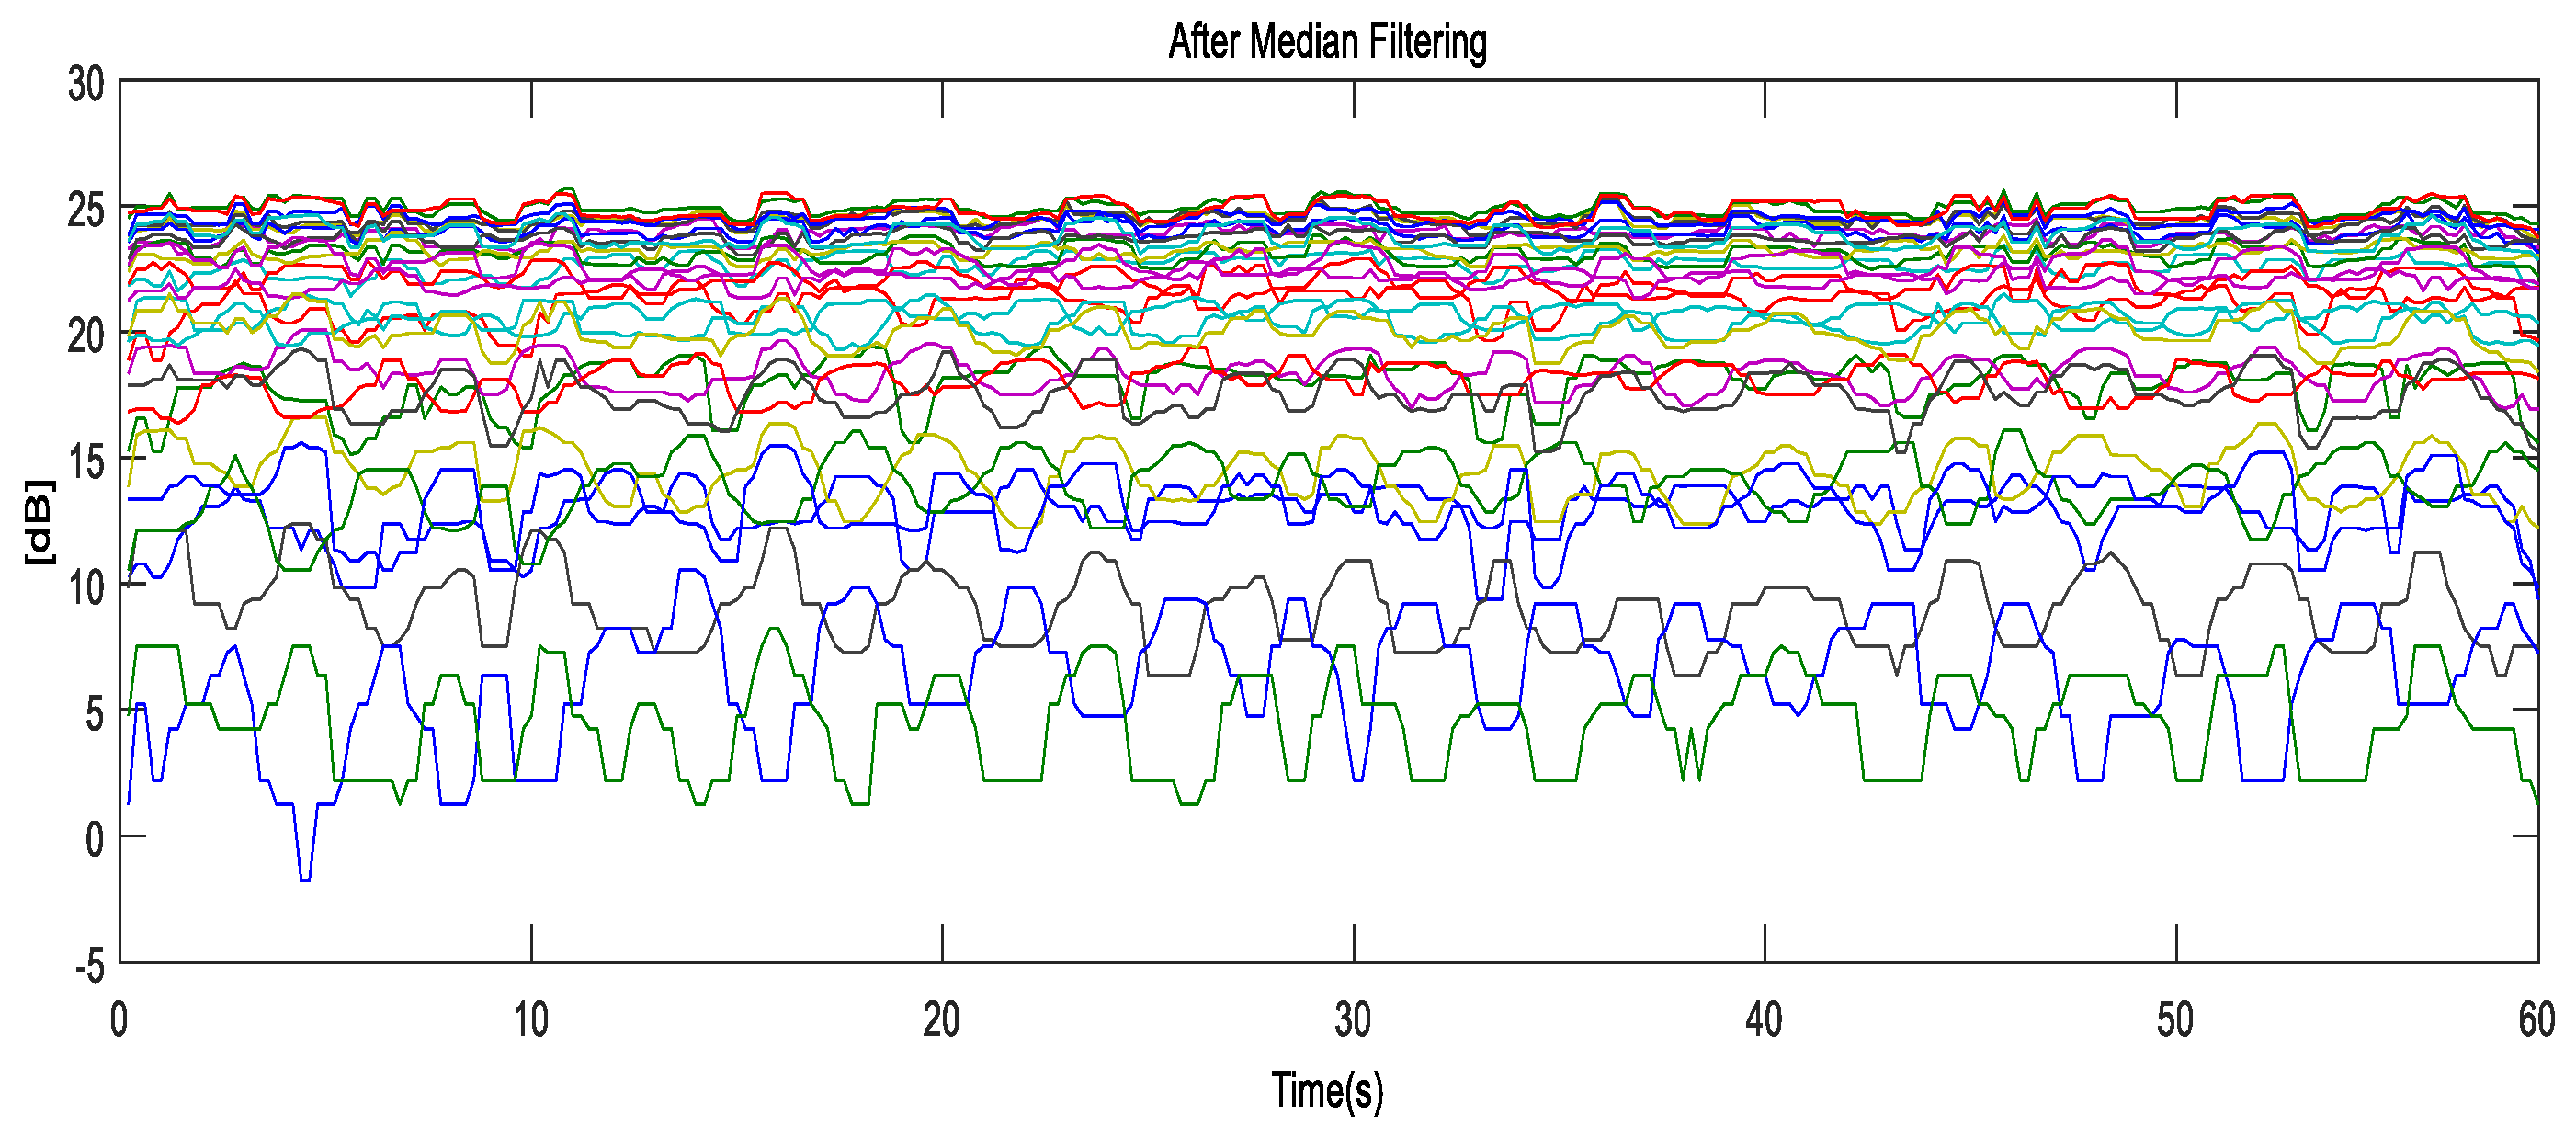
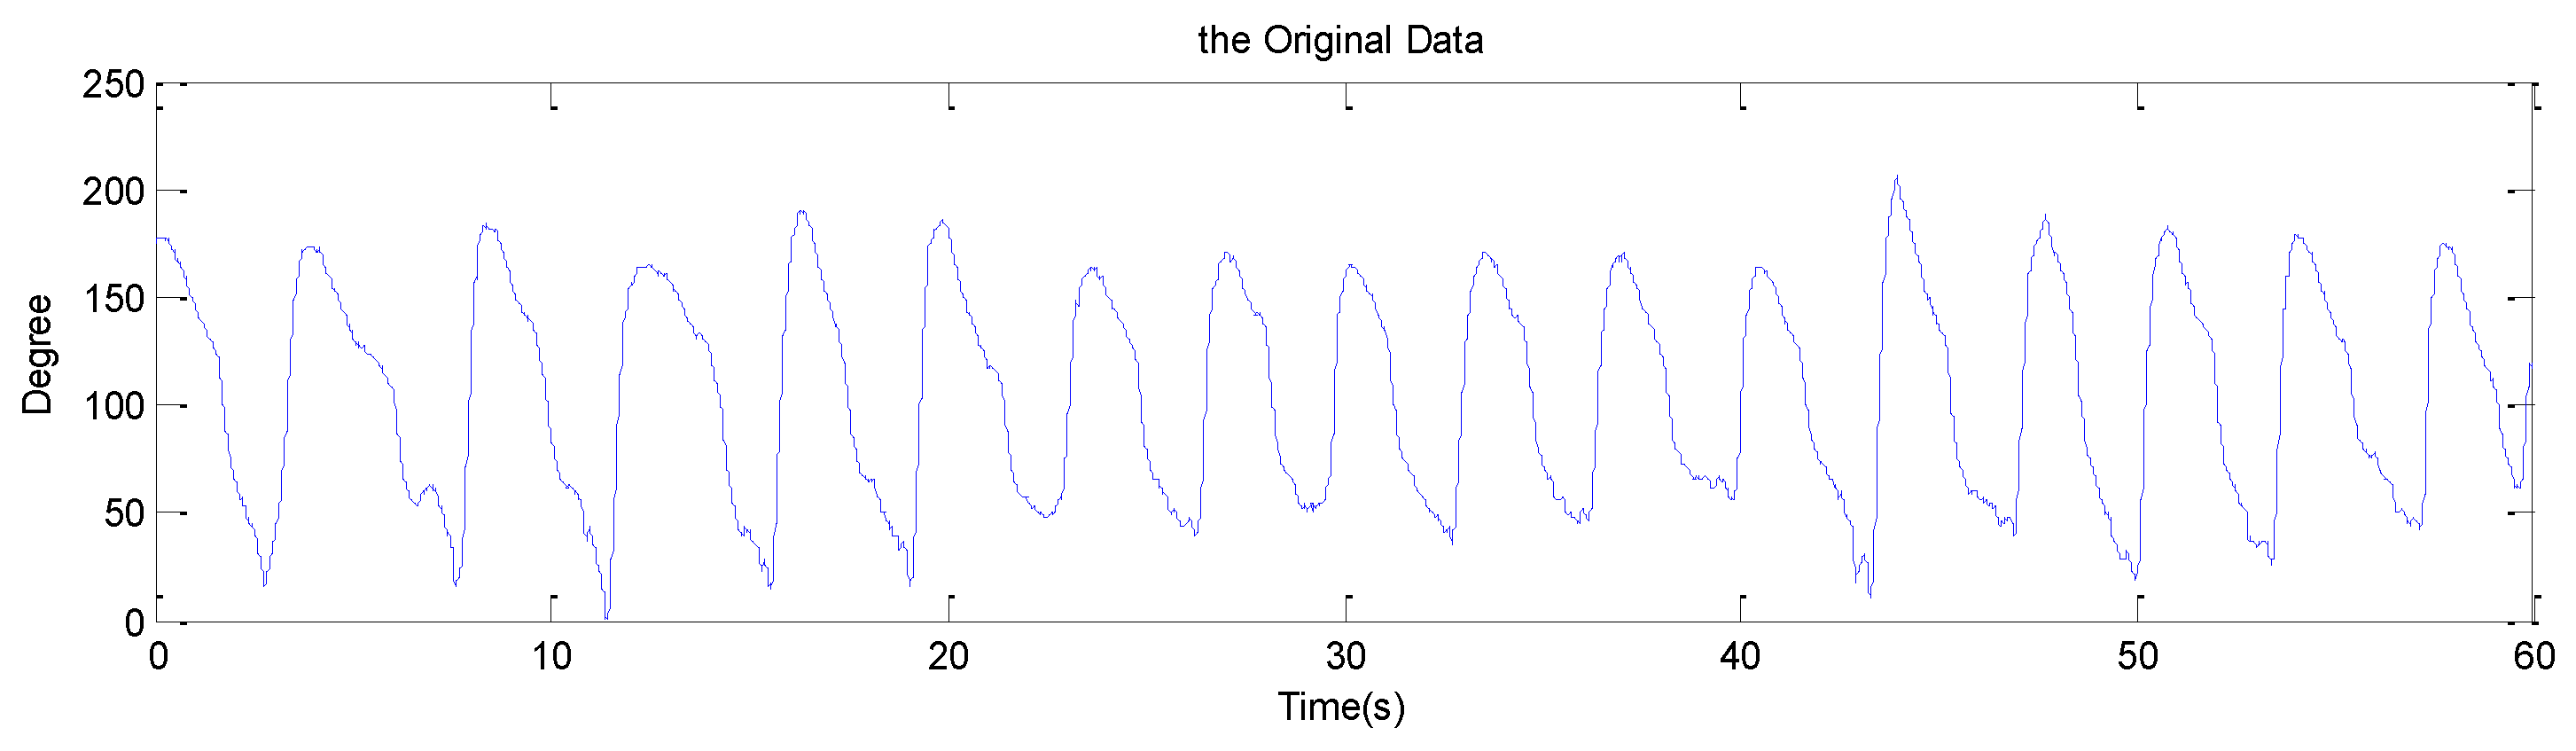
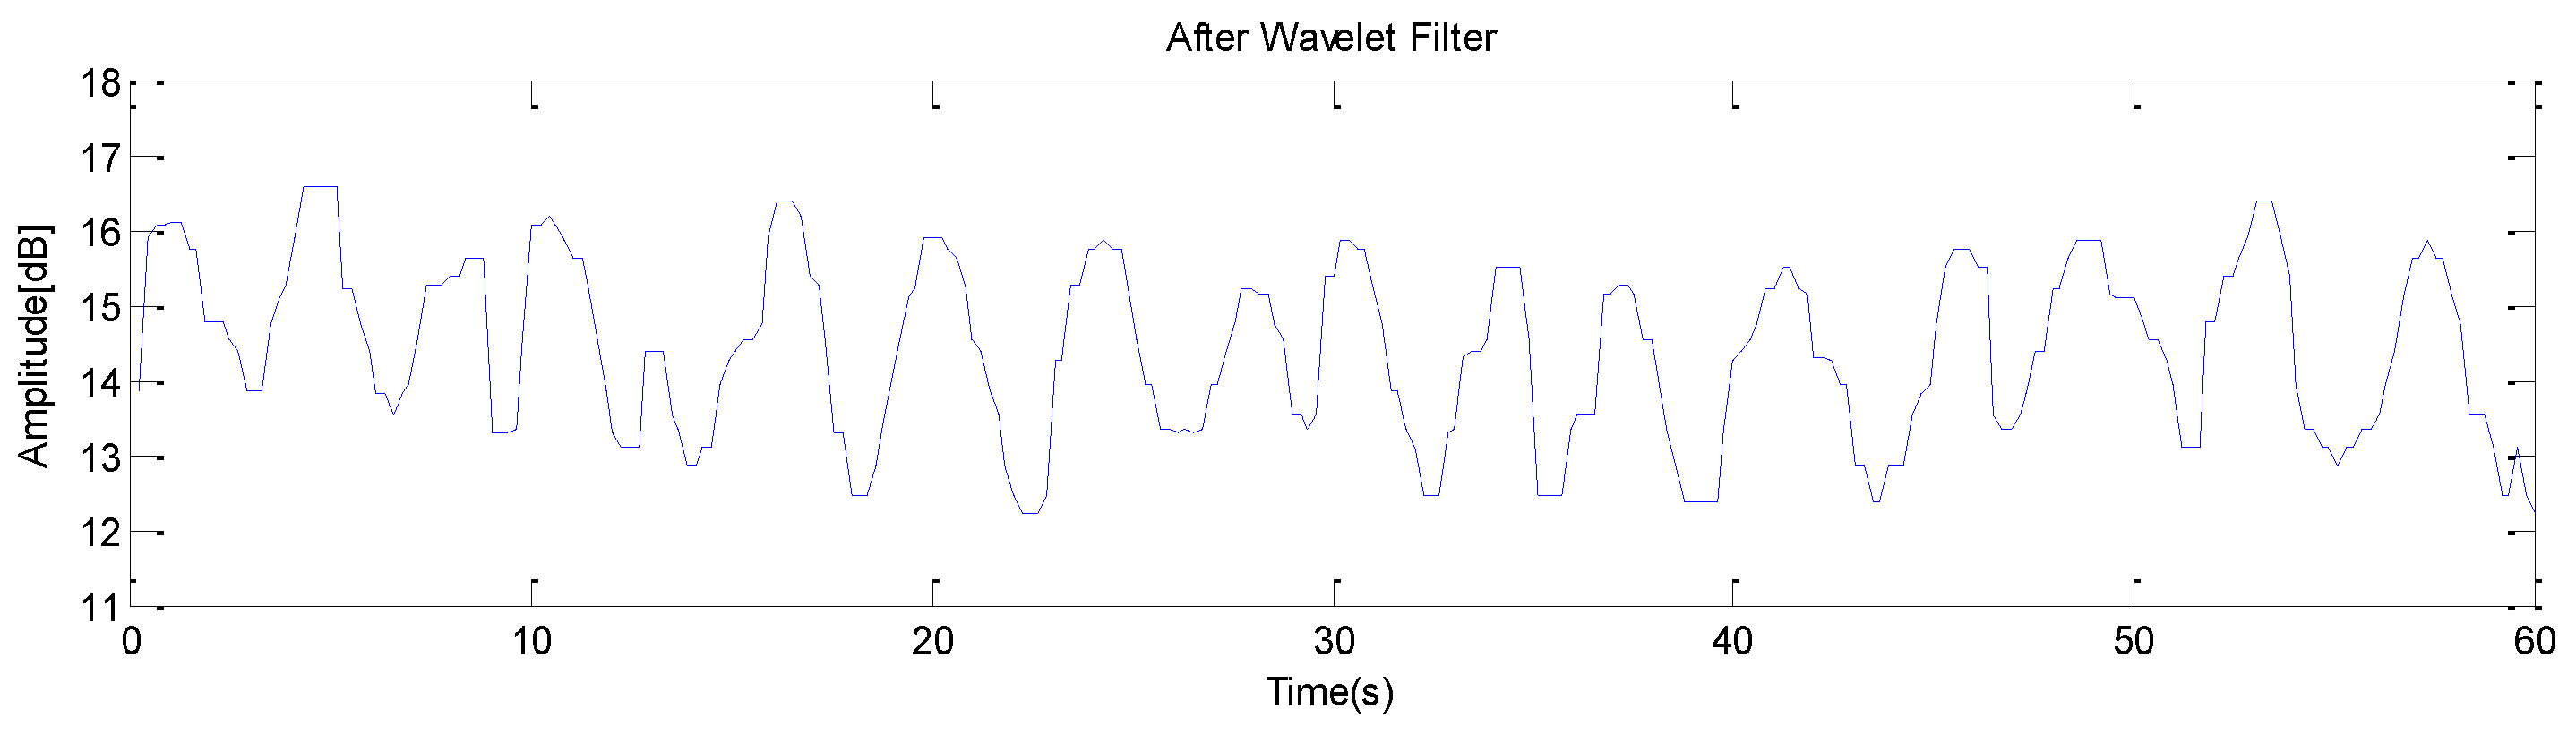
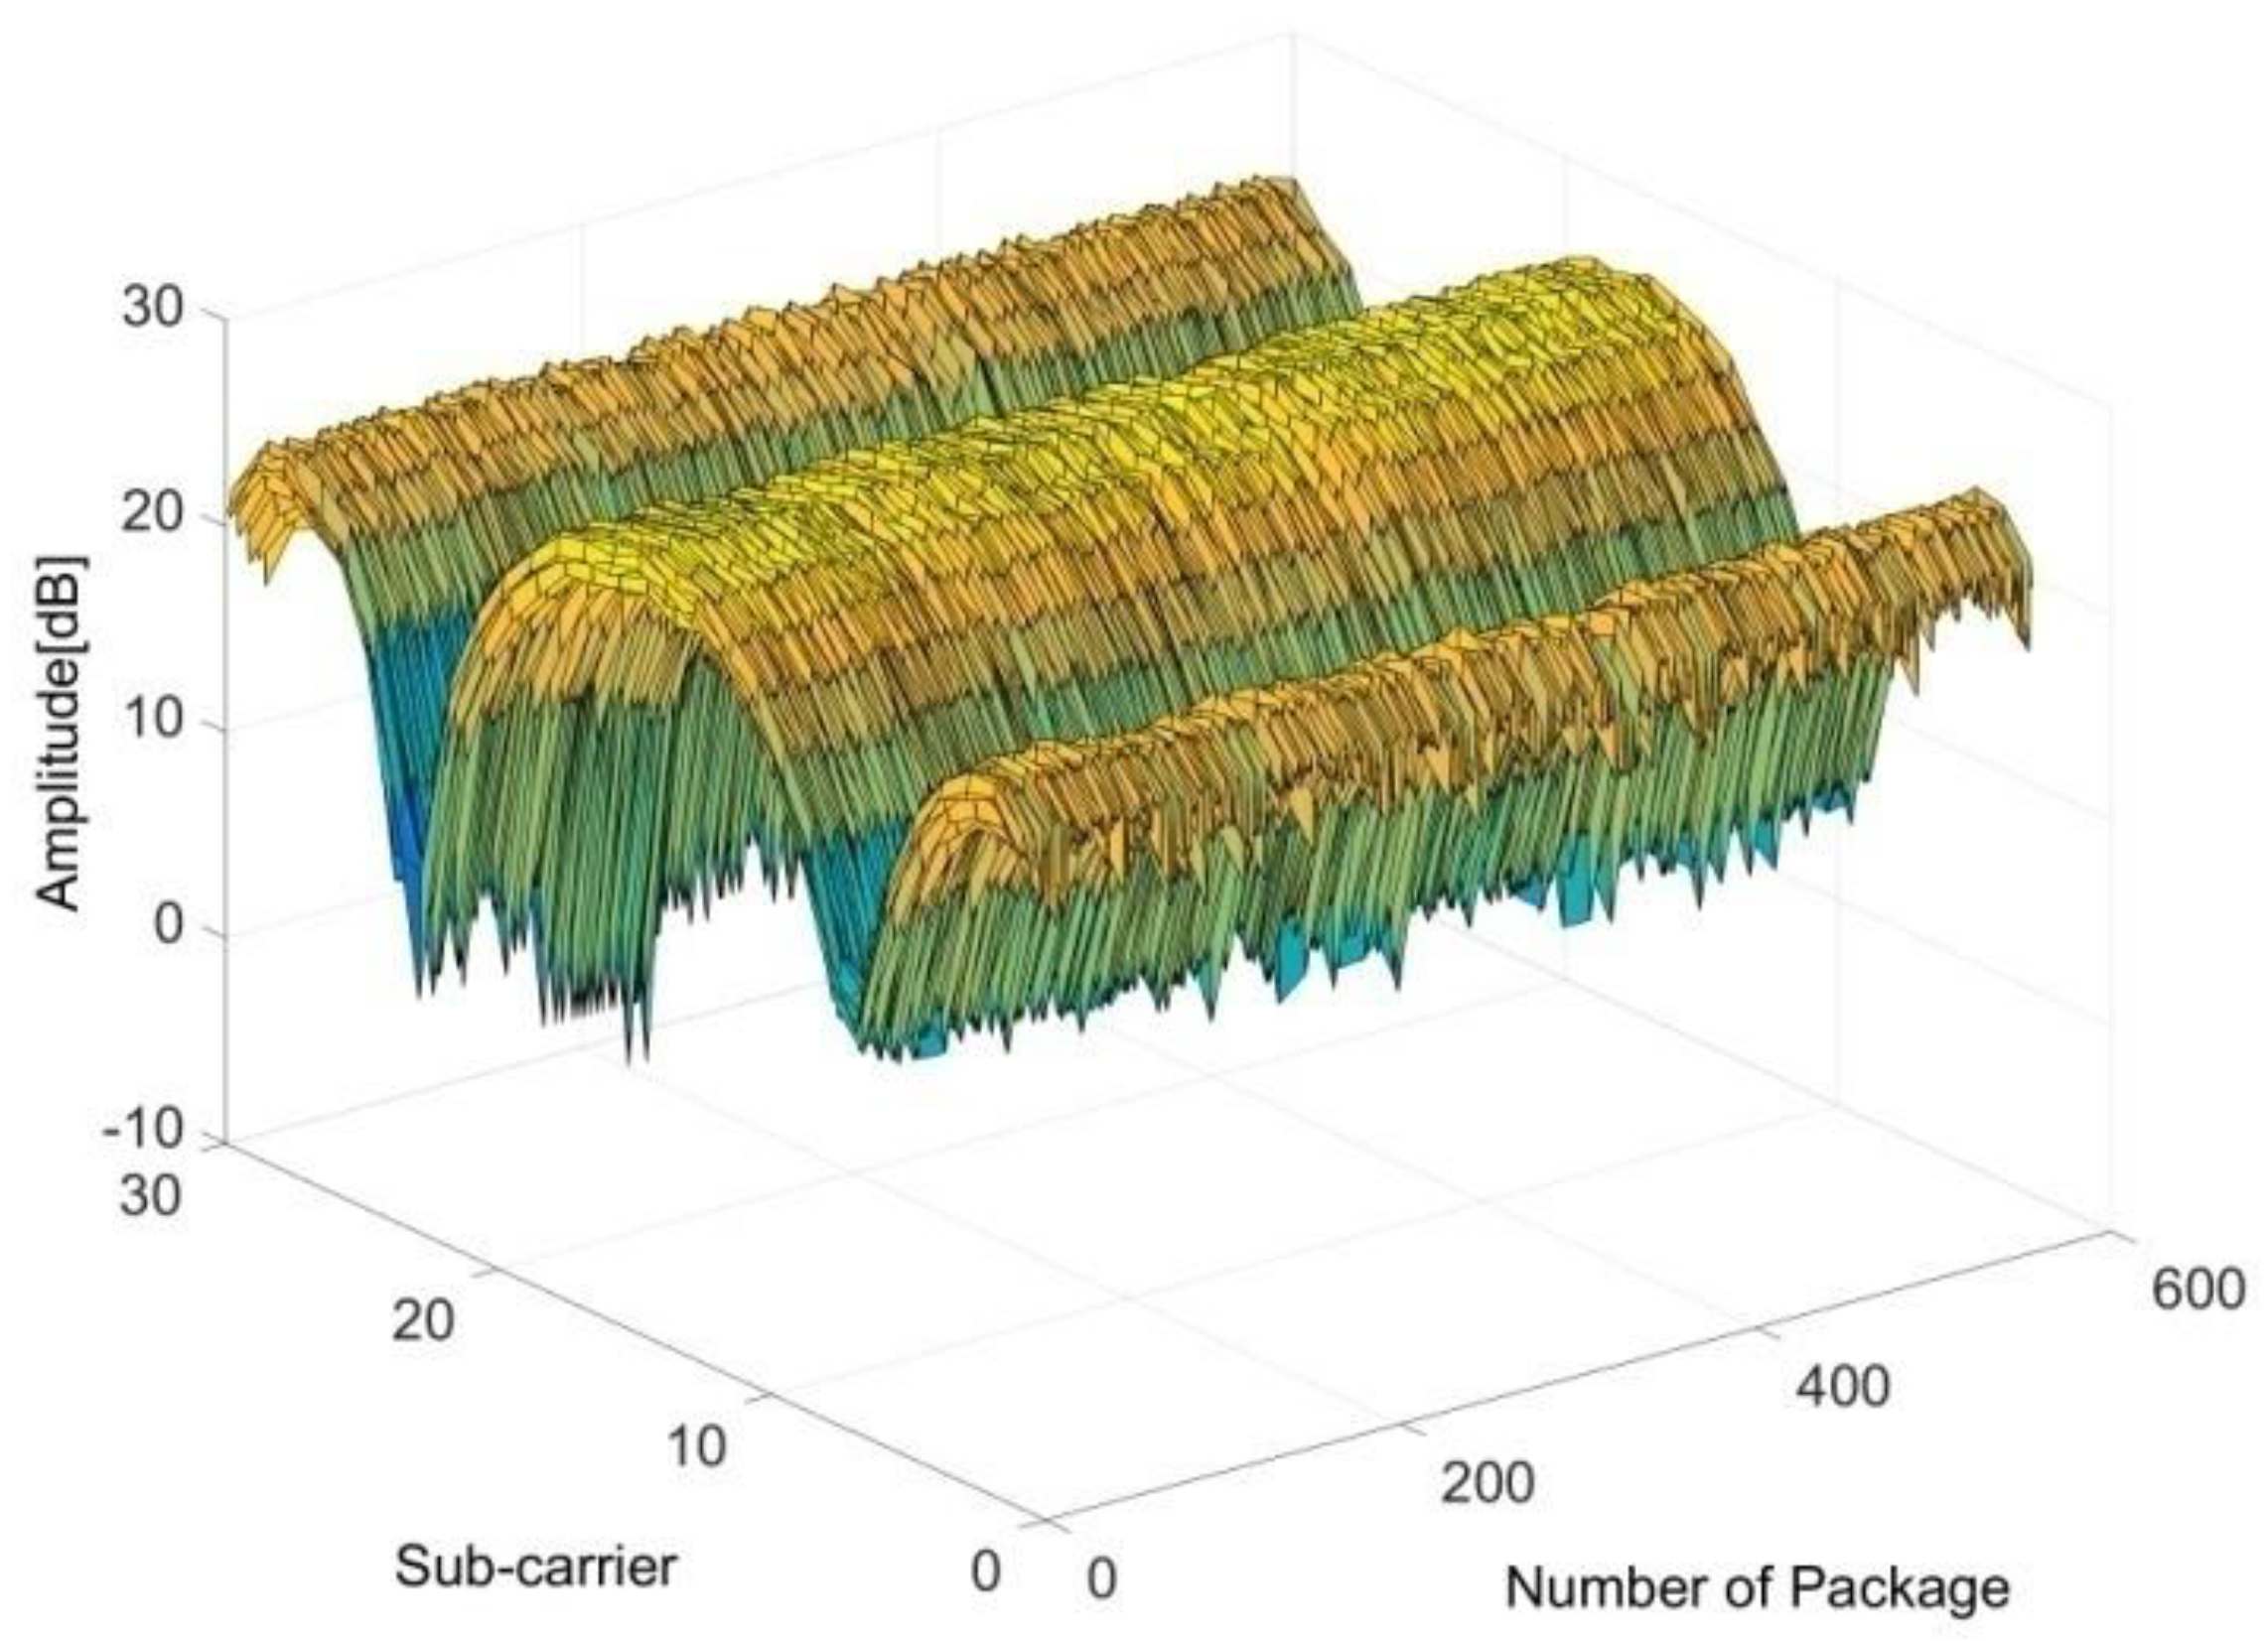
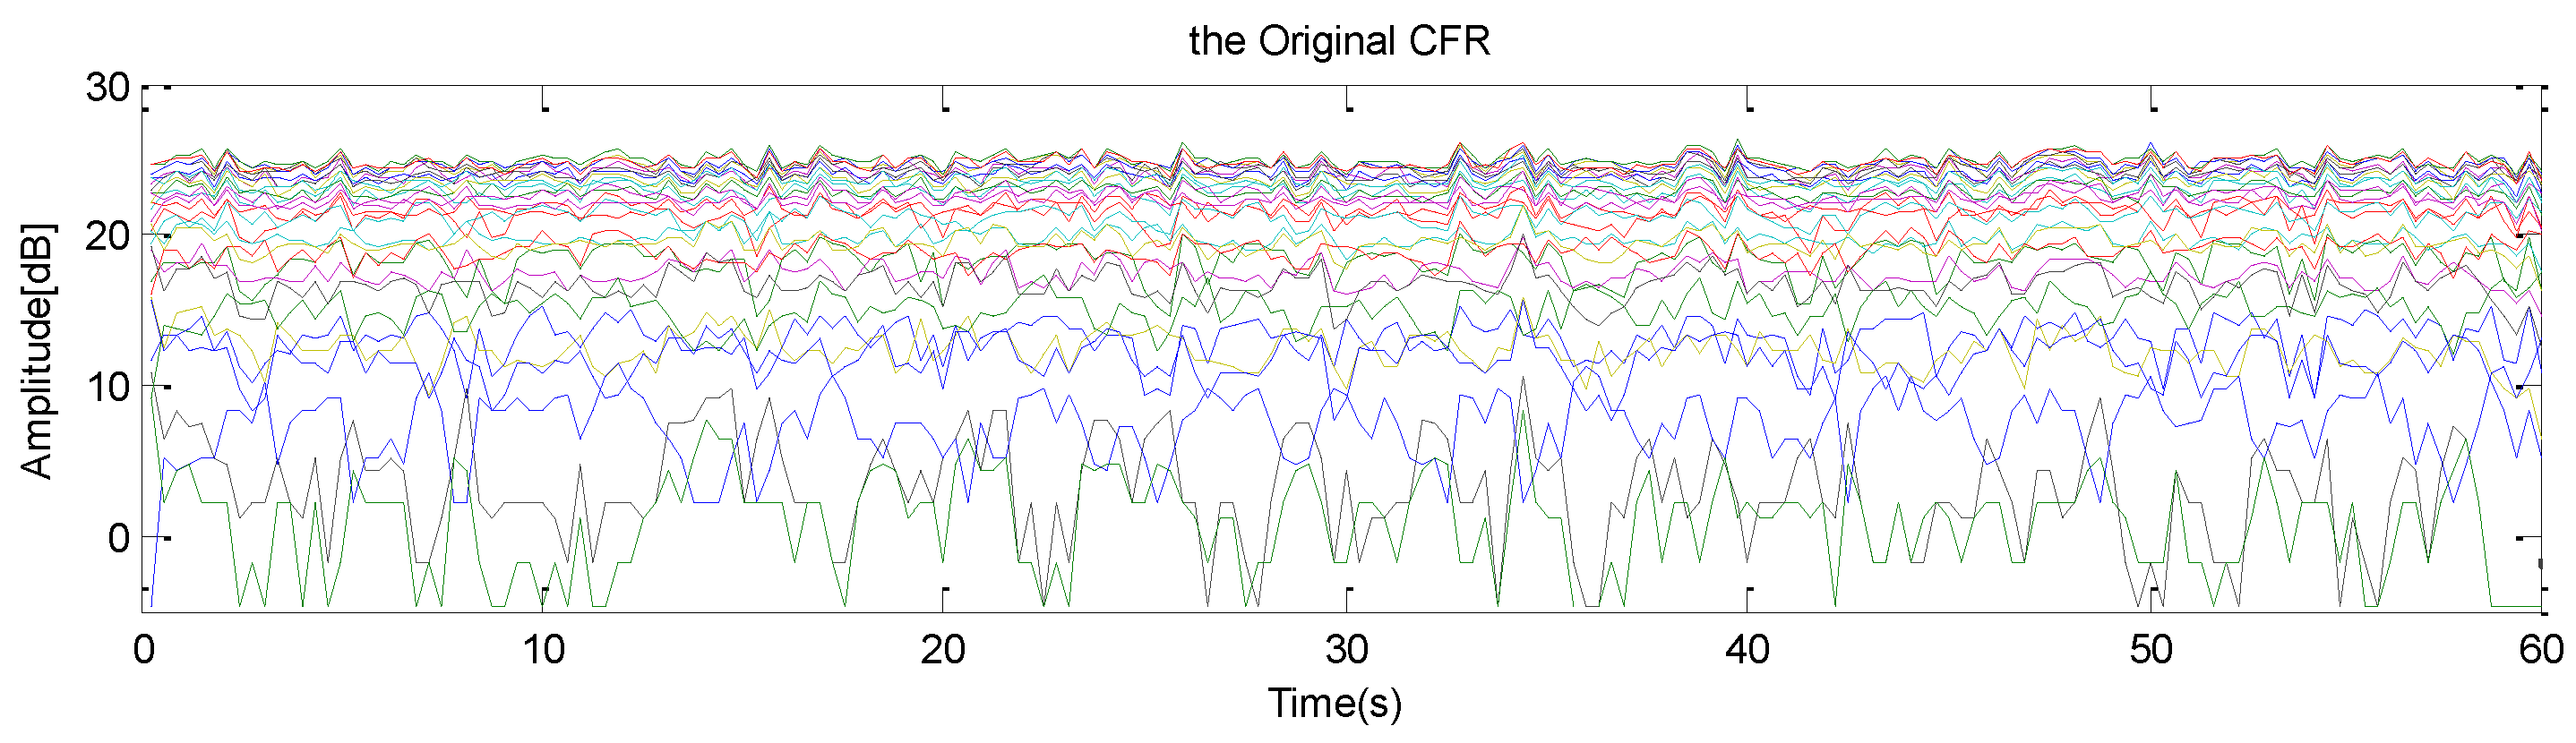
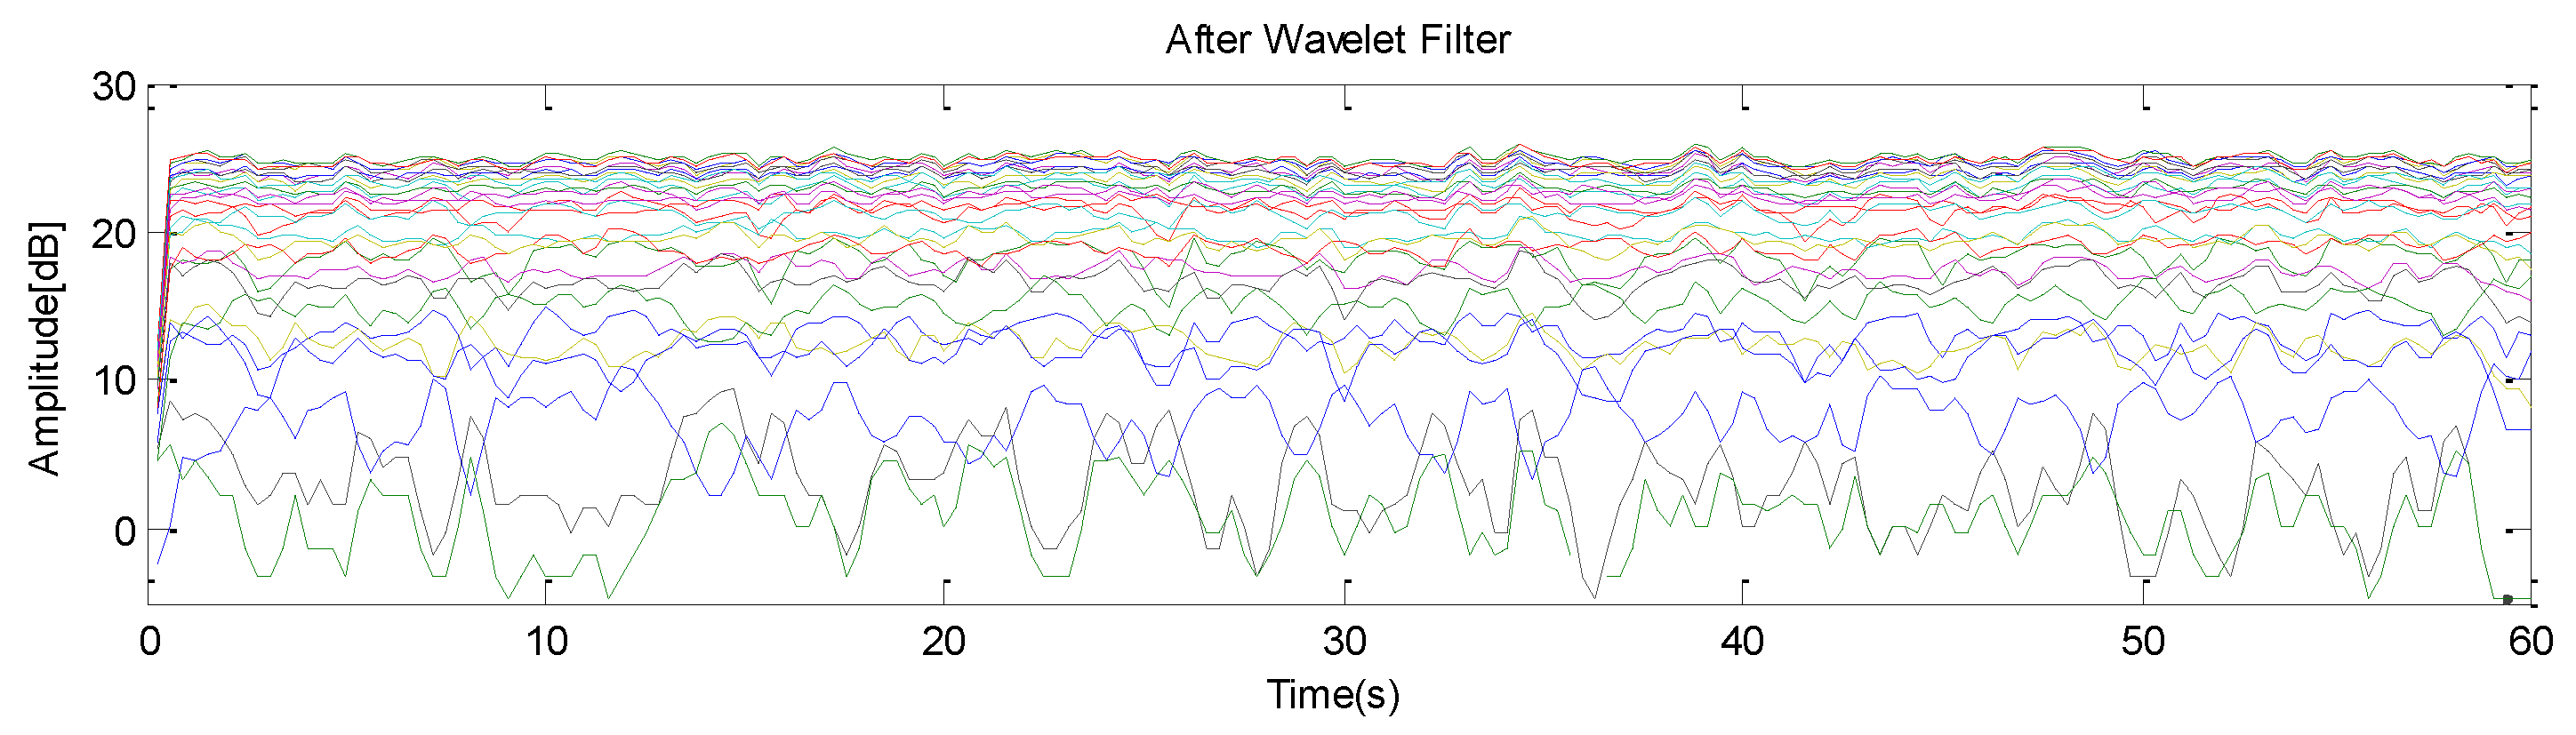
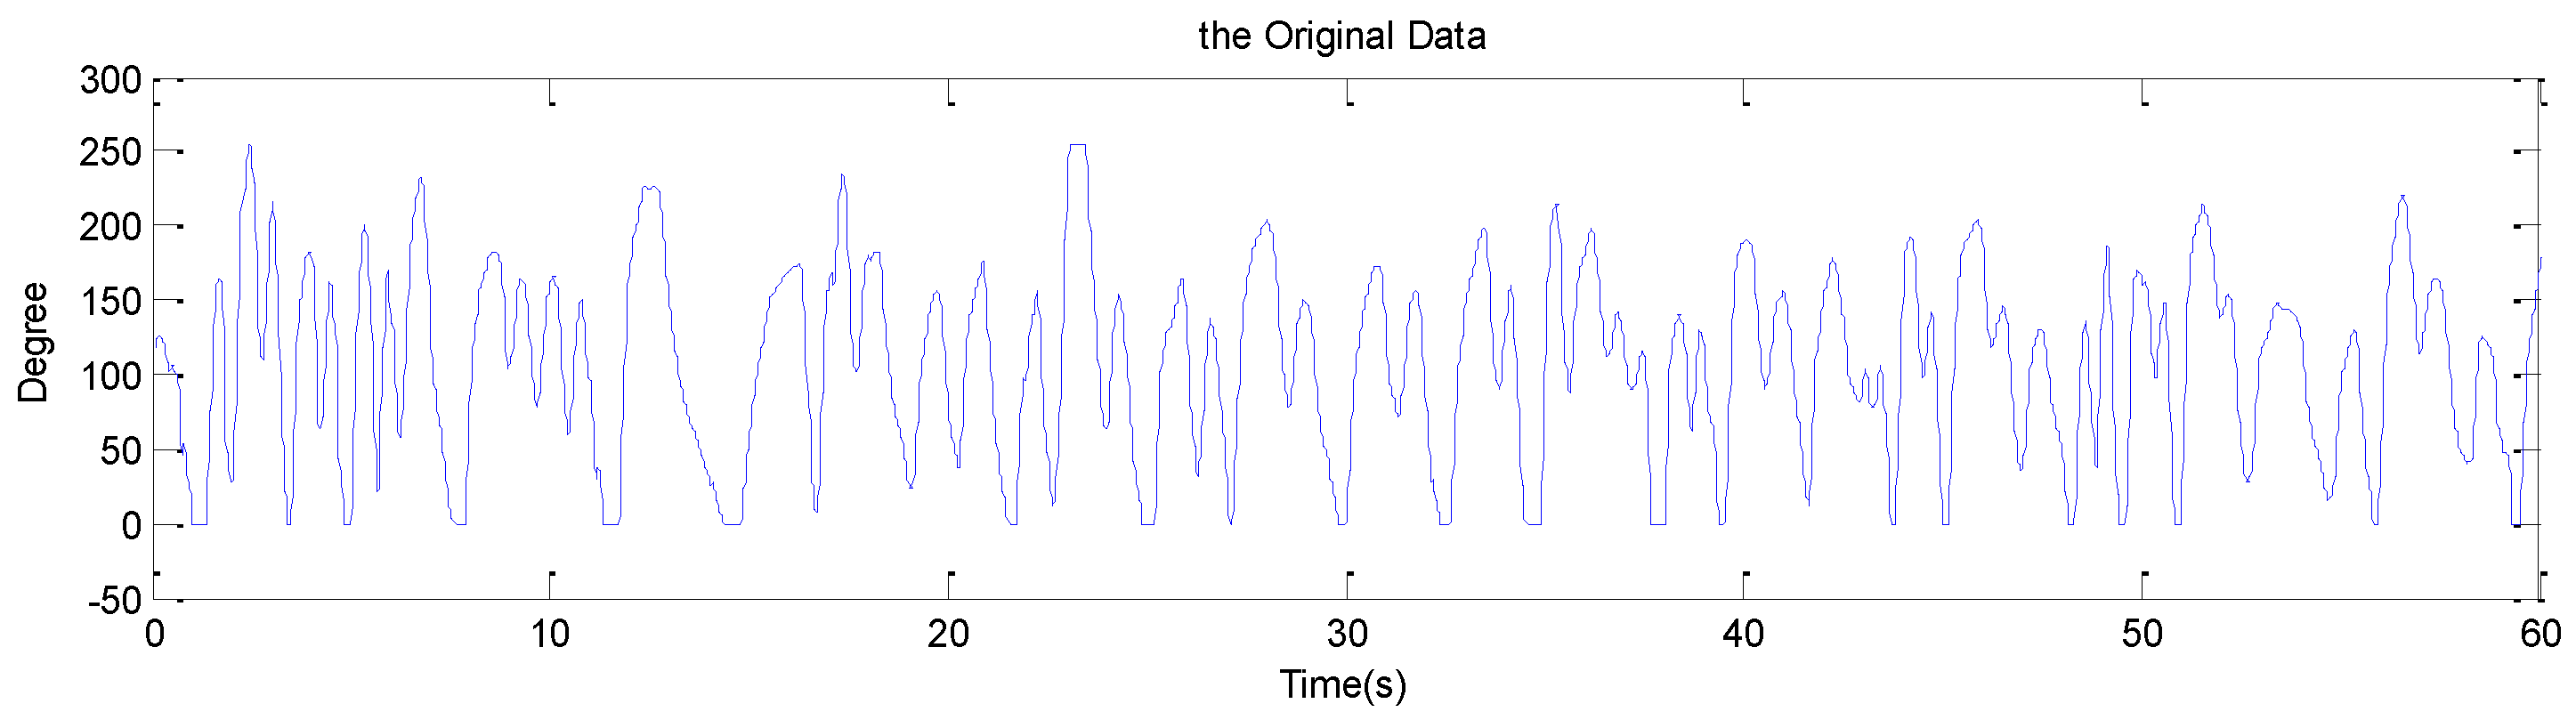
4. Monitoring Breathing and Its Analysis

This system monitors the breathing activities of a COPD patient [23] which includes normal breathing, abnormal breathing and coughing. We used C-Band sensing technique to extract the WCI for human breathing activities and compared the results with breathing patterns obtained from respiratory sensor HKH-11C. We examined the amplitude information against the time history from WCI using the mentioned subcarriers [22]. Figure 2 shows the raw WCI for coughing.

4.1. Monitoring Coughing Pattern

Monitoring coughing in COPD is very important. We used both C- Band sensing and the digital respiratory sensor method. As shown in Figure 2, we obtained the wireless channel information for coughing using C-Band.
Figure 2 shows the amplitude information of all 30 subcarriers. To examine the coughing activity of a COPD patient, we obtained the CFR form C-Band sensing as shown in Figure 3.
Figure 3 shows the fluctuation in the amplitude for all the subcarriers against the number of packets. After obtaining this information we performed the filtration process and filter CFRed the raw CFR data by using median filters. The obvious choice for the median and wavelet filter is due to its maximum reduction of noise and smoothing the edges for the available signal.
The above Figure 4 shows the filtered data for the coughing after applying the median filter. The rising and falling edges are much smoother than before with minimum noise effect. This experiment was performed on multiple persons imitating COPD patients, as mentioned in Table 2. We took multiple readings for approximately 1 min each.
Now Figure 5 shows the HKH-11C sensor data for coughing; it shows both the raw and filtered data. The person stays in the straight lying position for 60 s wearing the sensor on the chest and imitates the coughing of a COPD patient. Figure 5a shows the raw CFR data for the coughing and Figure 5b shows the filtered data for coughing.
The RF signal is always prone to external noise, so frequency selective fading shows greater impact on all the subcarriers. All the 30 subcarriers show different behavior for every power level w.r.t time. As shown in Figure 6, we have selected the sub-carrier # 7 for extracting the finest information for coughing pattern. After obtaining the data from subcarrier # 7, it then passed to the median filter to remove the noise and sharpen the edges.
From Figure 6, we can examine the breathing cycles; the person almost completed nine breathing cycles, as shown in Figure 5. This shows that the result from C-Band and HKH-11C is somehow similar.

4.2. Monitoring Normal Breathing

In this section we describe the monitoring of normal breathing pattern for a COPD patient. We used 5G C-band technology for extracting the desire WCI. Figure 7 shows the raw WCI for the normal breathing pattern of a COPD patient.
To examine the normal breathing activity of a COPD patient, we extract the CFR for all 30 subcarriers using C-Band. The person lying straight imitated the normal breathing for the period of 1 min for multiple times. CFR for all 30 subcarriers for normal breathing is shown in Figure 8.
To obtain the refined CFR we used median filter and wavelet filter to suppress the unwanted noise and smoothen the signal edges. Figure 9 shows the filtered CFR for normal breathing.
As mentioned before, the experiment was performed on multiple persons lying straight on a bed. We performed this for the period of 60 s each for multiple times to obtain the refined measurement for normal breathing pattern. Figure 10 shows the raw breathing activity using the HKH respiratory sensor for normal breathing. Almost 15 breathing cycles were completed during the period of 60 s.
The above Figure 10 shows the raw data; filtered normal breathing pattern is shown in Figure 11. After proper filtration, we obtained the refined normal breathing pattern.
The RF signal shows the clear effects of frequency-selective fading by considering all 30 subcarriers. On different power levels all the available subcarriers show variations w.r.t time. Considering this entire scenario, sub-carrier #19 showed the best results. This subcarrier shows the maximum and adequate information of normal breathing waveform. Figure 12 show the raw WCI for normal breathing using C-Band.
After the filtration of the above raw WCI, we obtained the refined breathing pattern for normal breathing using C-Band, as shown in Figure 13. Our analysis showed maximum similarity between both the waveform from digital respiratory sensor and C-Band.
From the above Figure 12 and Figure 13, we examine the breathing pattern using 5G C-Band technology. We also examine the fluctuation between the amplitude as a person inhales and exhales the air. The filtration process removes the unwanted fluctuation and smoothens the breathing signal.

4.3. Monitoring Abnormal Breathing

In the last two sections we explained the coughing pattern and normal breathing pattern for COPD patients. We used the C-Band sensing technique and compared the results with the wearable sensor data. We performed the experiment in the same way as we performed the normal breathing experiment; a person imitating a COPD patient was asked to breathe abnormally for a period of 60 s. Through this we collected the raw WCI from all 30 subcarriers with 600 WCI packets. This is shown in Figure 14.
Now the CFR for all 30 subcarriers are shown in Figure 15. This shows the raw CFR for all 30 subcarriers for the period of 60 s.
After filtration we obtain the reliable signal for all 30 subcarriers, as shown in Figure 16.
We also monitored the abnormal breathing with the HKH-11C breathing sensor, like in the previous section. Multiple people imitated the abnormal breathing, wore the respiratory sensor and inhaled and exhaled the air for a period of 60 s. Figure 17 shows the raw abnormal breathing pattern obtained from the digital respiratory sensor.
The filtered breathing pattern for abnormal breath is shown in Figure 18.
The person in the above case imitated the abnormal breathing tracked by the digital respiratory sensor. The breathing sensor behaves as the primary indicator in the above-mentioned case without showing any periodicity. So according to the above Figure 17 and Figure 18 we can see the non-periodicity in the amplitude for both raw and filtered data. This non-periodicity indicates the abnormal breathing pattern.
We also analyzed the data using C-Band utilizing the subcarrier number 21. Figure 19 shows the raw WCI obtained from C-Band. The advantage of using the wireless channel information is that we can choose one or multiple frequency channels for particular applications. The applications can be human intrusion detection, human activity recognition, gait identification and breathing pattern. For each application, specific subcarrier(s) provide the desired information. After examining all 30 frequency channels received for monitoring the breathing pattern of a COPD patient, the subcarriers #7, 19 and 21 gave us the coughing and breathing waveforms. The remaining frequency carriers did not deliver adequate information when the method was implemented in different geometrical locations/experimental settings. We have tested the system in six different locations and at five places the subcarriers #7, 19 and 21 gave us the desired results.
We performed the filtration on the raw WCI obtained from C-Band. After careful examination we concluded that both the waveforms obtained from C-Band and respiratory sensor are almost identical with maximum power level of 18 dB (relative power). In our case we have mentioned the relative power expressed in dB as, H = Y − X, where X is the transmitted signal and Y is the received signal. The filtered WCI for abnormal breathing is shown in Figure 20.

5. Spearman’s Rank Correlation

Throughout this research our focus revolved around two types of data, one received from C-band sensing and another from the digital respiratory sensor. There exists a correlation between these two types of data and to find that correlation we used the Spearman’s rank correlation method. The Spearman’s correlation designs itself by utilizing the rank method in which we can obtain the correlation between two signals by analyzing the rank difference. This method reduces the computational time in the presence of a very limited number of observations. The formula for Spearman’s correlation is represented as follows,
r k = 1 6 D 2 N 3 N  
  • r k = Rank correlation coefficient.
  • N = Total number of pair observation.
  • D = Rank difference.
The value for r k fluctuates between +1 and −1. The direction of rank totally depends on the positive and negative values of r k . If r k is positive then rank lies in the same direction and if r k is negative then rank holds the opposite direction. As mentioned before, we examine two types of signal, one from respiratory sensor and one from C-Band. The r k value we obtained for normal breathing is 0.89. This value is close to one so accordingly we obtained the positive rank. For the abnormal breathing we obtained the value r k = 0.86, which is also close to one and again rank shows the positive value. This result shows that the waveforms we captured from both the methods hold some identical features.

6. Conclusions

This paper presented the careful monitoring of breathing activities of a COPD patient using the 5G C-band sensing technique. The obtained results show the feasibility of obtaining wireless channel information from the available setup, where WCI can be used to monitor the coughing, normal and abnormal breathing pattern and then compare it with the data retrieved from the digital respiratory sensor. The presented result was performed on eight different subjects for multiple times lying in a straight position. This research aims to provide an efficient method that can detect the minute chest movement of COPD patients. This method is also very feasible for detecting the heartbeat of a patient to facilitate the doctors and hospital staff.

Author Contributions

Conceptualization, Q.Z., D.H., W.W., X.Y. and Q.H.A.; Methodology, D.H., S.A.S. and X.Y.; Validation, Q.Z. and D.H.; Formal Analysis, D.H.; Investigation, Q.Z. and W.W.; Resources, Q.Z. and W.W.; Data Curation, D.H.; Review & Editing, X.Y.; Project Administration, X.Y.

Funding

This research received no external funding.

Conflicts of Interest

The authors declare no conflict of interest.

References

  1. Xu, Y. Emerging Radio Communication Technology and Applications. Article by State Radio Monitoring Center of China Radio Monitoring Department. Available online: https://www.fiercewireless.com/wireless/china-reserves-spectrum-for-5g-says-more-low-band-frequencies-coming-report (accessed on 15 November 2017).
  2. Wang, T.; Li, G.; Ding, J.; Miao, Q.; Li, J.; Wang, Y. 5G spectrum: Is China Ready? IEEE Commun. Mag. 2015, 53, 58–65. [Google Scholar] [CrossRef]
  3. Van Putten, A.F.; Hitchings, D.J.; Quanjer, P.H. Portable electronic peak flowmeter for improved diagnosis of chest diseases in COPD patients. In Proceedings of the IEEE Instrumentation Technology Conference, Irvine, CA, USA, 18–20 May 1993. [Google Scholar]
  4. Garcia-Aymerich, J.; Farrero, E.; Felez, M.A.; Izquierdo, J.; Marrades, R.M.; Anto, J.M. Risk factors of readmission to hospital for a COPD exacerbation: A prospective study. Thorax 2003, 58, 100–105. [Google Scholar] [CrossRef] [PubMed]
  5. Troosters, T.; Sciurba, F.; Battaglia, S.; Langer, D.; Valluri, S.R.; Martino, L.; Benzo, R.; Andre, D.; Weisman, I.; Decramer, M. Physical inactivity in patients with COPD, a controlled multi-center pilot-study. Respir. Med. 2010, 104, 1005–1011. [Google Scholar] [CrossRef] [PubMed] [Green Version]
  6. Erden, F.; Cetin, A.E. Breathing Detection Based on the Topological Features of IR Sensor and Accelerometer Signals. In Proceedings of the IEEE 50th Asilomar Conference on Signal and Systems and Computer, Pacific Grove, CA, USA, 6–9 November 2016. [Google Scholar]
  7. Park, B.K.; Yamada, S.; Boric-Lubecke, O.; Lubecke, V. Single channel receiver limitations in Doppler radar measurements of periodic motion. In Proceedings of the 2006 IEEE Radio and Wireless Symposium, San Diego, CA, USA, 17–19 October 2006; pp. 99–102. [Google Scholar]
  8. Li, W.; Tan, B.; Piechocki, R.J. Non-Contact Breathing Detection Using Passive Radar. In Proceedings of the IEEE International Conference on Communication (ICC), Kuala Lumpur, Malaysia, 22–27 May 2016. [Google Scholar]
  9. Abdelnasser, H.; Harras, K.A.; Youssef, M. Ubibreathe: A ubiquitous non-invasive WiFi-based breathing estimator. In Proceedings of the 16th ACM International Symposium on Mobile Ad Hoc Networking and Computing, New York, NY, USA, 22–25 June 2015; pp. 277–286. [Google Scholar]
  10. Liu, J.; Wang, Y.; Chen, Y.; Yang, J.; Chen, X.; Cheng, J. Tracking vital signs during sleep leveraging off-the-shelf WiFi. In Proceedings of the 16th ACM International Symposium on Mobile Ad Hoc Networking and Computing, New York, NY, USA, 22–25 June 2015; pp. 267–276. [Google Scholar]
  11. Alemaryeen, A.; Noghanian, S.; Fazel-Rezai, R. Antenna Effects on Respiratory Rate Measurement Using a UWB Radar System. IEEE J. Electromagn. RF Microw. Med. Biol. 2018, 2, 87–93. [Google Scholar] [CrossRef]
  12. Andre, N.; Druart, S.; Gerard, P.; Pampin, R.; Moreno-Hagelsieb, L.; Kezai, T.; Francis, L.A.; Flandre, D.; Raskin, J.P. Miniaturized Wireless Sensing System for Real-Time Breath Activity Recording. IEEE Sens. J. 2010, 10, 178–184. [Google Scholar] [CrossRef]
  13. Patwari, N.; Wilson, J.; Ananthanarayanan, S.; Kasera, S.K.; Westenskow, D.R. Monitoring Breathing via Signal Strength in Wireless Networks. IEEE Trans. Mob. Comput. 2014, 13, 1774–1786. [Google Scholar] [CrossRef] [Green Version]
  14. Wang, C.W.; Hunter, A.; Gravill, N.; Matusiewicz, S. Unconstrained Video Monitoring of Breathing Behavior and Application to Diagnosis of Sleep Apnea. IEEE Trans. Biomed. Eng. 2014, 61, 396–404. [Google Scholar] [CrossRef] [PubMed] [Green Version]
  15. Poreva, A.; Karplyuk, Y.; Makarenkova, A.; Makarenkov, A. Detection of COPD’s Diagnostic Signs Based on Polyspectral Lung Sounds Analysis of Respiratory Phases. In Proceedings of the 2015 IEEE 35th International Conference on Electronics and Nanotechnology (ELNANO), Kiev, Ukraine, 21–24 April 2015. [Google Scholar]
  16. Ritz, C.P.; Powers, E.J.; Bengtson, R.D. Experimental measurement of three wave coupling and energy cascading. Phys. Fluids 1989, 1, 153–163. [Google Scholar] [CrossRef]
  17. Chen, C.; Chen, Y.; Han, Y.; Lai, H.Q.; Zhang, F.; Wang, B.; Liu, K.J.R. TR-BREATH: Time-Reversal Breathing Rate Estimation and Detection. IEEE Trans. Biomed. Eng. 2018. [Google Scholar] [CrossRef] [PubMed]
  18. Shah, S.A.; Zhang, Z.; Ren, A.; Zhao, N.; Yang, X.; Zhao, W.; Yang, J.; Zhao, J.; Sun, W.; Hao, Y. Buried Object Sensing Considering Curved Pipeline. IEEE Antennas Wirel. Propag. Lett. 2017, 16, 2771–2775. [Google Scholar] [CrossRef]
  19. Abramowitz, M. Handbook of Mathematical Functions, With Formulas, Graphs, and Mathematical Tables; Dover Publications, Incorporated: Mineola, NY, USA, 1974. [Google Scholar]
  20. Shah, S.A.; Ren, A.; Fan, D.; Zhang, Z.; Zhao, N.; Yang, X.; Luo, M.; Wang, W.; Hu, F.; Rehman, M.U.; et al. Internet of Things for Sensing: A Case Study in the Healthcare System. Appl. Sci. 2018, 8, 508. [Google Scholar] [CrossRef]
  21. Fan, D.; Ren, A.; Zhao, N.; Yang, X.; Zhang, Z.; Shah, S.A.; Hu, F.; Abbasi, Q.H. Breathing Rhythm Analysis in Body Centric Networks. IEEE Access 2018, 6, 32507–32513. [Google Scholar] [CrossRef]
  22. Yang, X.; Shah, S.A.; Ren, A.; Zhao, N.; Fan, D.; Hu, F.; Ur-Rehman, M.; von Deneen, K.M.; Tian, J. Wandering Pattern Sensing at S-Band. IEEE J. Biomed. Health Inform. 2017. [Google Scholar] [CrossRef] [PubMed]
  23. Kaltiokallio, O.J.; Yigitler, H.; Jäntti, R.; Patwari, N. Non-Invasive Respiration Rate Monitoring Using a Single COTS TX-RX Pair. In Proceedings of the 13th International Symposium on Information Processing in Sensor Networks, Berlin, Germany, 15–17 April 2014; pp. 59–70. [Google Scholar]
Figure 1. Implemented design overview to monitor breathing.
Applsci 08 01915 g001
Figure 2. Raw WCI (wireless channel information) for human coughing.
Applsci 08 01915 g002
Figure 3. Raw CFR (channel frequency response) for coughing using C-Band.
Applsci 08 01915 g003
Figure 4. Filtered CFR for coughing.
Applsci 08 01915 g004
Figure 5. Coughing pattern obtained using HKH-11C sensor. (a). Raw coughing pattern. (b). Filtered coughing pattern.
Applsci 08 01915 g005
Figure 6. Amplitude information for Subcarrier # 7. (a). Raw coughing pattern obtained using C-Band. (b). Filtered coughing pattern.
Applsci 08 01915 g006
Figure 7. Raw WCI for normal breathing.
Applsci 08 01915 g007
Figure 8. The CFR of all subcarriers for normal breathing.
Applsci 08 01915 g008
Figure 9. Filtered CFR for normal breathing.
Applsci 08 01915 g009
Figure 10. Normal breathing pattern from digital respiratory sensor.
Applsci 08 01915 g010
Figure 11. Normal breathing pattern after filtration.
Applsci 08 01915 g011
Figure 12. Raw WCI for normal breathing using C-Band.
Applsci 08 01915 g012
Figure 13. Filtered WCI for normal breathing using C-Band.
Applsci 08 01915 g013
Figure 14. Raw WCI for abnormal breathing.
Applsci 08 01915 g014
Figure 15. The CFR of all subcarriers for abnormal breathing.
Applsci 08 01915 g015
Figure 16. Filtered CFR for abnormal breathing.
Applsci 08 01915 g016
Figure 17. Abnormal breathing pattern from digital respiratory sensor.
Applsci 08 01915 g017
Figure 18. Abnormal breathing pattern after filtration.
Applsci 08 01915 g018
Figure 19. Raw WCI for abnormal breathing using C-Band.
Applsci 08 01915 g019
Figure 20. Filtered WCI for normal breathing using C-Band.
Applsci 08 01915 g020
Table 1. Comparison between different techniques for monitoring breathing.
S/No.Techniques for Monitoring BreathingExplanationAdvantagesLimitations
1UWB Radar SystemAla Alemaryeen et al. [11] proposed ultra-wide band (UWB) radar based respiratory monitoring system.Shows less error, more robust to noise.Complex, Costly.
2Non-invasive capacitive micro SensorNicolas Andre et al. [12] proposed the concept of using capacitive micro sensors and negative temperature coefficient thermistor integrated on a silicon chip to monitor breathing with the help of wireless sensor system.Useful for larger space, monitoring is easy.More hardware, time consuming.
3RSS systemNeal Patwari et al. [13], proposed the concept of monitoring breathing with the help of received signal strength in wireless sensors network.Reliable detection, less RMS error.RSS behaves less efficiently in the presence of fading and scattering, performance may decrease due to multipath propagation.
4Video MonitoringChing We Wang et al. [14], proposed the idea of real-time automated infrared video monitoring technique for detection of respiratory activities.High accuracy rate, robust to many body movements.Less cost effective, excessive hardware, complex architecture.
Table 2. Subjects involved in experiment process.
SubjectsAgeHeight (cm)Weight (Kg)
12917175
23016978
33516171
43117485
52617387
63917690
74017078
82216973

