Article

Movement Noise Cancellation in Second Derivative of Photoplethysmography Signals with Wavelet Transform and Diversity Combining

School of Electrical Engineering, University of Ulsan, Ulsan 44610, Korea
*
Author to whom correspondence should be addressed.
Appl. Sci. 2018, 8(9), 1531; https://doi.org/10.3390/app8091531
Submission received: 31 July 2018 / Revised: 24 August 2018 / Accepted: 28 August 2018 / Published: 1 September 2018
(This article belongs to the Special Issue Wearable Wireless Devices)

Abstract

:
In this paper, we propose an algorithm to remove movement noise from second derivative of photoplethysmography (SDPPG) signals. SDPPG is widely used in healthcare applications because of its easy and comfortable measurement. However, an SDPPG signal is vulnerable to movement, which degrades the signal. Degradation of SDPPG signal shapes can result in incorrect diagnosis. The proposed algorithm detects movement noise in a measurement signal using wavelet transform, and removes movement noise by selecting the best signal from among multiple signals measured at different locations. Experiment results show that the proposed algorithm outperforms the previous filter-based algorithm, and that movement noise with 30% time duration can be reduced by up to 70.89%.

1. Introduction

With the advancement of electrical and communication technologies, various wearable devices have been developed in a variety of areas including communications, sports, medical diagnosis, and safety. The number of wearable devices will reach up to 485 million in 2018, according to a Business Intelligence report in 2013 [1]. This number is almost 28% of the smart phone market. After the launch of the smart watch, the public has become more interested in wearable devices. In the beginning, most wearable devices were developed for fitness. After smart watch, the application areas expanded from fitness to diverse areas. Healthcare integrating wearable devices with bio-sensing technology are expected to become one of the biggest markets of the Internet of Things [2].
For healthcare, various types of bio-signals are measured such as electroencephalography (EEG), electrocardiography (ECG), electrooculography (EOG), and photoplethysmography (PPG) signals. EEG and ECG are monitoring methods to record electrical activity of the brain and the heart, respectively. EOG is a technique for measuring the corneo-retinal standing potential that exists between the front and the back of the human eye. EEG, ECG, and EOG are measured with a differential amplifier, which registers the difference between two electrodes attached to the skin. These three measurement methods are very uncomfortable for subjects and require knowledge about the human body.
Because of their convenience and portability of measurement, PPG-related signals such as PPG and the second derivative of photoplethysmography (SDPPG) signals are widely used for wearable devices [3]. PPG and SDPPG can monitor heart rates and cardiac cycles by optically detecting blood volume changes in the microvascular bed of tissues. The change in volume caused by the pressure pulse is detected by illuminating the skin with the light from an LED (Light emitting diode), and then measuring the amount of light either transmitted or reflected to a photodiode, as shown in Figure 1 (Near infrared light (600–1000 nm) is suitable for PPG measurement because it permeates the skin and is absorbed into hemoglobin [4]. Therefore, a PPG uses an LED that emits near infrared light to the skin.). For example, more blood absorbs more light so that the receiver receives weaker signal strength. Since PPG and SDPPG only use light signals, they are easier and more comfortable to measure than other kinds of bio-signals. Hence various types of wearable devices with PPG have been developed [5]. However, vulnerability to noise is a major drawback of the PPG-related signals.
In PPG measurement, a signal includes two types of noise: background noise and movement noise [6]. The background noise is caused by electrical noise, such as thermal noise and electromagnetic interference in cables. Movement noise is caused by voluntary or involuntary movements of a subject and affects a wide frequency range. Such noises in measurement distort PPG signal shapes, which can result in wrong diagnoses. Although background noise can be filtered out using a low-pass filter, movement noise cannot be cancelled in this manner [5].
In previous work, there have been efforts to reduce movement noise [6,7,8,9,10,11,12]. Patterson et al. [7] studied the best location to measure PPG signals, but movement effect was not considered. Motion artifacts were studied using wavelet transform [8]. Two PPG signals were measured at two different locations with identical PPG sensors. One was used as a reference and the other included movement noise. By comparing the two signals, the properties of movement noises were studied but there was no solution for removal of the movement noise. Kim et al. [6] analyzed the relationship between the accelerometer-measured signal and the PPG signal. Based on this analysis and the least mean squares (LMS), a movement noise cancellation algorithm was proposed. However, the proposed algorithm improves only the peak detection accuracy of PPG signals and needs additional hardware. The adaptive step-size LMS (AS-LMS) adaptive filter [9] was proposed to reduce motion artifacts using a LMS adaptive filter without additional hardware, but the scheme considered only limited cases such as horizontal and vertical movement and therefore cannot be applied for random movement. The periodic moving average filter (PMAF) [10] was proposed to remove movement noise by considering the periodicity of the PPG signals. PMAF segments the PPG signal into periods and resamples each period. The algorithm mitigates a noise at an instant period by averaging multiple signals, but the noise can be propagated to the next signals, which distorts the signal shape. An adaptive spectrum noise cancellation (ASNC) approach for motion artifacts removal in PPG signals is presented by Yang et al. [11]. However, the proposed ASNC utilizes the onboard accelerometer and gyroscope sensors to detect and remove the artifacts adaptively. Peng et al. [12] proposed a method to extract the clean PPG signals from the motion artifacts corrupted PPG signals. The method combined temporally constrained independent component analysis (cICA) and adaptive filters. The cICA extracts the clean PPG signal, and the adaptive filters recover the amplitude information of the PPG signal. But when motion artifacts and PPG signals have dependency, the performance of the proposed method is degraded, i.e., the PPG signal shapes are distorted.
All of the previous studies mainly considered movement noise reduction for measuring heart rates from only PPG signals [6,7,8,9,10,11,12] even though SDPPG signals are more useful for diagnosing diseases [13]. The information can be extracted from the signal shapes, so if the shape of SDPPG signals is distorted the applications are limited for diagnosis. Hence, movement noise reduction is important for SDPPG signals.
To remove movement noise generally, and to maintain signal fidelity, we apply signal processing and diversity combining schemes for multiple SDPPG signals. The heart rate is almost periodic with a subject-dependent shape; therefore, a wavelet transform that has multiple bases and changes the time-frequency resolution [14] can detect movement noise effectively. Moreover, the human heart generates a heartbeat whereby PPG signals can be measured at different locations, such as fingers, ears, and toes, as shown in Figure 2. Hence, diversity combining schemes, as with communications, can improve the received PPG signal quality. The quality of each channel is measured by the noise level using the wavelet transform, and the algorithm chooses the best signal. This work can also be applicable to other types of bio-signals that have periodicity and diversity properties for healthcare and disease diagnosis using wearable devices.
Compared to earlier work [15], this paper provides more detail of analysis and combining schemes, improves the proposed algorithm, and verifies the algorithm through more simulations and comparisons. The noise detection using wavelet transform and the noise reduction using a diversity combining scheme are explained in detail. The proposed algorithm is verified by comparing with previous algorithms in various environments.
The rest of this paper is organized as follows. Section 2 describes the properties of SDPPG signals and problems in measurement. Section 3 overviews the wavelet transform and diversity combining for application in analyzing SDPPG signals. The noise reduction algorithm with wavelet transform and selection combining is proposed in Section 4. Section 5 presents experiment results. Finally, this paper is concluded in Section 6.

2. Properties of SDPPG Signals and Problems in Measurement

In this section, we describe the properties of an SDPPG signal and the problems in SDPPG measurement.

2.1. Properties of SDPPG Signals

There are two types of PPG signal that can optically detect blood volume changes in the microvascular bed of tissues, and that are widely used for healthcare: PPG and SDPPG. While PPG directly measures only the stiffness changes in the microvascular bed of the tissue, SDPPG [16] computes the twice-differentiated PPG signal. Since SDPPG emphasizes the inflection points on the original PPG wave, SDPPG provides more information than PPG; so SDPPG is more effective in diagnosing disease.
Figure 3 shows the PPG signal and the corresponding SDPPG signal. An SDPPG signal is characterized by the five sequential waves denoted by a, b, c, d, and e in Figure 3, and the wave information is used to detect vascular diseases. For example, an SDPPG aging index, defined as (b-c-d-e)/a, is associated with atherosclerosis in elderly patients [13]. Therefore, SDPPG is considered instead of PPG in this paper, even though the algorithm is also applicable to PPG.
Figure 4 shows the spectrum of PPG and SDPPG signals. The spectrums of PPG and SDPPG are defined between 0 and 10 Hz, and between 0 and 14 Hz, respectively [17], while according to our spectrum analysis the 99% powers of PPG and SDPPG signals are accumulated below 5 Hz and 10 Hz, respectively. Hence, low-pass filtering with cutoff frequency of 20 Hz will not distort the shape of SDPPG signals.

2.2. Noise in SDPPG Measurement

Using peak to peak intervals (PPIs) of an SDPPG signal, a heart rate can be detected. PPI is defined as the time interval between the maximum values of one signal and the next period signal, as shown in Figure 3. As explained earlier, the SDPPG signal contains not only PPI but also other information that can help diagnose diseases. Hence the shape of the SDPPG signal is crucial. However, noises in measurement such as background noise and movement noise distort SDPPG signal shapes and can result in incorrect diagnoses. Therefore, a noise cancellation algorithm is required to remove the background noise and movement noise.
The background noise maintains the main shape of SDPPG signals, but PPI can be affected. The background noise can be filtered out with a low-pass filter [5]. When there is movement noise in a measurement, the SDPPG signal shapes are significantly distorted, as shown in Figure 5. The movement noise affects SDPPG measurement differently, according to the type of movement, such as walking, vertical motion, or horizontal motion [9]. Hence, it is difficult to analyze and remove movement noise.
In this paper, an algorithm is proposed to detect and remove movement noise in SDPPG signals using wavelet transform and multi-path signals. To that end, we briefly review the wavelet transform and diversity combining in the next section.

3. Overview of Wavelet Transform and Diversity Combining

3.1. Overview of Wavelet Transform

The wavelet transform is one of the most popular methods of time-frequency transformations; it has multiple bases and changes the time-frequency resolution. The heartbeat pulse wave is an almost periodic signal, defined as a signal that is periodic to within any desired level of accuracy. In a normal state, a subject-dependent pulse shape repeats in time, and the shape and period of the pulse can vary slightly. Hence, wavelet transform is suitable for analysis of PPG and SDPPG signals.
The discrete wavelet transform performs decomposition of signals into multi-resolution sub-band representations with two disjoint digital filters: a low-pass filter of impulse response g[n] in (1) and a high-pass filter of impulse response h[n] in (2). The two filters are a quadratic mirror filter, which satisfies the half-band condition [14]. Output signals down-sampled by 2 via the low-pass filter and the high-pass filter are called approximation coefficients (A[n]) and detail coefficients (D[n]), respectively. Hence, the original signal S[n] consists of the approximation and detail coefficients, as seen in (3).
A [ n ] = ( x g ) [ n ] = k = x [ k ] g [ 2 n k ]
D [ n ] = ( x h ) [ n ] = k = x [ k ] h [ 2 n k ]
S [ n ] = A [ n ] + D [ n ]
The approximation is repeatedly decomposed into two coefficients, approximation (AN) and detail (DN) coefficients, where N is the decomposition level of wavelet transform, and the outputs are down-sampled by 2. At the level of the transform, the signal is decomposed into low and high frequencies. Figure 6 shows the example of the 6th level wavelet transform and the corresponding equation is expressed as:
S = A 6 + D 1 + D 2 + D 3 + D 4 + D 5 + D 6

3.2. Overview of Diversity Combining

A combining technique is popular to combat the effects of distortion, referred to as fading, on wireless systems [18]. When there are a transmitter and multiple receiving antennas, the received signals have different degradation since they experience different fading levels.
The receiver combines diverse signals bearing the same information in order to increase the overall quality of the received signal [18]. There are four types of diversity combining: maximal-ratio combining, equal-gain combining, selection combining, and switch combining. Maximal-ratio combining sums the received signal with weights. Equal-gain combining sums all the received signals synchronously. Selection combining selects the best signal among the multiple received signals. Switch combining switches to another signal when the quality of the selected signal goes below a certain threshold.
In this study, there is only one source (heart) and diverse signals (multiple signals measured at different locations). Hence, a diversity combining scheme is employed to improve the received signal quality. While the signal-to-noise ratio is used as a quality measure in the communication community [18], a signal and noise cannot be separately measured in an SDPPG (or PPG) signal. Hence, for diversity combining, a quality measure for SDPPG signals will be defined and explained later.

4. Proposed Algorithm

In this paper, an algorithm is proposed to detect movement noise and mitigate the impact of mobility on SDPPG measurement by using multipath signals and the wavelet transform. First, SDPPG signals are measured at different locations on a body, such as fingers and ears, and background noise is removed using a low-pass filter. The algorithm determines a reference signal using the measured SDPPG signals. Time offsets between received signals are aligned in order to compare the measured signals. To determine whether the measured signals include movement noise, the wavelet transform is applied to each signal. Based on the composed signals in the frequency domain, the movement noise is detected and removed. The algorithm procedure is summarized in Figure 7 and the details of each step will be explained in the following subsections.

4.1. Multi-channel SDPPG Measurement

SDPPG signals can be measured at multiple locations on body details such as fingers, toes, ears, and wrists even if the heart is the only source. Measuring locations that are independently influenced by movement are chosen since the more independent multipath signals bring the better signal combining performance in wireless communications [18]. For example, two fingers on the same hand may be identically influenced by arm motion and have strongly correlated movement noise. Hence, a toe and a finger, or a finger and an ear would be a better selection to measure SDPPG signals.

4.2. Selection of Mother Wavelet

Because of ambient and electric noises, measurement signals inherently include a background noise. The electric noise is generally included in the high-frequency band, and interferes with detection of PPI. Such a noise can be removed by a low-pass filter [
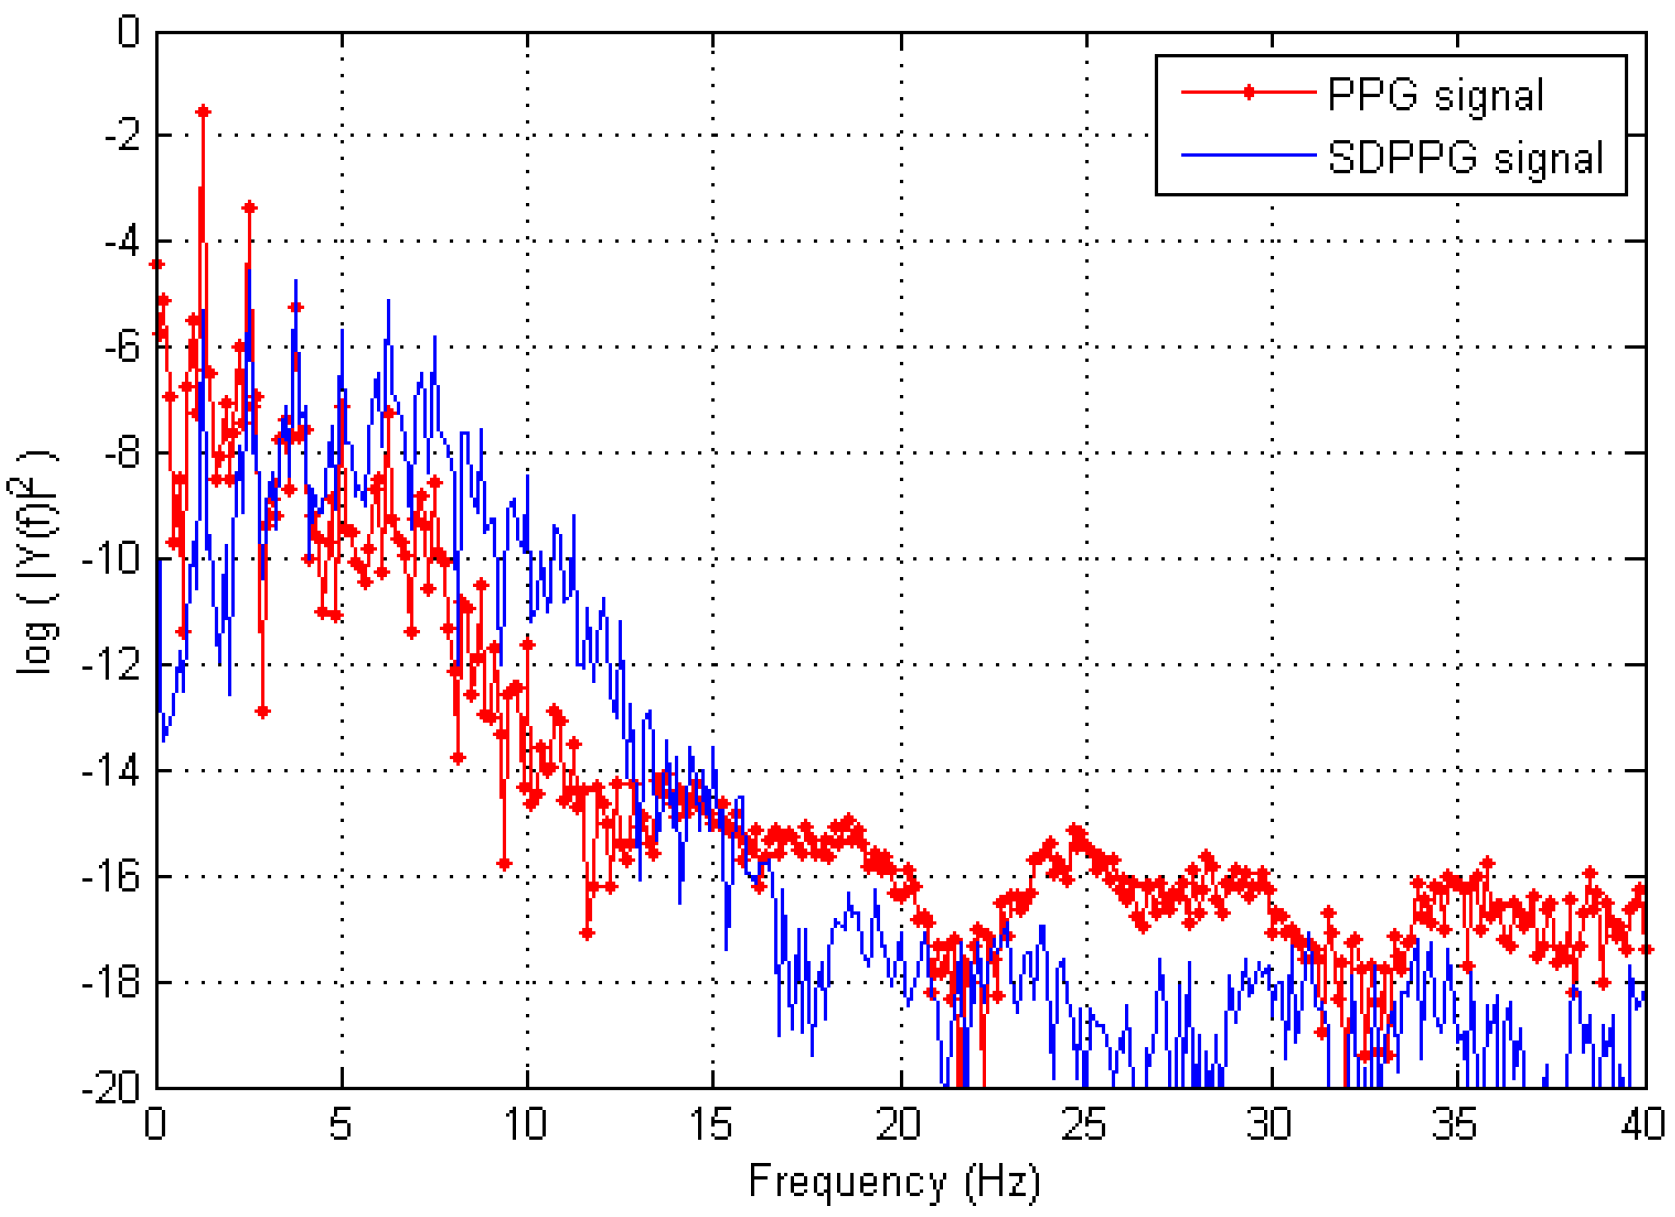
6]. Since human heart rates are in the range of 40 to 200 per minute [19] and the 99% power of SDPPG is below 10 Hz described in Section 2, a low-pass filter with a cutoff frequency of 20 Hz can remove such a noise.
After removing background noise from the measured signal, the algorithm determines a reference signal of a single period to select the mother wavelet for wavelet transform. To that end, the SDPPG signal of a few periods is averaged, which is set to a reference signal.
Since an SDPPG signal is dependent on the subject, by cross-correlation between the reference signal and mother wavelets, the algorithm chooses the mother wavelet that is the most similar to the reference signal among mother wavelets such as Harr, Daubechies, or Symlet.

4.3. Normalization and Time-Synchronization

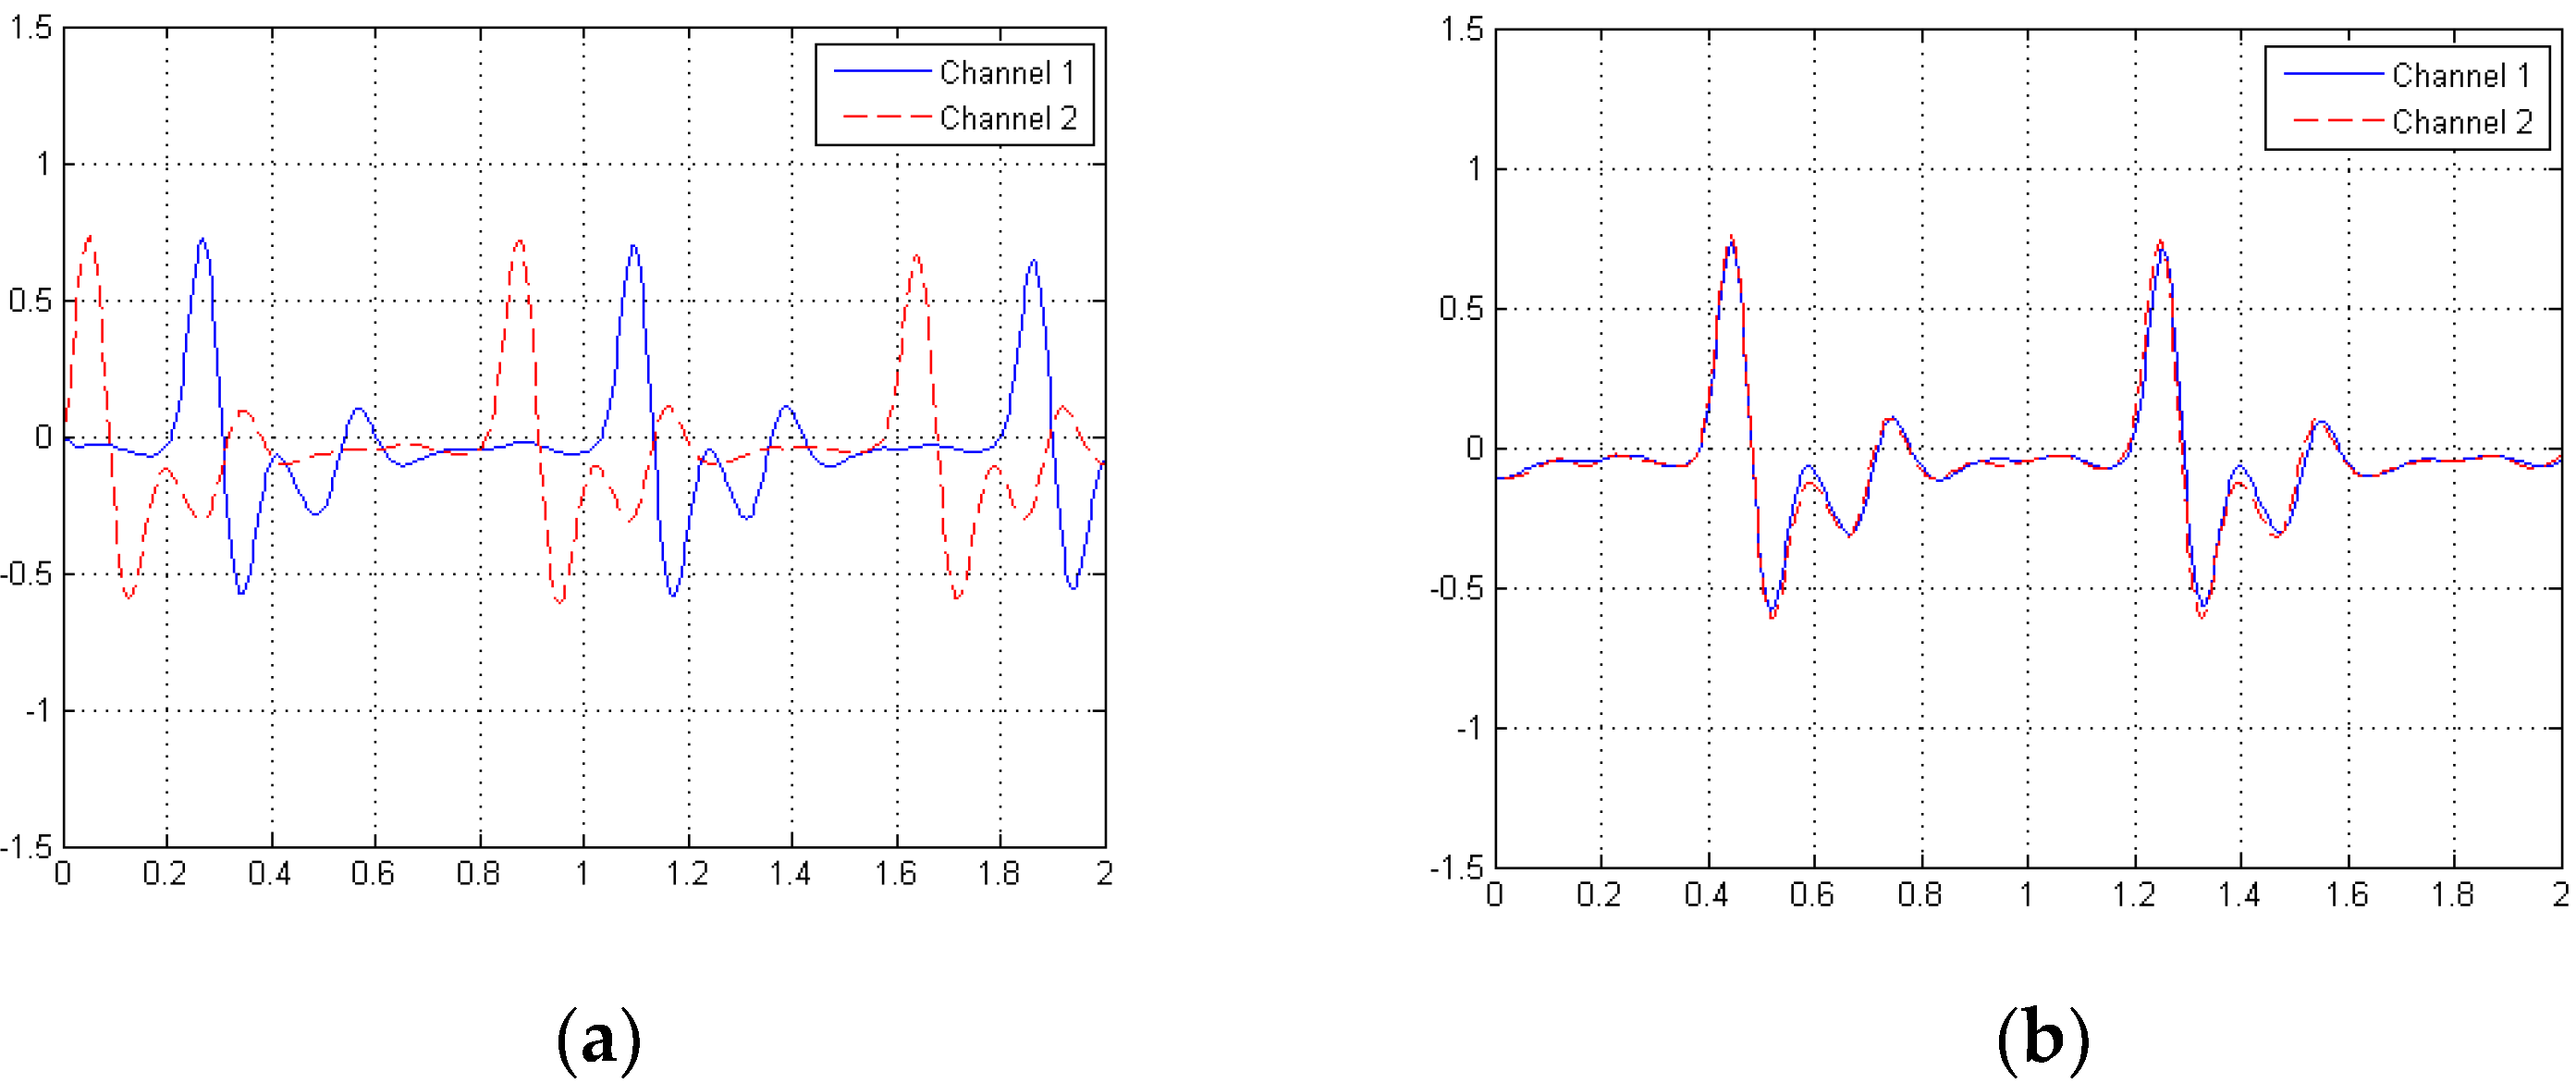
Even if the measured SDPPG signals originate from one source (heart), the received signals may have different amplitudes and traveling times owing to the different paths taken, as shown in Figure 2. The differences in traveling time causes phase differences between received signals, as in 
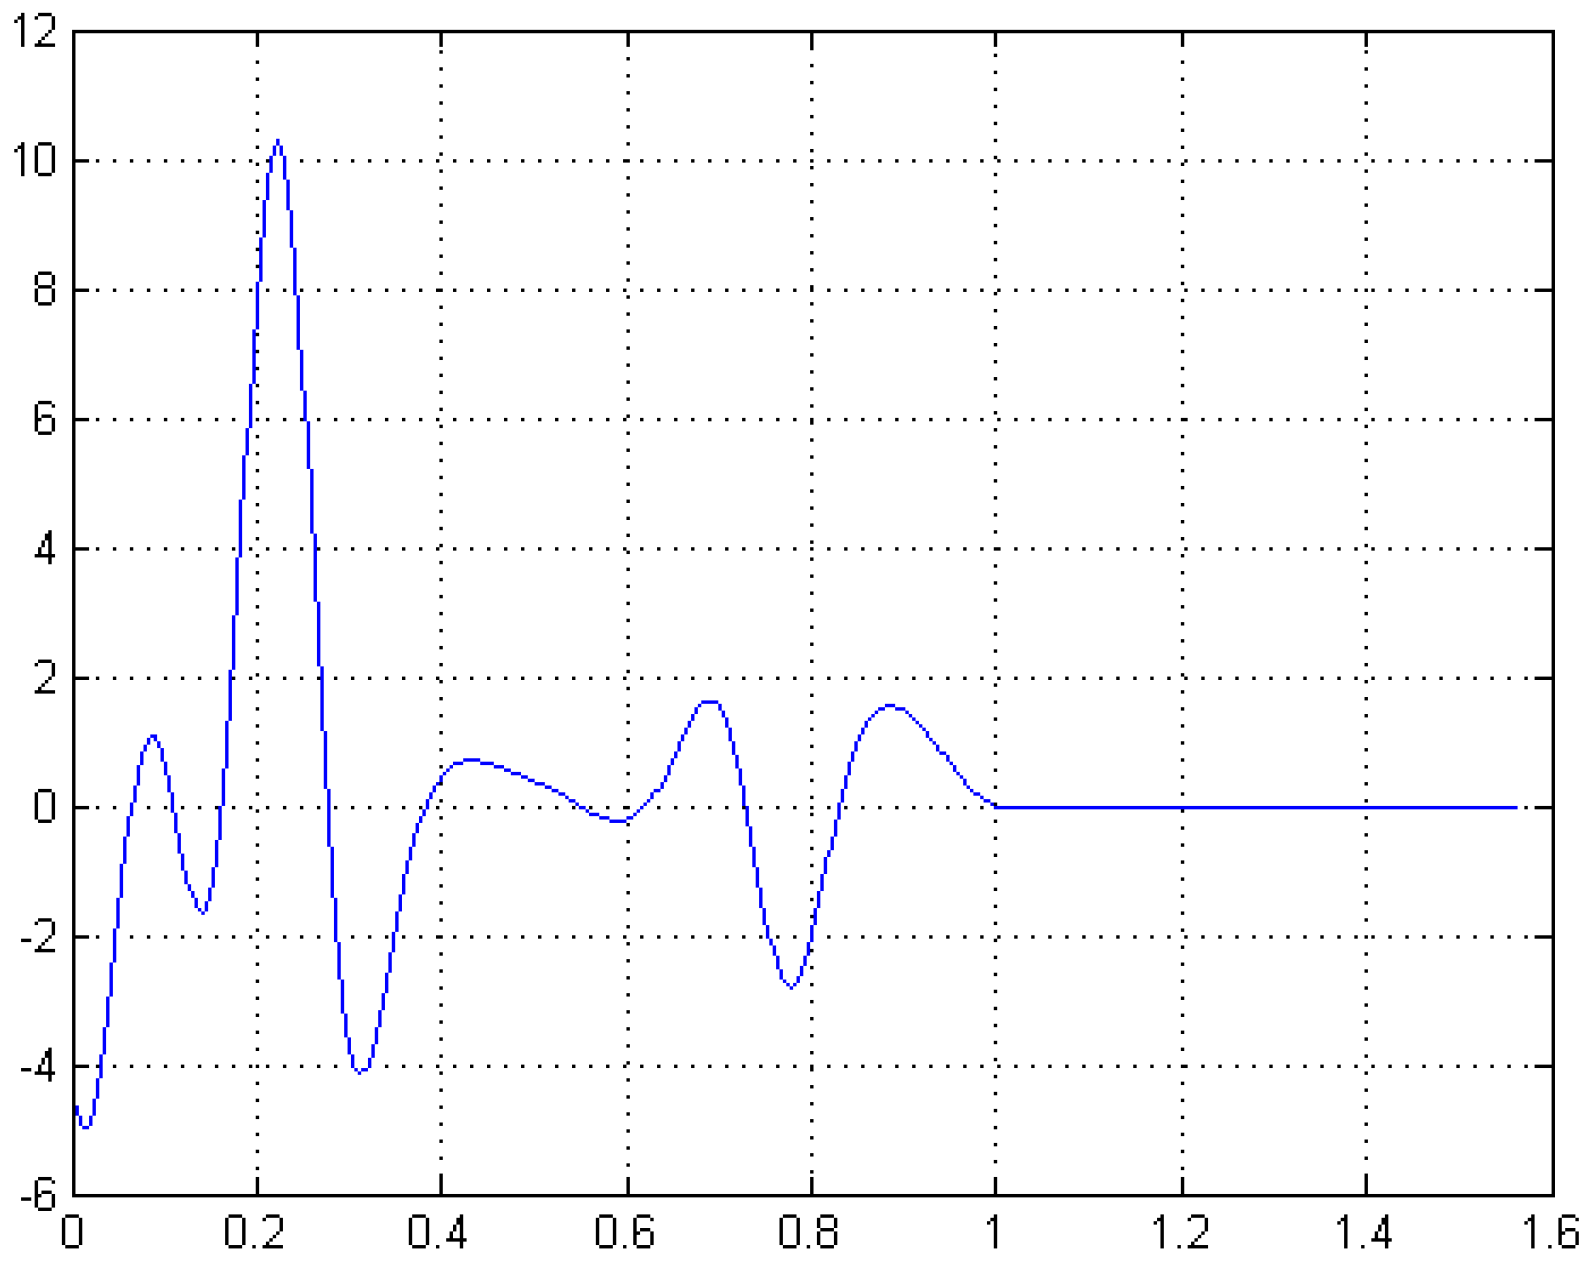
Figure 8a. Such amplitude attenuation and time deviation induce errors in detection and decision during signal processing. To adjust the amplitudes, the signals are scaled to have the same amplitude as the strongest signal. To compensate for time differences between signals, cross-correlation between channel signals is performed to obtain the time difference, as shown in Figure 9. The figure has a maximum value at 0.23 s, which means that the two signals had a 0.23-s time difference due to the travelling paths. Based on time difference computation, the algorithm aligns the times of the two signals, as shown in Figure 8b.

4.4. Wavelet Transform of SDPPG Signals

With the selected mother wavelet, the wavelet transform is performed at each channel. As described in Section 3, signals are iteratively decomposed up to level N, which depends on the sampling rate, as in Figure 10. For example, if the sampling rate of an SDPPG signal is 256 Hz, then the level N is set to 6 so that the frequency band of the decomposed approximation components becomes between 0 and 4 Hz [14]. Table 1 shows the frequency band according to the level of the wavelet transform at a 256 Hz sampling rate.
A signal period is detected using approximation components, AN in level N, for which the frequency range is between 0 and 4 Hz, whereas movement noise is detected using detail components DN-3 in a level N-3, for which the frequency range is between 32 and 64 Hz. Since measured signals are low-pass filtered out with a cutoff frequency of 20 Hz, as explained in Section 2 and Section 4.2, signals higher than the cutoff frequency are mainly related to movement noise at the sampling rate of 256 Hz. In addition, the heart rate is obtained from AN by computing PPIs.

4.5. Detection and Cancellation of Movement Noise

The algorithm detects noise in SDPPG signals during periods of pulse waves. Instead of continuous time, we consider time slots of which length is the pulse wave period. The length of the time slots can vary according to subjects. Even if signals are measured for a single subject, the duration of the pulse wave can vary according to physical conditions, so a fixed slot time cannot be used for this work. Hence, the algorithm first defines time slots of a pulse wave from the approximation coefficients that contains frequencies between 0 and 4 Hz, and determines whether the movement noise is included in each time period using the detail coefficient that contains a frequency range between 32 and 64 Hz. Each time slot is defined as the time from a peak time to the next peak time of AN. The procedure for movement noise detection is summarized in Figure 11.
After determining a time slot, to decide whether movement noise exists the algorithm checks whether the period of the time slot is less than a threshold (Thp). In this paper, the threshold is set to 0.3 (In [17], the heart rate is 40–200 beats per minute, which means that the shortest period is 0.3 s.), since the typical heart rate is between 0 and 4 Hz. If the period is less than 0.3 s, i.e., the heart rate is greater than 200 beats per minute, it is decided that the subject is abnormal or the signal is contaminated. If the period of the measured signal is greater than or equal to 0.3 s, the algorithm computes the power of the detail components between 32 and 64 Hz to detect a movement noise.
To determine how much noise is included in a signal for any duration, for a given period the signal-plus-noise-to-signal (SNS) is defined as
S N S = Total   power   of   measured   signal   and   noise   Total   power   of   a   reference   signal
As a signal and a noise cannot be separately measured, the algorithm is not able to directly use the signal quality used in communications, which is defined as the signal-to-noise ratio. SNSiS and SNSiD(N-3) denote SNS of the total signal and SNS of the detail component of level N − 3 at channel i, respectively.
If the SNS of detail component of level N − 3, whose frequency range is between 32 and 64 Hz, is greater than a threshold ThD(N-3), the algorithm decides that the SDPPG signal includes movement noise during the period. Otherwise, the SDPPG signal has no noise. If only one channel has no noise among the channels, the algorithm selects the channel signal at the period without further computation. Otherwise, the algorithm calculates SNSs of the measured signals for all channels and chooses the best channel signal as the selection combining scheme [18]. Since the SNS closest to one means that the signal has the highest fidelity to the reference signal, the algorithm chooses the best channel such that
k = arg min { i   in   all   channels } | S N S S i 1 |
Instead of SNSiS, alternative measures for selecting the channel can be used, such as SNSiD(N−3) of the SDPPG signal instead of its detail components.

5. Experiments

5.1. Experiment Environments

For experiments, SDPPG signals were measured at two different places (a finger and a toe or two index fingers) on five adults using at a sampling rate of 256 Hz. Four 120-s experiments were conducted per person.
For a reference signal, SDPPG signals were recorded at each channel after three seconds to reduce the impact of the initial setting, and five periods of the SDPPG signal were averaged. Subjects sitting in a comfortable chair randomly moved their fingers or their toes during a certain time period. For movement noise detection, the period threshold (Thp) and the SNS threshold (ThSNS) are set to 0.3 and 1.5, respectively.

5.2. Movement Noise Detection and Cancellation Performance

Figure 12a shows a measured SDPPG signal with movement noise and Figure 12b,c show A6 and D3 of wavelet transform results, respectively. The algorithm extracts time slots of the pulse waves from the peaks (marked with asterisks) of Figure 12b, and detects movement noise from the power of the detail components of Figure 12d during a slot period. To determine whether movement noise is included in the period, the algorithm computes the SNS of the detail component of level 3 and compares it with a threshold. If the SNS is greater than 1.5, the SDPPG signal in the period contains movement noise; otherwise, the SDPPG signal during the period has no noise. Detection is performed at all channels.
As shown in Figure 12c, when an SDPPG signal is distorted by movement noise, the detail component surges according to the noise level. Hence, movement noise can be detected.
After detecting movement noise in each period, the algorithm selects the best quality SDPPG signal among channels. If only one channel is unaffected by movement noise, the algorithm selects the signal of that channel. If there is more than one channel that has noise, the channel signal where SNS is closest to 1 is chosen.
Figure 13 shows an example of removing movement noise by the proposed algorithm in various environments. In cases when only one of two channels has movement noise in the time period between 15 and 35 s, as shown in the Figure 13, the noise is removed at the output signals. In cases when all the channels simultaneously have movement noise in the time period between 45 and 60 s, the noise is reduced, but not entirely removed, by selecting the better signal. When two signals are decided to be clean in the time period between 0 and 15 s, the algorithm selects the better signal among them.
We evaluated the performance of our proposed algorithm in terms of accuracy, sensitivity, and specificity (Sensitivity, specificity, and accuracy are used to check the effectiveness of diagnostic test to correctly identify the patients and healthy persons [20]. In our paper, these terms are used to evaluate the performance of our proposed algorithm to correctly identify the noise and noise free time period.). The accuracy is the ratio of the correctly detected noise and noise free period to the total time period. The sensitivity is the ratio of the correctly detected noise period to the total noise period while the ratio of the correctly detected noise free period to total noise free period is define as specificity.
Table 2: Noise detection Performance represents the mean and standard deviation of accuracy, sensitivity and specificity of all cases in channel 2.

5.3. Performance Comparison

In this subsection, the performance of the proposed algorithm was verified in various movement noise environments, as shown in Table 3. SDPPG signals were measured at pairs of different locations on the subjects: two index fingers (Cases 1, 2, and 3), and one index finger and one toe (Case 4). The subject moved randomly in order to insert movement noise. The noise ratio of channels 1 and 2 in the table implies the ratio of the time period of inserted movement noise to the total experiment time of 120 s. The amount of movement noise on Channel 1 was set to include less than that of Channel 2.
For performance comparison, three previous noise reduction algorithms, PMAF [10], constant step-size LMS (CS-LMS) [9] and independent component analysis LMS (ICA-LMS) are considered. Since these three algorithms are proposed to reduce noise in a single PPG signal, the algorithms are applied to the PPG signal of Channel 1, which contains a smaller amount of noise than Channel 2. After removing movement noise with the previous algorithms, the corresponding SDPPG signals are computed to compare with the proposed algorithm.
Figure 14 shows the experiment results, which are the average of five person results from each case. The noise at output in Figure 14a is the ratio of time period of SDPPG signals with movement noise after noise cancellation to total experiment time. The noise reduction in Figure 14b is the ratio of reduced time period of a noisy SDPPG signal to the time period in which movement noise was inserted on Channel 1.
The experiment results show that the proposed algorithm using wavelet transform and diversity combining can effectively reduce movement noise, and it outperforms the previous algorithms, as shown in Figure 14. While more movement noise in the input signal brings more noise in the results, as shown in Cases 1, 2, and 3 of Figure 14a, the output noise of the proposed algorithm is reduced much more than from the other algorithms, as shown in Figure 14b, even if the second channel signal has more noise than, or the same noise as, Channel 1. For example, in Case 3, the proposed algorithm reduces the amount of noise to 8.73% from 30% (i.e., a 70.89% noise reduction) while PMAF, CS-LMS, and ICA-LMS result in 38.29% (−29.29%), 25.56% (14.79%), and 25.99% (13.38%), respectively. The previous algorithms could not reduce movement noise efficiently while claiming that they improve only PPI variations of a PPG signal [9], [10] and [12], which corresponds to the heart rate variation. Since the PMAF algorithm averages the shapes of multiple periods, the noise can influence the shape of the next periods, which results in deterioration of the SDPPG signals over a greater time duration. Hence, the noise ratios with PMAF increase, and the noise reduction ratios become negative values. When filtering signals, the CS-LMS algorithm partially lessens low-frequency movement noise so that reduction in movement noise is limited. The ICA-LMS algorithm can reduce slow motion artifacts like vertical movement of fingers in heart rates, but it changes and distorts the shape of PPG signals. If the motion artifacts and PPG signals are not independent, the ICA-LMS algorithm performance is degraded, as discussed in [12].
Our algorithm performance is also robust to measurement locations. In Case 4, which measured signals at a toe and a finger, the performance of the previous algorithms is poorer than in Case 2, which measured two fingers, even if the amount of movement noise on Channel 1 is identical. But our algorithm shows similar performance in Cases 2 and 4. The SDPPG signal measured at a toe has lower power and is more distorted than when measured at a finger due to longer channel path and channel attenuation environment. Hence, the performance of the previous algorithms is degraded, but our algorithm performs robustly at the measurement locations by using wavelet transform and diversity of signals measurement.

6. Conclusions

Among a variety of bio-signals, PPG-related signals such as PPG and SDPPG are widely used for health care applications because of their easy and comfortable measurement. However, PPG and SDPPG signals are vulnerable to movement noise in measurement. Compared to PPG, an SDPPG signal has more information for diagnosing diseases, but is more sensitive to movement noise. Deterioration of SDPPG can result in incorrect diagnosis.
To remove movement noise, an algorithm was developed using wavelet transform and a selection combining technique. Since SDPPG is almost periodic with subject-dependent pulse shape and a band-limited signal, wavelet transform is used for detecting movement noises. SDPPG signals originating from one source (heart) can be measured at different locations so that a diversity combining scheme can be adopted to reduce movement noise. Contrast to previous algorithms, the proposed algorithm improves not only PPI performance but also the shape of SDPPG, which results in better diagnosis. In experiments, movement noise could be reduced by up to 70.89%. The proposed approach is also applicable to PPG and other bio-signals that have periodicity and measurement diversity.

Author Contributions

Conceived the method and wrote the manuscript, D.B.; Designed experiments, D.B. and S.K.; Results analysis, D.B., S.M.S., and S.K.; Writing–review & editing, S.M.S.; Supervision, S.K.

Funding

This work was supported by the 2015 Research Fund of the University of Ulsan.

Conflicts of Interest

The authors declare no conflict of interest.

References

  1. Zhang, Y.; Rau, P.L.P. Playing with multiple wearable devices: Exploring the influence of display, motion and gender. Comput. Hum. Behav. 2015, 50, 148–158. [Google Scholar] [CrossRef]
  2. Hossain, M.S.; Muhammad, G. Cloud-assisted industrial internet of things (iiot)–enabled framework for health monitoring. Comput. Netw. 2016, 101, 192–202. [Google Scholar] [CrossRef]
  3. Pantelopoulos, A.; Bourbakis, N. A Survey on Wearable Sensor-Based Systems for Health Monitoring and Prognosis. IEEE Trans. Syst. Man Cybern. C Appl. Rev. 2010, 40, 1–12. [Google Scholar] [CrossRef] [Green Version]
  4. Abe, E.; Fujiwara, K.; Kano, M.; Chigira, H.; Yamakawa, T. Development of Photoplethysmogram sensor-embedded video game controller. In Proceedings of the IEEE ICCE 2016, Las Vegas, NV, USA, 7–11 January 2016; pp. 425–426. [Google Scholar]
  5. Tamura, T.; Maeda, Y.; Sekine, M.; Yoshida, M. Wearable Photoplethysmographic Sensors—Past and Present. Electronics 2014, 3, 282–302. [Google Scholar] [CrossRef]
  6. Kim, S.; Ryoo, D.; Bae, C. Adaptive noise cancellation using accelerometers for the PPG signal from forehead. In Proceedings of the IEEE Annual International Conference on EMBS 2007, Lyon, France, 22–26 August 2007; pp. 2564–2567. [Google Scholar]
  7. Patterson, J.A.C.; McIlwraith, D.C.; Yang, G.Z. A flexible, low noise reflective PPG sensor platform for ear-worn heart rate monitoring. In Proceedings of the Sixth International Workshop on Wearable and Implantable BSN, Berkeley, CA, USA, 3–5 June 2009; pp. 286–291. [Google Scholar]
  8. Lee, C.; Zhang, Y. Reduction of motion artifacts from photoplethysmographic recordings using a wavelet denoising approach. In Proceedings of the IEEE EMBS Asian-Pacific Conference on Biomedical Engineering 2003, Kyoto, Japan, 20–22 October 2003; pp. 194–195. [Google Scholar]
  9. Ram, M.R.; Madhav, K.V.; Krishana, E.H.; Komalla, N.R.; Reddy, K.A. A novel approach for motion artifact reduction in PPG signals based on AS-LMS adaptive filter. IEEE Trans. Instrum. Meas. 2012, 61, 1445–1457. [Google Scholar] [CrossRef]
  10. Lee, H.; Lee, J.; Jung, W.; Lee, G. The periodic moving average filter for removing motion artifacts from PPG signals. Int. J. Control Autom. Syst. 2007, 5, 701–706. [Google Scholar]
  11. Yang, D.; Cheng, Y.; Zhu, J.; Xue, D.; Abt, G.; Ye, H.; Peng, Y. A Novel Adaptive Spectrum Noise Cancellation Approach for Enhancing Heartbeat Rate Monitoring in a Wearable Device. IEEE Access 2018, 6, 8364–8375. [Google Scholar] [CrossRef]
  12. Peng, F.; Zhang, Z.; Gou, X.; Liu, H.; Wang, W. Motion artifact removal from photoplethysmographic signals by combining temporally constrained independent component analysis and adaptive filter. Biomed. Eng. Online 2014, 13, 50. [Google Scholar] [CrossRef] [PubMed] [Green Version]
  13. Bortolotto, L.; Blacher, J.; Kondo, T.; Takazawa, K.; Safar, M. Assessment of vascular aging and atherosclerosis in hypertensive subjects: Second derivative of photoplethysmogram versus pulse wave velocity. Am. J. Hypertens. 2000, 13, 165–171. [Google Scholar] [CrossRef]
  14. Rao, R.; Bopardikar, A. Wavelet Transforms: Introduction to Theory and Applications; Pearson Education: Delhi, India, 1998. [Google Scholar]
  15. Ban, D.; Kwon, S. Movement noise cancellation in PPG signals. In Proceedings of the IEEE ICCE 2016, Las Vegas, NV, USA, 7–11 January 2016; pp. 47–48. [Google Scholar]
  16. Takazawa, K.; Tanaka, N.; Fujita, M.; Matsuoka, O.; Saiki, T.; Aikawa, M.; Tamura, S.; Ibukiyama, C. Assessment of vasoactive agents and vascular aging by the second derivative of photoplethysmogram waveform. Hypertension 1998, 32, 365–370. [Google Scholar] [CrossRef] [PubMed]
  17. Elgendi, M.; Fletcher, R.R.; Norton, I.; Brearley, M.; Abbott, D.; Lovell, N.H.; Schuurmans, D. Frequency analysis of photoplethysmogram and its derivatives. Comput. Methods Programs Biomed. 2015, 122, 503–512. [Google Scholar] [CrossRef] [PubMed]
  18. Alouini, M.-S.; Marvin, S. An MGF-based performance analysis of generalized selection combining over Rayleigh fading channels. IEEE Trans. Commun. 2015, 48, 401–415. [Google Scholar] [CrossRef]
  19. Sagie, A.; Larson, M.G.; Goldberg, R.J.; Bengtson, J.R.; Levy, D. An improved method for adjusting the QT interval for heart rate (the Framingham Heart Study). Am. J. Cardiol. 1992, 70, 797–801. [Google Scholar] [CrossRef]
  20. Zhu, W.; Zeng, N.; Wang, N. Sensitivity, specificity, accuracy associated confidence interval and ROC analysis with practical SAS implementations. In Proceedings of the NESUG Proceedings: Health Care and Life Sciences, Baltimore, Maryland, 2010; Volume 19, p. 67. [Google Scholar]
Figure 1. An example of photoplethysmography (PPG) sensing.
Applsci 08 01531 g001
Figure 2. Examples of PPG measurement: ear, fingers, and toes.
Applsci 08 01531 g002
Figure 3. PPG and second derivative of photoplethysmography (SDPPG) signals.
Applsci 08 01531 g003
Figure 4. Spectrum of PPG and SDPPG signals.
Applsci 08 01531 g004
Figure 5. SDPPG signal distorted by movement noise.
Applsci 08 01531 g005
Figure 6. Wavelet packet decomposition.
Applsci 08 01531 g006
Figure 7. The overall procedure of the proposed algorithm.
Applsci 08 01531 g007
Figure 8. Time-compensation: (a) originally measured signals; (b) time-aligned two signals.
Applsci 08 01531 g008
Figure 9. Cross-correlation between two channels.
Applsci 08 01531 g009
Figure 10. Decomposition level decision procedure.
Applsci 08 01531 g010
Figure 11. Procedure of movement noise detection algorithm.
Applsci 08 01531 g011
Figure 12. Noise analysis: (a) measured signal; (b) A 6 components and peaks; (c) D3 components; (d) Power of D3.
Applsci 08 01531 g012
Figure 13. Noise cancellation results: (a) an SDPPG signal measured on channel 1; (b) an SDPPG signal measured on channel 2; (c) an SDPPG signal on output.
Applsci 08 01531 g013
Figure 14. Performance comparison: (a) noise ratio at output, and (b) noise reduction ratio with respect to the amount of noise on Channel 1.
Applsci 08 01531 g014
Table 1. Frequency Distribution when the Sampling Rate is 256 Hz.
N A N   ( Hz ) D N   ( Hz )
10–128128–256
20–6464–128
30–3232–64
40–1616–32
50–88–16
60–44–8
Table 2. Noise detection Performance.
AccuracySensitivitySpecificity
Mean 0.9821.0000.977
Standard Deviation0.0100.0000.014
Table 3. Experiment Environments.
Channel 1Channel 2
LocationNoise (%)LocationNoise (%)
Case 1Finger10Finger20
Case 2Finger15Finger20
Case 3Finger30Finger30
Case 4Toe15Finger30

