Article

Identifying Node Importance in a Complex Network Based on Node Bridging Feature

1
Science and Technology on Information Systems Engineering Laboratory, National University of Defense Technology, Changsha 410073, China
2
Courant Institute of Mathematical Sciences, New York University, New York, NY 10012, USA
3
School of Electronics Engineering and Computer Science, Peking University, Beijing 100871, China
*
Author to whom correspondence should be addressed.
Appl. Sci. 2018, 8(10), 1914; https://doi.org/10.3390/app8101914
Submission received: 3 September 2018 / Revised: 11 October 2018 / Accepted: 12 October 2018 / Published: 15 October 2018

Abstract

:
Identifying node importance in complex networks is of great significance to improve the network damage resistance and robustness. In the era of big data, the size of the network is huge and the network structure tends to change dynamically over time. Due to the high complexity, the algorithm based on the global information of the network is not suitable for the analysis of large-scale networks. Taking into account the bridging feature of nodes in the local network, this paper proposes a simple and efficient ranking algorithm to identify node importance in complex networks. In the algorithm, if there are more numbers of node pairs whose shortest paths pass through the target node and there are less numbers of shortest paths in its neighborhood, the bridging function of the node between its neighborhood nodes is more obvious, and its ranking score is also higher. The algorithm takes only local information of the target nodes, thereby greatly improving the efficiency of the algorithm. Experiments performed on real and synthetic networks show that the proposed algorithm is more effective than benchmark algorithms on the evaluation criteria of the maximum connectivity coefficient and the decline rate of network efficiency, no matter in the static or dynamic attack manner. Especially in the initial stage of attack, the advantage is more obvious, which makes the proposed algorithm applicable in the background of limited network attack cost.

1. Introduction

In recent years, network science research has attracted a great amount of attention from researchers in different fields including physics, mathematics, chemistry, medical science, biology, computer science, sociology and so on [1,2,3,4,5,6,7,8,9]. In particular, the vulnerability of complex networks is one of the most important directions due to its considerable effect on network cascade failure caused by random failure and deliberate attack [10,11,12,13,14,15,16,17,18]. Random failure can be regarded as a simple abstraction of successive errors in complex networks by destroying nodes or edges with uniform probability. Deliberate attack means that the network nodes or edges are attacked according to their importance in descending order under the premise of mastering global information of the network [19,20,21,22,23]. On 14 August 2003, a large-scale power cascade failure in the northeastern United States and eastern Canada caused global concern. Similarly, in early 2008, due to some damage to major transmission lines and key towers, severe ice sheet disasters in southern China caused large-scale blackouts. These examples indicate that important node failure may result in great damage on the whole network. One of the crucial questions in protecting networks from cascading failures is to design an efficient method to identify important nodes and take protective strategies. The important nodes in the network refer to a tiny fraction of special nodes that have great influence on the structure and function of the network [24,25]. The more important the node, the greater influence the node failure causes. For example, researchers have found that, in networks such as email networks, the Internet, protein networks, food chain networks and peer-to-peer (P2P) networks, removing the nodes with the largest degree will cause the network to become very vulnerable.
Many centrality measures are proposed to evaluate node importance in complex networks, including degree [26], closeness [27], betweenness [28,29] and so on. Degree is a very simple and classic one which identifies the node importance by just calculating the number of nodes connected to the target node. However, the precision of its computation is not high enough in most applications and nodes with the same degree may play different important roles in a complex network. Betweenness and closeness collect global information of the network to compute the importance of nodes. The two centralities need to calculate the shortest path between any pair of nodes in the network. The computational complexity is too high and thus they are not suitable for large-scale networks. In [30], ego network betweenness was proposed to compute the betweenness centrality of ego in an ego network. Its scalability and ease of implementation makes it a good alternative for betweenness in large networks. A lot of metrics on the computation of complex network were designed for large complex networks later [31,32,33,34].
Additionally, there are many other studies on this issue. Kitsak et al. [35] proposed a novel network decomposition method to identify the most important nodes by continuously removing the peripheral nodes, and the simulation result showed that it is positive and efficient. Wang et al. [36] considered that the importance of nodes is related to the degree of nodes and their neighbors, and proposed a new algorithm WL to rank the importance of network nodes. Ugander et al. [37] found that the number of connected subgraphs between neighboring nodes is the determining factor of node importance. Ai et al. [38] proposed an entropic metric, Entropy Variation, defining the node importance as the variation of network entropy before and after its removal. By quantifying the structural similarity between nodes’ neighborhoods, Ruan et al. [39] proposed a node importance ranking algorithm which only needs to obtain the neighborhood information within two hops of the node. The algorithm showed that the bigger the degree of a node and the fewer connections between neighboring nodes, the more important the target node.
In this paper, we propose a novel method called NBF (based on node bridging feature) to identify the importance of nodes in the network. It is a challenging work to rank node importance in complex networks due to its large-scale size and frequently changed topology. We summarize the major contributions by the following four ingredients:
  • The paper presents a node bridging feature in complex networks, which refers to the fact that the greater the number of node pairs whose shortest paths pass through the target node and the less the number of shortest paths in its neighborhood, the more significant bridge function and structure importance the node has;
  • We propose a novel node importance identification algorithm based on the node bridging feature, which just needs local information of the target nodes, making the algorithm applicable in large-scale networks;
  • Through comprehensive experiments on real and synthetic datasets, the proposed algorithm is demonstrated to outperform a state-of-the-art model compared with five benchmark algorithms on evaluation criteria of the maximum connectivity coefficient and the decline rate of network efficiency, no matter whether in static or dynamic attack strategies;
  • The advantage of the proposed algorithm is more obvious when removing a small number of important nodes, which makes the algorithm applicable in the background of limited network attack cost.
The outline of this paper is as follows. In Section 2, we present our method to identify node importance and introduce the benchmark algorithms, evaluation criteria and datasets. We make simulation analysis on real and synthetic networks under static and dynamic attacks in Section 3. Finally, a summary and some conclusions are stated in Section 4.

2. Materials and Methods

2.1. The Proposed Method

Considering an undirected and unweighted network G ( N , E ) composed of N nodes and E edges, the network is represented by A ( a i j ) N N , where a i j = 1 represents node i and node j are connected; otherwise, a i j = 0 .
From the perspective of the network robustness and invulnerability, when a node does not work due to deliberate attack and the node is on the shortest path between a pair of its neighbor nodes, the connection of the neighbor node pair would be affected. As shown in Figure 1a, node c builds a bridge between node a and node b. Therefore, removing node c will result in disconnection between nodes a and b. In Figure 1b, nodes a, b, c are connected to each other, so node c no longer acts as an intermediary. In this situation, even if node c is removed, nodes a and b can still maintain effective connection. In addition, as shown in Figure 1c, nodes a and b can communicate with each other through c, but other short communication paths such as a d b also exist in the neighbourhood. In this case, the bridging function of node c is weakened. Furthermore, we study the situation when there is a connection between the node’s one-hop neighbors and two-hops neighbors. Figure 1d–f show several ways of direct or indirect contact between nodes a and b. In Figure 1d, when there is only one shortest path between nodes a and b, the bridging feature of node c is obvious. In Figure 1e and Figure 1f, when the shortest path length between nodes a and b is less than 3, even if node c is removed, nodes a and b still keep effective contact for there is absolutely at least one another path between nodes a and b in this case. Similar to Figure 1c, Figure 1f shows when there exist two shortest paths a c d b and a e f b of which the length is 3, the bridging function of node c is also weakened. In this paper, we just take into account the target node’s neighbors within two-hops.
Based on the above observations, we propose a novel method by taking into account the bridging feature of nodes to identify node importance in complex networks. For a node in the network, the greater the number of node pairs whose shortest paths pass through the target node, and the less the number of shortest paths between its neighbor node pairs, the more significant the bridge function and structure importance the node has. The evaluation value of the importance of node i calculated by the algorithm proposed in this paper can be expressed as
N B F ( i ) = m , n Γ 1 ( i ) 1 2 P m n ( 2 ) + x Γ 1 ( i ) , y Γ 2 ( i ) 1 3 P x y ( 3 ) m n , x y ,
where P m n ( 2 ) represents the number of the paths with the shortest path length two-hops between nodes m and n, P x y ( 3 ) represents the number of the paths with the shortest path length three-hops between nodes x and y, Γ 1 ( i ) and Γ 2 ( i ) separately represent the sets of neighbors one-hop and two-hops away from node i. If the two-hops shortest paths of the neighbor node pair (such as m and n) do not pass through the target node i, then define P m n ( 2 ) = , namely, 1 / P m n ( 2 ) = 0 . Similarly, if the three-hops shortest paths of the neighbor node pair do not pass through the target node i, the second part of the formula is also 0. Therefore, when any two nodes in the neighborhood are connected, the NBF value of the target node i is 0.
Taking node c in Figure 1g as an example, we show the calculation process of the algorithm. The number of the shortest paths with two-hops between the node pair a and d is 1, so the first part of the NBF algorithm can be calculated as 1 2 P a d ( 2 ) = 1 2 1 = 0 . 5 . For the two-hops neighbor nodes e and b of node c, calculate the number of the shortest paths with three-hops between them and nodes a and d, separately. It is easy to get P a b ( 3 ) = P e d ( 3 ) = 2 and P a e ( 3 ) = P d b ( 3 ) = . As a result, only the node pair a and b and the node pair d and e contribute to the ranking score of node c. The second part of the NBF algorithm can be calculated as 1 3 P a b ( 2 ) + 1 3 P e d ( 2 ) = 1 3 2 + 1 3 2 0 . 333 . Therefore, the importance of node c in Figure 1g is expressed as N B F ( c ) = 0 . 5 + 0 . 333 = 0 . 8333 .

2.2. Benchmark Methods

We here introduce the benchmark algorithms compared in this paper, including degree centrality, k-shell algorithm, WL algorithm, ego betweenness centrality and LLS algorithm.
  • Degree centrality
    Degree centrality is a very simple ranking algorithm. The node degree k i represents the number of neighbours of node i, namely
    k i = j = 1 N a i j .
  • K-shell algorithm
    The implementation of the k-shell decomposition method is as follows: firstly, continuously remove the nodes with degree one until all nodes’ degrees are larger than one. All of these removed nodes are assigned 1-shell. Then, keep removing the existing nodes until all nodes’ degrees are larger than two and add the removed nodes to 2-shell. Repeat this procedure until all nodes have been assigned to one of the shells.
  • WL algorithm
    WL algorithm holds the opinion that the importance of nodes in the network is closely related to the importance of edges the nodes connected. The weight of edge i j is expressed as
    w i j = k i × k j ,
    where k i is the degree of node i. The weight of node is expressed as
    w i = j Γ i w i j ,
    where Γ i is the set of neighbors of node i. Thus, the importance of the node is expressed as
    w ( i ) = w i j N w j .
  • Ego betweenness (Abbreviated as EgoBet)
    Ego network consists of a target node and the nodes (1-hop neighbors) which are connected to the target node and all the edges between those nodes. The standard measure of betweenness considers all the shortest paths of node pairs across the target node, while ego betweenness just takes into account the shortest paths of node pairs within the ego network. Ego betweenness can be expressed as
    C E B ( i ) = s i t ; s , t Γ 1 ( i ) σ ( s , t | i ) σ ( s , t ) ,
    where σ ( s , t | i ) is the number of shortest paths passing through node i between node s and node t, σ ( s , t ) is the total number of shortest paths between node s and node t, and Γ 1 ( i ) represents the set of 1-hop neighbors of node i.
  • LLS algorithm
    LLS algorithm is a method to evaluate the importance of nodes based on similarity of node neighbors. The similarity of node neighbors is calculated by Jaccard index when nodes b and c are not connected, while the value of similarity is 1 when nodes b and c are connected, namely
    s i m ( b , c ) = n ( b ) n ( c ) n ( b ) n ( c ) b , c not connected ; 1 b , c connected ,
    where b ( i ) is the set of one hop and two hop neighbors of node i. Thus, the node importance is denoted as
    L L S ( i ) = b , c n ( i ) ( 1 - s i m ( b , c ) ) .
For the five benchmark algorithms, k-shell algorithm makes use of the information of the whole network and all of the other five algorithms just utilize the local information.

2.3. Evaluation Criterion of Algorithms

We adopt two criteria: the maximum connectivity coefficient [40] and the decline rate of network efficiency [41,42] to calculate the connectivity of the network after attack, in order to evaluate the effectiveness of the node importance identification algorithms. After important nodes get attacked, the connectivity of the network will turn worse. The more important the nodes, the worse the connectivity of the network.

2.3.1. Maximum Connectivity Coefficient

The maximum connectivity coefficient G can be calculated as follows:
G = R / N ,
where R represents the number of nodes in the maximum connected component after attack and N represents the total number of nodes in the network. The faster the decrease in G, the more efficient the attack strategy.

2.3.2. Decline Rate of Network Efficiency

The most direct effect of node removal is causing the shortest distance between nodes to become longer or even making the nodes unreachable. The network efficiency represents the strength of network connectivity after removing some nodes and can be described as
η = 1 N ( N - 1 ) i , j V η i j ,
where N is the total number of network nodes and η i j is the network efficiency between node pair i and j, η i j = 1 / d i j , d i j is the shortest path between nodes i and j. When nodes i and j are not connected, η i j = 0 . In order to analyze the effect on network efficiency of removing nodes more directly, the decline rate of network efficiency μ is adopted, which is defined as
μ = 1 - η η η 0 η 0 ,
where η 0 is the efficiency of the original network and η is the efficiency of the network after removing nodes. The higher the μ value, the more significant the effect on network efficiency of removing nodes and the more important the removed nodes.

2.4. Data Description

To evaluate the performance of the proposed method, we apply it to real and synthetic networks. The real networks include: USAir (American aviation network) [43,44], Netscience (Scientist cooperation network) [45,46], Infectious (People infection network) [47,48], USAirport (American airport network) [49,50], Yeast (Protein interaction network) [51,52] and Power (Power grid of the western United States) [2,39]. The statistical properties of the six networks are presented in Table 1. It can be seen from the table that the six real data sets used in this paper have their own characteristics and are representative, which can well verify the effectiveness of the algorithm. In addition, one synthetic small-world network is used, which was generated by a Watts–Strogatz model [2] with the parameters N = 6000, K = 6 and p = 0.1. The synthetic network is denoted as WS in this paper.

3. Results and Analysis

On the real and synthetic networks, take degree centrality, k-shell algorithm, WL algorithm, ego betweenness centrality, LLS algorithm and the proposed NBF algorithm as attack strategies and rank the nodes in the network by the five algorithms. Then, remove a fraction of top important nodes according to the ranking result in a static and dynamic manner. Analyze the changes of the maximum connectivity coefficient and the decline rate of network efficiency when the nodes are removed, and verify the effectiveness of the proposed algorithm at last. Static network attacks refer to the network nodes being removed in descending order of node importance calculated initially, regardless of the impact of network structure changes due to node removal. In contrast, dynamic network attacks mean that only the most important node is removed in each round of attack, and all node importance in the remaining network needs to be recalculated each time.

3.1. Experimental Results on the Maximum Connectivity Coefficient

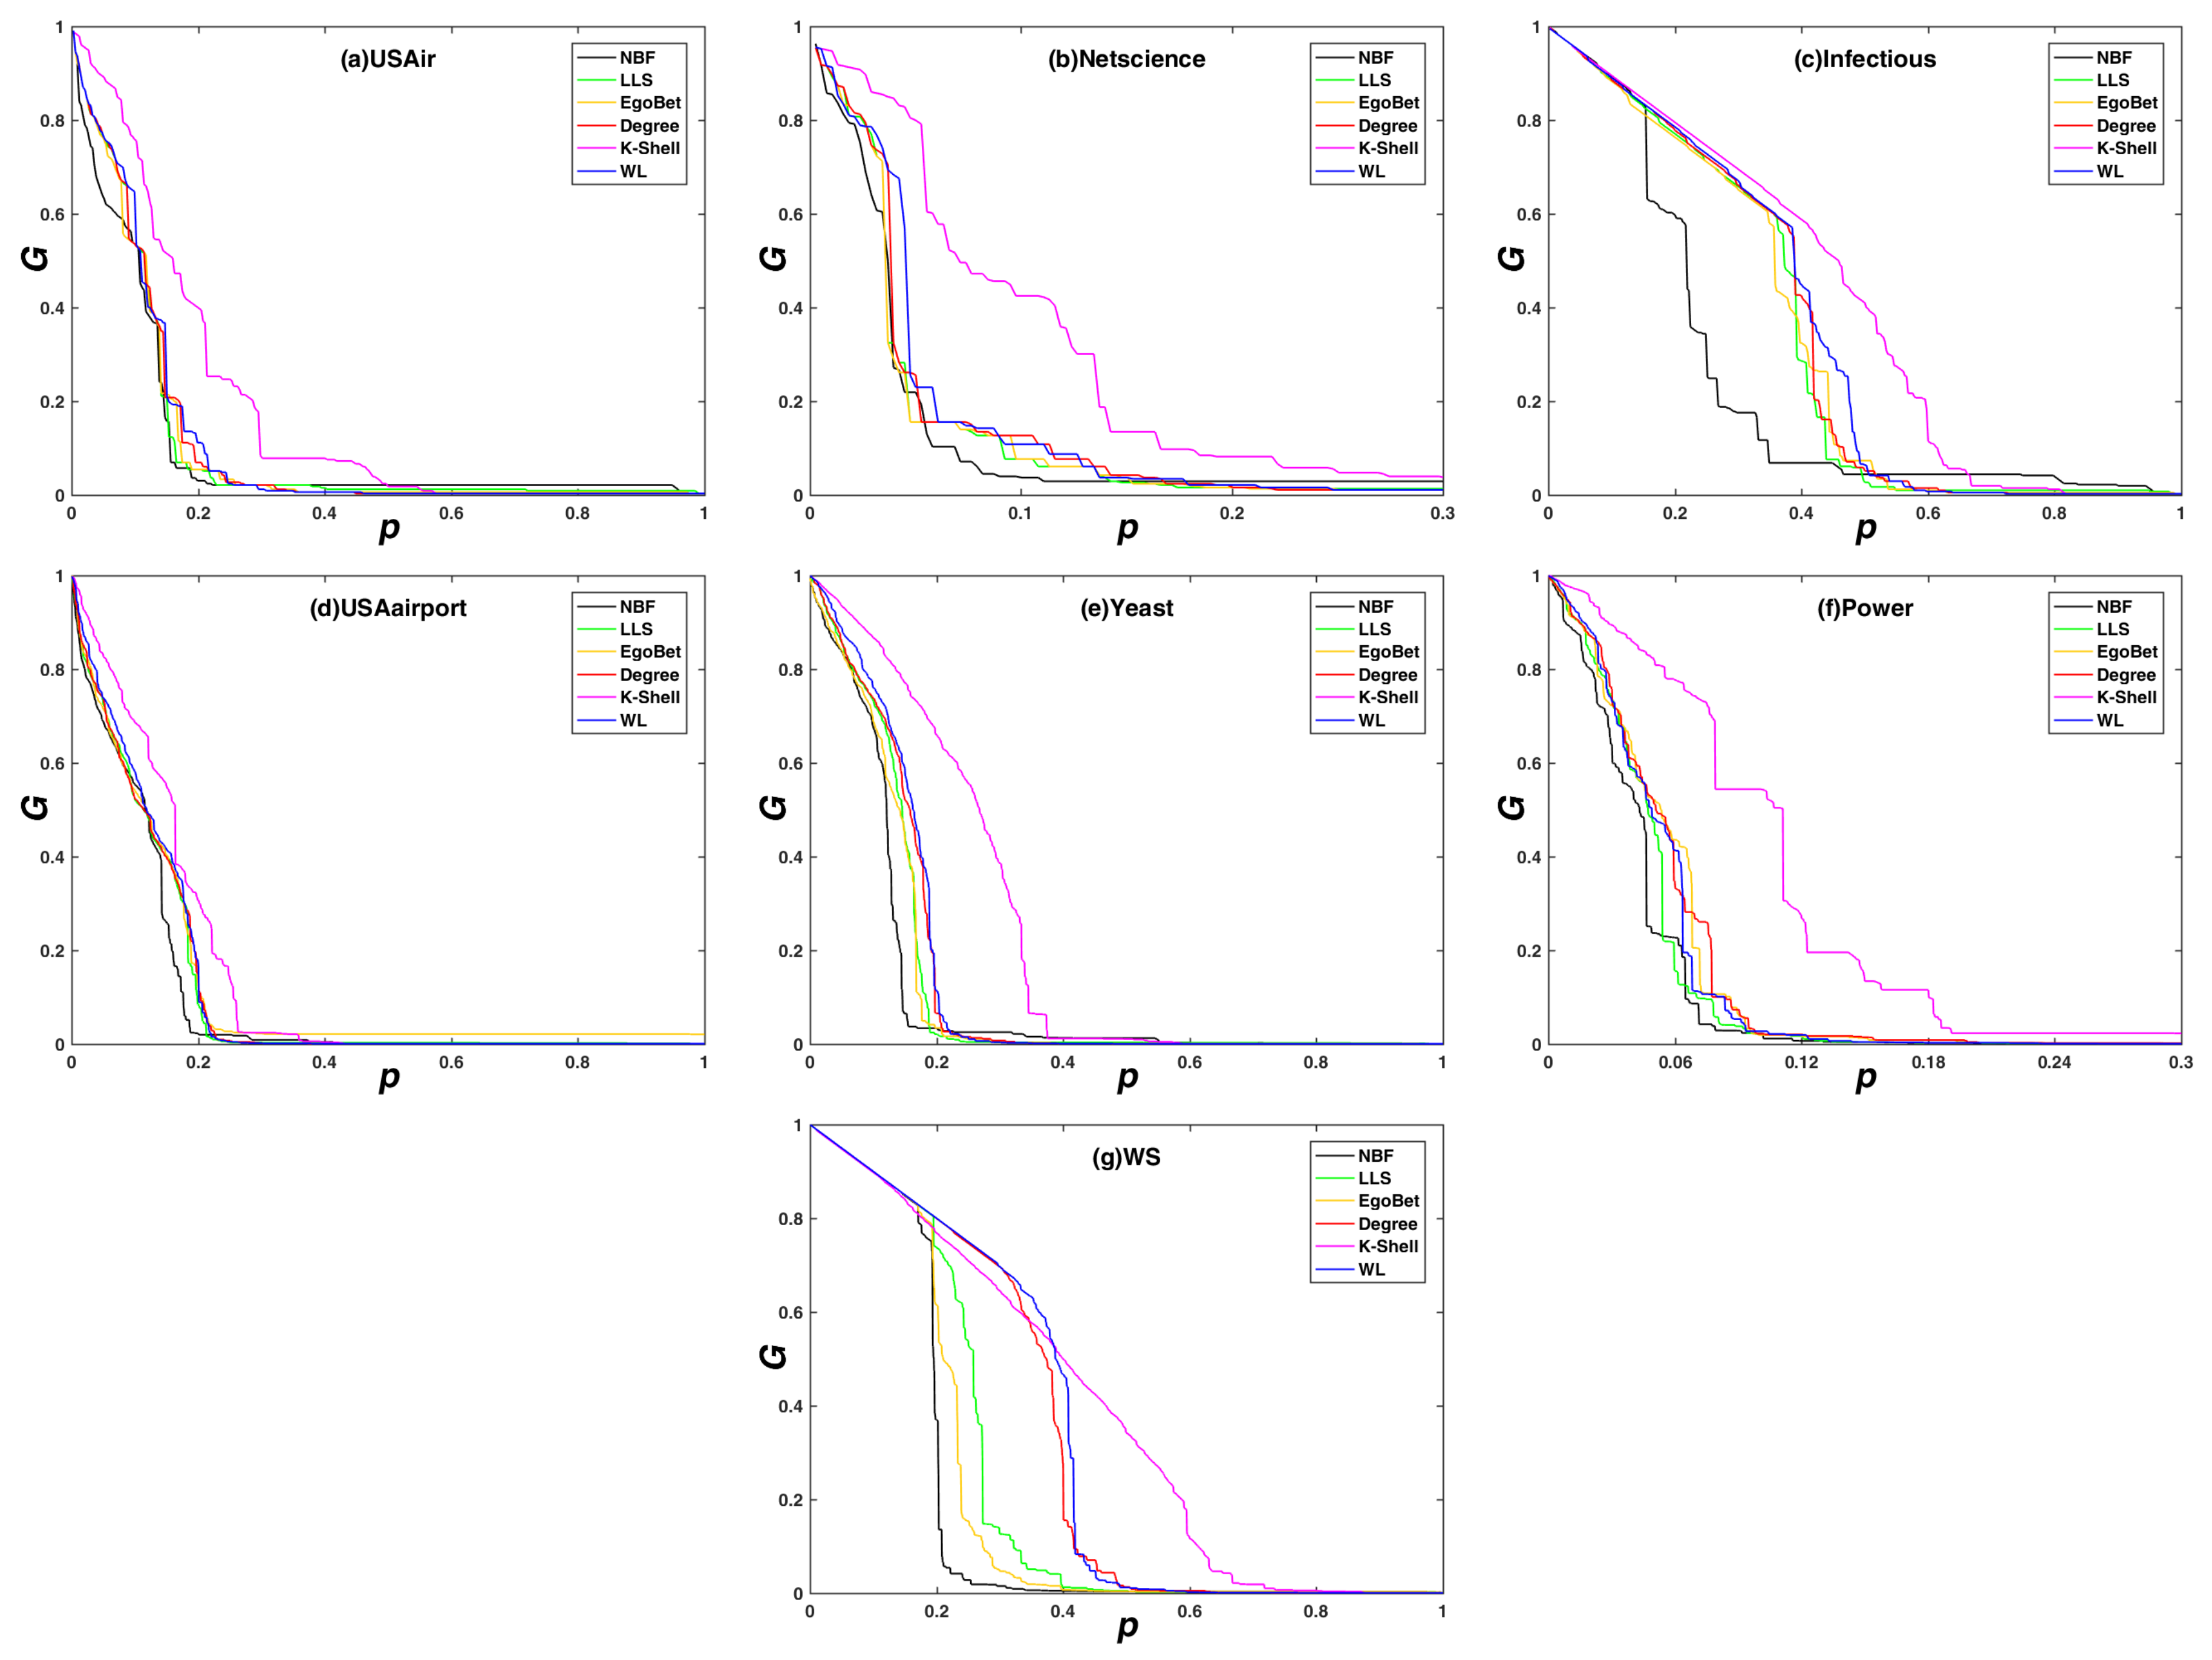
Figure 2 shows the comparison of the network maximum connectivity coefficient G subjects with different static attack strategies on real and synthetic networks. As can be seen from Figure 2, in the static attack mode, the NBF attack strategy corresponds to the fastest decline of G, that is to say, the proposed algorithm performs the best when identifying node importance. The advantage of the NBF algorithm is more obvious especially when the rate of removed nodes is small. For example, in the USAirport network from Figure 2a, when the rate of removed nodes is less than 15%, the decline speed of G is much more faster. In real applications, 15% is a very big attack rate when taking into account the cost of attack which has to be paid for. Since the NBF attack strategy can make the network fragment the most when removing a small rate of nodes, and also guarantee a great strike effect when removing a large rate of nodes, the proposed NBF algorithm performs the best on ranking node importance and has the highest application value. In addition, one can find that ego betweenness centrality attack strategy has the second best attack effect in four networks, LLS attack strategy has the second best attack effect in one network and WL attack strategy has the second best attack effect in one network.
In order to further verify the efficiency of our NBF method, the experiment analyzes the changes of the network maximum connectivity coefficient in the dynamic attack mode, as shown in Figure 3. Observing the experimental results, we can also find that the maximum connectivity coefficient under the NBF dynamic attack strategy decreases faster than other strategies, which shows that the NBF algorithm is more accurate than other algorithms for ranking node importance. The design principle of the NBF algorithm considers the bridging feature of the nodes, so the structure importance of the network nodes can be more effectively sorted. The experimental results verify this point. In addition, it can be observed that, when the network nodes are removed by k-shell method, the network has the worst fragmentation effect. This is because the k-shell method can not distinguish the importance of nodes in the same shell layer.
Comparing the static attack and dynamic attack results of each algorithm in the same data set in Figure 2 and Figure 3, it can always be observed that the dynamic attack effect is better than the static attack effect. This is due to the fact that, in the dynamic attack mode, the importance of nodes is recalculated when removing a node, ensuring that each attacked node is the most important node in the current network. However, in the static attack mode, the network structure changes with the removal of nodes, and the importance of the nodes may be greatly reduced due to the drastic changes in the network structure.
In addition, we find that the decline speed of G is related to the network structure, especially the average degree k of the network. The Power network and the Netscience network have the lowest and second lowest average degree, respectively. In addition, the two networks are almost down after removing the top 10% important nodes under most attack strategies. The reason is that less average degree means less edges for the node pairs, so, after removing a small fraction of important nodes, the connectivity of the network turns bad very fast. Thus, we just show the removing process of the top 30% important nodes instead of the total nodes in the two networks.

3.2. Experimental Results on the Decline Rate of Network Efficiency

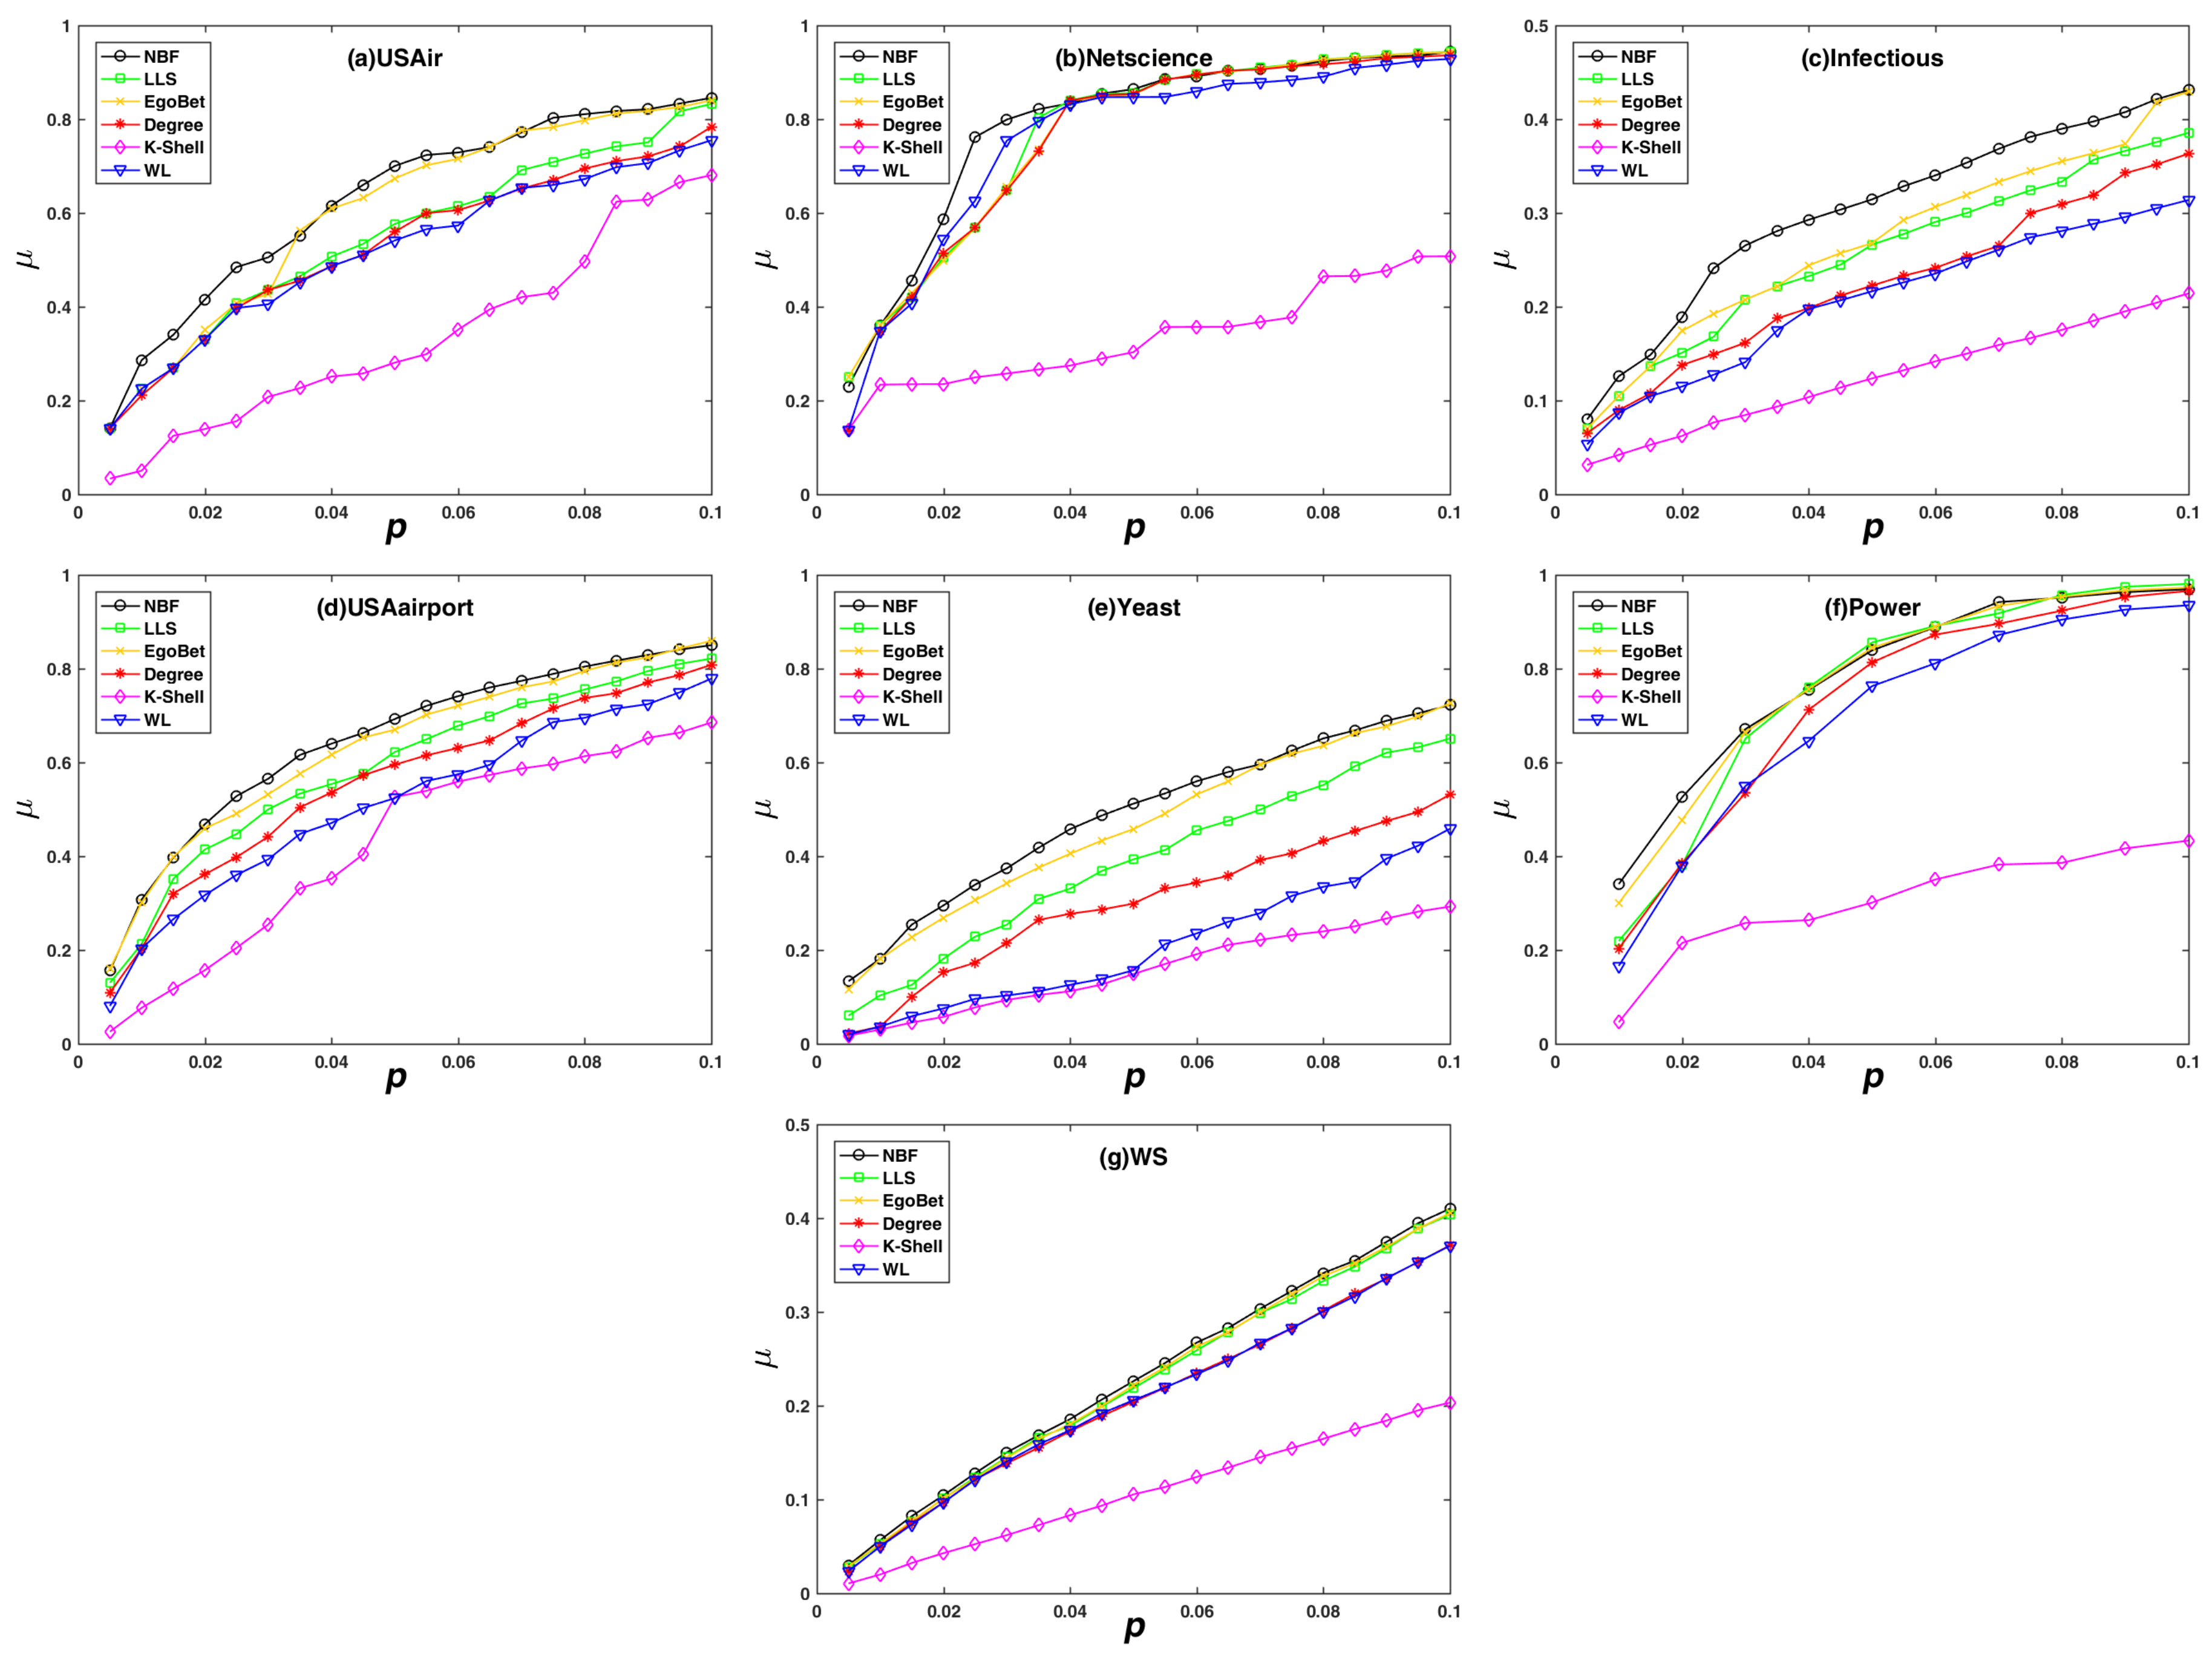
Figure 4 reflects the changes in the decline rate of network efficiency μ when nodes are removed in descending orders according to the importance ranking by different algorithms. The larger the value of μ , the more significant the decrease in network efficiency, and the more accurate the node importance identification algorithms. It can be observed that, in the static attack mode, the value of μ under the NBF attack strategy is larger than other strategies, which shows that the NBF algorithm is more accurate than other algorithms. Similar to the results on the network maximum connectivity coefficient, the NBF algorithm has more obvious advantages when the proportion of node removal is small, so the proposed algorithm has the best application value.
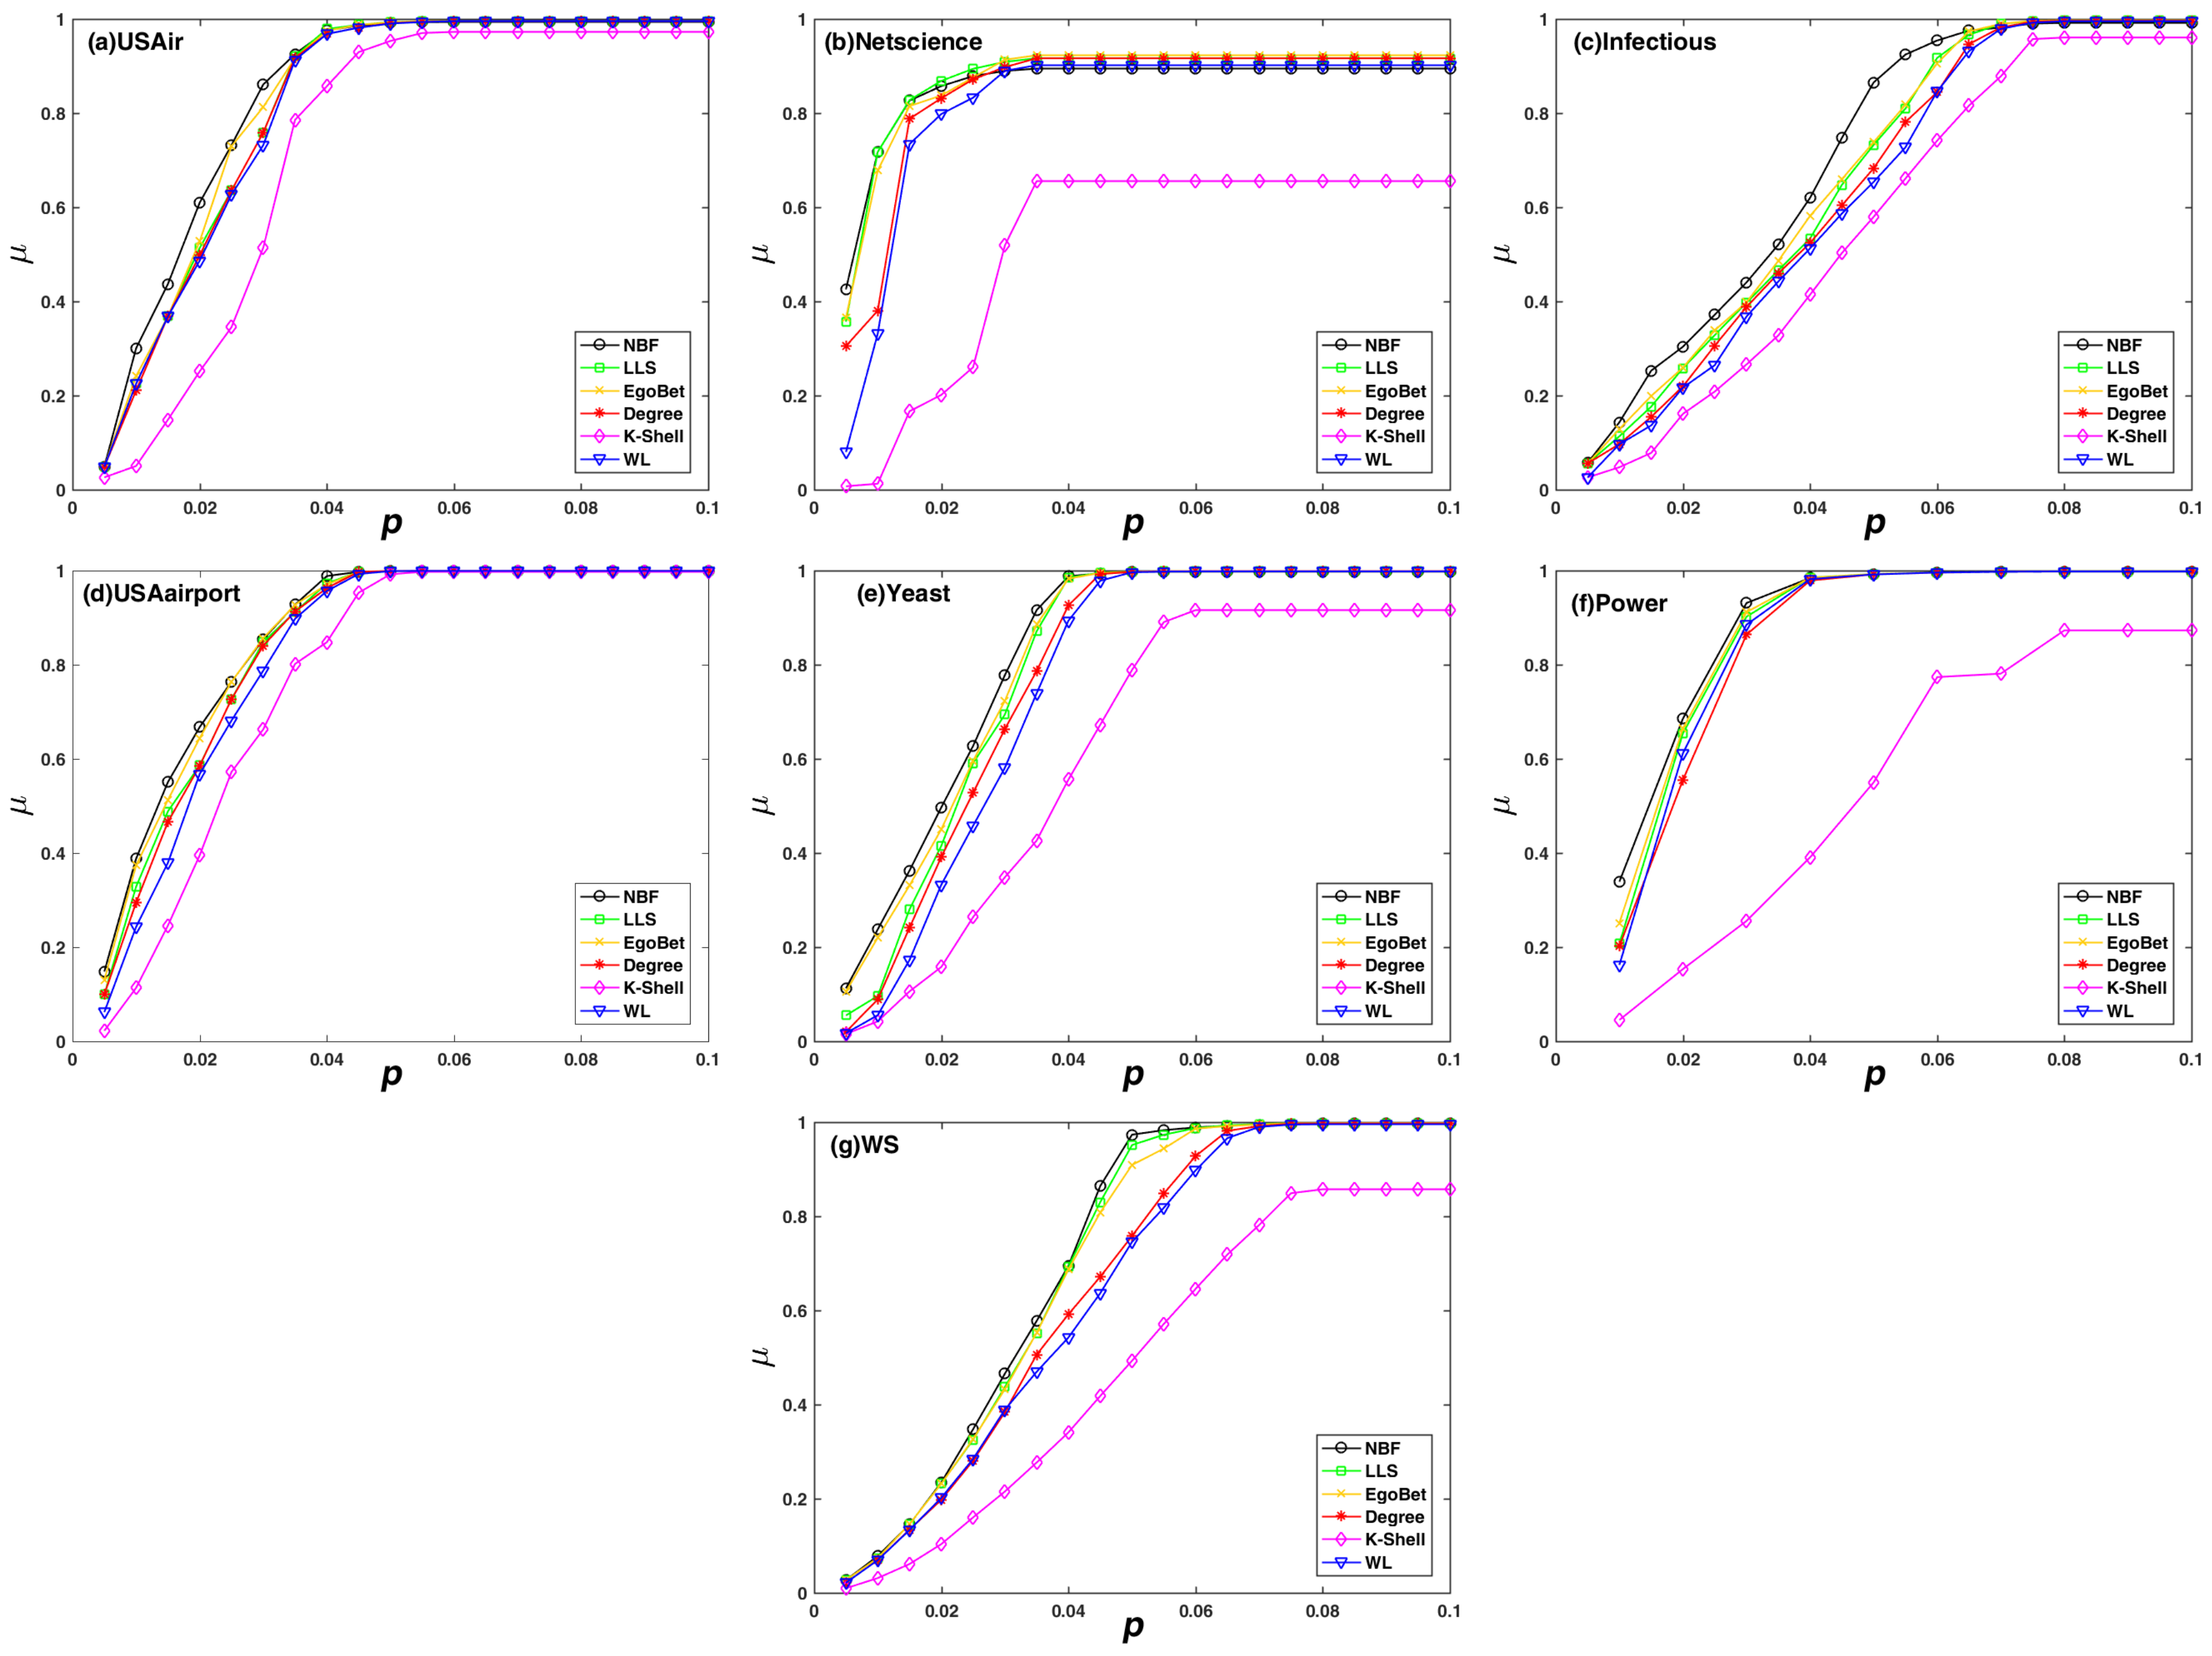
Furthermore, we investigate the decline rate of network efficiency μ subjects with different dynamic attack strategies, and the result is shown in Figure 5. The result is consistent with that of static attack strategies. It can be seen from the figure that the NBF algorithm designed in this paper has the highest impact on network fragmentation compared with the other five algorithms. The effectiveness of the proposed algorithm is further verified by different evaluation criteria.
In summary, the comparison experiments on the maximum connectivity coefficient and the decline rate of network efficiency show that the proposed algorithm performs better than degree centrality, k-shell algorithm, WL algorithm, LLS algorithm and ego betweenness centrality in static attack strategies and in dynamic attack strategies. The advantage of the proposed algorithm is more obvious in the initial stage of attack. In addition, the dynamic attack effect is better than the static attack for the same importance ranking algorithm.

3.3. Complexity Analysis

When computing the shortest paths of node pairs within 2-hops neighbors for the target node in NBF algorithm and ego betweenness, we just compute the square and cube of the adjacency matrix of the network and check the elements in the new matrix instead of using a Dijkstra algorithm, which makes it much faster. The method is also used in [30].
The computational complexity of the six methods is shown in Table 2, where n is the total number of nodes in the network, m is the number of edges and k is the average degree of the network. From the table, we can see that the computational complexity of k-shell is O ( m ) , which is the lowest, but, from the experimental results, one can see that it performs the worst. WL algorithm and degree centrality have the second lowest computational complexity, but the attack effect is also not good.
The computational complexity of NBF algorithm is O ( n k 2 ) , which is equal to that of ego betweenness and LLS algorithm. Although NBF algorithm and ego betweenness have the same computational complexity, ego betweenness just considers neighbor nodes within 1-hop, while the NBF algorithm takes into account neighbor nodes within 2-hops. The actual computing time of ego betweenness is less than that of the NBF algorithm. Both the NBF algorithm and LLS algorithm consider neighbor nodes within 2-hops, and the computational cost of the two algorithms is almost the same. One can see from the experimental results that the NBF algorithm, ego betweenness and LLS algorithm outperform the other algorithms in most cases and the NBF algorithm performs the best in almost all cases. In summary, NBF can get the best attack effect in reasonable time when compared with other outstanding algorithms, which makes it applicable in large-scale networks.

4. Conclusions

The identification of node importance in complex networks is of theoretical and practical significance for improving network robustness and invulnerability. By analyzing the neighborhood structure of the target node, we propose a node importance identification algorithm based on a node bridging feature. The algorithm just needs neighborhood information within two hops of the node for computing instead of global information, which makes it applicable in a large-scale network. The robustness simulation experiments on real networks and synthetic networks show that the proposed algorithm performs better than degree centrality, k-shell algorithm, WL algorithm, LLS algorithm and ego betweenness centrality under two network connectivity evaluation criteria whether in static or dynamic attack strategies. Especially in the real applications where the cost of network attacks is limited, the advantage of the proposed algorithm is more obvious.
We also find that the dynamic attack effect is better than the static attack for the same node importance identification algorithm. This is due to the fact that, in the dynamic attack mode, the importance of nodes is recalculated when removing a node, ensuring that each attacked node is the most important node in the current network. Therefore, both proposed algorithms and attack strategy construction are key factors for the invulnerability of the complex network, which guides the way to construct and maintain more robust networks.
In addition, we discover that attack effect is related to the network structure, especially the average degree of the network. This is because a less average degree corresponds to less edges of the node pairs; thus, after removing the important nodes, the connectivity of the network turns bad very fast. The Power network and the Netscience network have the lowest and second lowest average degree, respectively, and the two networks are almost down after removing the top 10% important nodes under most attack strategies.
The algorithm designed in this paper is for the undirected and unweighted networks. In real networks, the connections between nodes usually have directions, and each connection has different weights. It is easy to know from the expression of the NBF algorithm that the algorithm can be extended to directed weighted networks, which is the focus of future research. In addition, an algorithm that is optimal for one network may get sub-optimal results in a different network, and it is almost impossible to design a universal ranking algorithm which outperforms the best in all networks. In order to get more universal conclusions, we will test our algorithm on more real and synthetic networks in the future.

Author Contributions

Conceptualization, L.J., Y.J. and S.H.; Methodology, L.J.; Software, L.J.; Validation, S.H.; Formal Analysis, L.J. and Y.J.; Resources, W.X.; Data Curation, L.J.; Writing—Original Draft Preparation, L.J. and Y.J.; Writing—Review and Editing, S.H. and W.X.; Visualization, L.J. and B.G.; Supervision, W.X.; Project Administration, B.G.; Funding Acquisition, S.H. and W.X.

Funding

This research was funded by the National Natural Science Foundation of China under Grant (No. 61872446), (No. 71690233) and (No. 71331008).

Acknowledgments

We are pleased to thank the Editor and the Referees for their useful suggestions. This work was supported by the National Natural Science Foundation of China under Grant Nos. 61872446, 71690233 and 71331008.

Conflicts of Interest

The authors declare no conflict of interest.

References

  1. Barabási, A.L.; Albert, R. Emergence of scaling in random networks. Science 1999, 286, 509–512. [Google Scholar] [PubMed]
  2. Watts, D.J.; Strogatz, S.H. Collective dynamics of ’small-world’ networks. Nature 1998, 393, 440–442. [Google Scholar] [CrossRef] [PubMed]
  3. Dorogovtsev, S.N.; Goltsev, A.V.; Mendes, J.F.F. Critical phenomena in complex networks. Rev. Mod. Phys. 2007, 80, 1275–1335. [Google Scholar] [CrossRef]
  4. Albert, R.; Barabási, A.L. Statistical mechanics of complex networks. Rev. Mod. Phys. 2002, 74, 47–97. [Google Scholar] [CrossRef] [Green Version]
  5. Jun, T.; Piera, M.A.; Ruiz, S. A causal model to explore the ACAS induced collisions. J. Aerosp. Eng. 2014, 228, 1735–1748. [Google Scholar] [CrossRef]
  6. Wang, G.Z.; Cao, Y.J.; Bao, Z.J.; Han, Z.X. A novel local-world evolving network model for power grid. Acta Phys. Sin. 2009, 58, 3597–3602. [Google Scholar]
  7. Li, Y.S.; Ma, D.Z.; Zhang, H.G.; Sun, Q.Y. Critical nodes identification of power systems based on controllability of complex networks. Appl. Sci. 2015, 5, 622–636. [Google Scholar] [CrossRef]
  8. Zhao, X.; Xiao, C.; Lin, X.; Zhang, W.; Wang, Y. Efficient structure similarity searches: A partition-based approach. VLDB J. 2018, 27, 53–78. [Google Scholar] [CrossRef]
  9. Milo, R.; Shen-Orr, S.; Itzkovitz, S.; Kashtan, N.; Chklovskii, D.; Alon, U. Network motifs: Simple building blocks of complex networks. Science 2002, 298, 824–827. [Google Scholar] [CrossRef] [PubMed]
  10. Kinney, R.; Crucitti, P.; Albert, R.; Latora, V. Modeling cascading failures in the North American power grid. Eur. Phys. J. 2005, 46, 101–107. [Google Scholar] [CrossRef] [Green Version]
  11. Rogers, T. Assessing node risk and vulnerability in epidemics on networks. Europhys. Lett. 2015, 109, 28005–28011. [Google Scholar] [CrossRef]
  12. Nie, T.; Guo, Z.; Zhao, K.; Lu, Z.M. Using mapping entropy to identify node centrality in complex networks. Phys. A Stat. Mech. Appl. 2016, 453, 290–297. [Google Scholar] [CrossRef]
  13. Liu, J.; Xiong, Q.; Shi, W.; Shi, X.; Wang, K. Evaluating the importance of nodes in complex networks. Phys. A Stat. Mech. Appl. 2016, 452, 209–219. [Google Scholar] [CrossRef]
  14. Zhou, X.; Zhang, F.M.; Zhou, W.P.; Zou, W.; Yang, F. Evaluating complex network functional robustness by node efficiency. Acta Phys. Sin. 2012, 61, 190201. [Google Scholar]
  15. Chen, G.; Dong, Z.Y.; Hill, D.J.; Zhang, G.H.; Hua, K.Q. Attack structural vulnerability of power grids: A hybrid approach based on complex networks. Phys. A Stat. Mech. Appl. 2010, 389, 595–603. [Google Scholar] [CrossRef]
  16. Dey, P.; Mehra, R.; Kazi, F.; Wagh, S.; Singh, N.M. Impact of topology on the propagation of cascading failure in power grid. IEEE Trans. Smart Grid 2016, 7, 1970–1978. [Google Scholar] [CrossRef]
  17. Jung, J.; Liu, C.C. Multi-agent technology for vulnerability assessment and control. In Proceedings of the Power Engineering Society Summer Meeting, Vancouver, BC, Canada, 15–19 July 2001; pp. 1287–1292. [Google Scholar]
  18. Zhang, G.; Yu, S.S.; Zou, S.; Iu, H.H.; Fernando, T.; Zhang, Y. An Investigation into Cascading Failure in Large-Scale Electric Grids: A Load-Redistribution Approach. Appl. Sci. 2018, 8, 2076–3417. [Google Scholar] [CrossRef]
  19. Tan, Y.J.; Wu, J.; Deng, H.Z.; Zhu, D.Z. Invulnerability of Complex Networks: A Survey. Syst. Eng. 2006, 24, 1–5. [Google Scholar]
  20. Zamora-López, G.; Zhou, C.H.; Kurths, J. Cortical hubs form a module for multisensory integration on top of hierarchy of cortical networks. Front. Comput. Neurosci. 2010, 4, 1–13. [Google Scholar] [CrossRef] [PubMed]
  21. Crucitti, P.; Latora, V.; Marchiori, M. Model for cascading failures in complex networks. Phys. Rev. E 2004, 69, 045104. [Google Scholar] [CrossRef] [PubMed]
  22. Buldyrev, S.V.; Parshani, R.; Paul, G.; Stanley, H.E.; Havlin, S. Catastrophic cascade of failures in interdependent networks. Nature 2010, 464, 1025–1028. [Google Scholar] [CrossRef] [PubMed] [Green Version]
  23. Wang, J.; Rong, L.; Zhang, L.; Zhang, Z. Attack vulnerability of scale-free networks due to cascading failures. Phys. A Stat. Mech. Appl. 2008, 387, 6671–6678. [Google Scholar] [CrossRef]
  24. Boccaletti, S.; Latora, V.; Moreno, Y.; Chavez, M.; Hwang, D.U. Complex networks: Structure and dynamics. Phys. Rep. 2006, 424, 175–308. [Google Scholar] [CrossRef] [Green Version]
  25. Restrepo, J.G.; Ott, E.; Hunt, B.R. Characterizing the dynamical importance of network nodes and links. Phys. Rev. Lett. 2006, 97, 094102. [Google Scholar] [CrossRef] [PubMed]
  26. Albert, R.; Jeong, H.; Barabási, A.L. Internet: Diameter of the world-wide web. Nature 1999, 401, 130–131. [Google Scholar] [CrossRef]
  27. Sabidussi, G. The centrality index of a graph. Psyehometrika 1966, 31, 581–603. [Google Scholar] [CrossRef]
  28. Freeman, L.C. A set of measures of centrality based on betweenness. Sociometry 1977, 40, 35–41. [Google Scholar] [CrossRef]
  29. Barthelemy, M. Betweenness centrality in large complex networks. Eur. Phys. J. B 2004, 38, 163–168. [Google Scholar] [CrossRef] [Green Version]
  30. Everett, M.; Borgatti, S.P. Ego network betweenness. Soc. Netw. 2005, 27, 31–38. [Google Scholar] [CrossRef] [Green Version]
  31. Pfeffer, J.; Carley, K.M. k-centralities: Local approximations of global measures based on shortest paths. In Proceedings of the 21st International Conference on World Wide Web, Lyon, France, 16–20 April 2012; pp. 1043–1050. [Google Scholar]
  32. Stai, E.; Sotiropoulos, K.; Karyotis, V.; Papavassiliou, S. Hyperbolic Embedding for Efficient Computation of Path Centralities and Adaptive Routing in Large-Scale Complex Commodity Networks. IEEE Trans Netw. Sci. Eng. 2017, 4, 140–153. [Google Scholar] [CrossRef]
  33. Puzis, R.; Zilberman, P.; Elovici, Y.; Dolev, S.; Brandes, U. Heuristics for speeding up betweenness centrality computation. In Proceedings of the 2012 International Conference on Privacy, Security, Risk and Trust and 2012 International Confernece on Social Computing, Amsterdam, The Netherlands, 3–5 September 2012; pp. 302–311. [Google Scholar]
  34. Brandes, U.; Pich, C. Centrality estimation in large networks. Int. J. Bifurc. Chaos 2007, 17, 2303–2318. [Google Scholar] [CrossRef]
  35. Kitsak, M.; Gallos, L.K.; Havlin, S.; Liljeros, F.; Muchnik, L.; Eugene Stanley, H.; Makse, H.A. Identification of influential spreaders in complex networks. Nat. Phys. 2010, 6, 888–893. [Google Scholar] [CrossRef] [Green Version]
  36. Wang, J.W.; Rong, L.L.; Guo, T.Z. A new measure method of network node importance based on local characteristics. J. Dalian Univ. Technol. 2010, 50, 822–826. [Google Scholar]
  37. Ugander, J.; Backstrom, L.; Marlow, C.; Kleinberg, J. Structural diversity in social contagion. Proc. Natl. Acad. Sci. USA 2012, 109, 5962–5966. [Google Scholar] [CrossRef] [PubMed] [Green Version]
  38. Ai, X. Node importance ranking of complex networks with entropy variation. Entropy 2017, 19, 303. [Google Scholar] [CrossRef]
  39. Ruan, Y.R.; Lao, S.Y.; Wang, J.D.; Bai, L.; Chen, L.D. Node importance measurement based on neighborhood similarity in complex network. Acta Phys. Sin. 2017, 66, 038902. [Google Scholar]
  40. Dereich, S.; Mörters, P. Random networks with sublinear preferential attachment: The giant component. Ann. Probab. 2013, 41, 329–384. [Google Scholar] [CrossRef] [Green Version]
  41. Vragović, I.; Louis, E.; Díaz-Guilera, A. Efficiency of informational transfer in regular and complex networks. Phys. Rev. E 2005, 71, 036122. [Google Scholar] [CrossRef] [PubMed]
  42. Latora, V.; Marchiori, M. A measure of centrality based on network efficiency. New J. Phys. 2007, 9, 188. [Google Scholar] [CrossRef]
  43. Batagelj, V.; Mrvar, A. Pajek-program for large network analysis. Connections 1998, 21, 47–57. [Google Scholar]
  44. Zeng, A.; Liu, W. Enhancing network robustness against malicious attacks. Phys. Rev. E 2012, 85, 066130. [Google Scholar] [CrossRef] [PubMed]
  45. Newman, M.E. Finding community structure in networks using the eigenvectors of matrices. Phys. Rev. E 2006, 74, 036104. [Google Scholar] [CrossRef] [PubMed] [Green Version]
  46. Chen, D.; Lü, L.; Shang, M.S.; Zhang, Y.C.; Zhou, T. Identifying influential nodes in complex networks. Phys. A Stat. Mech. Appl. 2012, 391, 1777–1787. [Google Scholar] [CrossRef] [Green Version]
  47. Isella, L.; Stehle, J.; Barrat, A.; Cattuto, C.; Pinton, J.F.; vanden Broeck, W. What’s in a crowd? Analysis of face-to-face behavioral networks. J. Theor. Biol. 2011, 271, 166–180. [Google Scholar] [CrossRef] [PubMed] [Green Version]
  48. Andrews, M.A.; Bauch, C.T. The impacts of simultaneous disease intervention decisions on epidemic outcomes. J. Theor. Biol. 2016, 395, 1–10. [Google Scholar] [CrossRef] [PubMed]
  49. Lü, L.; Chen, D.; Ren, X.L.; Zhang, Q.M.; Zhang, Y.C.; Zhou, T. Vital nodes identification in complex networks. Phys. Rep. 2016, 650, 1–63. [Google Scholar] [CrossRef] [Green Version]
  50. Sun, X.; Gollnick, V.; Wandelt, S. Robustness analysis metrics for worldwide airport network: A comprehensive study. Chin. J. Aeronaut. 2017, 30, 500–512. [Google Scholar] [CrossRef]
  51. Von Mering, C.; Krause, R.; Snel, B.; Cornell, M.; Oliver, S.G.; Fields, S.; Bork, P. Comparative assessment of large-scale data sets of protein-protein interactions. Nature 2002, 417, 399–403. [Google Scholar] [CrossRef] [PubMed]
  52. Guelzim, N.; Bottani, S.; Bourgine, P.; Kepes, F. Topological and causal structure of the yeast transcriptional regulatory network. Nat. Genet. 2002, 31, 60–63. [Google Scholar] [CrossRef] [PubMed] [Green Version]
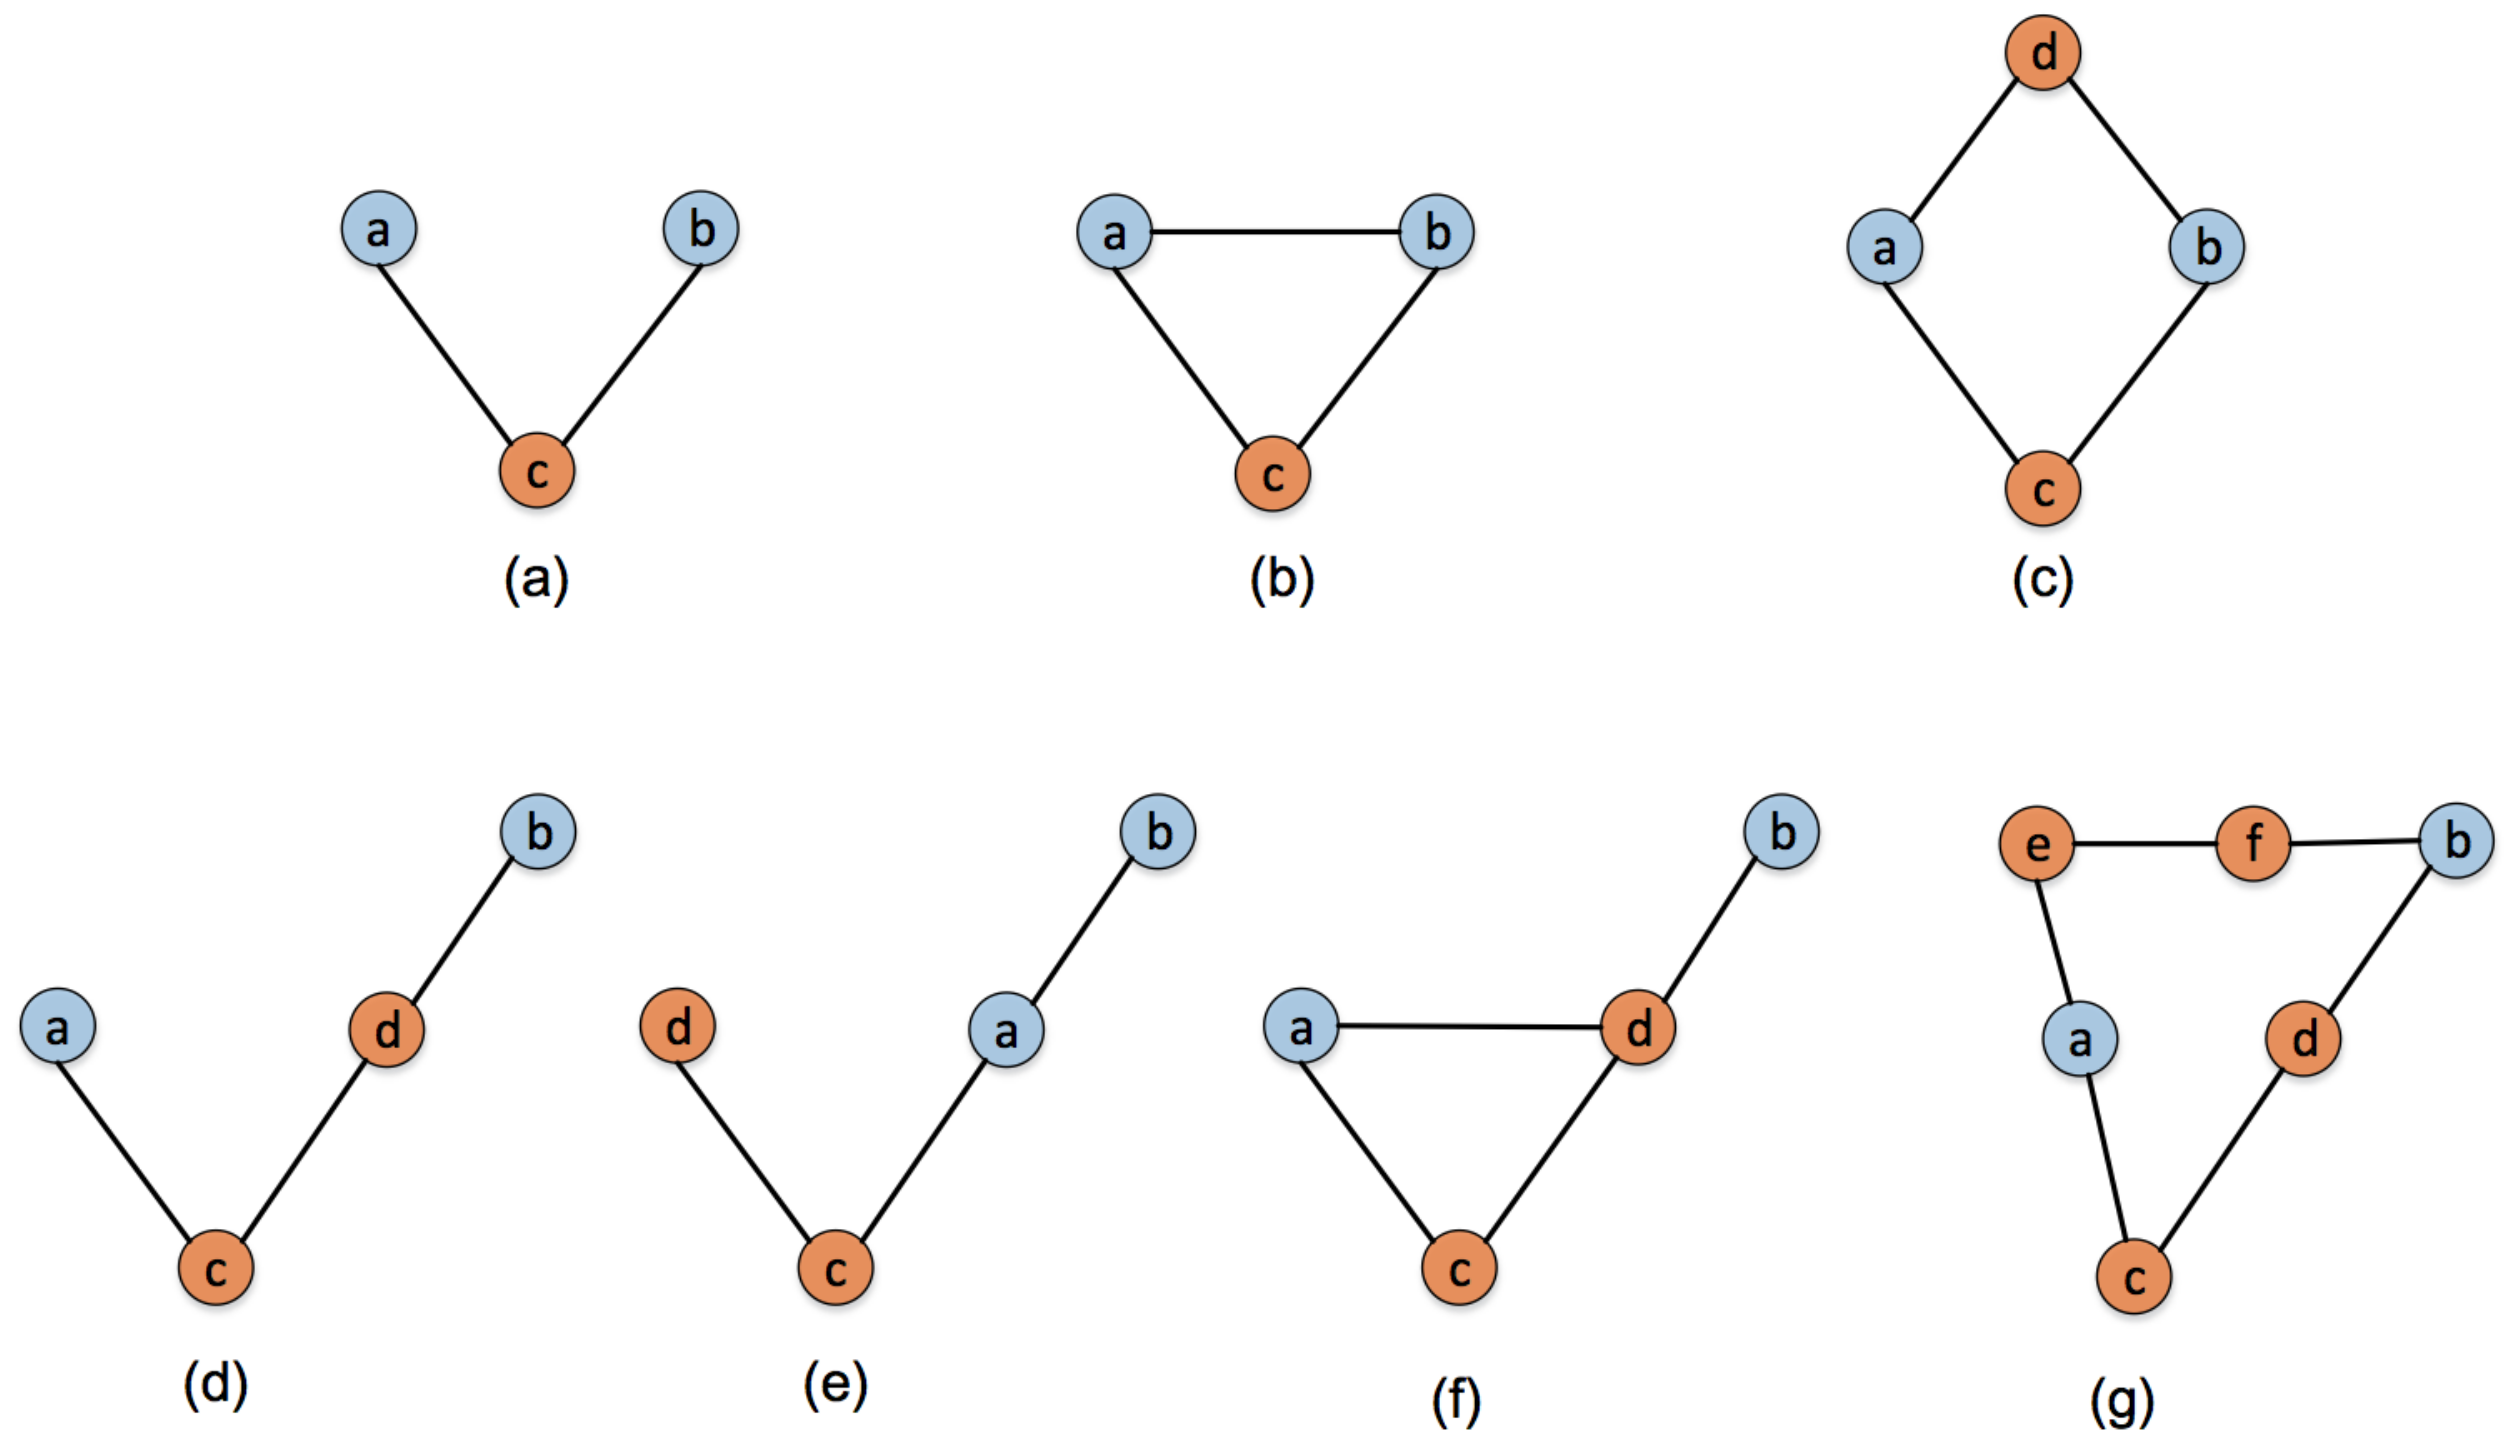
Figure 1. Several different connections between neighbor nodes a and b of node c. (a) node a and node b get connected by node c; (b) nodes a, b, c get connected with each other; (c) node a and node b get connected by node c or node d; (d) node a and node b get connected by node c and node d; (e) node a and node b get connected directly; (f) node a and node b get connected by node d; (g) node a and node b get connected by nodes c, d or nodes e, f.
Applsci 08 01914 g001
Figure 2. The network maximum connectivity coefficient (G) subjects with different dynamic attack strategies. Maximum connectivity coefficient (G) on the y-axis against the rate of removed node (p) on the x-axis. (a) the USAir network; (b) the Netscience network; (c) the Infectious network; (d) the USAirport network; (e) the Yeast network; (f) the Power network; and (g) the synthetic network WS.
Applsci 08 01914 g002
Figure 3. The network maximum connectivity coefficient (G) subjects with different dynamic attack strategies. Maximum connectivity coefficient (G) on the y-axis against the rate of removed node (p) on the x-axis. (a) the USAir network; (b) the Netscience network; (c) the Infectious network; (d) the USAirport network; (e) the Yeast network; (f) the Power network; and (g) the synthetic network WS.
Applsci 08 01914 g003
Figure 4. The decline rate of network efficiency ( μ ) subjects with different static attack strategies. The decline rate of network efficiency ( μ ) on the y-axis against the rate of removed node (p) on the x-axis. (a) the USAir network; (b) the Netscience network; (c) the Infectious network; (d) the USAirport network; (e) the Yeast network; (f) the Power network; (g) the synthetic network WS.
Applsci 08 01914 g004
Figure 5. The decline rate of network efficiency ( μ ) subjects with different dynamic attack strategies. The decline rate of network efficiency ( μ ) on the y-axis against the rate of removed node (p) on the x-axis. (a) the USAir network; (b) the Netscience network; (c) the Infectious network; (d) the USAirport network; (e) the Yeast network; (f) the Power network; (g) the synthetic network WS.
Applsci 08 01914 g005
Table 1. Basic statistical properties of the six real networks, including network size (n), edge number (m), average degree k , network aggregation coefficient C and average shortest path length L.
NetworknmkCL
USAir332212612.8070.6252.729
Netscience3799144.8230.7416.026
Infectious410276513.4880.4563.631
USAirport157428,23621.9010.5053.113
Yeast237511,6939.8470.3065.094
Power494169642.6690.08018.989
Table 2. The computational complexity of six methods.
MethodInformationComputational Complexity
K-shellGlobal information O ( m )
WLLocal information O ( m + n k )
DegreeLocal information O ( m + n k )
EgoBetLocal information O ( n k 2 )
LLSLocal information O ( n k 2 )
NBFLocal information O ( n k 2 )