1. Introduction
Mid-infrared (mid-IR) light sources from 2 to 20 µm are of key importance for applications in molecular sensing, medicine, security and defense, and in free-space communication [
1]. The mid-IR spectrum covers important atmospheric windows, and numerous features of molecular gases, toxic and explosive agents, water, and pollutants. Bright, coherent and broadband radiations bring numerous practical advantages for some applications such as spectroscopy and frequency metrology, and this can be conveniently obtained by means of fiber-based supercontinuum light generated from femtosecond mode-locked lasers [
2,
3], thus surpassing thermal infrared sources and challenging quantum cascade lasers. In the last decade, strong efforts have been made to transfer robust supercontinuum (SC) fiber sources from near-infrared into the mid-IR spectral range, mainly driven by the purpose of covering the largest spectral region possible [
4,
5]. Recent developments now focus on satisfying the user needs for mid-IR SC application such as compact and high repetition rate sources, single-mode behavior, all-fiber systems, high power spectral density, and coherent emission across the SC spectrum [
6,
7,
8,
9,
10,
11].
In the context of infrared spectroscopy and identification of organic molecules, the mid-IR spectra consist of the absorption bands mainly related to fundamental vibrations [
12,
13]. There are two regions in such absorption spectra, namely the functional group region (2–6 µm) that contains the characteristic bands of specific individual bonds and functional groups (i.e., mainly stretching vibrations) and the fingerprint region (6–20 µm) that usually contains a large complex set of absorption bands (i.e., bending vibrations), unique to each molecule and making it difficult to interpret. The common route toward practical mid-IR SC generation in the important functional group region is the implementation of ps-pumped SC generation in commercially-available fluoride fibers [
14,
15,
16], in particular fluoroindate fibers wherein Watt-level SC spanning from 1 to 5 μm can be reached at the expense of the SC coherence properties.
The recent development of step-index tellurite glass fibers appears as a possible alternative to fluoride glass fibers for comparable SC source features, in particular due to their similar spectral transmission window (in general 0.4–5 μm) [
17,
18]. Other important advantages from tellurite glasses have to be noticed, such as higher nonlinearity and zero-dispersion wavelength (ZDW) around 2.1–2.3 μm, highly suitable for pumping with novel fiber lasers beyond 2 μm (based on thulium-doped silica fibers, erbium- or holmium-doped fluoride glass fibers) [
17,
19,
20,
21]. Note that they also offer a large flexibility in the chemical compositions that are compatible with fiber drawing. To date, high-power supercontinuum generation covering the 1–5 µm spectral range has been also demonstrated in robust step-index tellurite fibers by using picosecond or femtosecond pulses [
17,
22].
Mid-IR SC studies in the coherent regime remain less investigated in fluoride and tellurite fibers, this requires the use of a femtosecond pulse pump and a careful tailoring of fiber dispersion [
22,
23,
24]. In a previous work [
25], we already demonstrated the ability to control four-wave-mixing-based frequency conversion and continuum generation around 2 µm in step-index tellurite fibers, more particularly in the long-pulse (picosecond) pumping regime. Nevertheless, the route to coherent SC generation is typically based on the use of all-normal dispersion (ANDi) fibers, but not exclusively; coherence-preserving nonlinear wavelength conversion with pumping into the anomalous dispersion regime is still possible with femtosecond pump pulses [
26]. In this article, we numerically and experimentally demonstrate the possible control of SC features in the 1.5–4.5 μm spectral range with a simple step-index tellurite fiber pumped by femtosecond pump pulses. This results from the fine control of the fiber core diameter, thus allowing to tune the group-velocity dispersion (GVD) of the fundamental guided mode from all-normal dispersion to multi-ZDW GVD profiles. Various nonlinear propagation dynamics are then explored by pumping beyond 2 µm with sub-nanojoule femtosecond pump pulses to preserve full coherence across the SC spectra.
2. Materials and Methods
We developed our step-index tellurite fibers for mid-IR SC studies through the built-in-casting and the rod-in tube techniques which are well described in the literature [
18,
27]. A compatible core/cladding glass pair was chosen based on their optical, thermal and mechanical compatibility (
Table 1) for the built-in-casting process, and their suitable refractive index difference [
27]. The compositions are respectively 80TeO
2-5ZnO-10Na
2O-5ZnF
2 (TZNF, molar fraction) and 60TeO
2-5ZnO 20Na
2O-15GeO
2 (TZNG). The synthesis and quenching of the glass preform are performed in a glove box under dry atmosphere to avoid any water contaminations from the environment and thus reducing the amount of residual OH groups in the glass matrix.
To further reduce the presence of hydroxyl compounds and limit the mid-IR absorption of the fibre, zinc fluoride is added to the core composition for dehydration of the bulk glass. TZNF and TZNG glasses are synthesised from high purity precursors (5N for TeO
2 and GeO
2, 5N for ZnO and 6N for Na
2CO
3, all from Fox Chemical and 4N from Alfa Aesar for ZnF
2). The powders are weighed and mixed in platinum crucibles and then placed in the same electric furnace, one above the other, for 1 h at 650 °C to allow the decarbonation process of the Na
2CO
3 to take place and then at 900 °C for 2 h (resp. 1 h 15) for the TZNF glass (resp. TZNG glass). There is a constant flow of dry O
2 (2 L·min
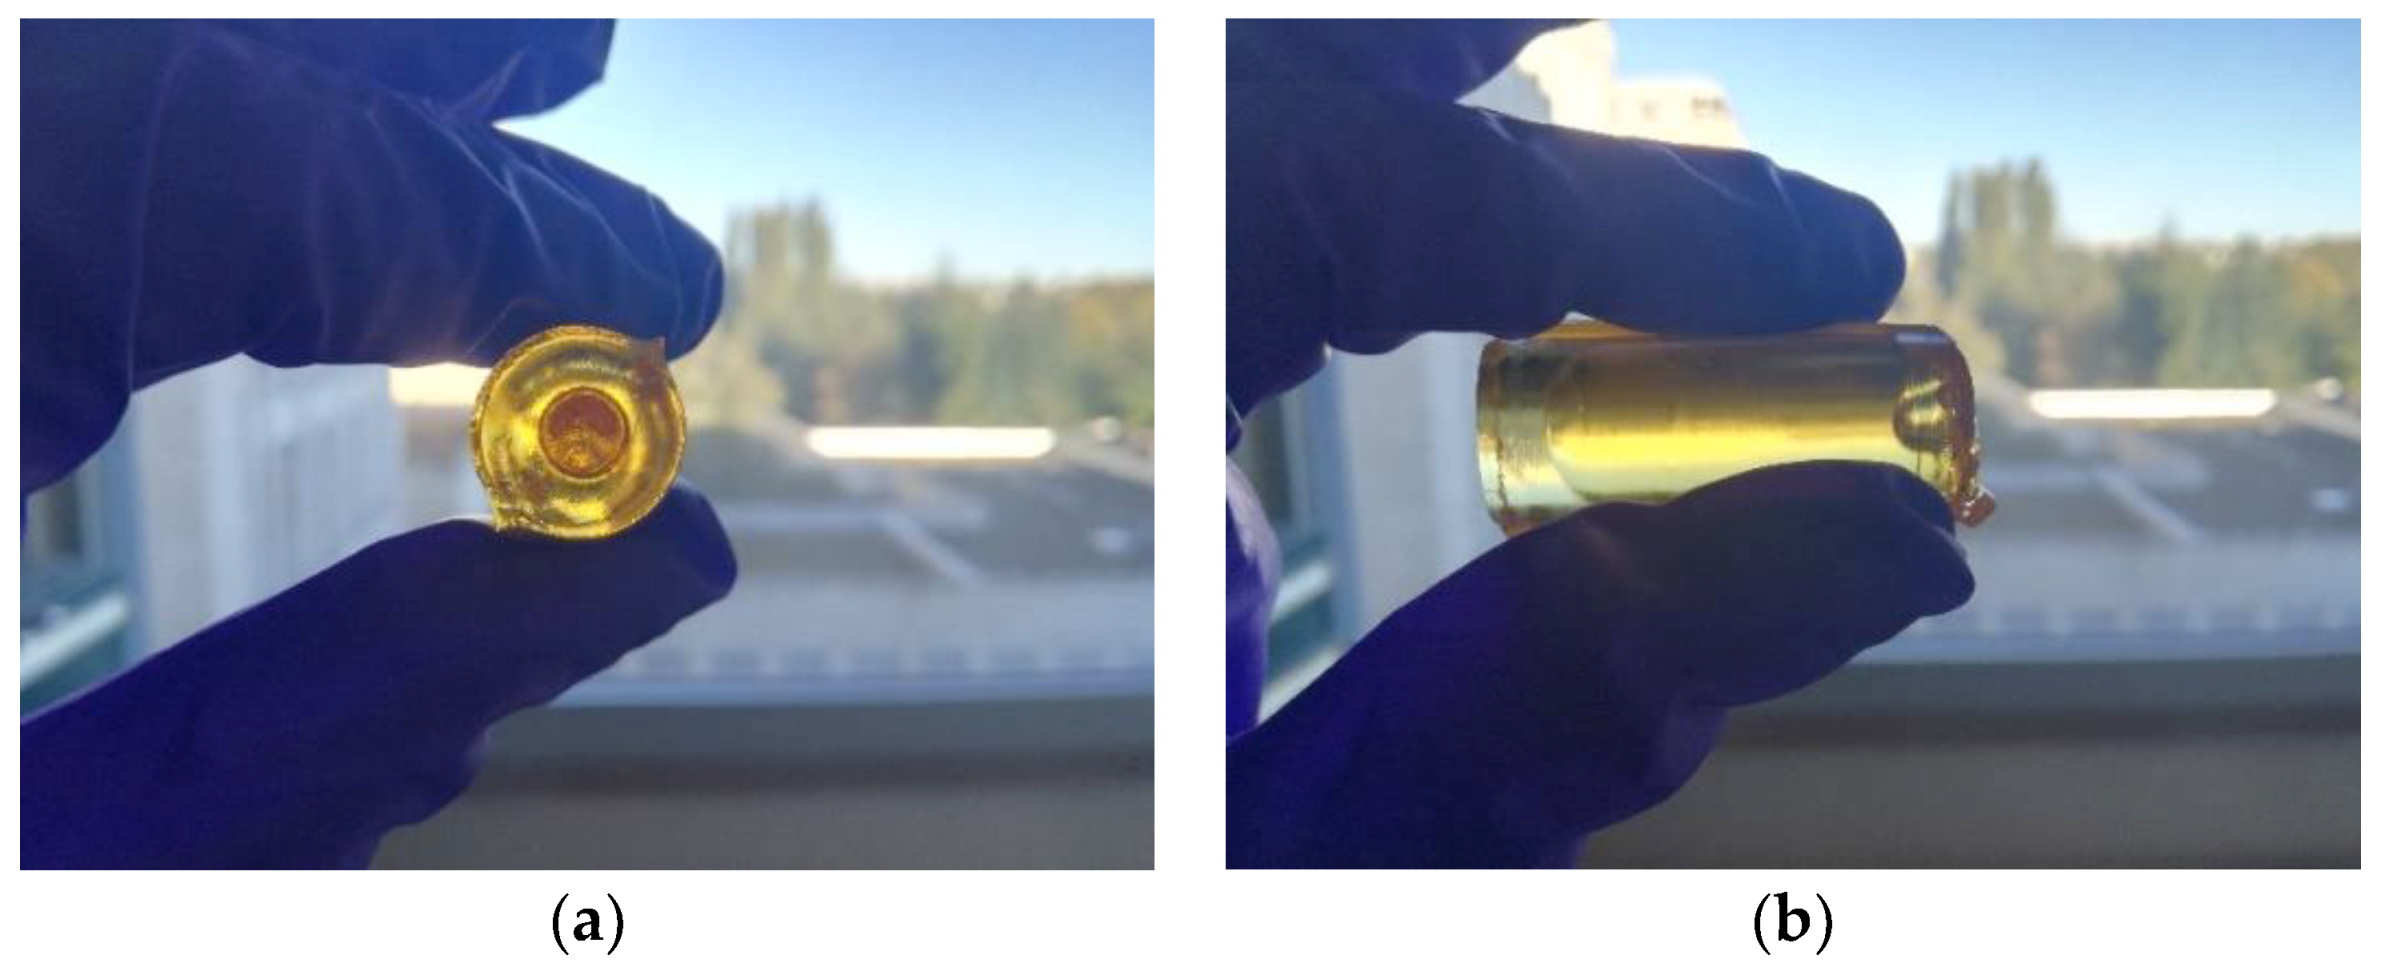
−1) in the synthesis furnace to control the oxidation conditions of the batch during both the decarbonation and the melting steps. To limit the evaporation of some of the precursors, a platinum cap is used and thus avoids some variations of the glasses’ compositions. Both melted glasses are quenched in a cylindrical brass mould pre-heated at 240 °C and then annealed for 8 h at 270 °C. At the end of this process, we obtain a 45 mm long and 16 mm large cylindrical preform inside which it is easy to differentiate the two different compositions; this is shown in
Figure 1.
One part of the step-index glass preform obtained thereby is heated above the vitreous transition temperature T
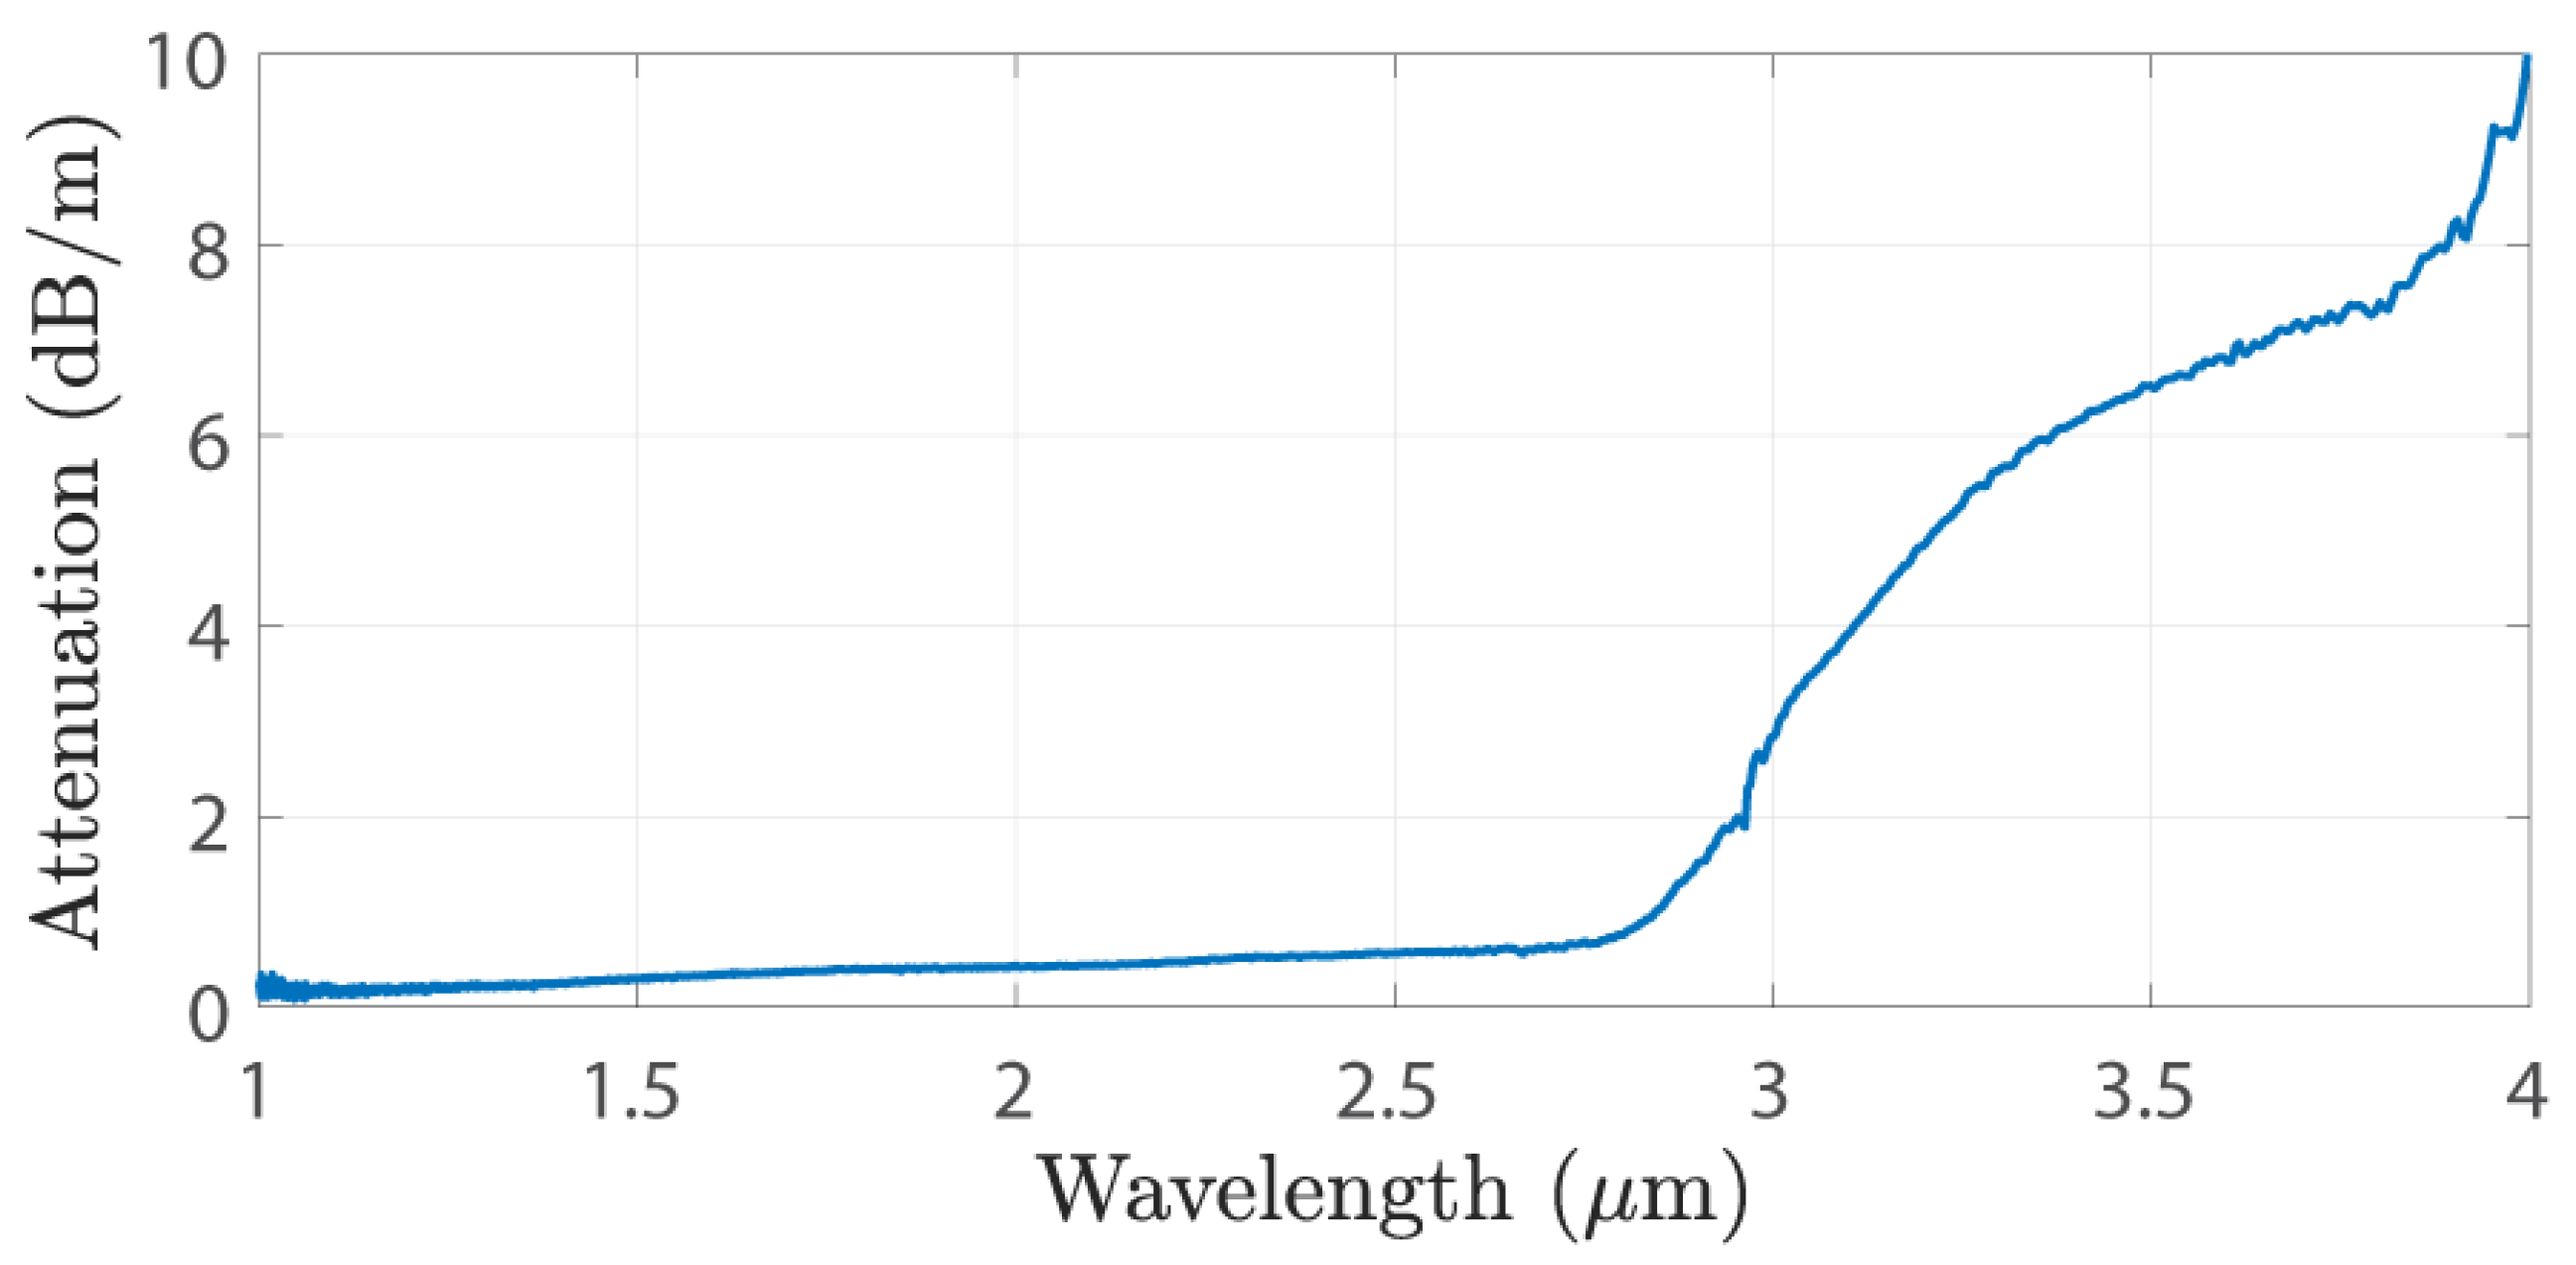
g in order to be drawn into a large core step-index fibre with a core to cladding diameter ratio of roughly 50% for loss measurement; this is shown in
Figure 2. The fiber exhibits background losses below 1 dB/m between 1 and 2.8 μm. Thanks to our dehydration process, the glass OH content is very low, namely the water-related absorption band between 3 and 4 μm is almost eliminated, before losses increase when reaching the multiphonon absorption edge around 4 µm. Even at such wavelength, the fiber losses still remain moderate when considering cm-long fiber segments for SC studies in the following.
The second part of the step-index glass preform is drawn into capillaries with an outer diameter of 800 µm by drastically reducing the drawing speed, and then used for the next rod-in-tube stage. A second cladding glass preform used as a tube is made following the same protocol as previously described and drilled mechanically. The step-index rod is then inserted into the hole of the second cladding preform and another drawing stage is performed to obtain small-core step-index fibers (see
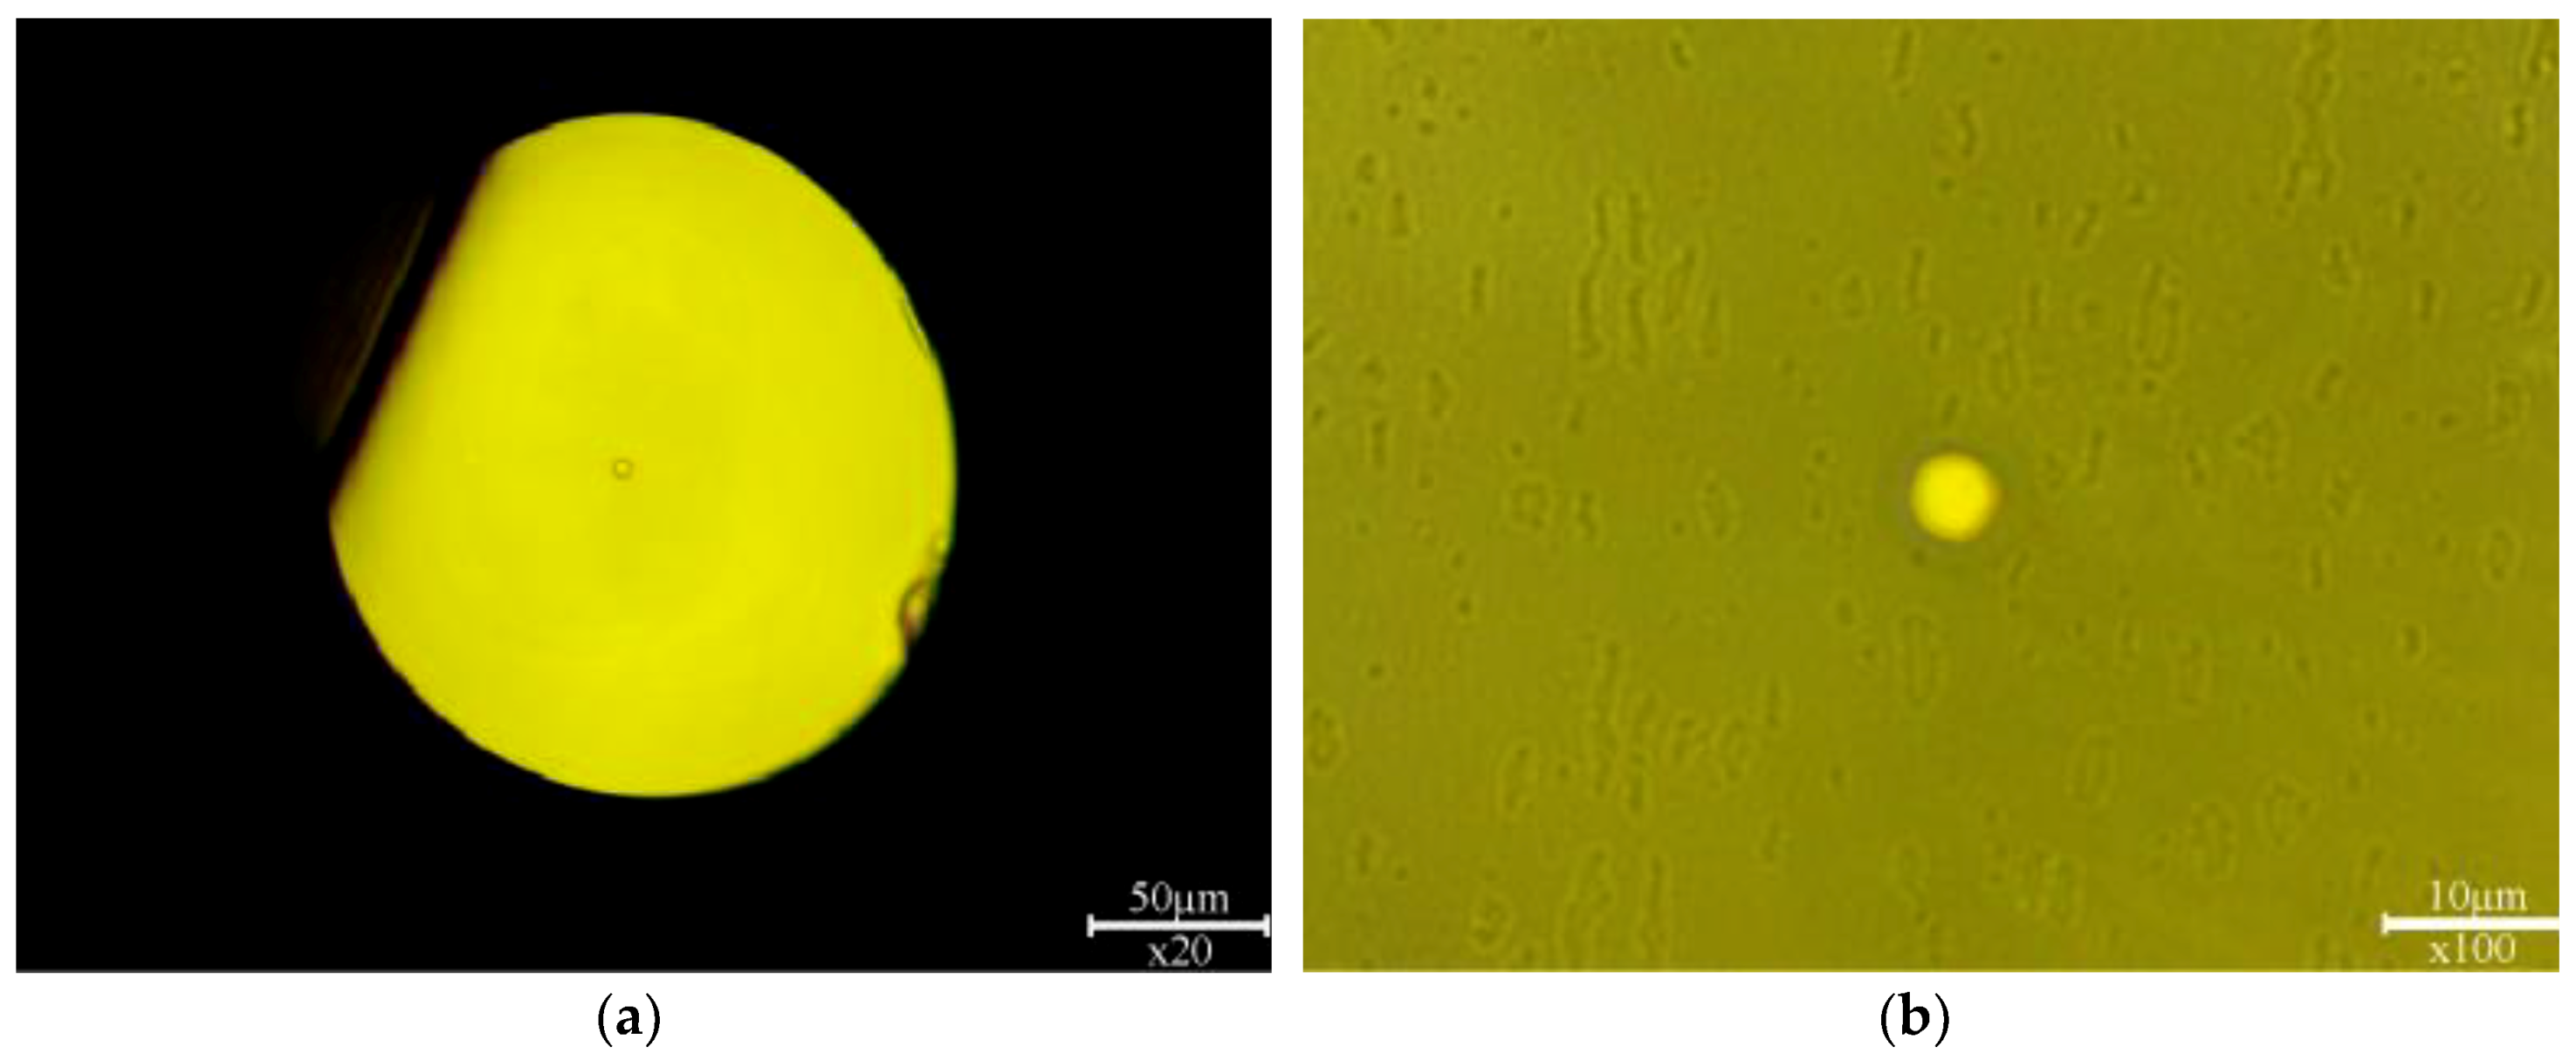
Figure 3). By monitoring the total diameter of the fibre during the latter drawing, it is possible to estimate quite accurately the core size of the resulting fiber. Typically, core diameters varying between 3 and 6 µm are obtained when the outer fiber diameter is roughly between 120 and 240 µm.
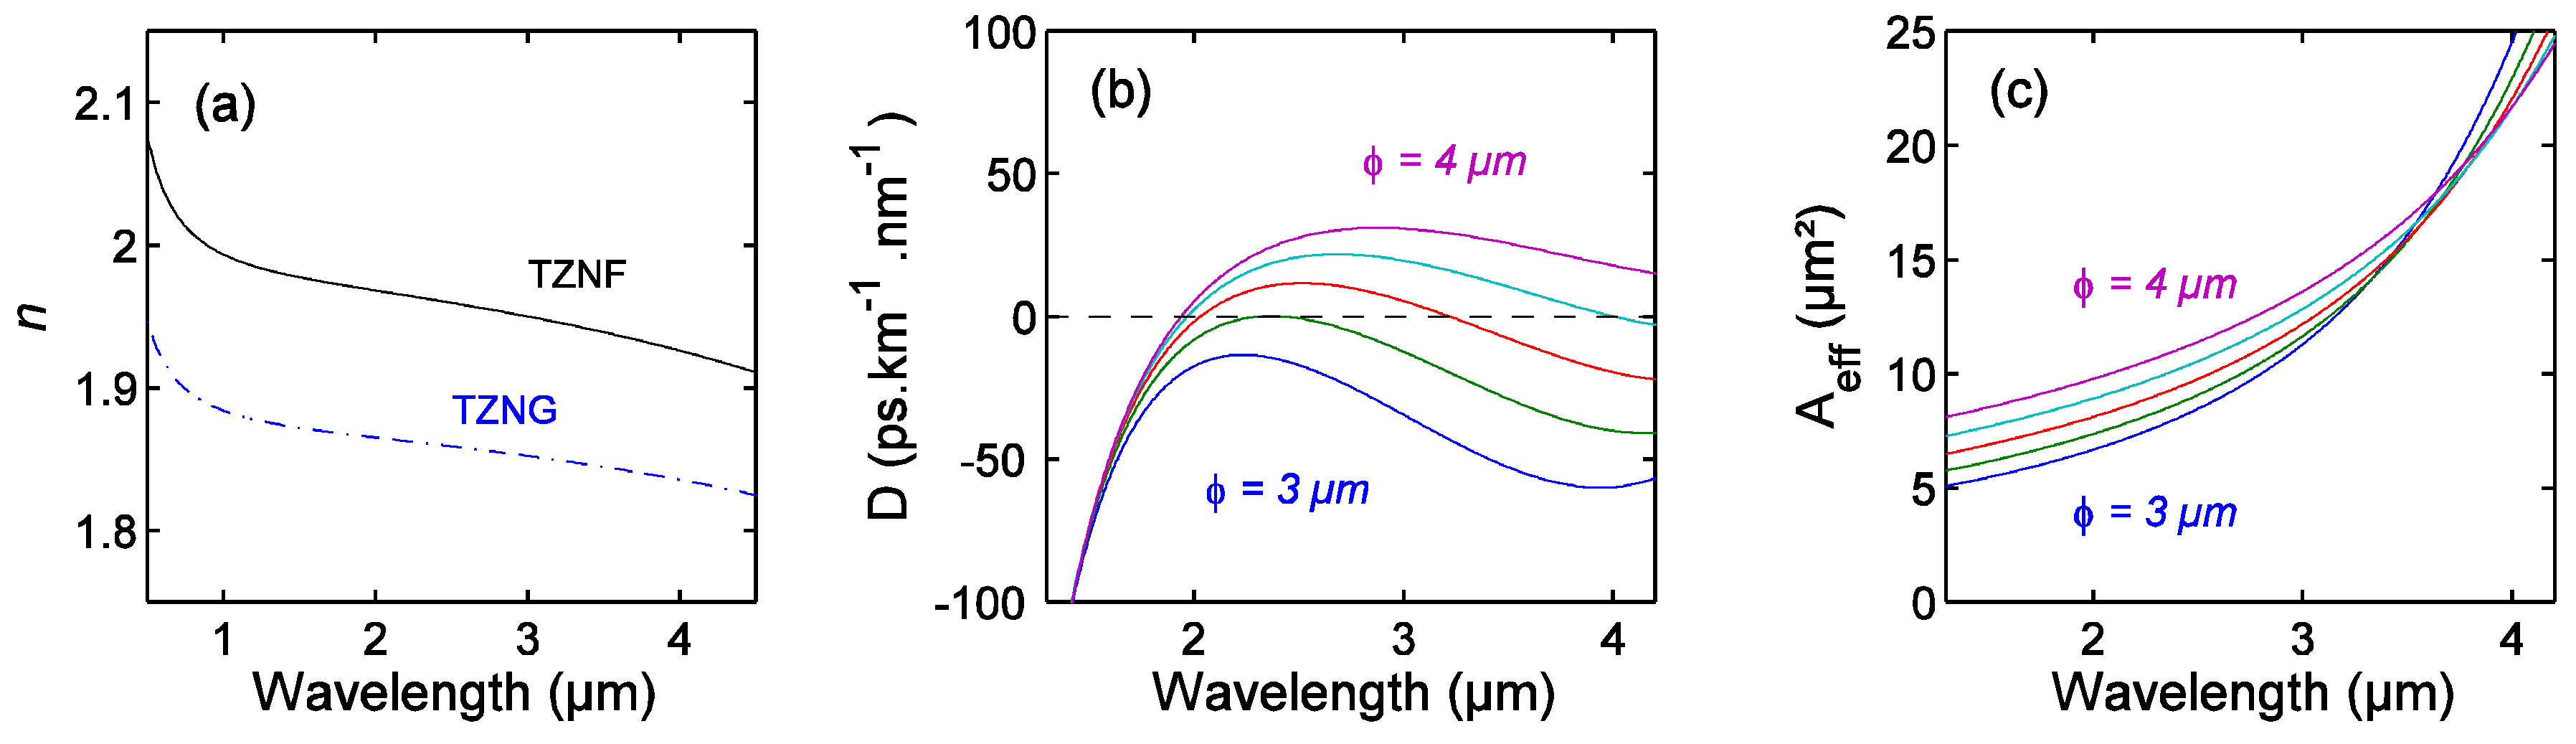
The wavelength-dependent refractive index curve for each glass can be determined with different interpolation schemes based on two-pole Sellmeier equations fitting near-IR measurements on bulk materials (more details are given in References [
25,
27]). The resulting refractive index curves are shown in
Figure 4a. The core-cladding index difference is ~0.1 at 2 μm. Based on this simple step-index profile, our fibers do not exhibit a strictly single-mode behavior in the mid-IR spectral range, but high numerical apertures and a rather strong confinement of the fundamental guided mode. Properties of the fundamental guided mode are investigated by numerically solving the dispersion equation (also called the eigenvalue equation) for cylindrical step-index waveguides.
Figure 4b–c report the calculated dispersion curves and effective mode area variations as a function of wavelength. We observe that our fiber design provides distinct dispersive regimes by simply varying the core diameter from 3 to 4 μm. An all-normal dispersion profile and even a multi-ZDW dispersion profile are obtained in
Figure 4b. We find that anomalous dispersion only exists for core diameters
≥ 3.25 μm. The first ZDW can be easily tuned between 1.92 and 2.35 μm, while a second ZDW is present for
< 3.8 μm, and shifted from 2.4 to 4.3 μm. The flexibility of GVD properties beyond 2 μm combined with strong optical confinement allow us to investigate an overview of relevant nonlinear dynamics of SC generation, as already addressed for the picosecond pumping regime in Reference [
25]. In contrast, we focus this study on the femtosecond pumping regime with moderate peak power in order to preserve SC coherence properties.
3. Numerical Results
We first performed numerical simulations of the nonlinear pulse propagation in step-index tellurite fibers with different core diameters, more particularly by choosing pumping parameters from the laser characteristics used in the later experimental work (200-fs Gaussian pulses in the wavelength range 2100–2400 nm). Our modelling is based on the generalized nonlinear Schrödinger equation that includes the full dispersion curve (
), both instantaneous Kerr and delayed Raman nonlinear responses, and the dispersion of nonlinearity (
) [
26]. This equation governs the evolution of the complex envelope of the electrical field
as follows:
The nonlinear Kerr coefficient
is calculated by means of the previously simulated effective mode area and the following nonlinear refractive index
3.8 × 10
−19 m
2·W
−1 [
28]. For the Raman response function, we used an intermediate-broadening model using convolutions of Lorentzians and Gaussians adapted from spontaneous Raman scattering spectra and estimated Raman gain coefficient given in Reference [
29]. The contribution of the delayed Raman response was found to be
. Our simulations also include the fiber losses (
) in the 1–4 μm spectral range measured in
Figure 2 and extrapolated above 4 μm (i.e., the multi-phonon absorption edge). The dependence of SC stability on the input pulse characteristics and the fiber parameters has been extensively studied in the last decade [
30,
31]. It was found in the anomalous dispersion regime that the competition of coherent (soliton fission) and incoherent (modulation instability) spectral broadening mechanisms governs the SC coherence properties. It is then reasonable to consider a pump pulse soliton number of
as a general rule to maintain high coherence (thus corresponding, in practice, to pump pulse durations well below the picosecond). Recall that
is defined as follows:
, where
is the peak power,
is the half-width (at 1/
e-intensity point) of the input pulse, and
is the group velocity dispersion at the pump wavelength. In contrast, the use of all-normal dispersion fibers allows highly coherent SC to be designed for initial soliton numbers up to
and pump pulse durations of up to 1.5 ps. In addition to spectral broadening, in the following, we also analyze the associated coherence properties as a function of fiber parameters for the available pump conditions. The sensitivity of SC fluctuations to input noise was then studied, as described in Reference [
26]. We specifically performed 100 simulations with different random input noise imposed on the input pulse for each fiber. The ensemble of output SC fields allows the calculation of the complex degree of first-order coherence (given by Equation (2)) defined at each wavelength in the SC, typically used to characterize the shot-to-shot stability of SC sources. The angular brackets in Equation (2) denote averaging over an ensemble of independent SC realizations [
26,
32].
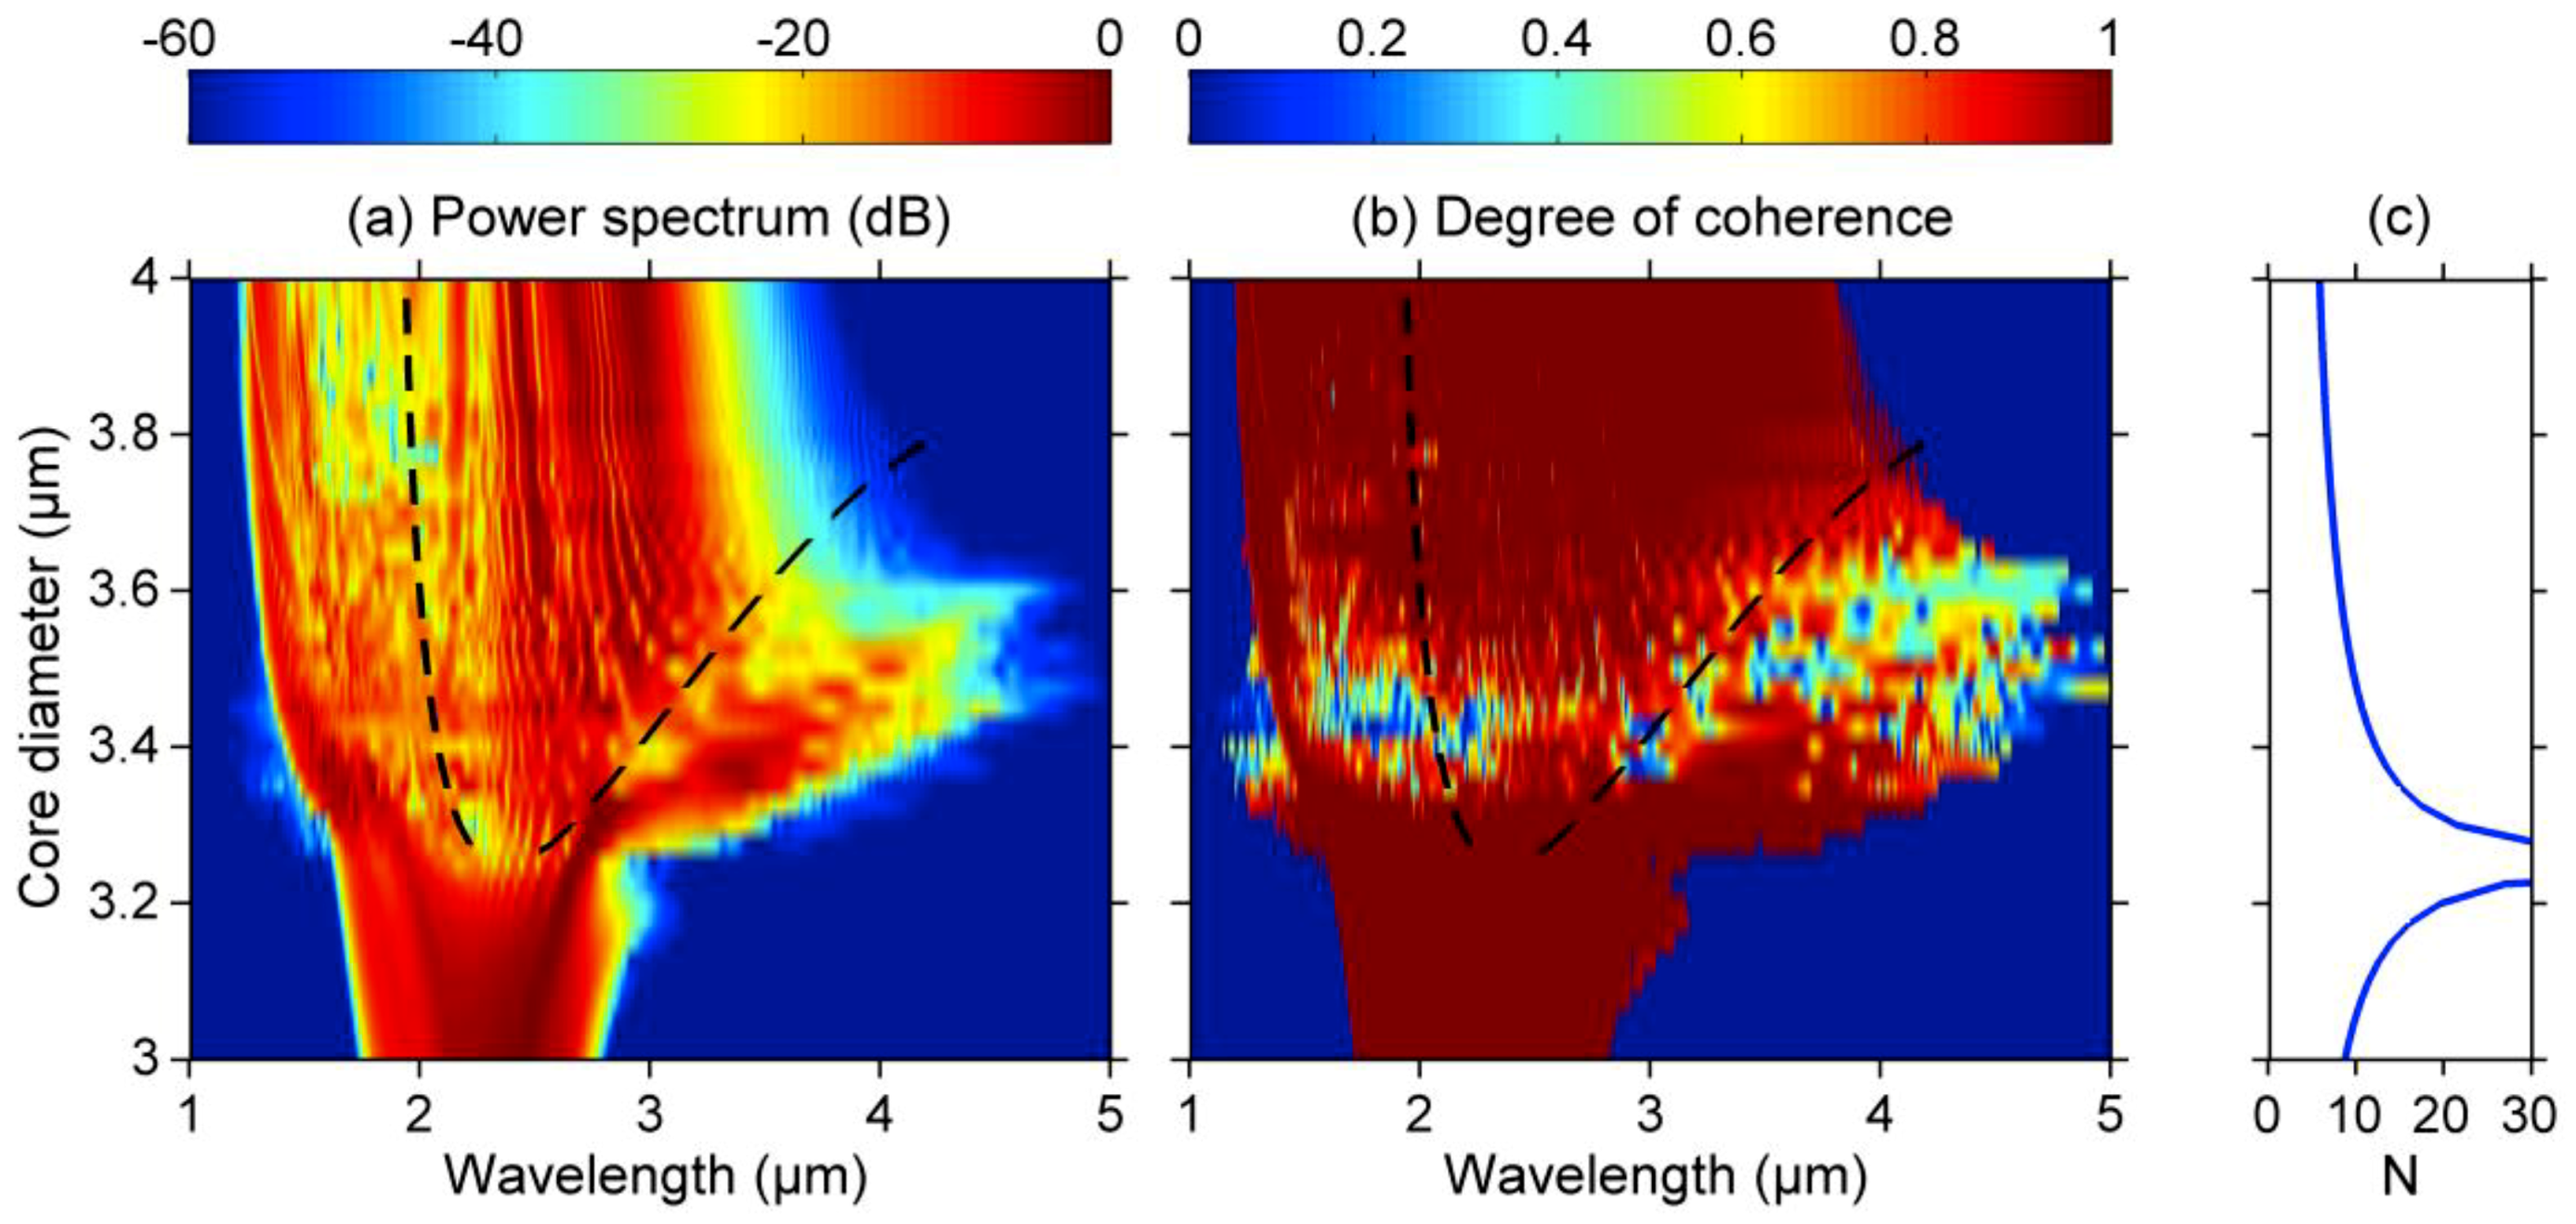
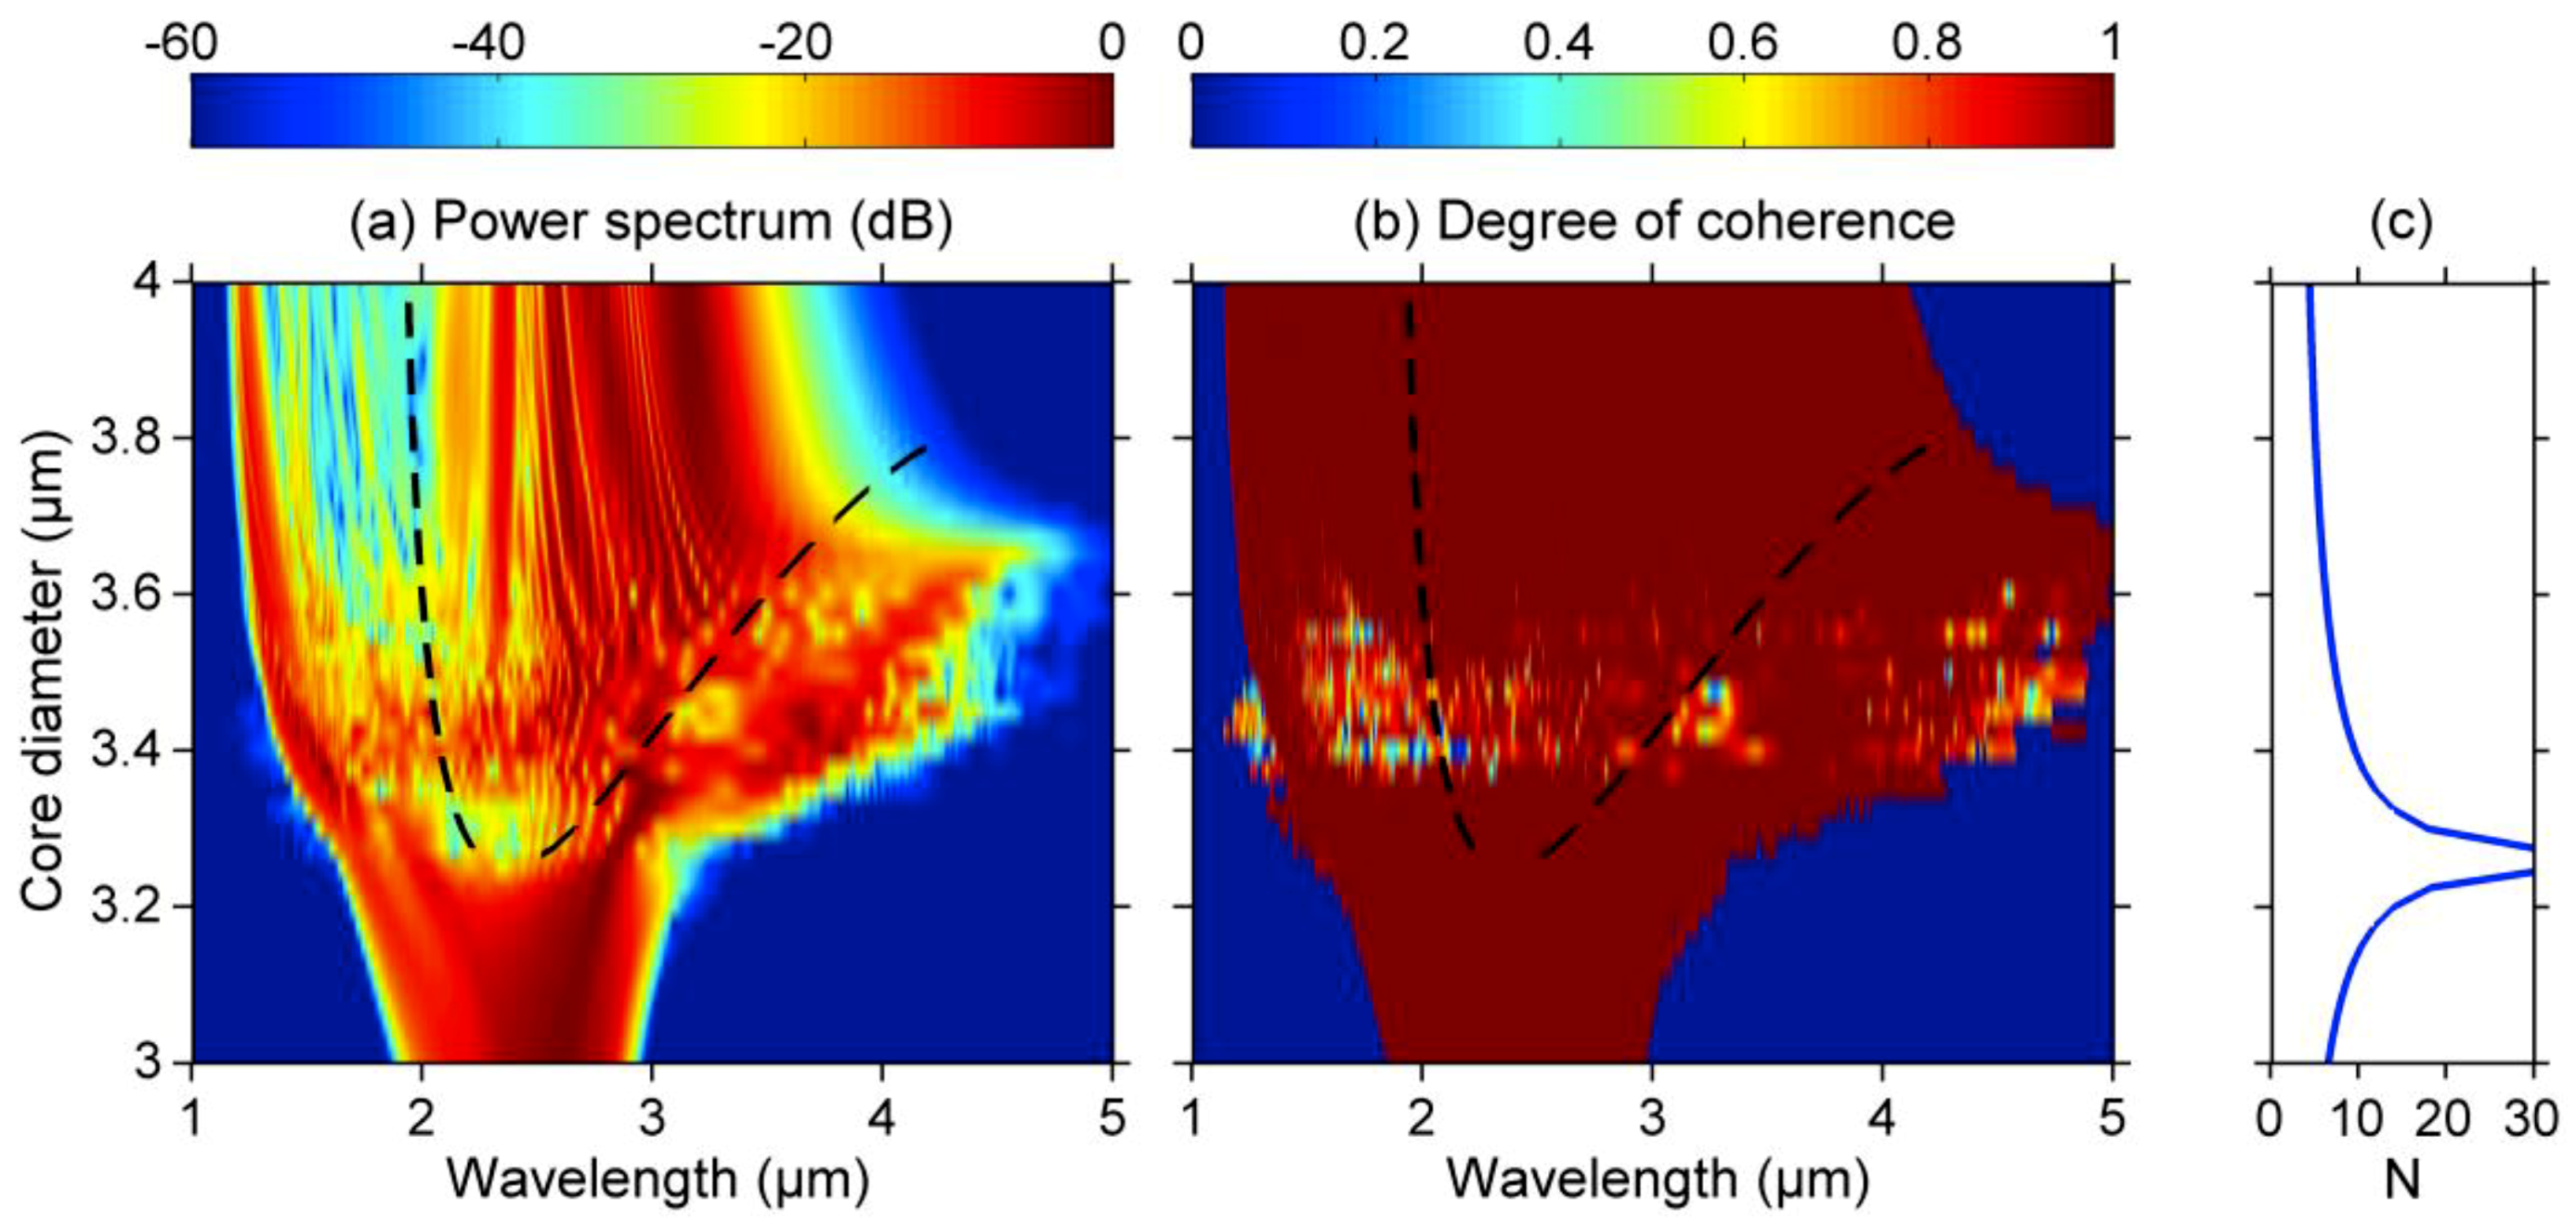
Figure 5 shows the variation of the average SC spectrum obtained in our tellurite fiber for a core diameter ranging from 3 to 4 μm. Here the fiber length was fixed to 12 cm, and the input peak power of 200-fs pulses at 2300 nm was set to 3 kW.
One can mainly distinguish three configurations, namely, (i) the pumping in the normal dispersion regime (
< 3.3 μm), which rather leads to narrow spectral broadenings, (ii) the pumping in the anomalous dispersion regime between two close ZDWs (3.3 <
< 3.6 μm), which results in the broadest SC spectra, and (iii) the pumping in the anomalous dispersion regime when the second ZDW is far from the pump or does not exist (
> 3.6 μm). In the first case (i), SC generation is driven by self-phase modulation (SPM) and optical wave-breaking, thus the spectrum remains nearly symmetric around the pump wavelength [
33] and stable to input noise, which guarantees a full SC coherence, as shown in
Figure 5b. These are typical features of SC generation in ANDi fibers even if the input soliton number (corresponding to input pulse and fiber parameters) is well above 10 [
31] (see
Figure 5c), for increasing core diameters in this regime, the group-velocity dispersion approaches zero. For the second case (ii), the spectral broadening reaches maximum bandwidth possible and results from well-known soliton dynamics and Raman soliton-self-frequency shift [
26]. Note the formation of dispersive waves (DWs) in both regions of normal dispersion, in the near-IR below 2000 nm and in the mid-IR beyond 3000–3500 nm, induced by the presence of two close ZDWs. However, we observe the degradation of SC coherence in particular in the wavelength range of DWs (note that the soliton number is around 10). In the third case (iii), spectral broadening dynamics are similar, but without mid-IR dispersive wave since the second ZDW is far-detuned. Consequently, the SC bandwidth is reduced for increasing fiber core diameters, in particular due to the larger anomalous dispersion that restrains soliton dynamics. Note that the soliton number decreases well below 10, thus resulting in the recovery of the full degree of SC coherence.
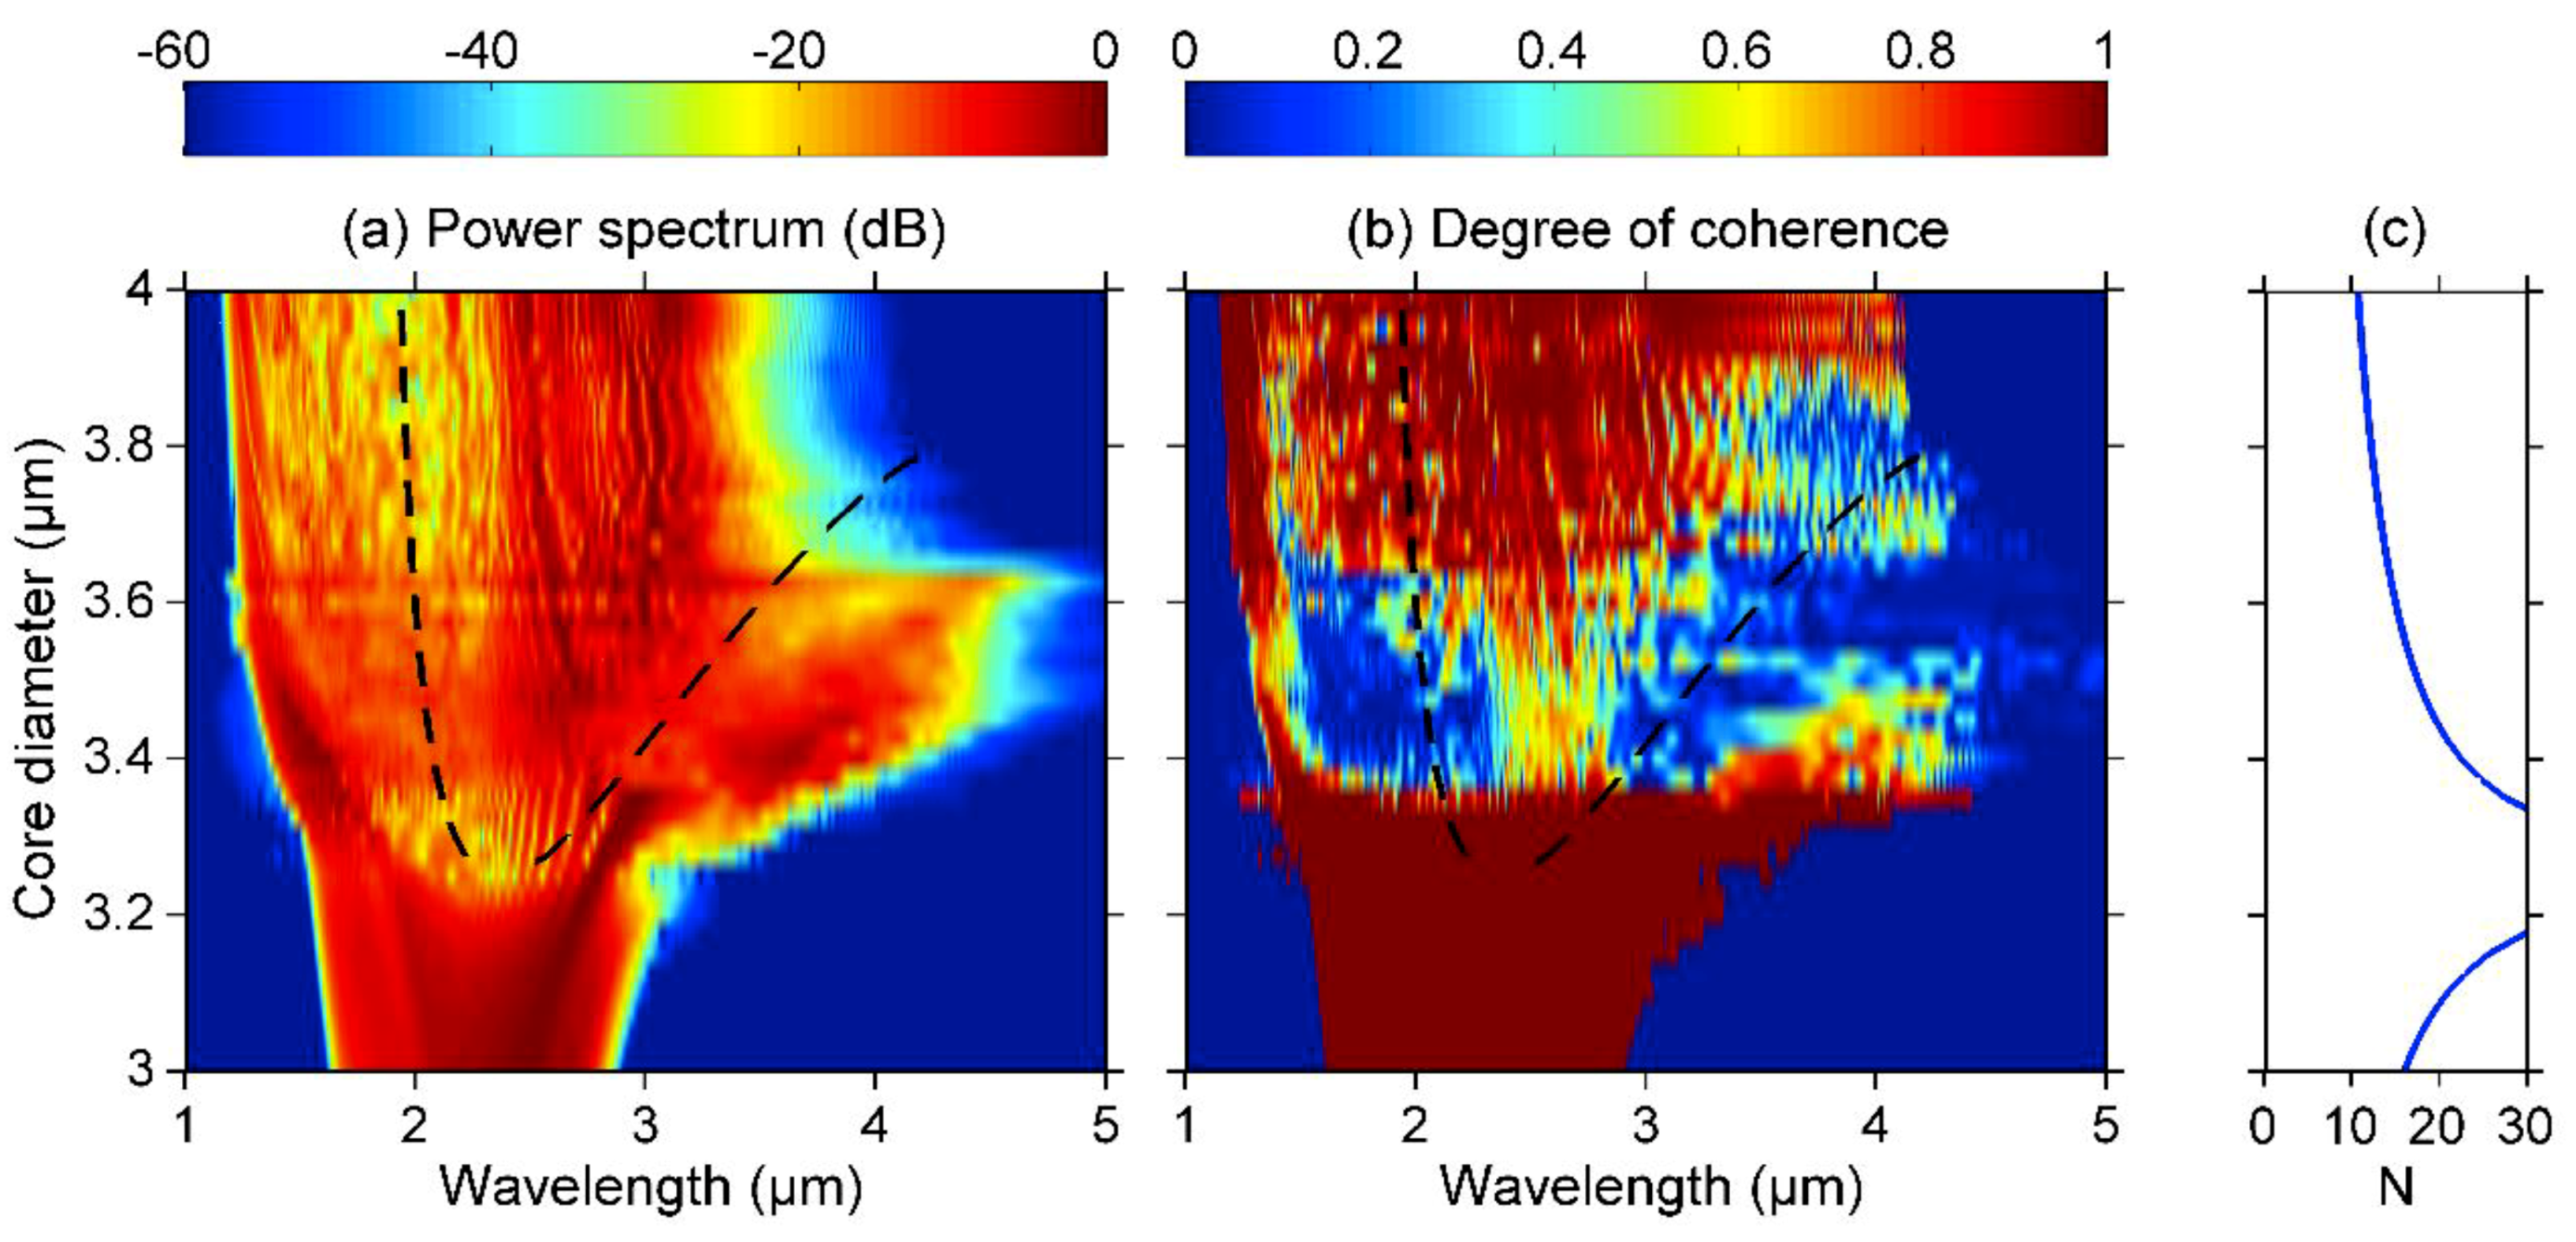
To gain further insight into the limiting pumping parameters on SC coherence, we performed similar numerical simulations for the same pump wavelength but with distinct input peak powers, namely 5 kW (see
Figure 6) and 1 kW (see
Figure 7). In
Figure 6, we recover almost the same results as those described for
Figure 5 with increased spectral broadenings, except that the degradation of SC coherence now occurs even in the third SC pumping configuration with a single ZDW. We also clearly note that the corresponding soliton number is always above 10. It is worth mentioning that the generated SC becomes completely incoherent in the second configuration when pumping between two ZDWs. Now when looking at
Figure 7 with a lower input peak power, the full SC coherence is preserved regardless of the fiber dispersion properties (i.e., the fiber core diameter). The empirical rule for SC design is again verified since the calculated soliton number is below 10 for pumping in the anomalous dispersion regime. We also check that the SC spectrum can still extend in the mid-IR until 4.5 µm with such a moderate input power.
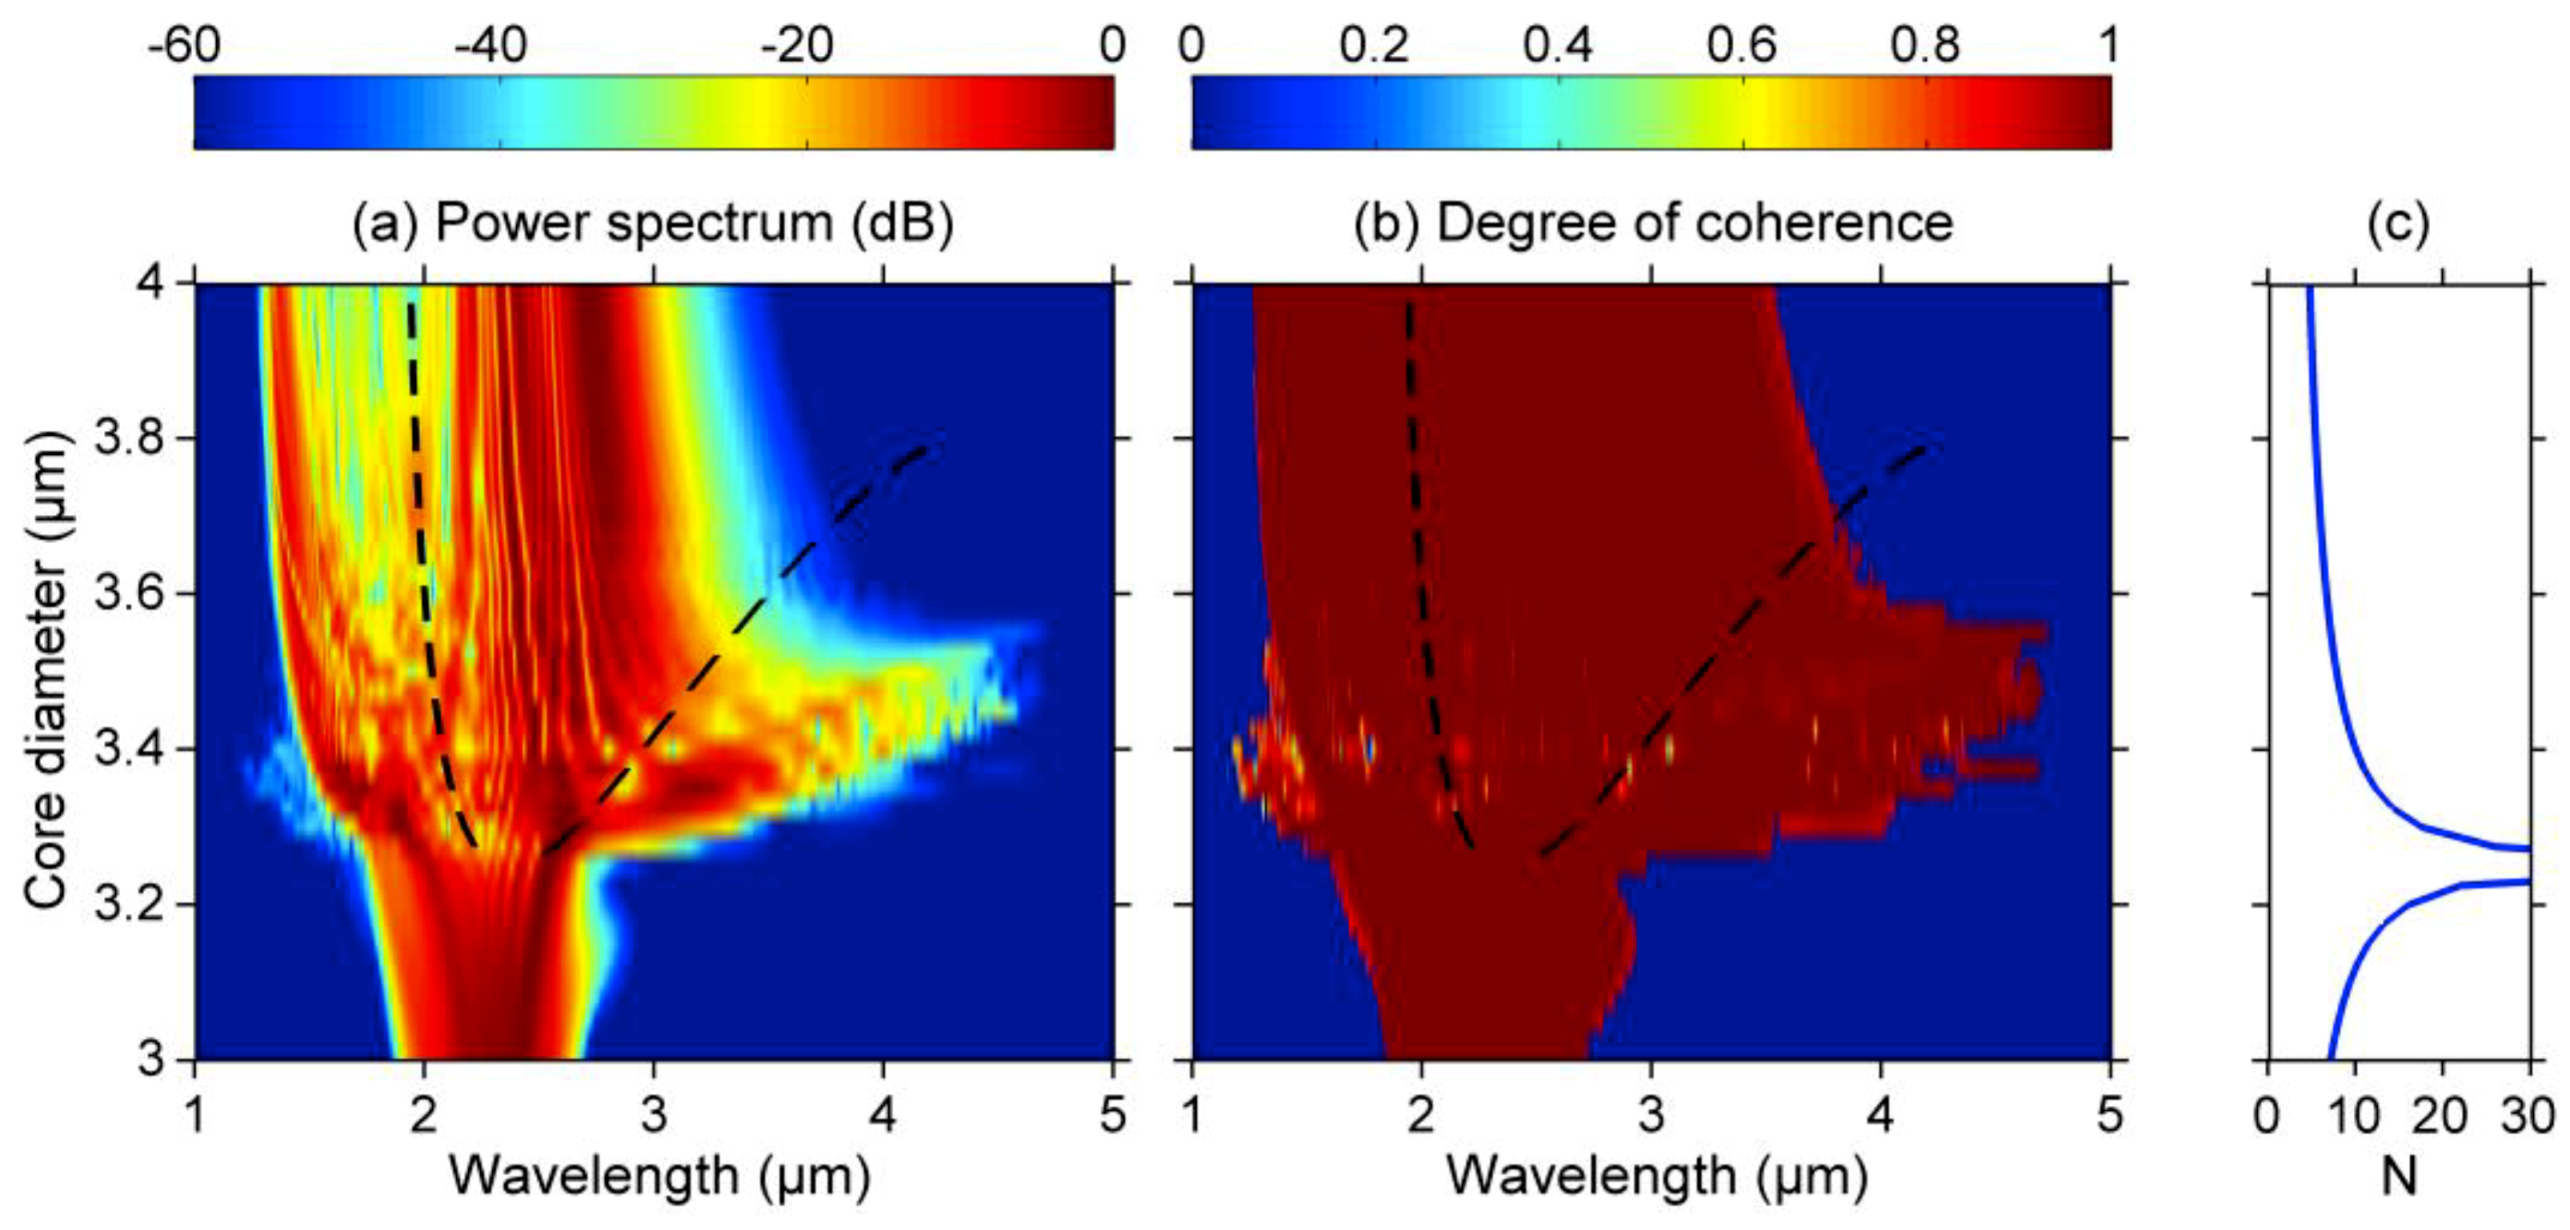
Another set of simulations was performed by changing the pumping wavelength, namely 2100 nm (see
Figure 8) and 2500 nm (see
Figure 9), while keeping the same input peak power as
Figure 5 (i.e., equal to 3 kW). Again, this variation of pumping wavelength induces the corresponding increase (
Figure 8) or decrease (
Figure 9) of the input soliton number above or beyond the “threshold value” of 10 since group velocity dispersion changes. Thus, consequences of mechanism of decoherence are observed when pumping at 2100 nm in the anomalous dispersion regime, whereas an excellent degree of coherence is obtained regardless of the fiber dispersion when pumping at 2500 nm. The latter case also allows for SC generation further in the mid-IR on a larger range of fiber core diameter. To conclude these numerical studies, we show that coherent mid-IR supercontinuum generation is obtained in our step-index tellurite fibers with distinct dispersion regimes in the femtosecond regime provided that the moderate input power satisfies an injected soliton number
. In particular, the largest SC spectrum into the mid-IR extending from 1.5 to 4.5 μm is obtained for fiber core diameters around 3.5 µm, thus corresponding to dispersion profiles with two ZDWs, and requiring the pumping into the anomalous dispersion regime (i.e., between the ZDWs).
4. Experimental Results
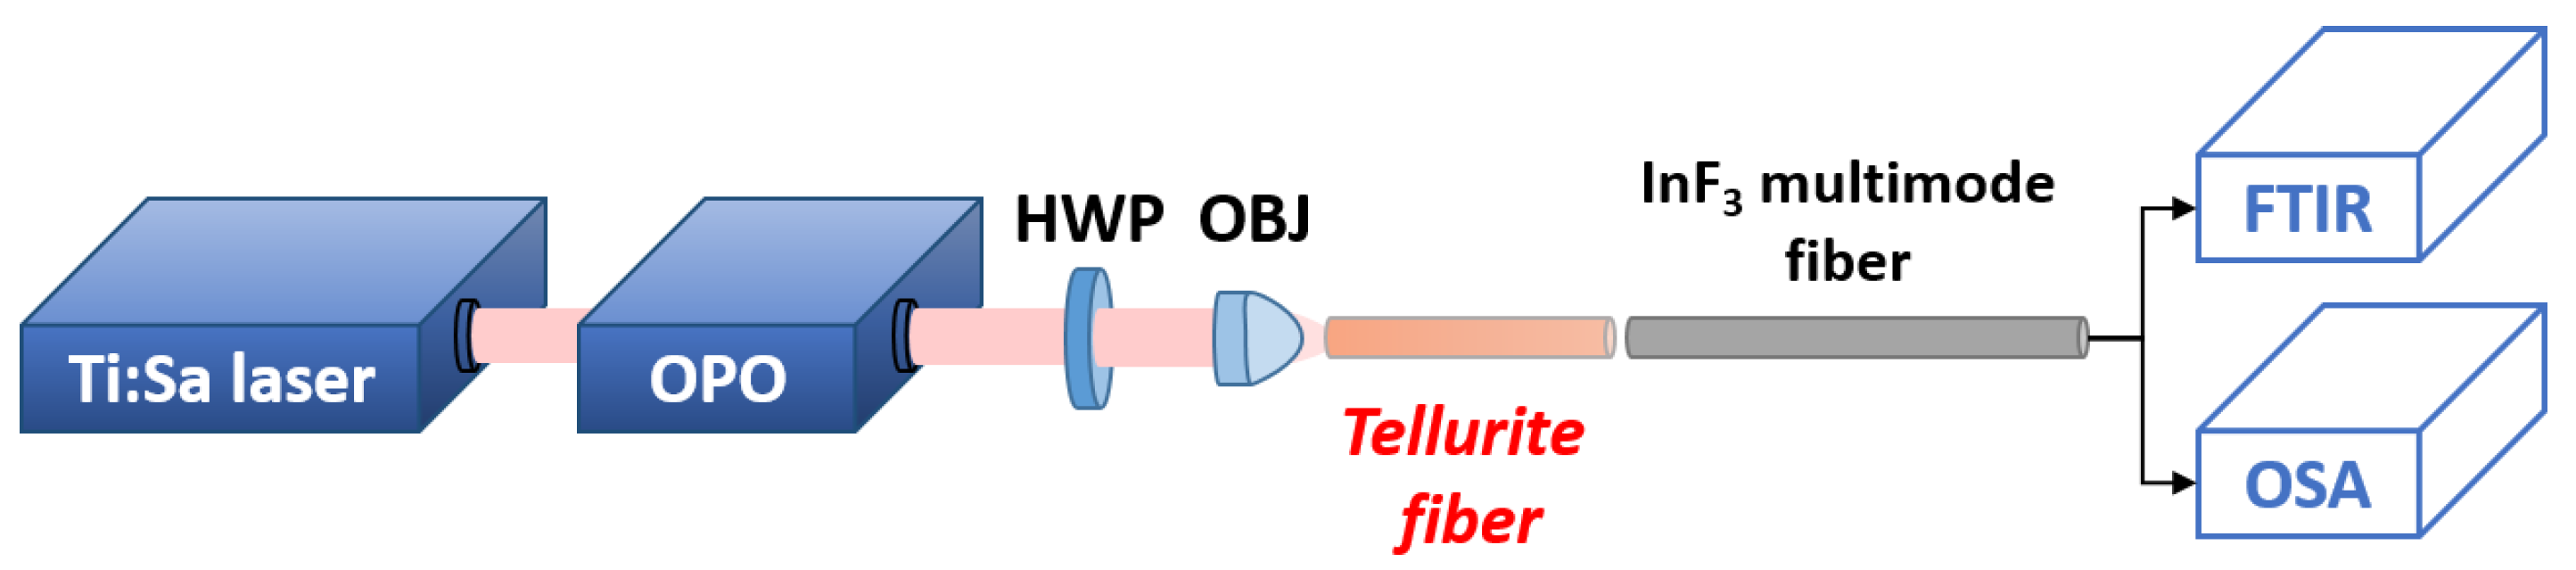
Based on the above numerical results, we have carried out experiments to demonstrate the efficiency of our dispersion-engineered tellurite fibers for mid-IR SC generation in the case of femtosecond pumping with moderate energy. First, we describe the experimental setup shown in
Figure 10. A Ti:Sapphire laser is used to pump an optical parametric oscillator (OPO) that delivers 200-fs pulses at a repetition rate of 80 MHz with an average power about 200 mW (i.e., 2.5 nJ per pulse) in the wavelength window from 2.2 to 2.4 µm (idler output). Our fibers were cleaved with a scalpel blade, and the quality of the interfaces was carefully checked under a microscope. A half-wave plate was also inserted in the light path to control the orientation of the linear polarization of the beam and excite the fiber under test along one of its polarization eigenaxes. Light coupling into the fundamental mode of the tellurite fibers was obtained by means of a silica microscope objective lens and the analysis of the output beam profile with an IR camera. The output of tellurite fiber was directly butt-coupled to a 0.5 m long multimode fluoride (InF
3) fiber with high transmission over the 0.35–5.5 μm spectral range. SC spectrum was then analyzed with an optical spectrum analyzer (OSA) covering the range 1.2–2.4 μm and a FTIR spectrometer for the range of 1–6 μm. In the following, we show the results obtained with three step-index tellurite fibers with the following core diameters: 3, 3.5, and 4 μm (i.e., corresponding to the three distinct SC regimes shown in
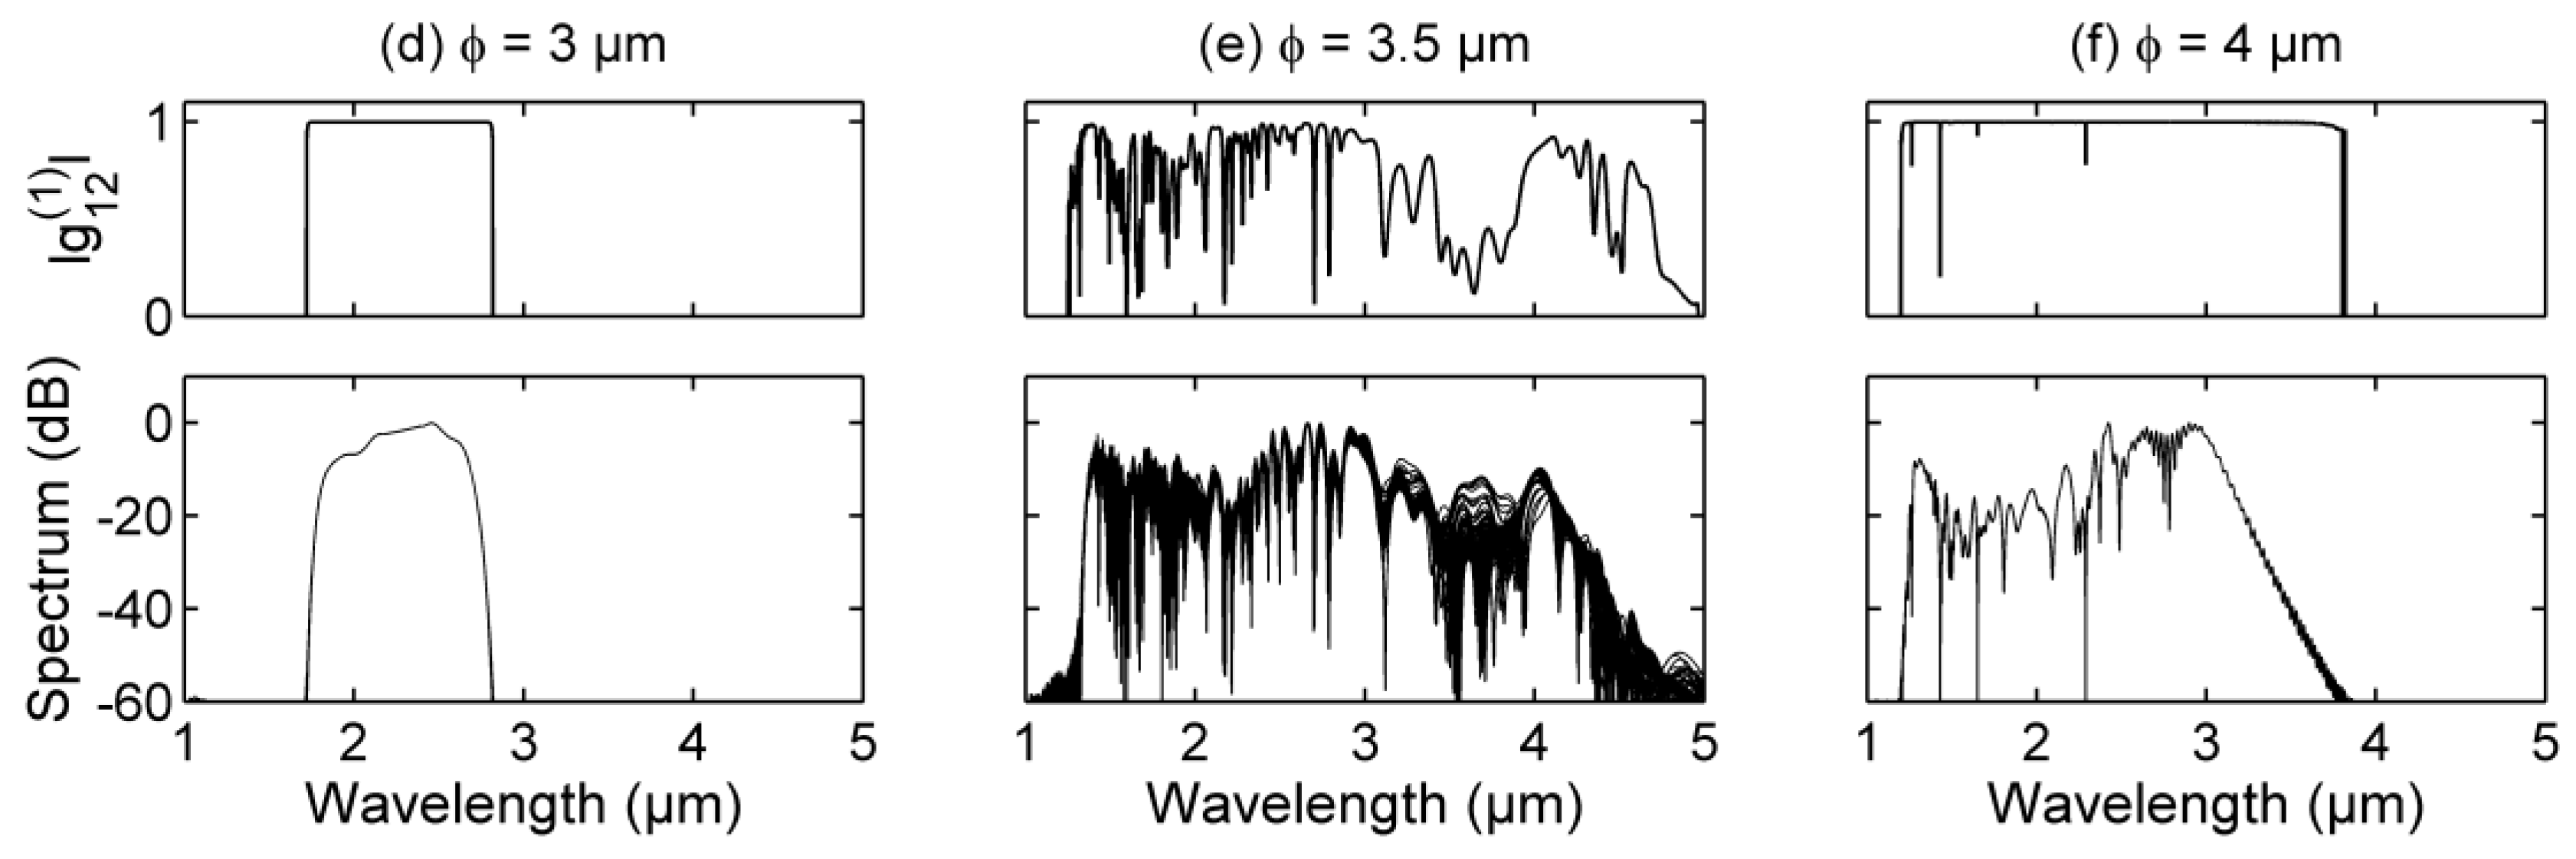
Figure 5). Our coupling efficiency varies from 25 to 35% as a function of the fiber core diameter, so that SC generation can be investigated here for all the fibers with a maximum input peak power of roughly 3 kW (i.e., 600 pJ per pulse).
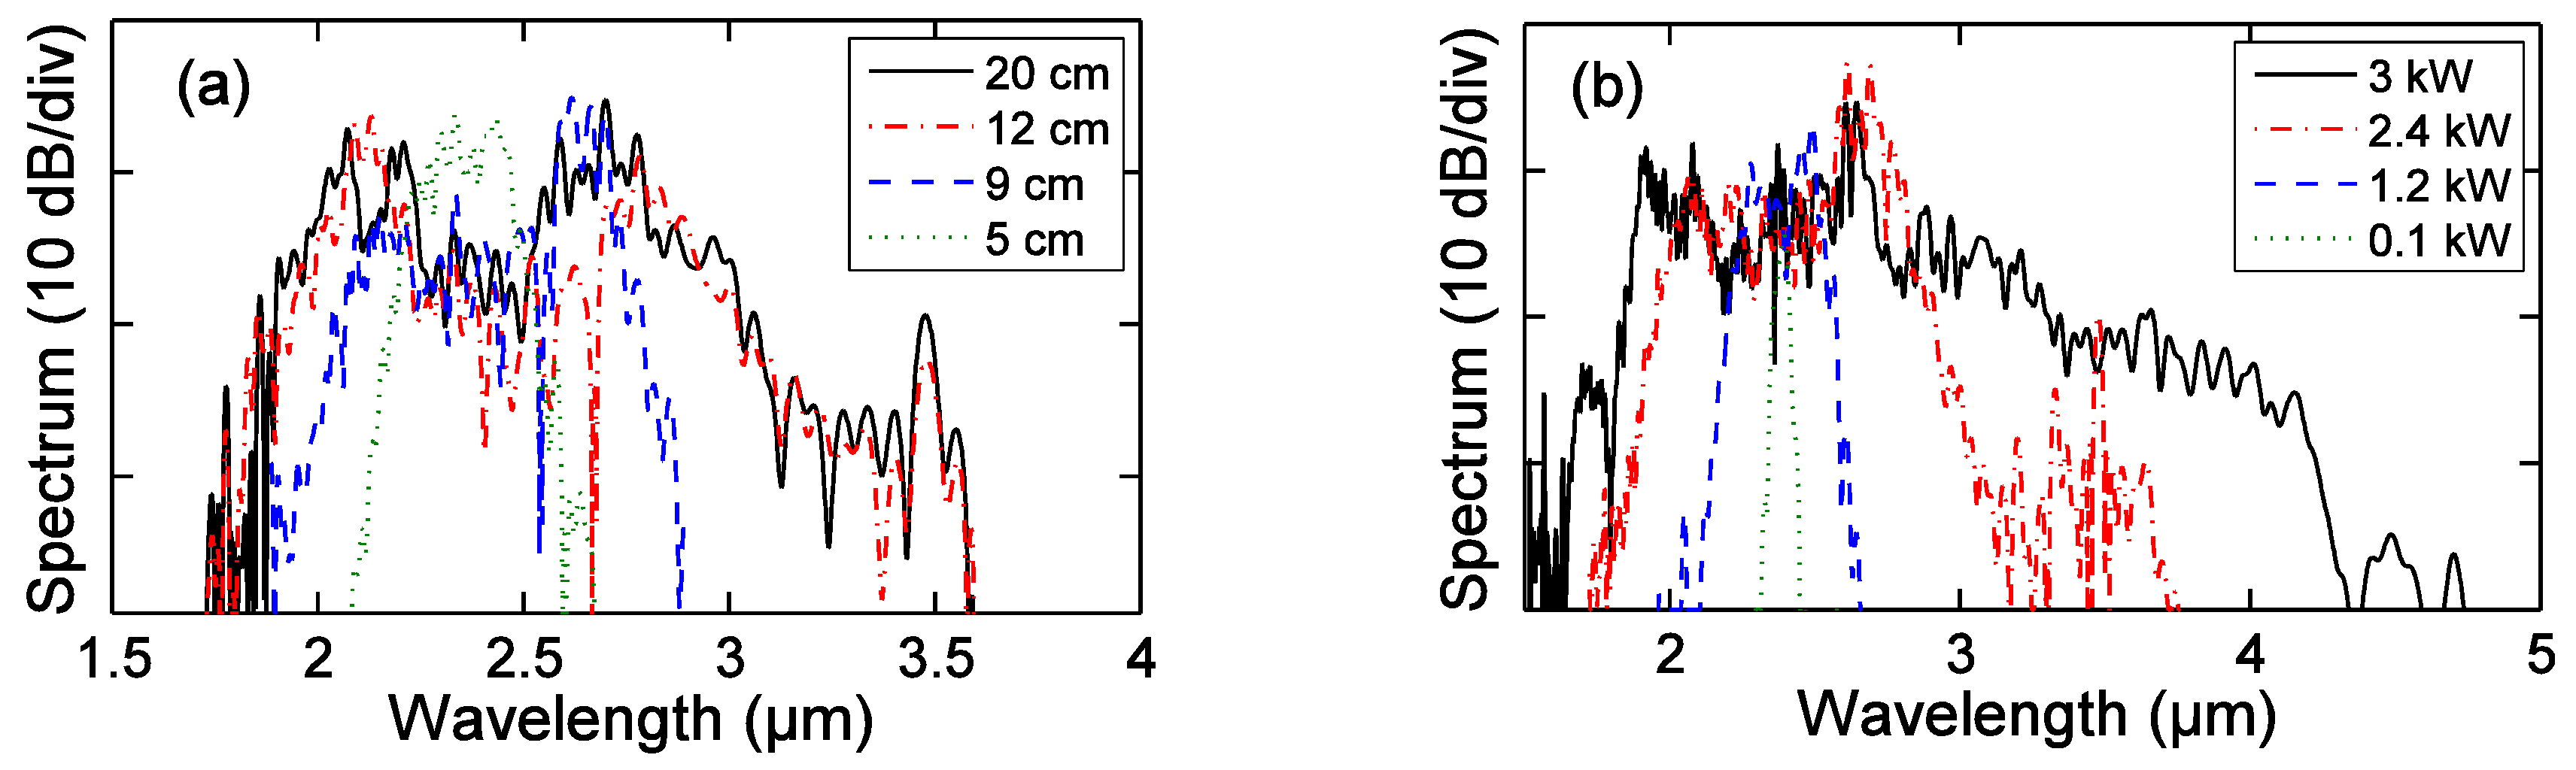
Figure 11 shows the impact of fiber length or input peak power on the generated SC spectrum when using the tellurite step-index fiber with a core diameter of 3.5 µm (i.e., with two ZDWs) pumped at 2300 nm between the two ZDWs. We can note that the maximum spectral broadening is reached after 12 cm of propagation for a fixed input power (see
Figure 11a). In particular, we observe the emergence of mid-IR dispersive waves around 3500 nm for the power fixed here at 2.2 kW (in agreement with simulations presented in
Figure 5 and
Figure 7). After 12 cm, the SC bandwidth saturates due to higher fiber losses around 4 µm. To reach wavelengths located further in the mid-IR, one has to use higher pump powers (i.e., higher values of
) to decrease the fiber length required for the frequency conversion mechanisms [
26] before loss-induced limitations. Next,
Figure 11b depicts the SC evolution as a function of input peak power for the optimized fiber length of 12 cm. We clearly retrieve the SC bandwidth predicted by numerical simulations (see
Figure 5e), which almost extends from 1.5 to 4.5 µm for the maximum input power of 3 kW.
We also investigated the impact of pumping wavelength on the SC bandwidth in
Figure 12. Again we confirm the general behaviour expected from numerical simulations (see
Figure 8 and
Figure 9), namely that spectral broadening is slightly enhanced when increasing the pump wavelength (here from 2250 to 2350 nm) as shown in
Figure 12a. Similar measurements are also reported in
Figure 12b,c with the same conclusion when using tellurite step-index fibers with different core diameters (i.e., distinct dispersion properties at the pump wavelength). It is worth mentioning that the optimized SC length for the latter fibers was also found to be around 12 cm.
Finally,
Figure 13 summarizes the largest SC spectra (maximum power of 3 kW and optimized length of 12 cm) obtained with the three different tellurite step-index fibers when pumping at 2300 nm. Those results are directly compared to numerical simulations taking into account the corresponding fiber properties. The noticeable agreement shows that the largest SC spectrum extending from 1.5 to 4.5 μm is obtained for a fiber core diameter corresponding to dispersion profiles with two ZDWs (see
Figure 13), and this also requires pumping into the anomalous dispersion regime (i.e., between the ZDWs). From previous numerical simulations, the full coherence of such a mid-IR SC configuration is only preserved for a moderate input pulse energy (about a few hundreds of pJ). The same analysis is also valid when using the tellurite fiber with a single ZDW and a core diameter of 4 µm. However, in that case, the mid-IR SC edge does not reach wavelengths beyond 4000 nm (see
Figure 13). In contrast, for small core tellurite fibers that provide ANDi profiles, coherent mid-IR SC could still be investigated with higher input powers than in
Figure 13, in order to reach larger bandwidths. In spite of this limited SC bandwidth, in the present SC configuration, higher power spectral density and the single-pulse feature of the SC remain some of the main advantages when compared to previous fibers.


