Performance of Concrete with Waste Granite Powder: The Effect of Superplasticizers


Abstract
1. Introduction
2. Materials
2.1. Cement
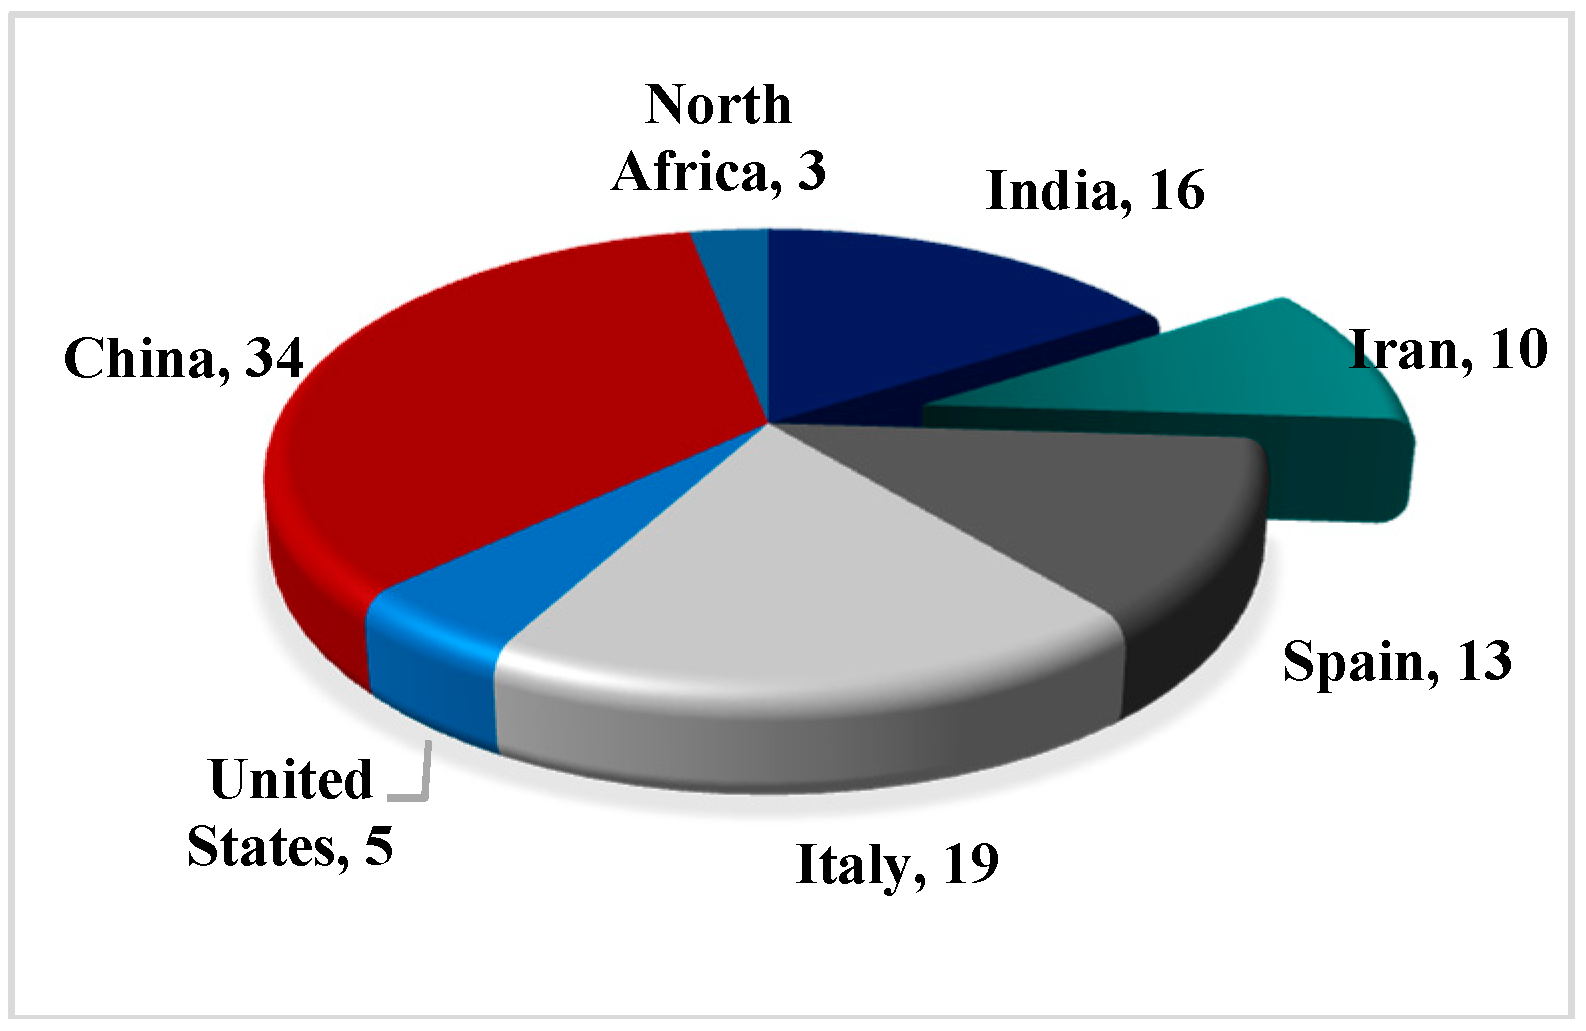
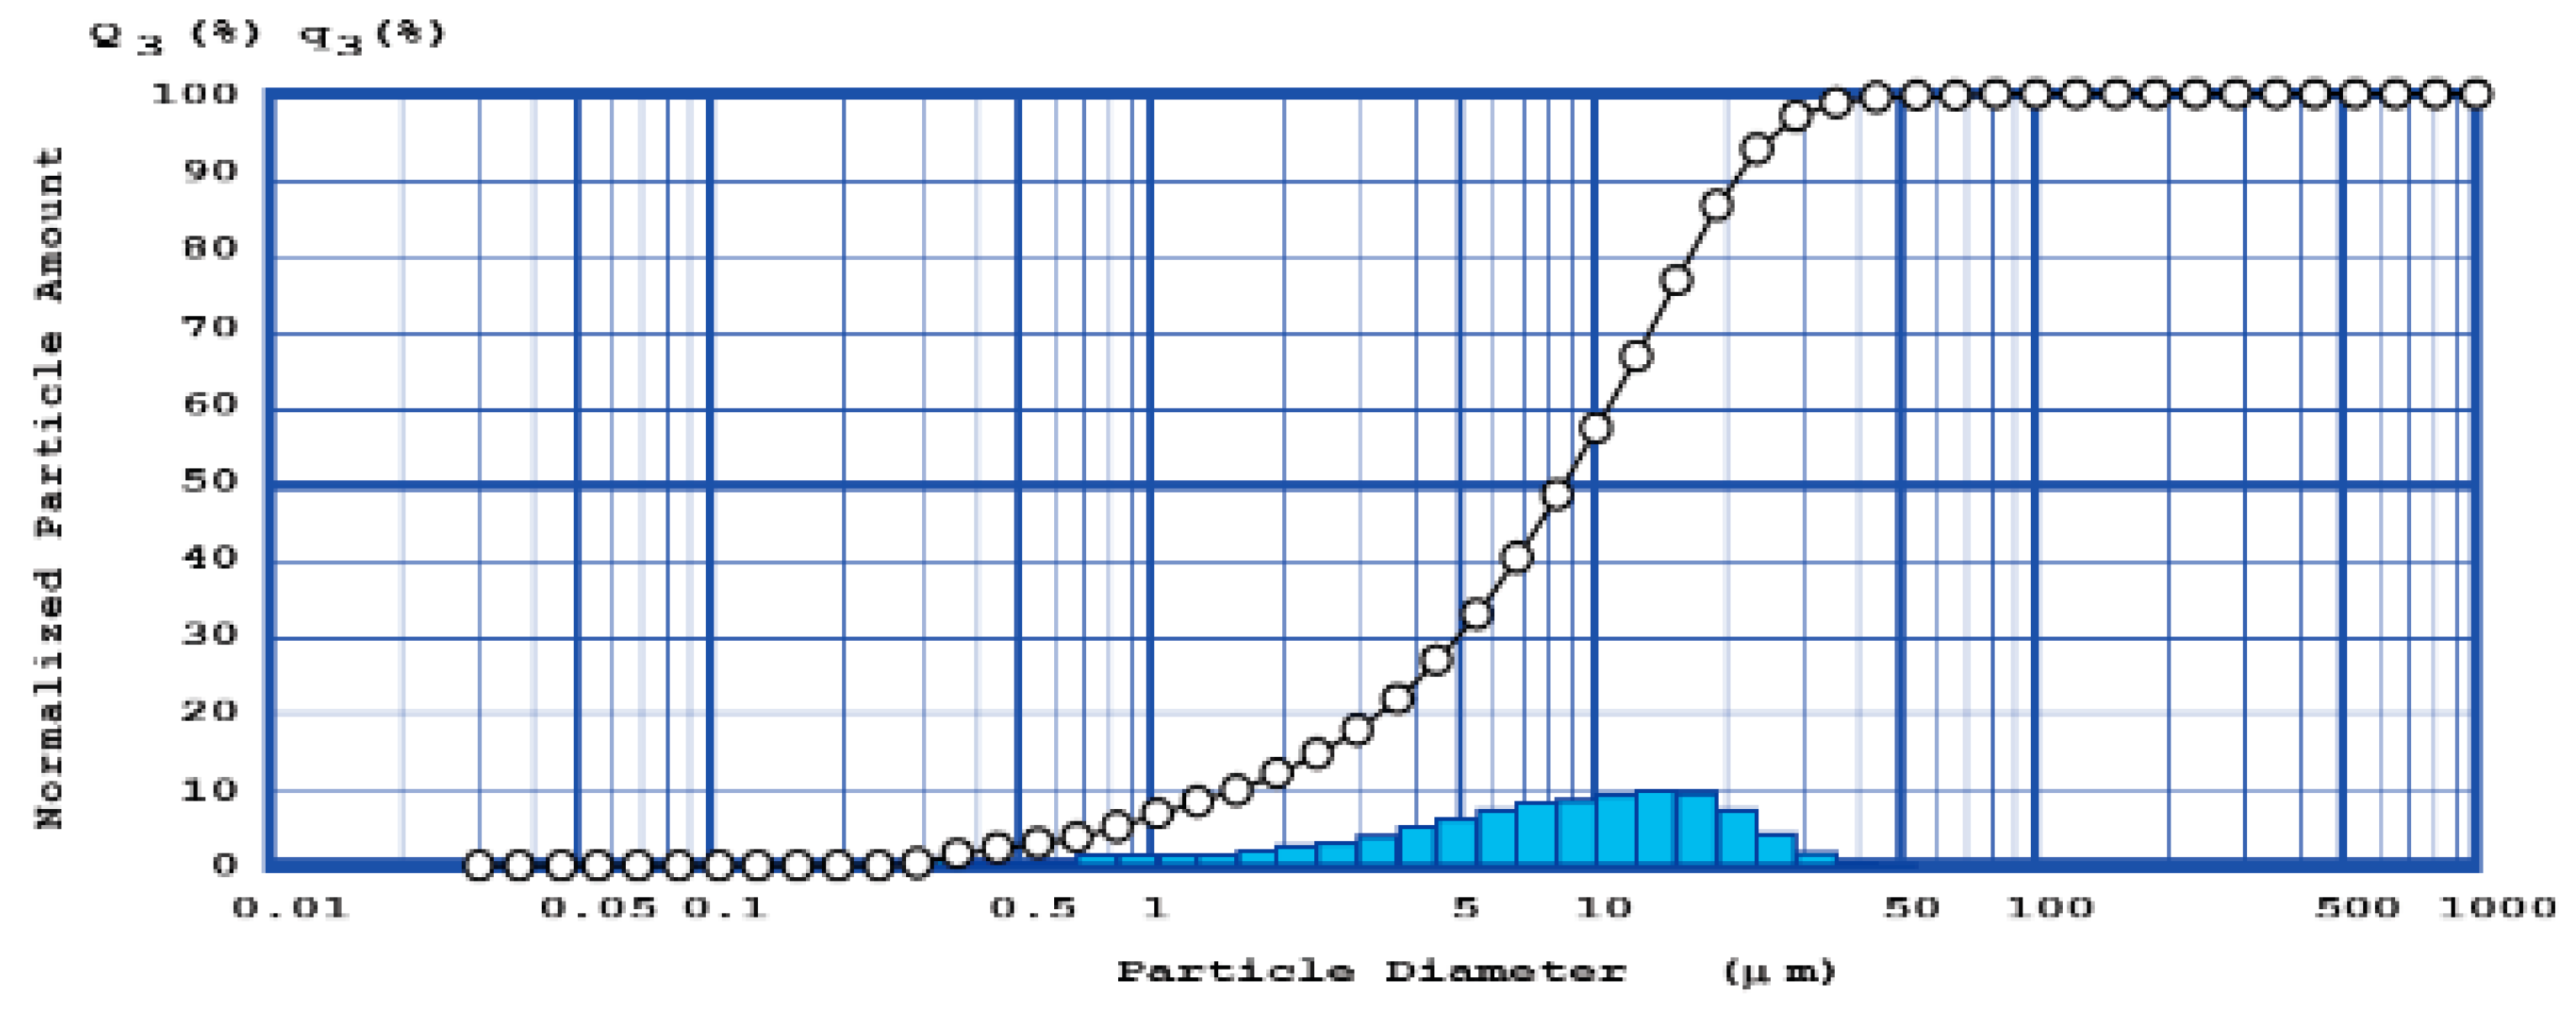
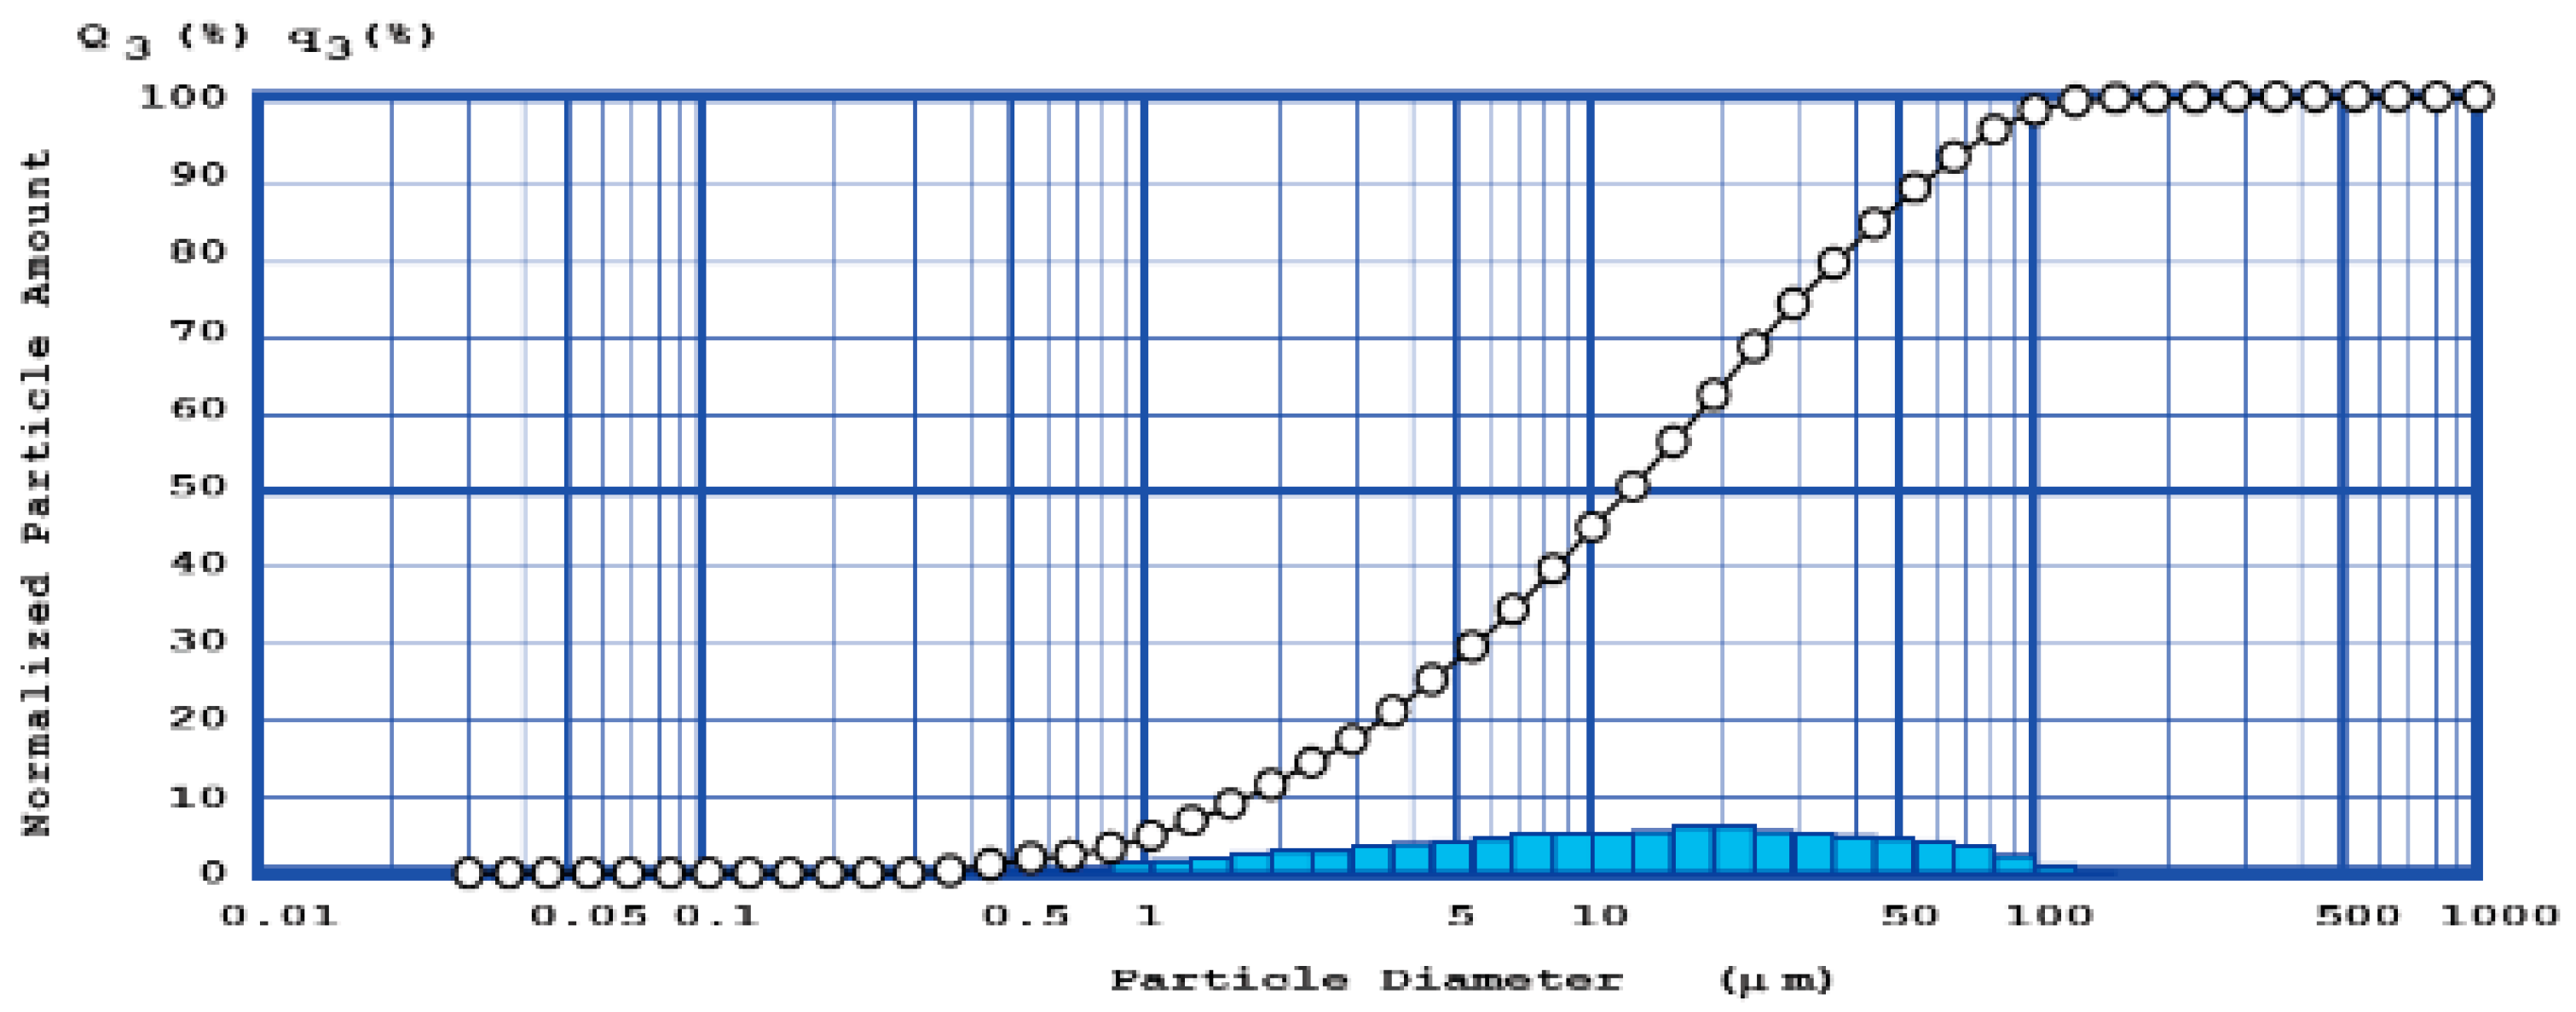
2.2. Granite Waste
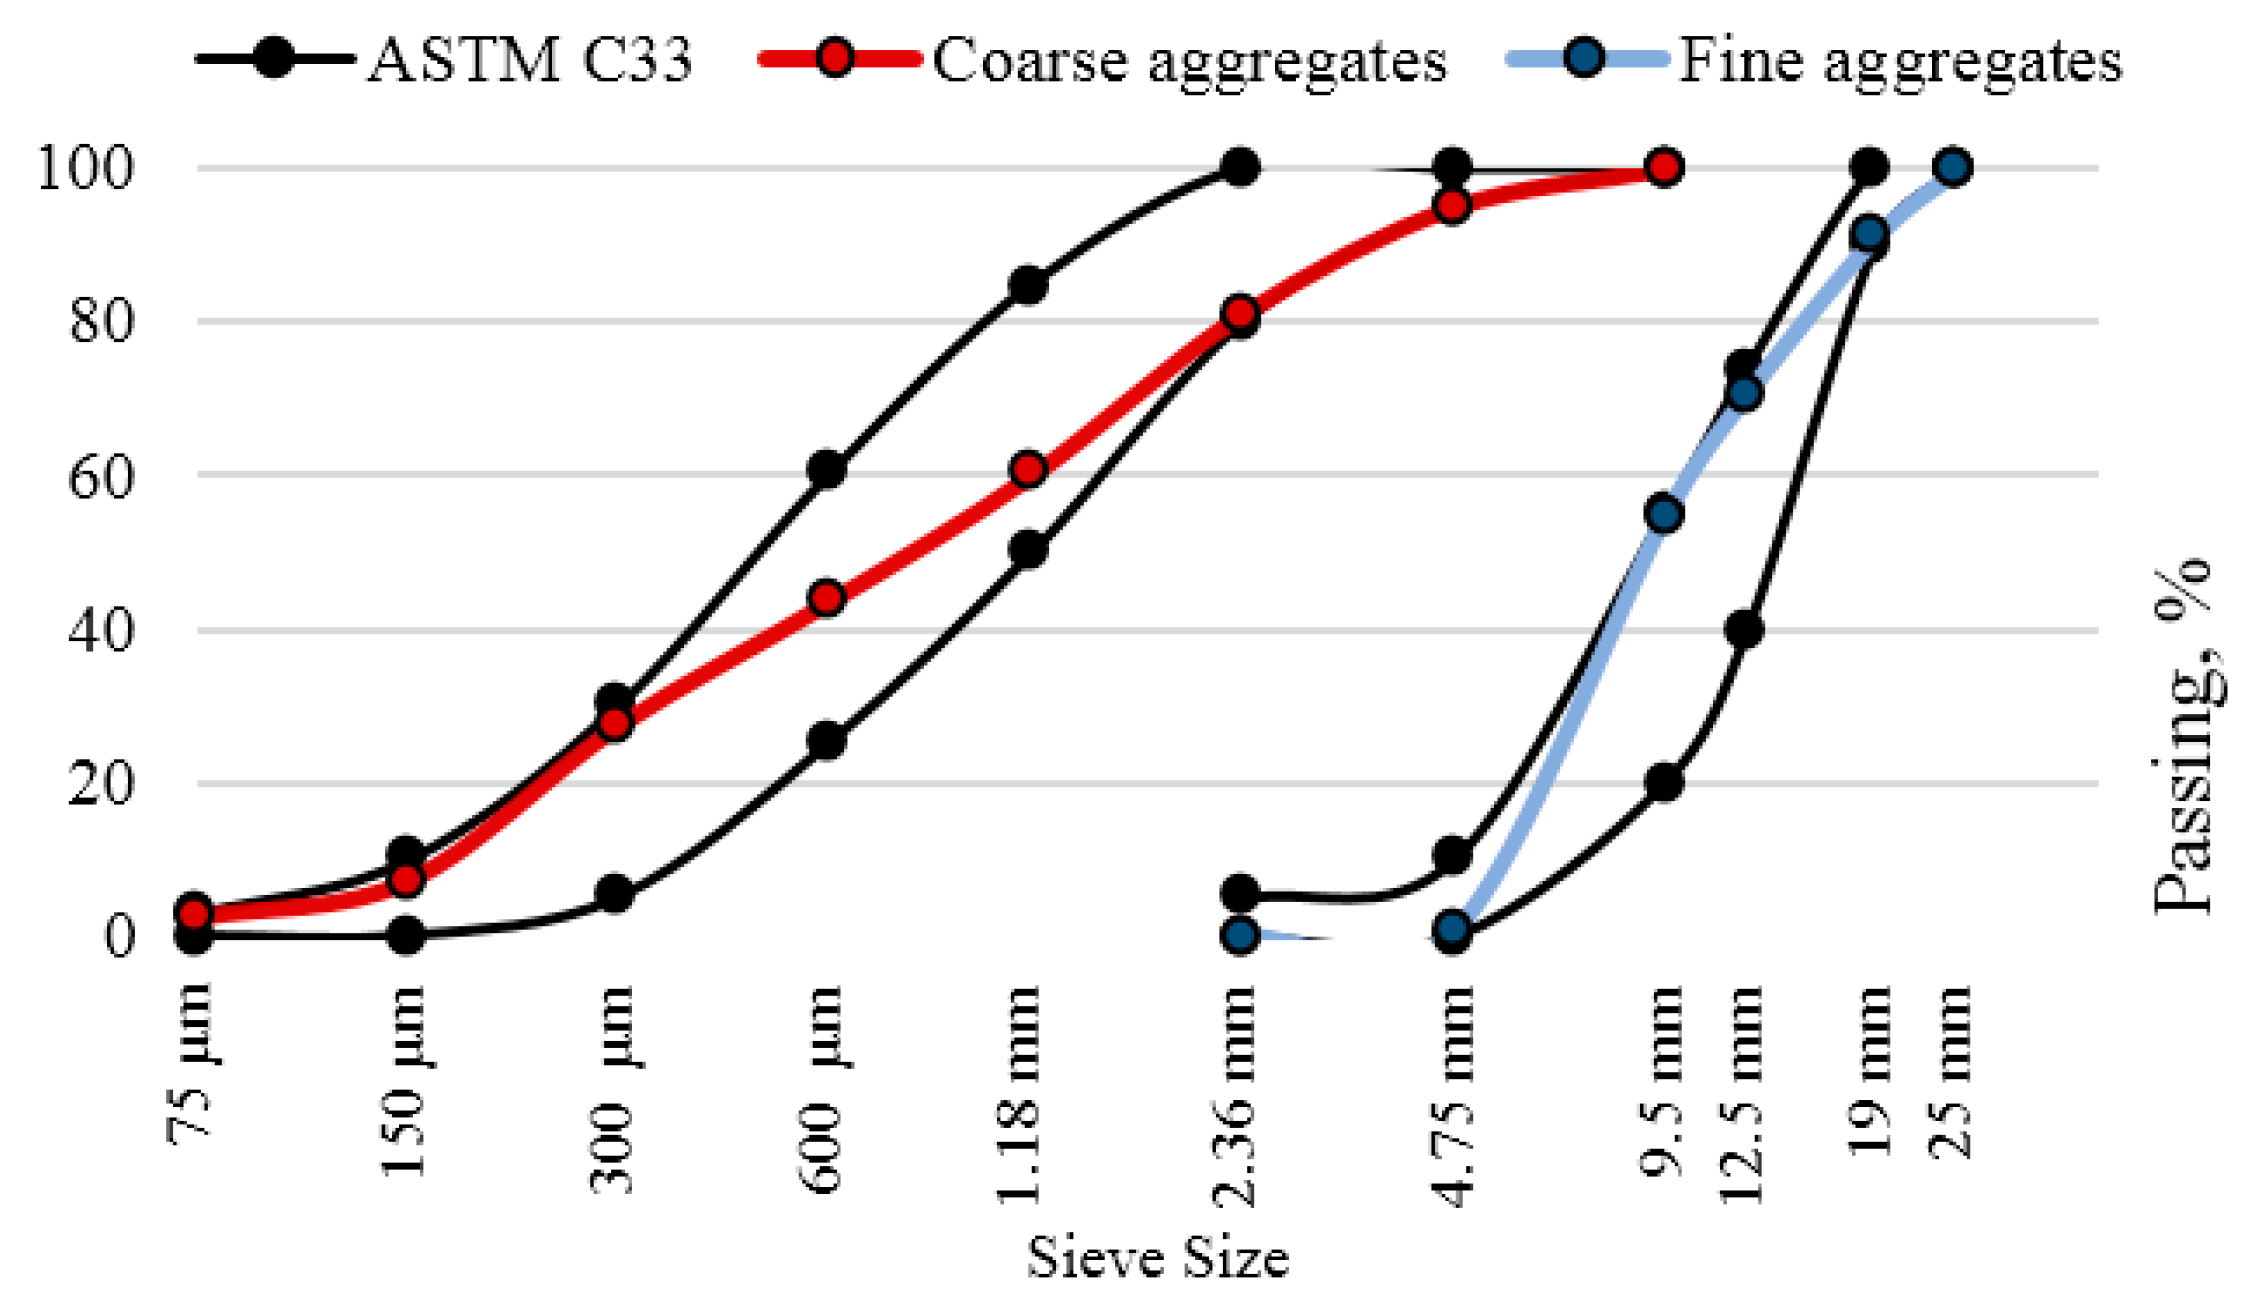
2.3. Aggregates
2.4. Superplasticizers and Water
3. Experimental Program
3.1. Slump Test
3.2. Density of Fresh Concrete
3.3. Compressive Strength and Splitting Tensile Strength Tests
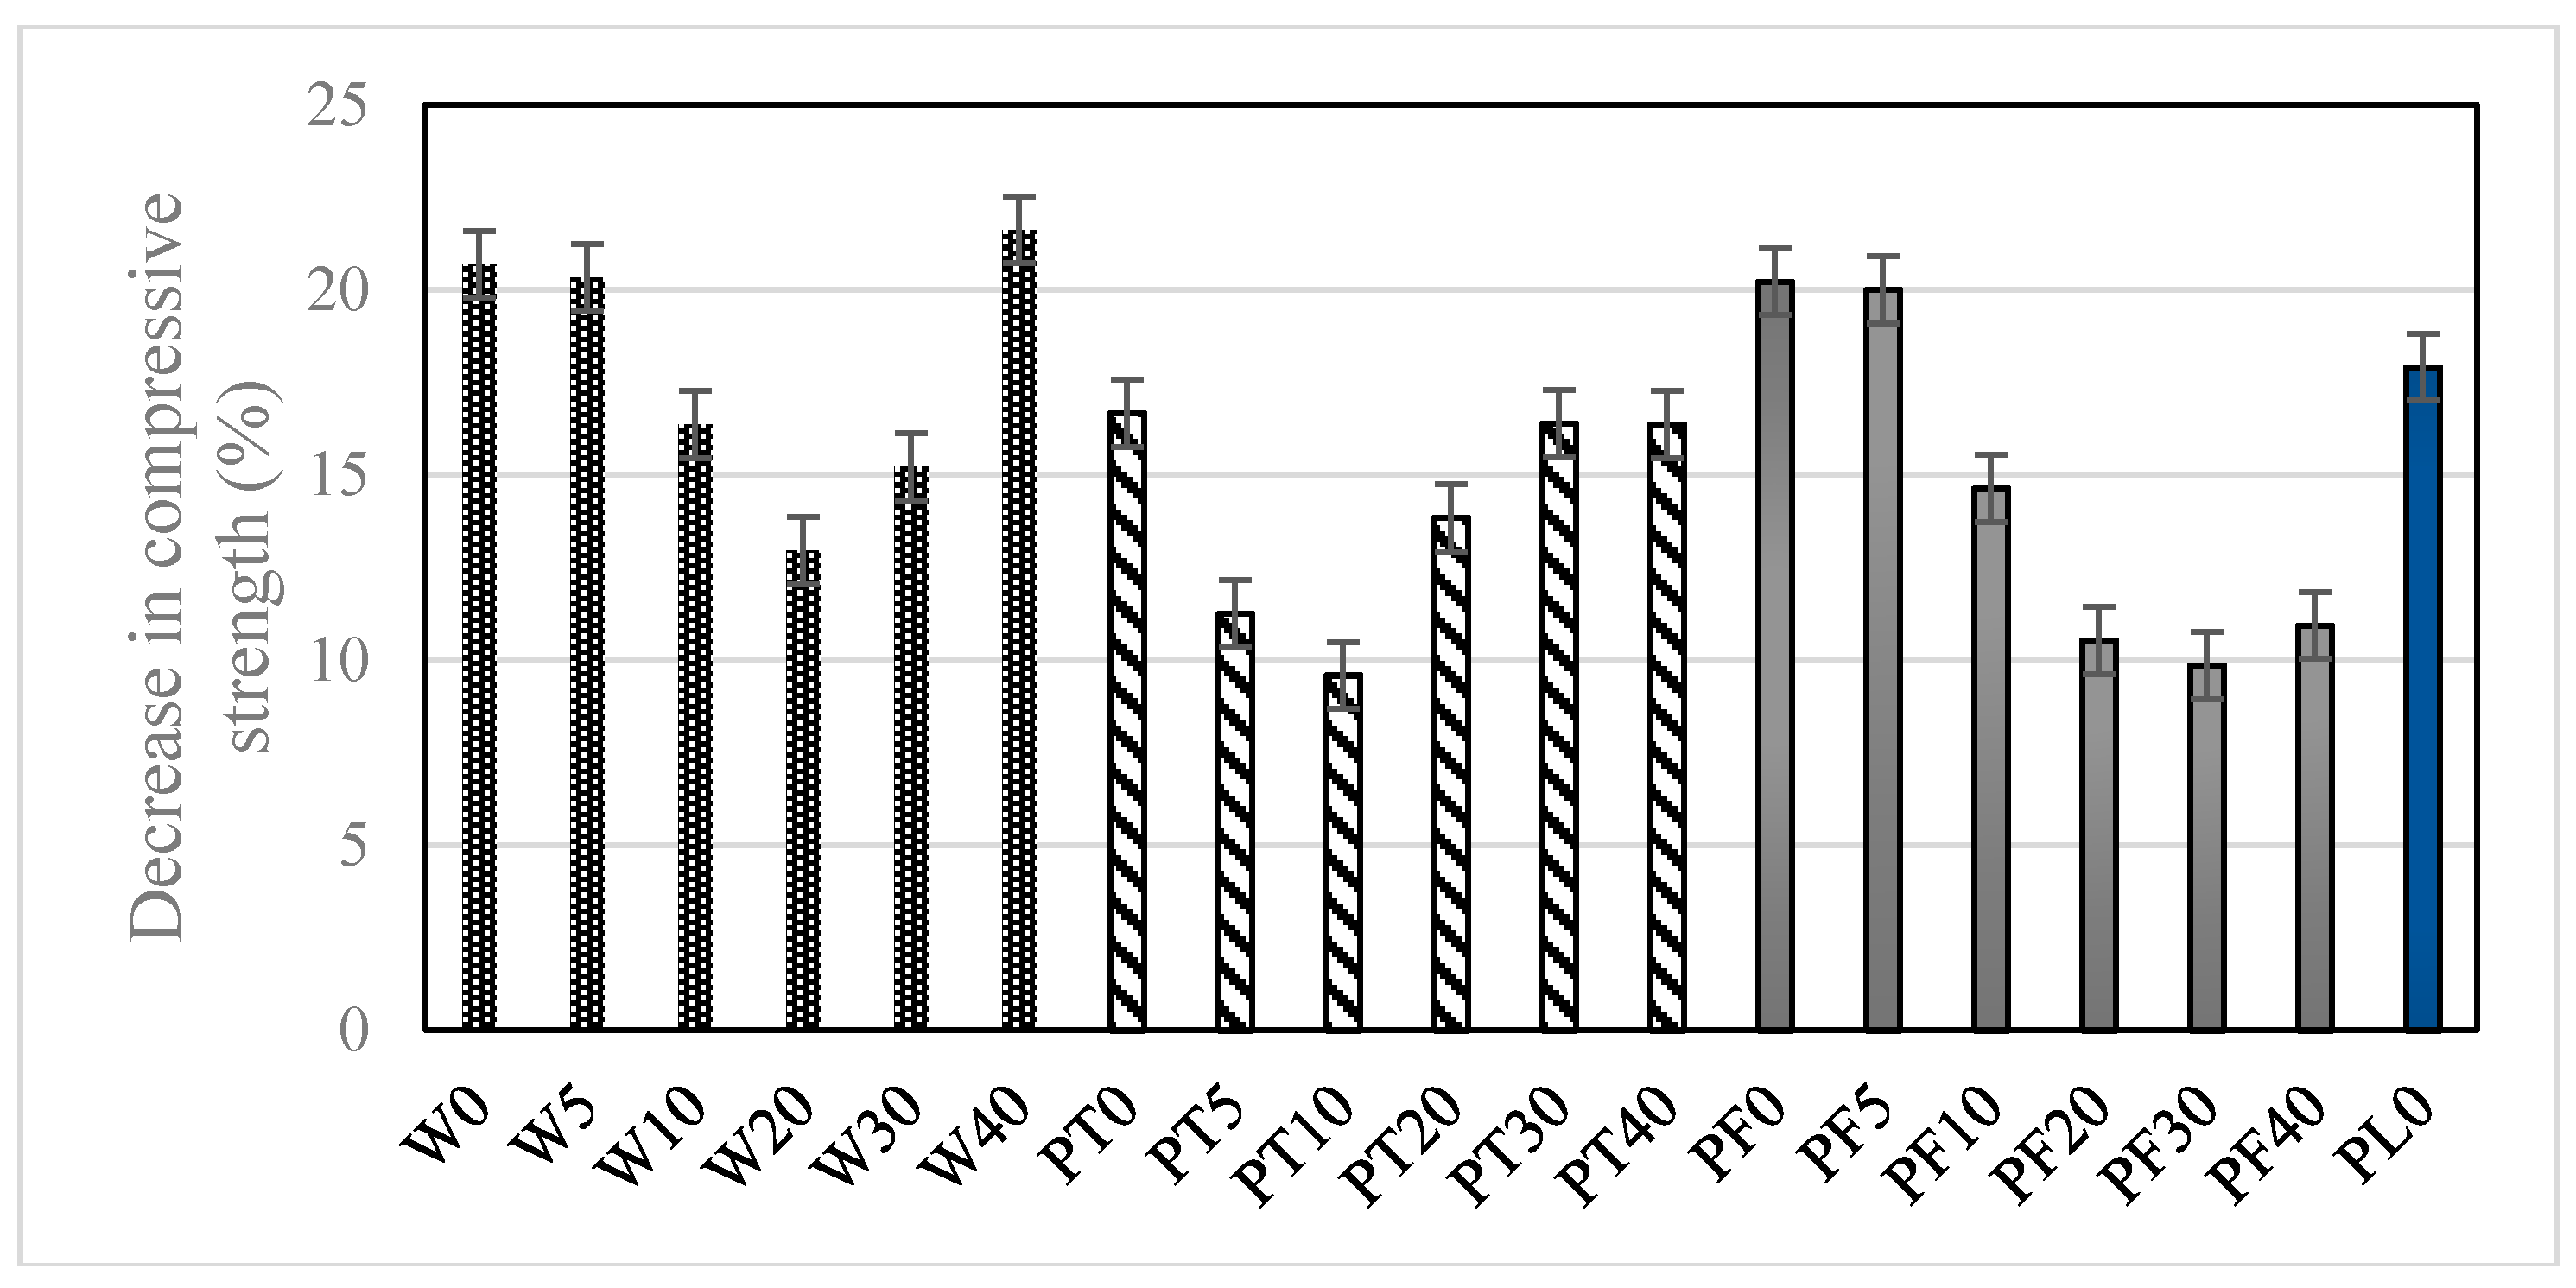
3.4. Sulphate Attack Resistance Test
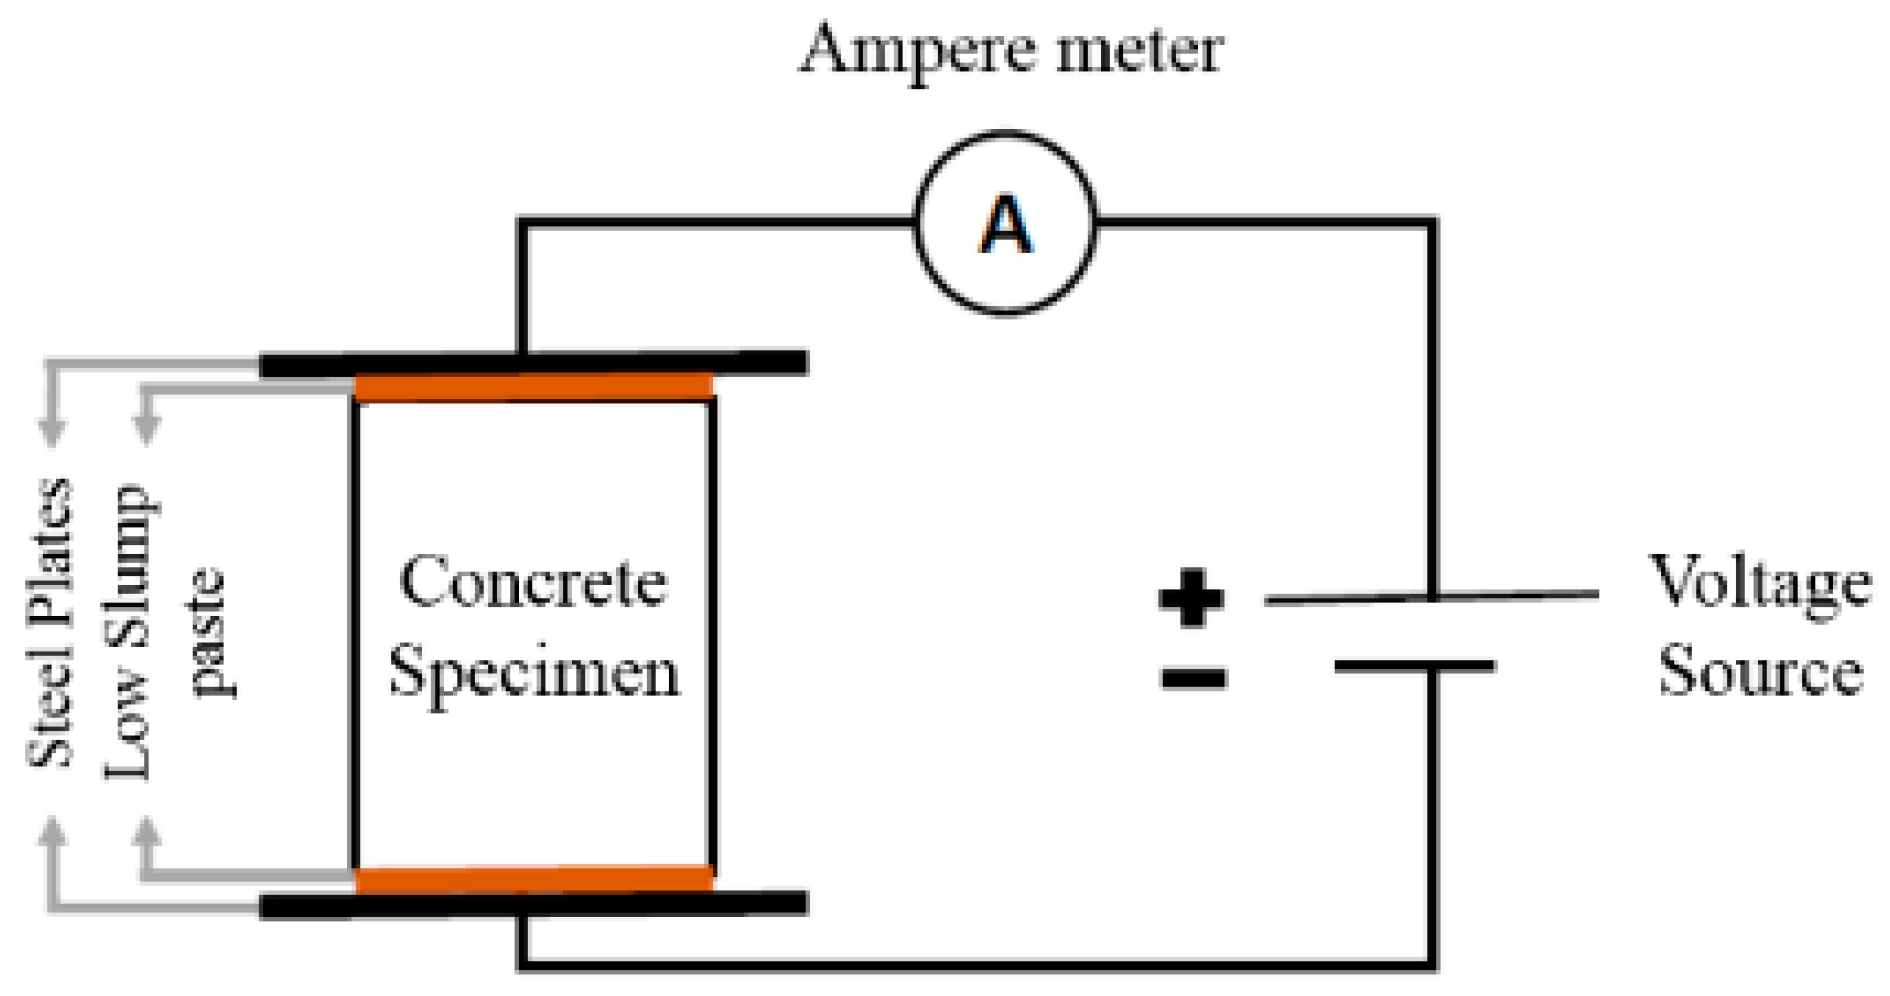
3.5. Electrical Resistivity (ER)
3.6. Consolidated Evaluation
3.6.1. Environmental Assessment
- High priority: CO2, resource (water), water quality;
- Medium priority: secondary raw materials, recycling/waste minimization;
- Low priority: resource (energy).
3.6.2. Economic Assessment of Concrete Mixes
3.6.3. Correction Coefficient
3.6.4. Consolidated Index
4. Results and Discussion
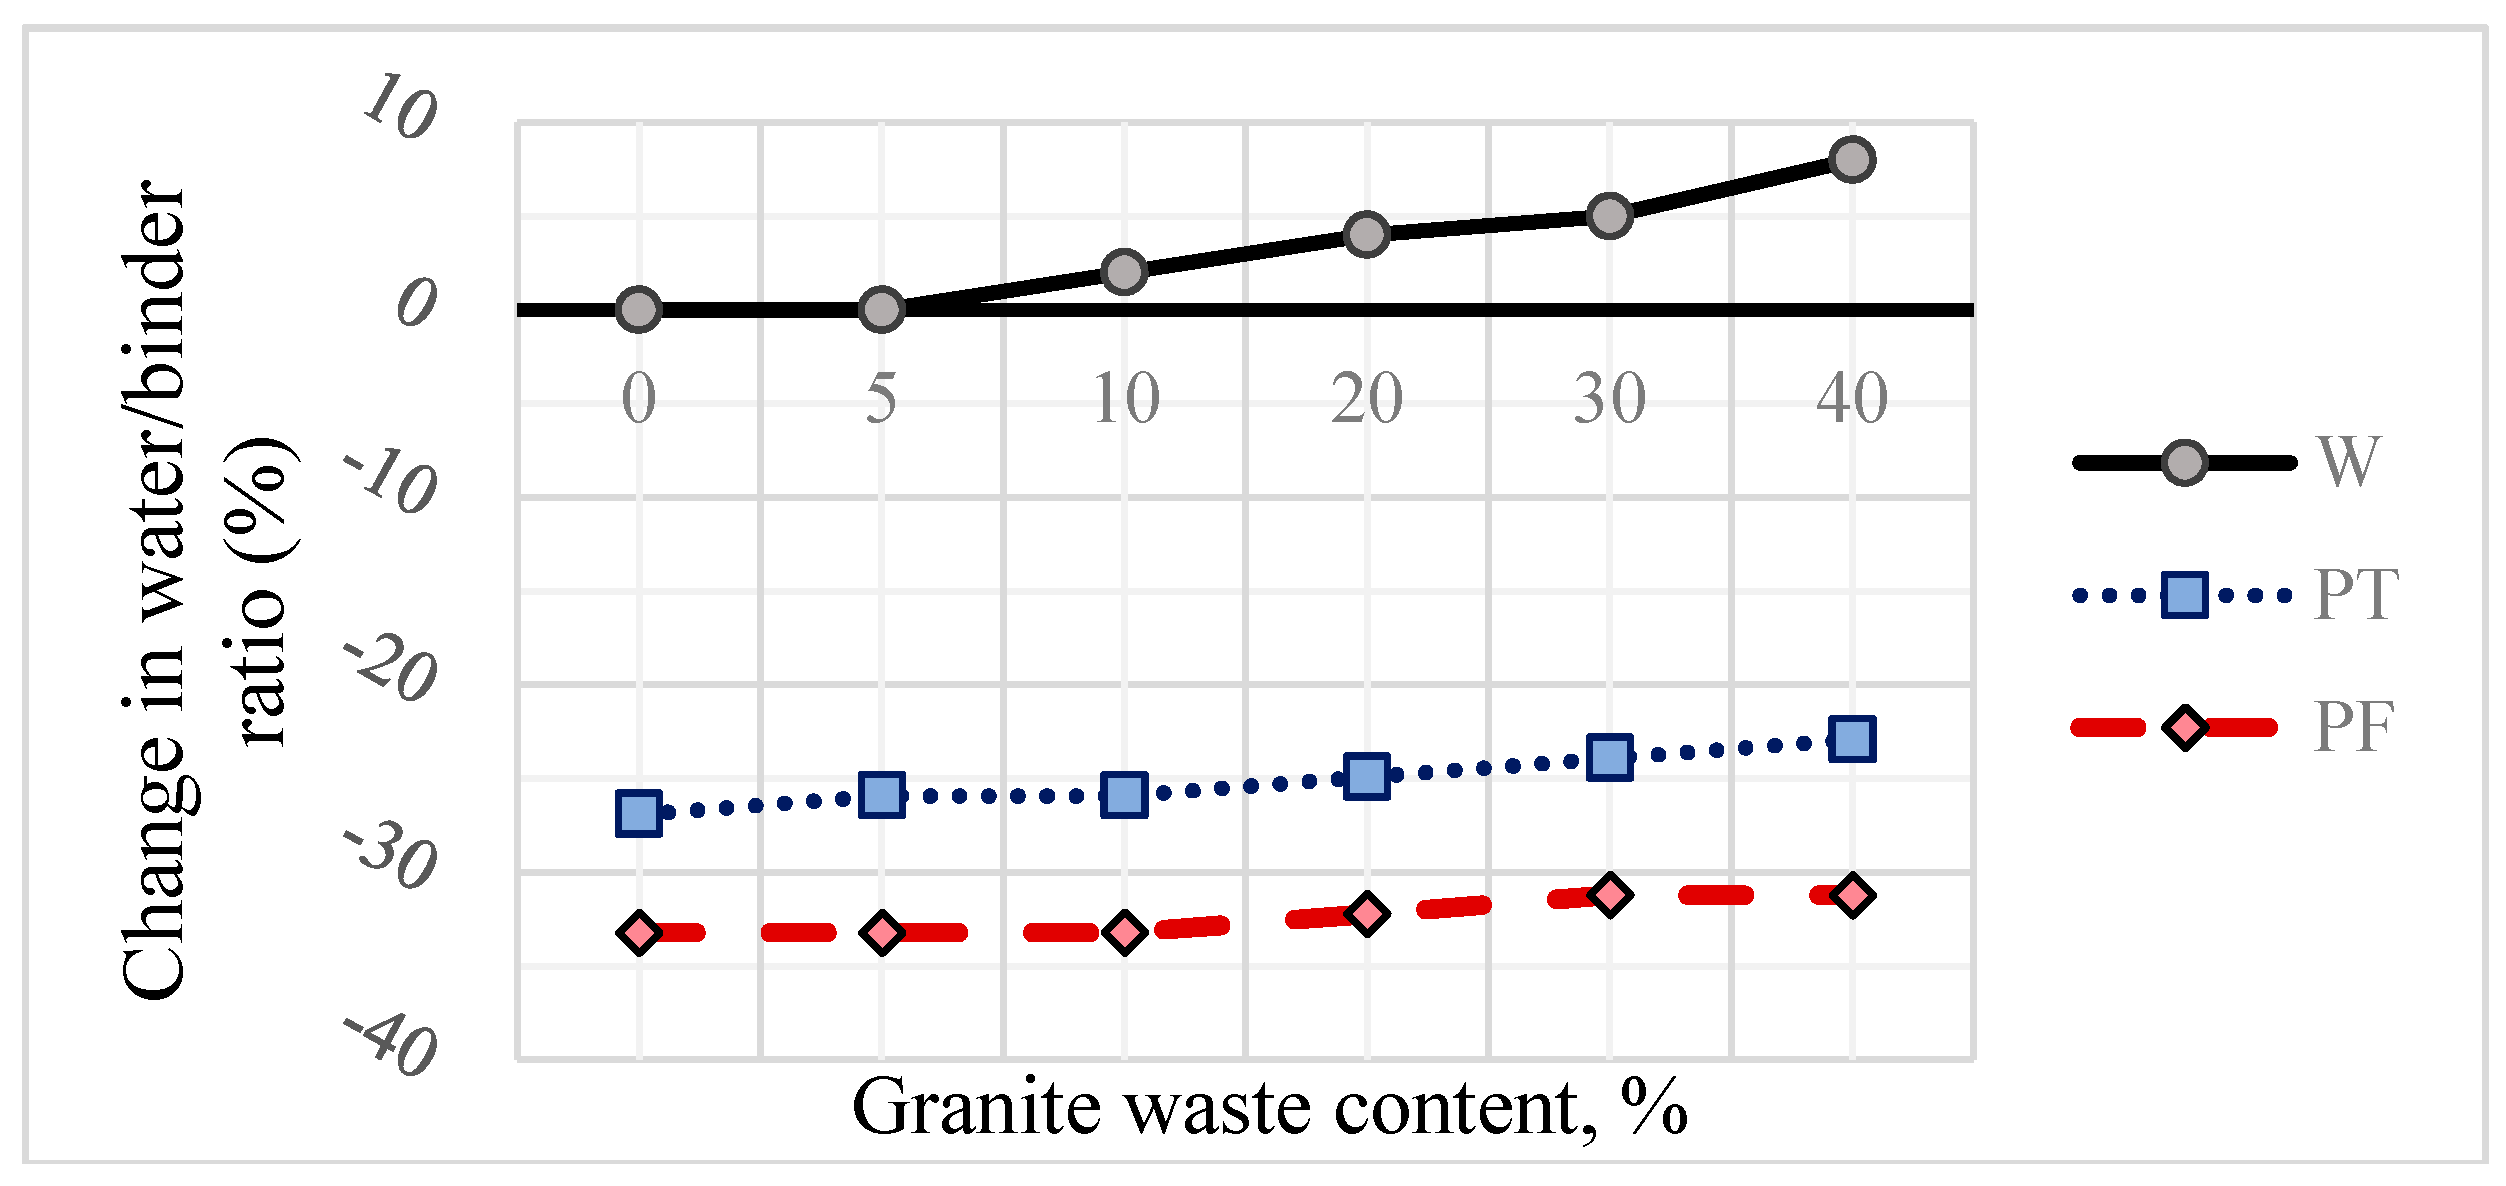
4.1. Effect of Superplasticizer and WGP on Slump
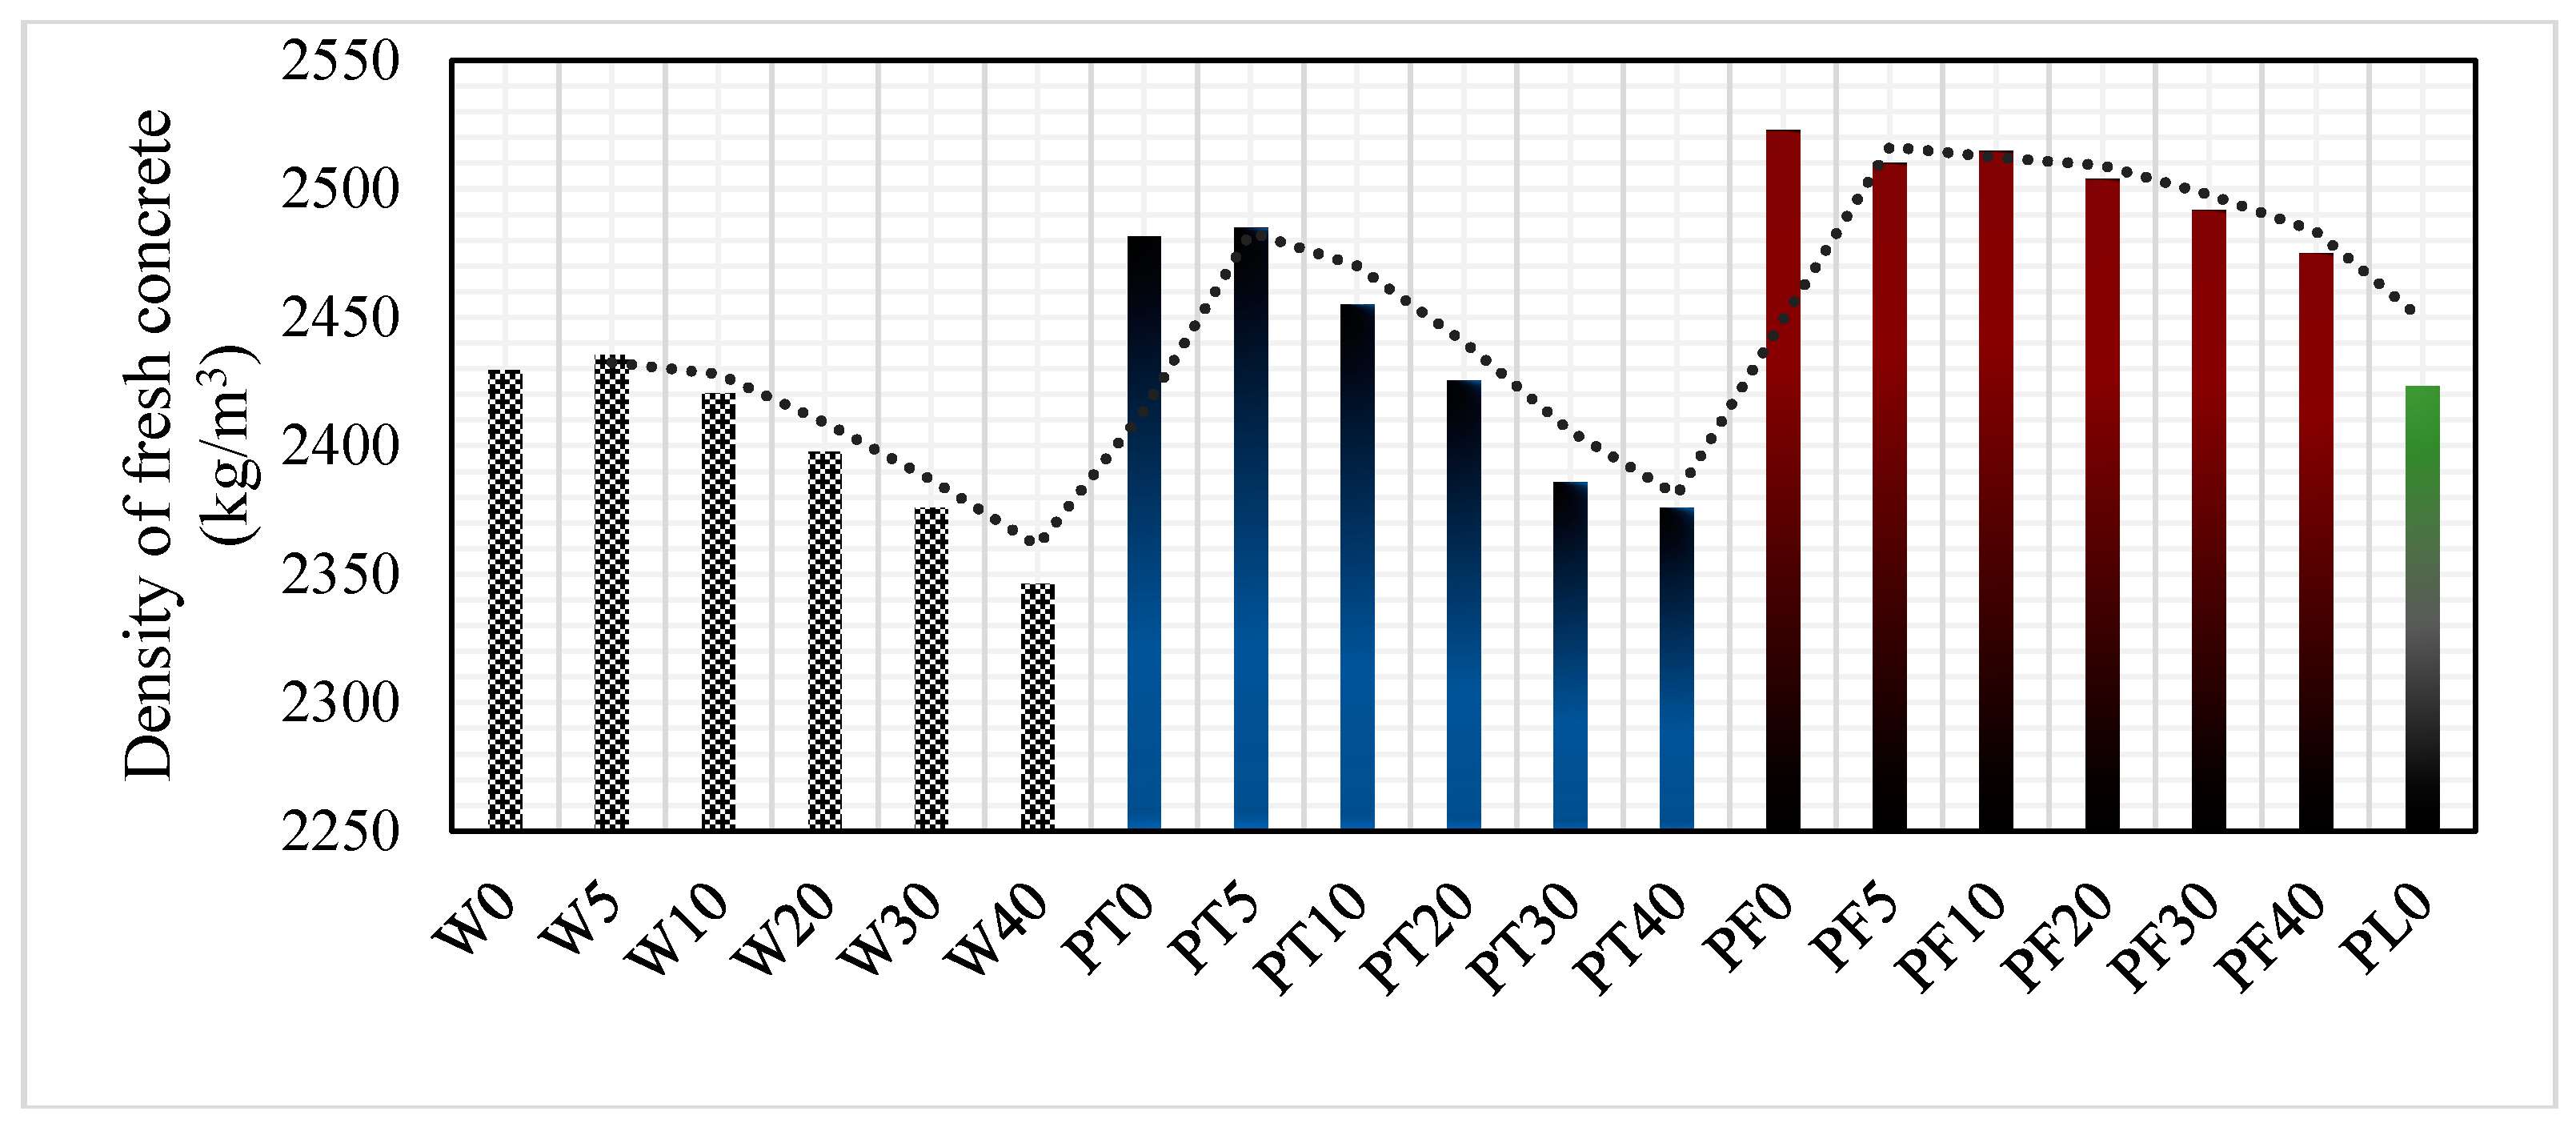
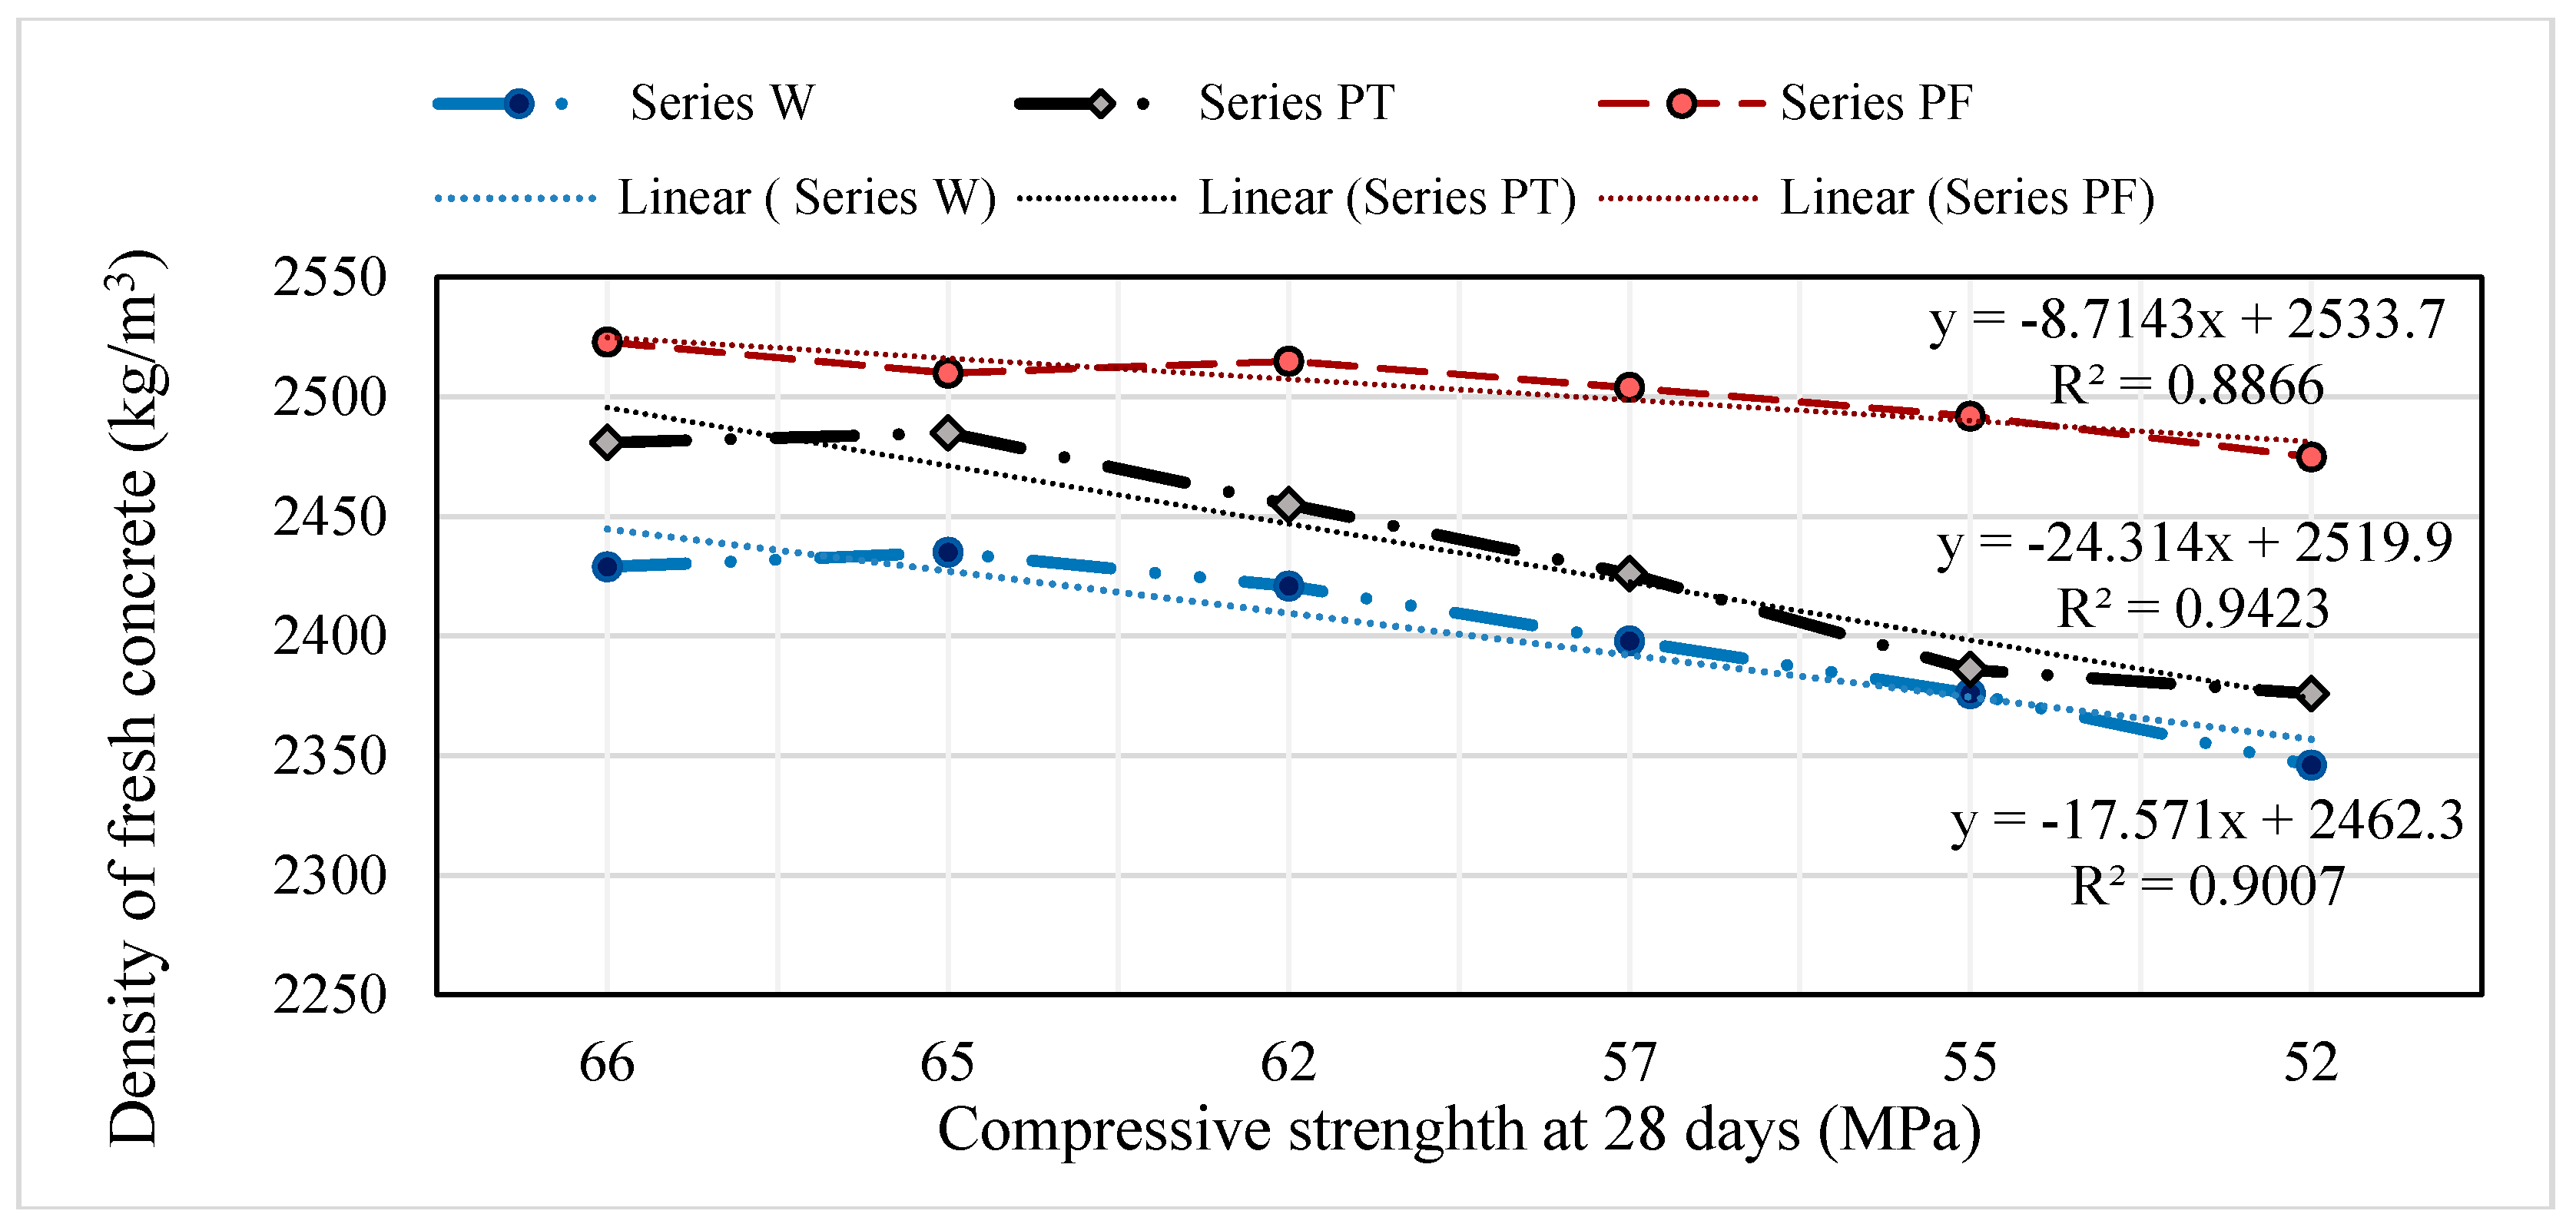
4.2. Density of Fresh Concrete
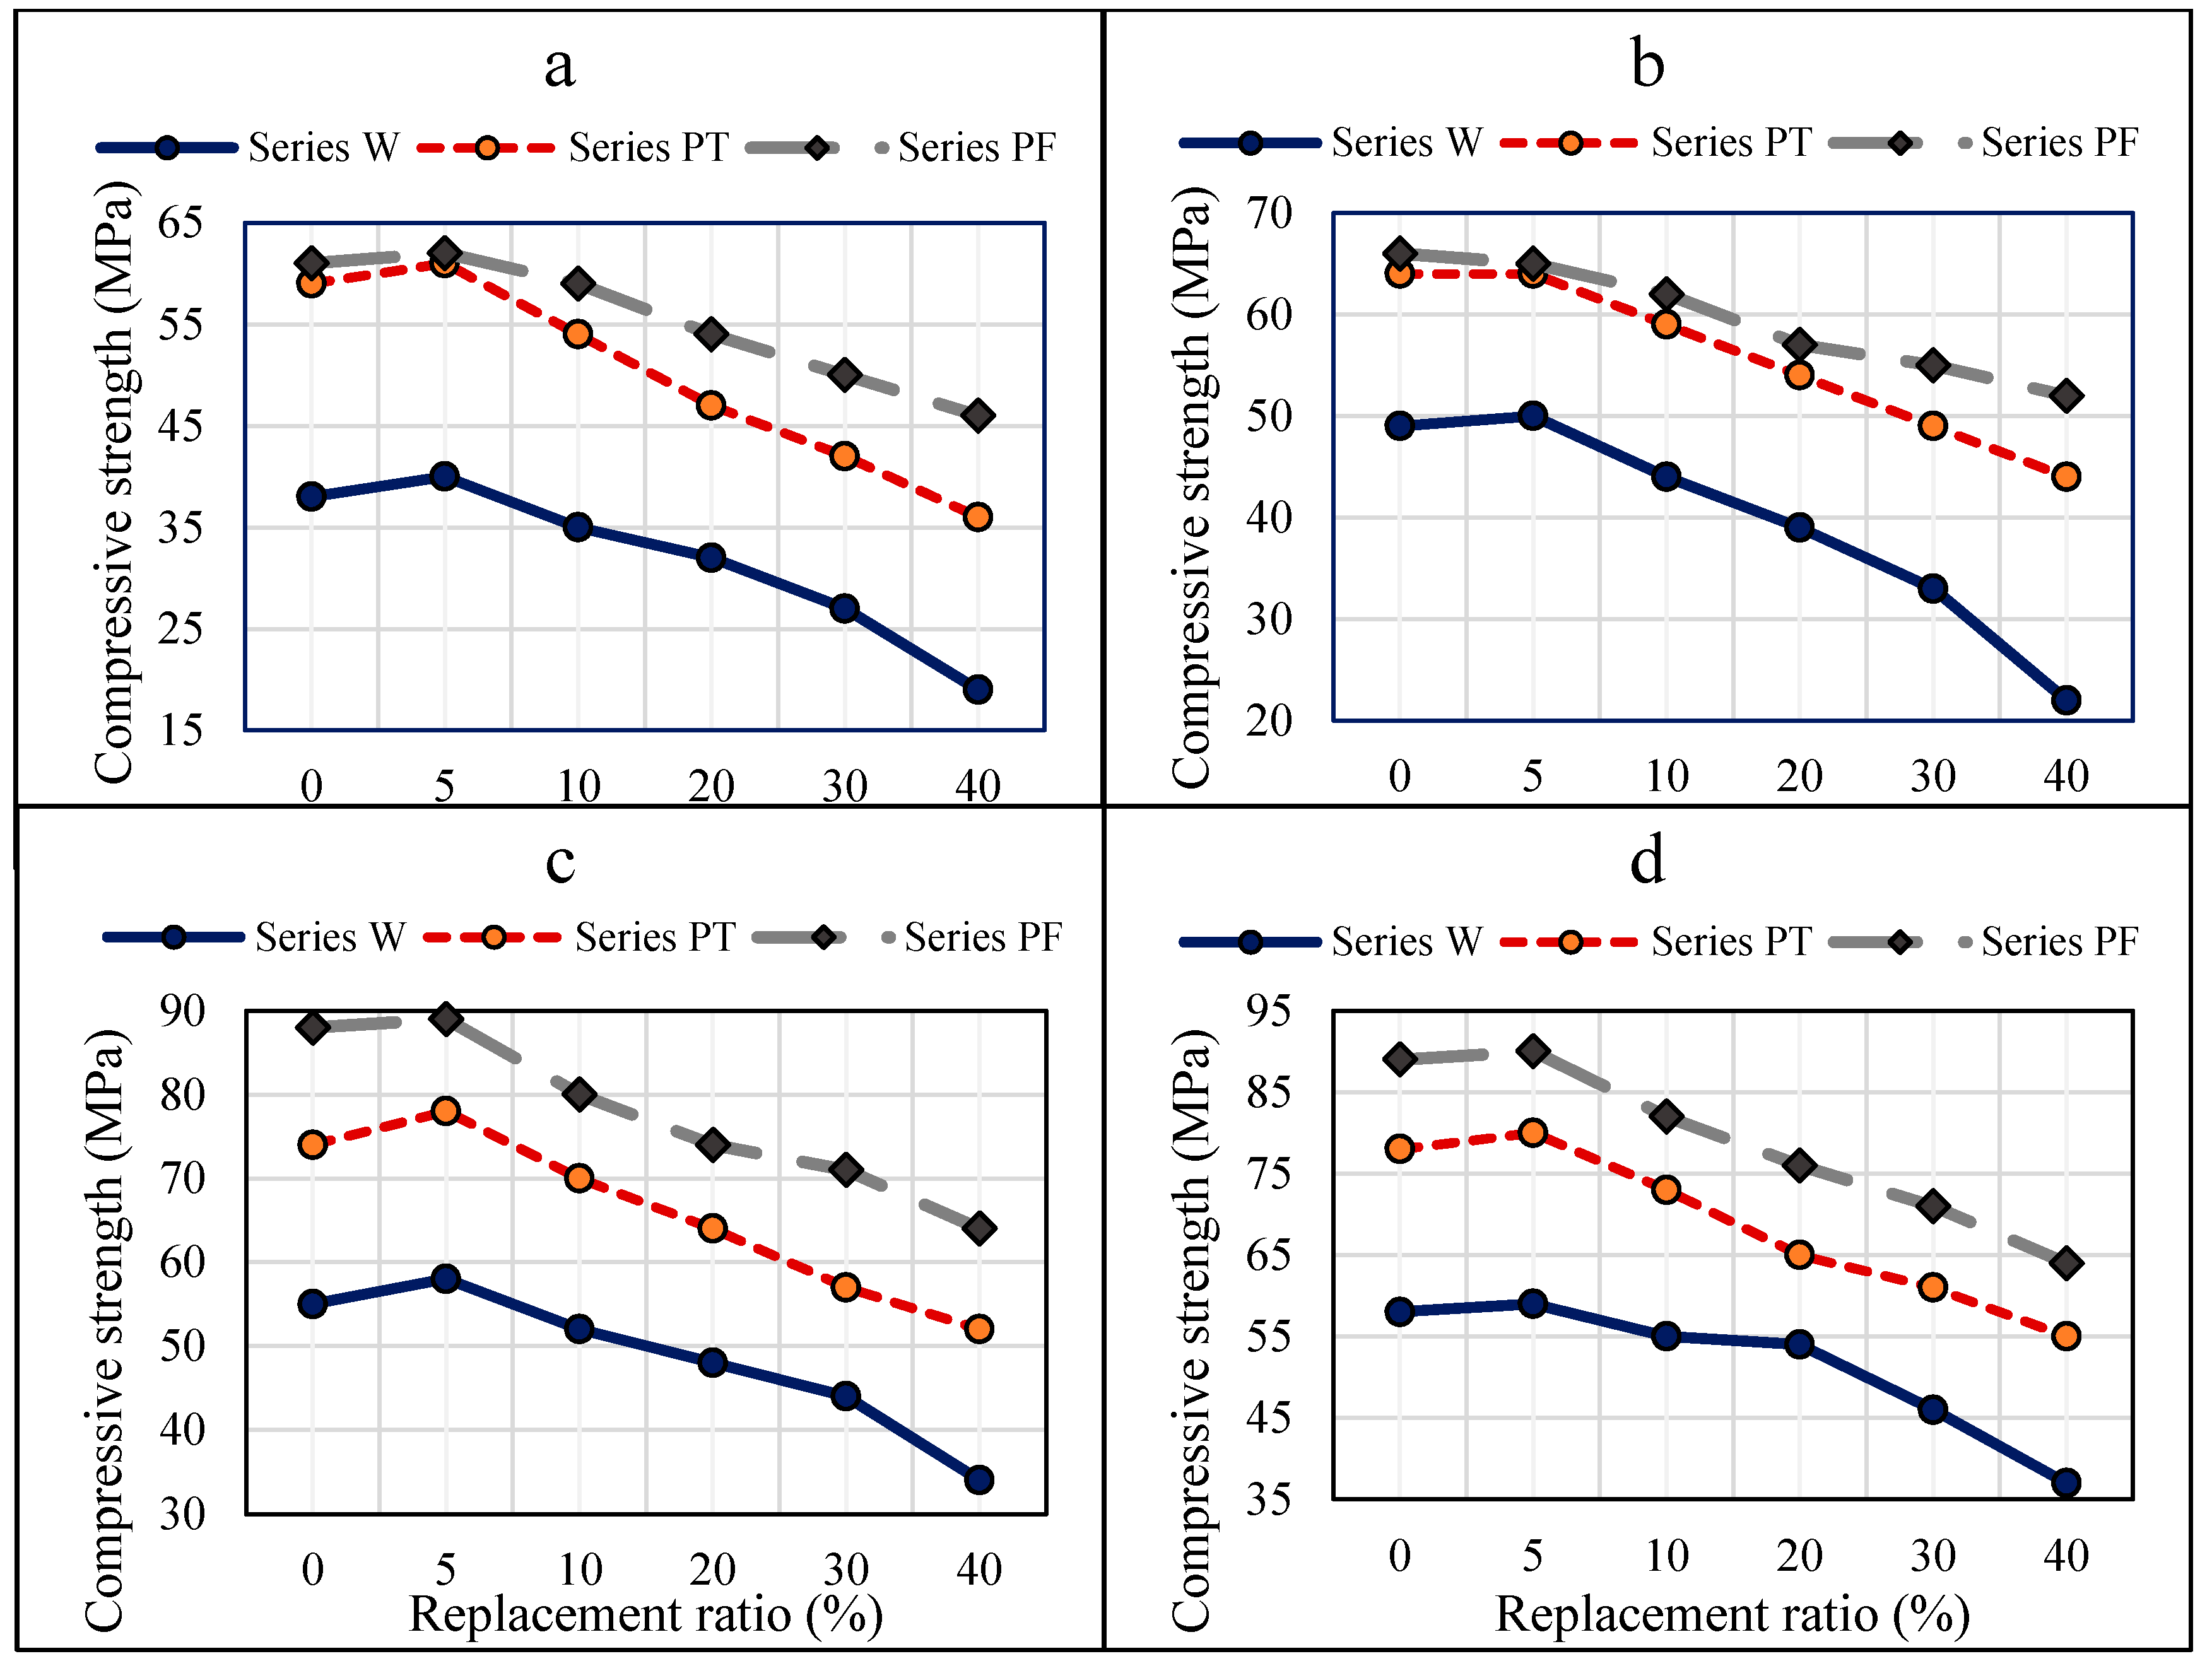
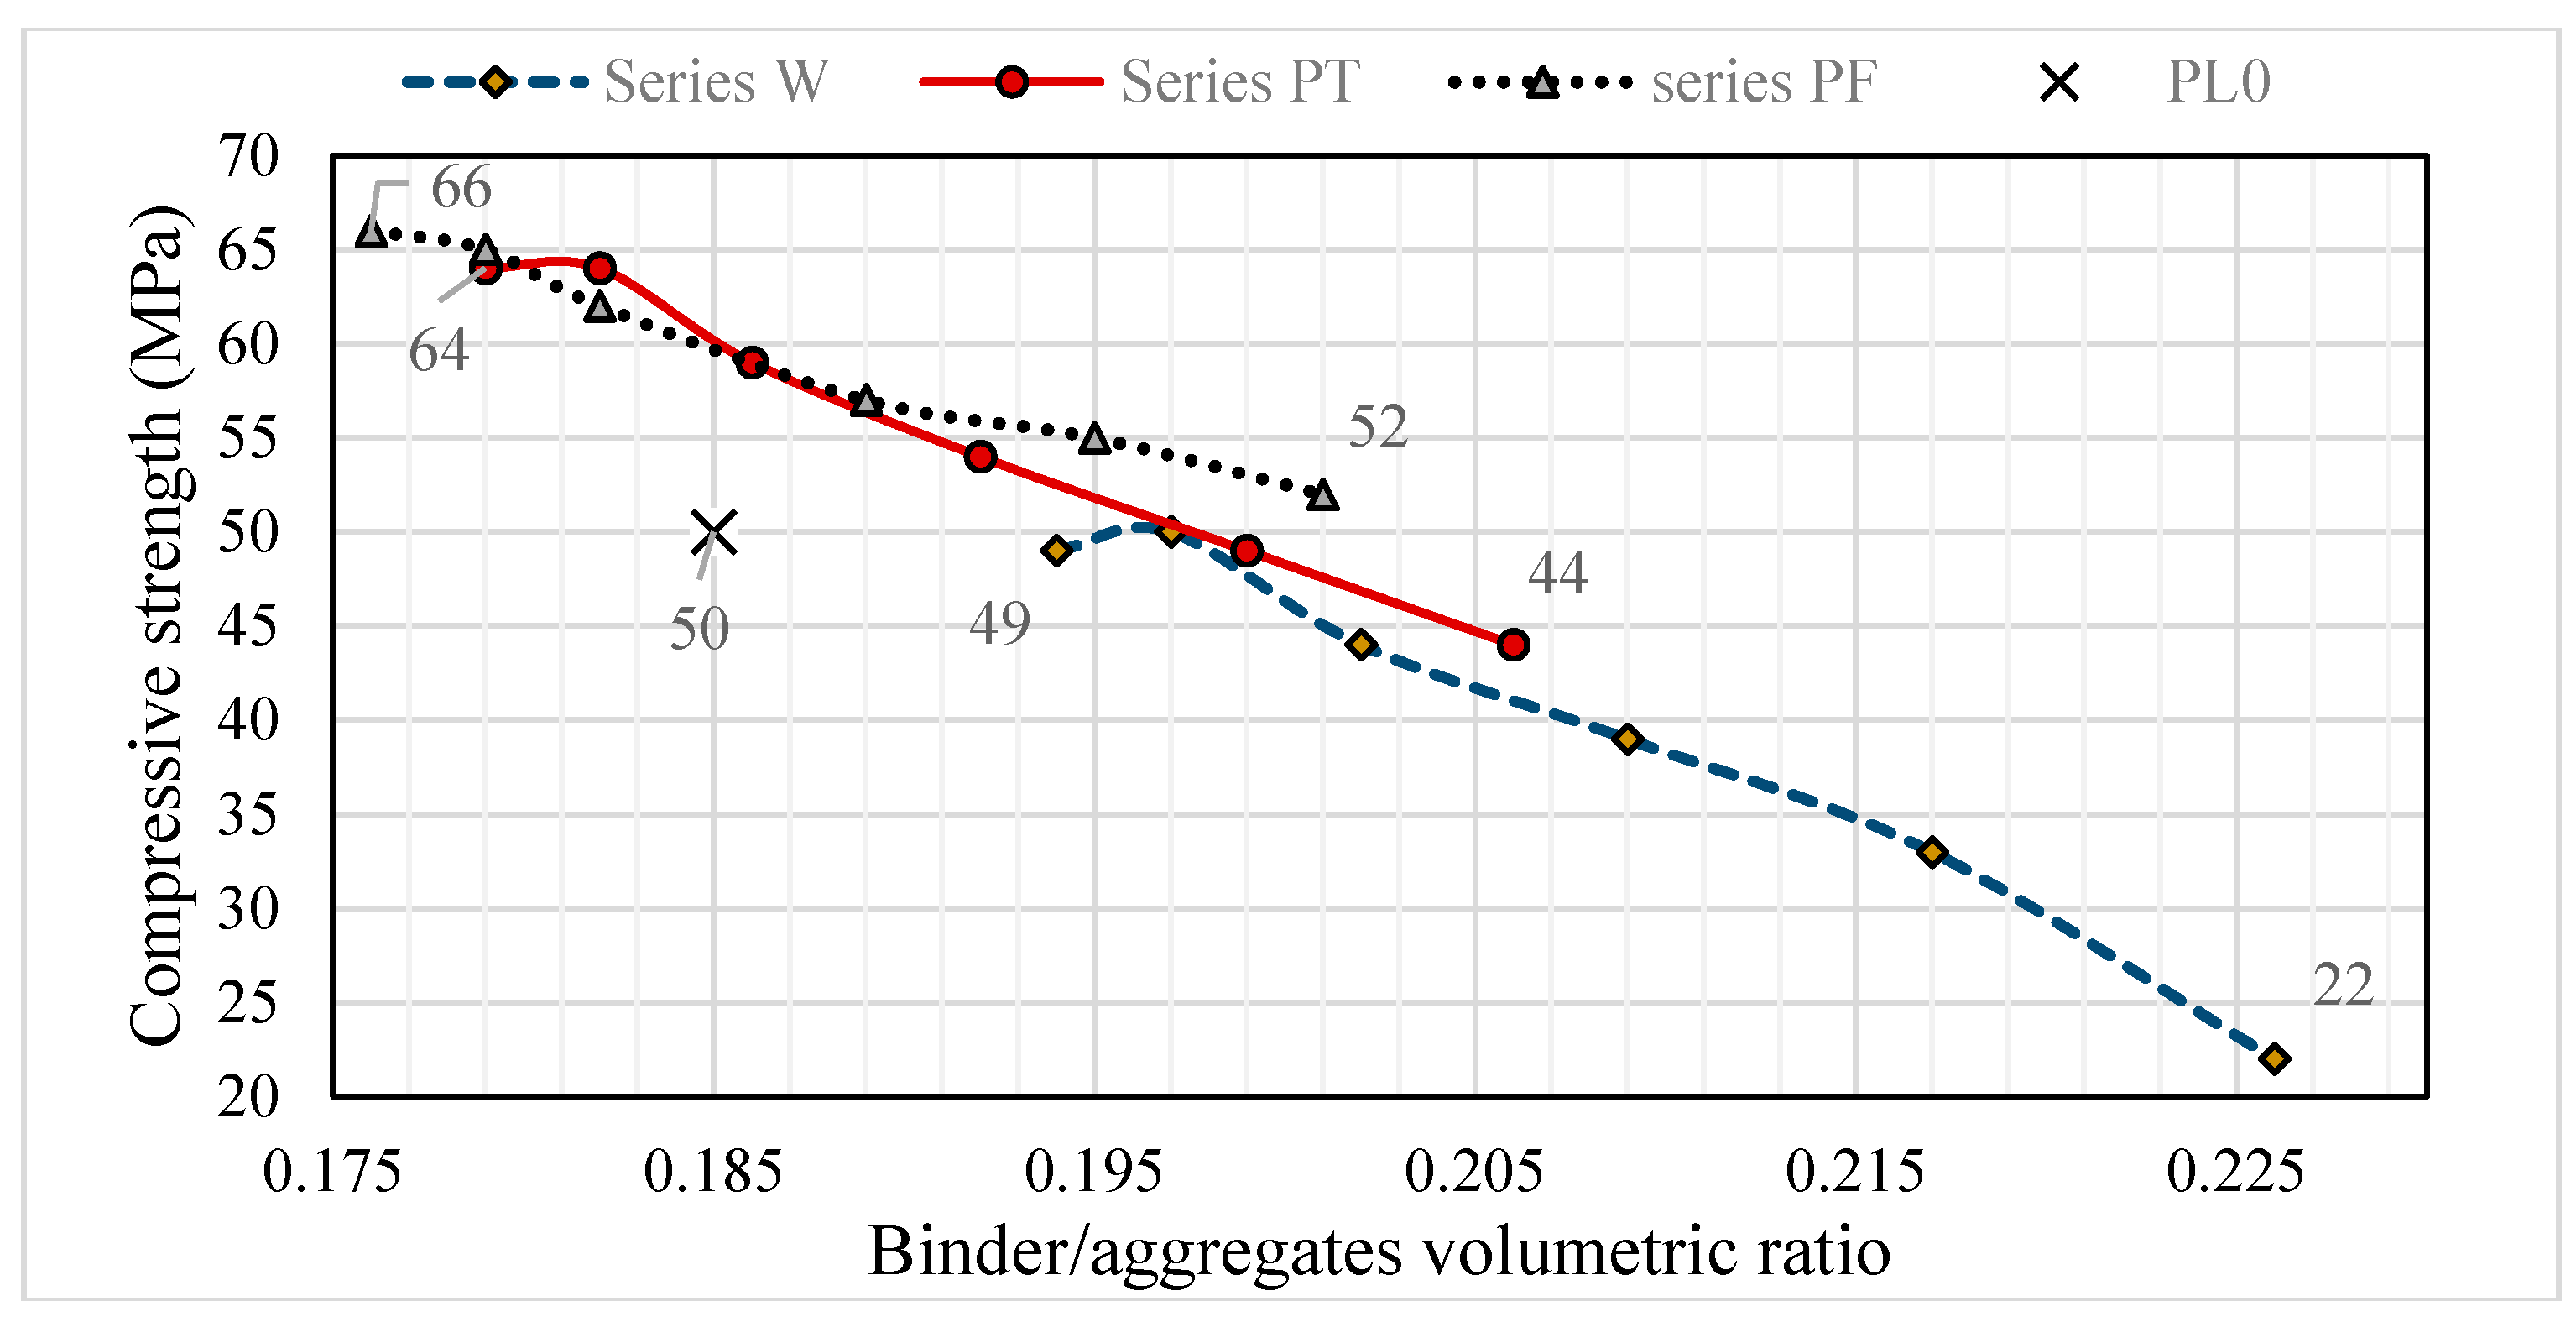
4.3. Compressive Strength
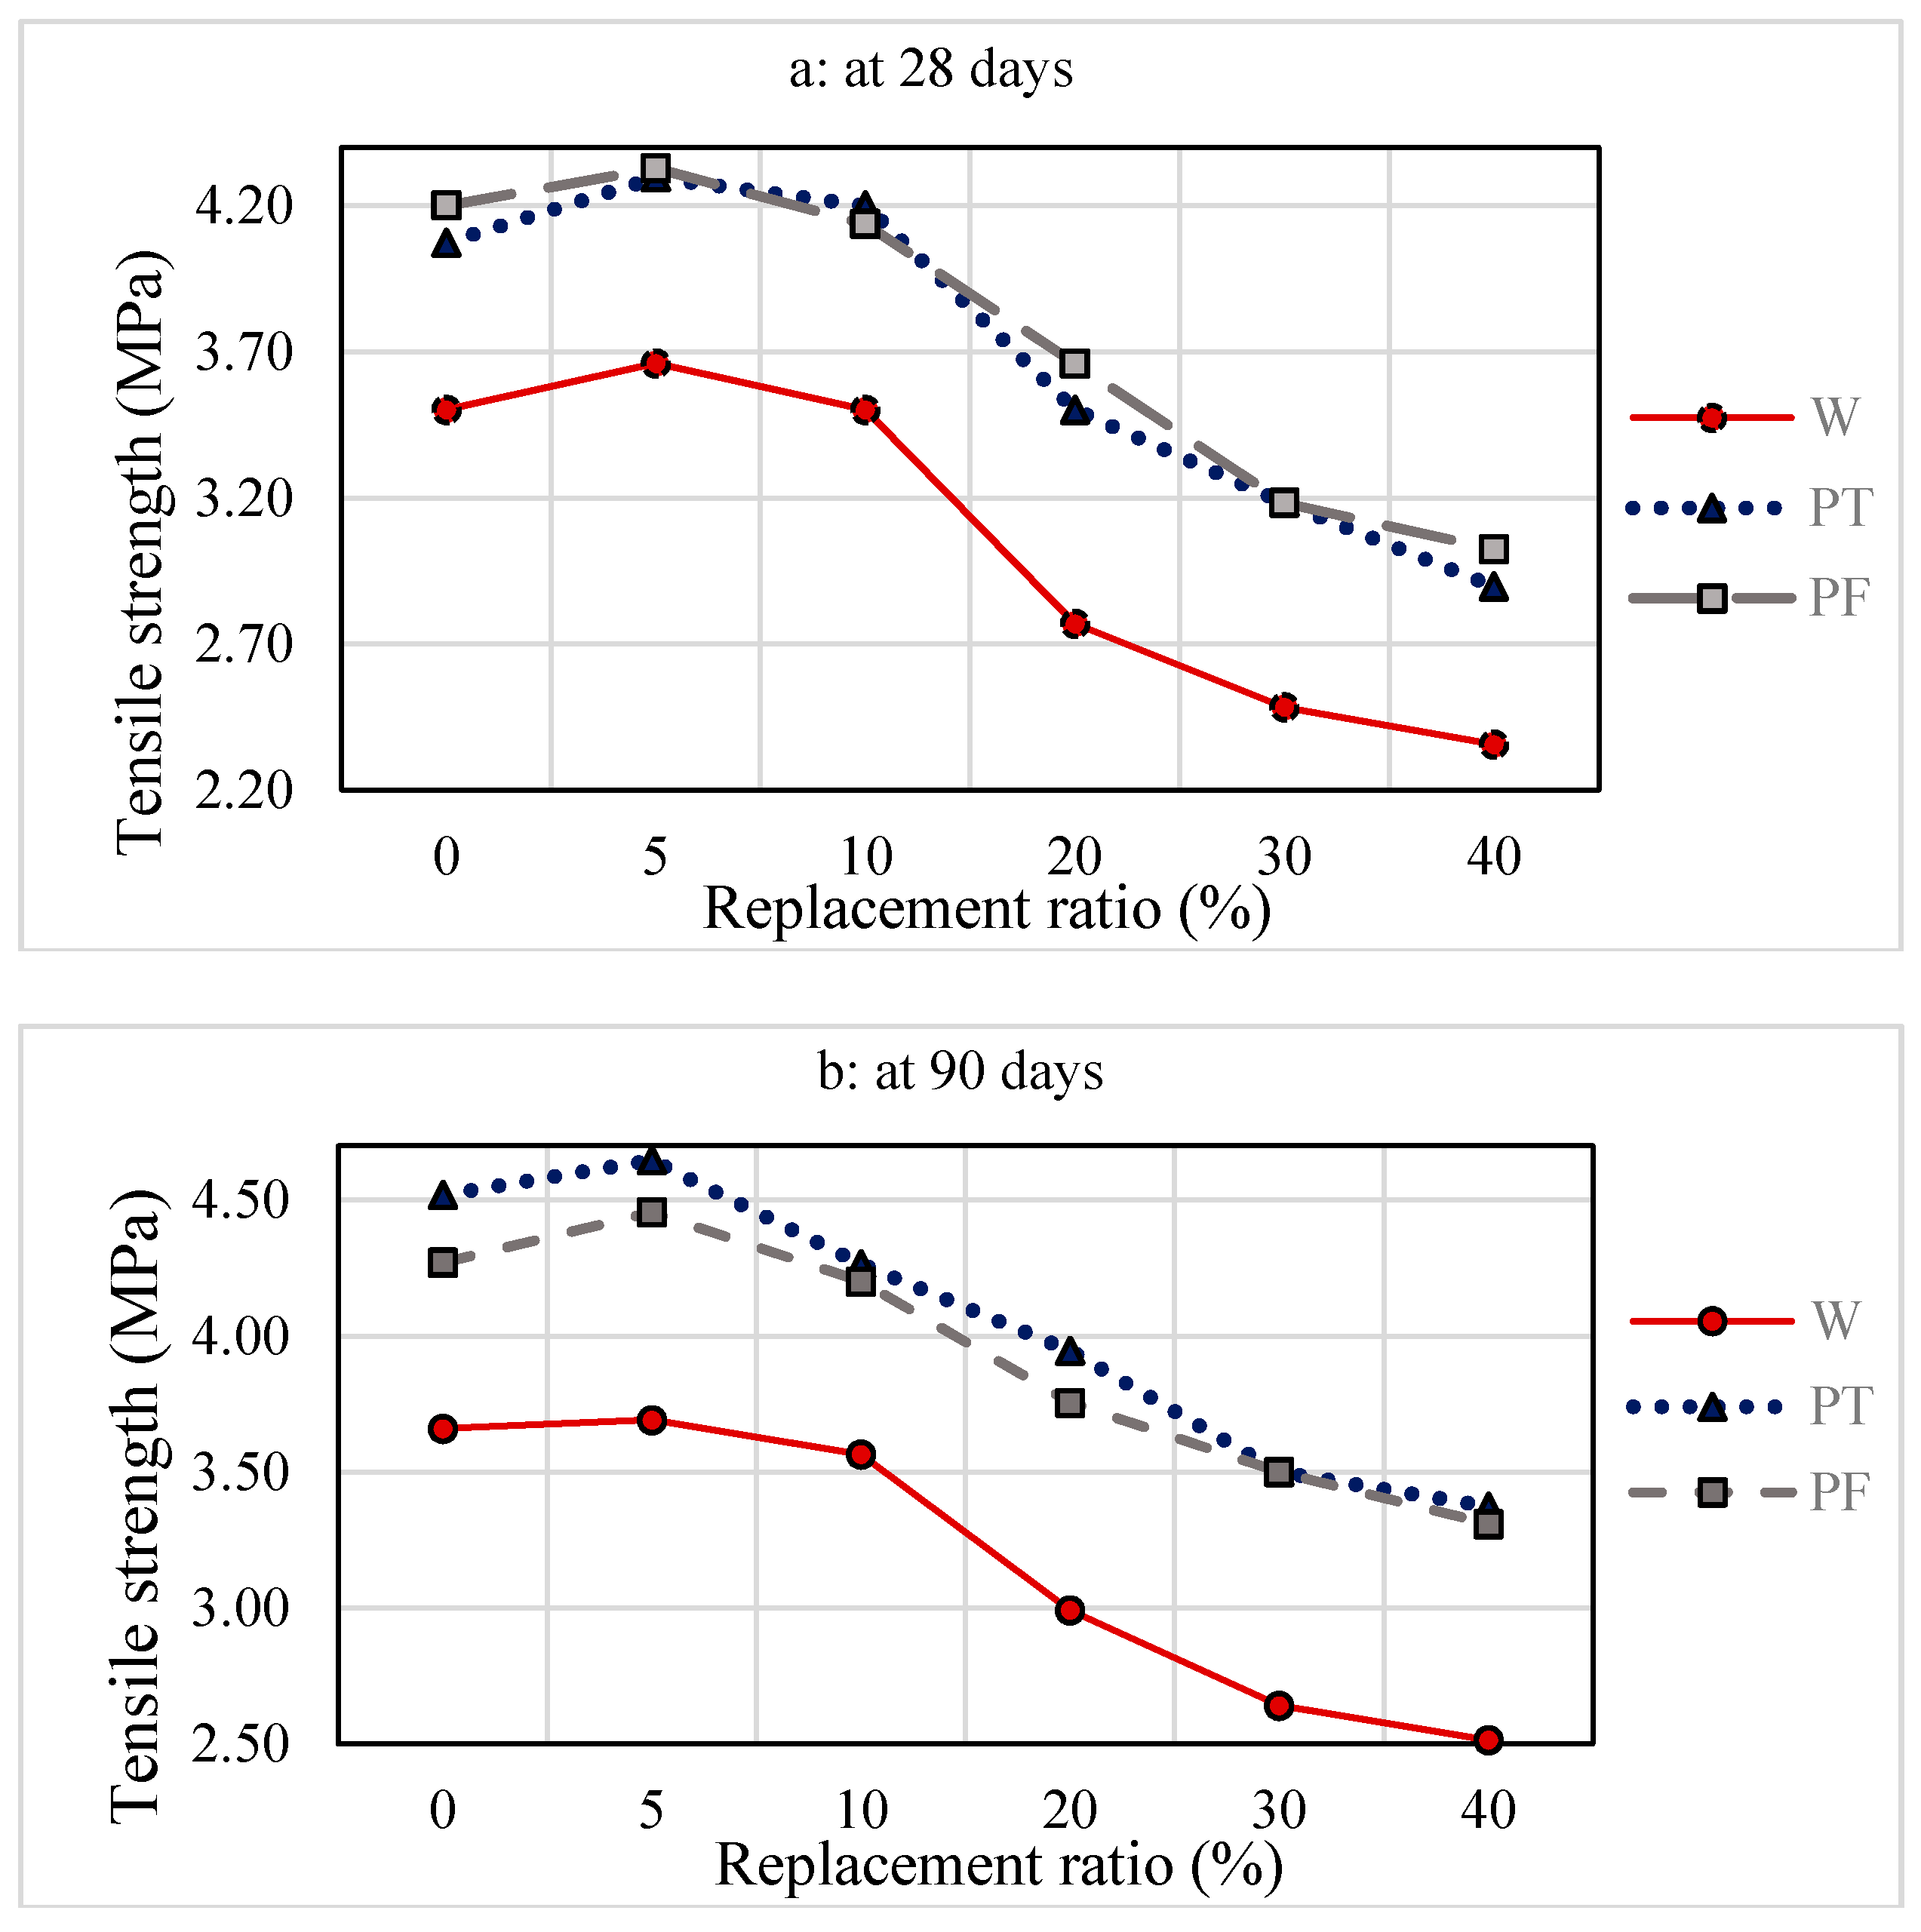
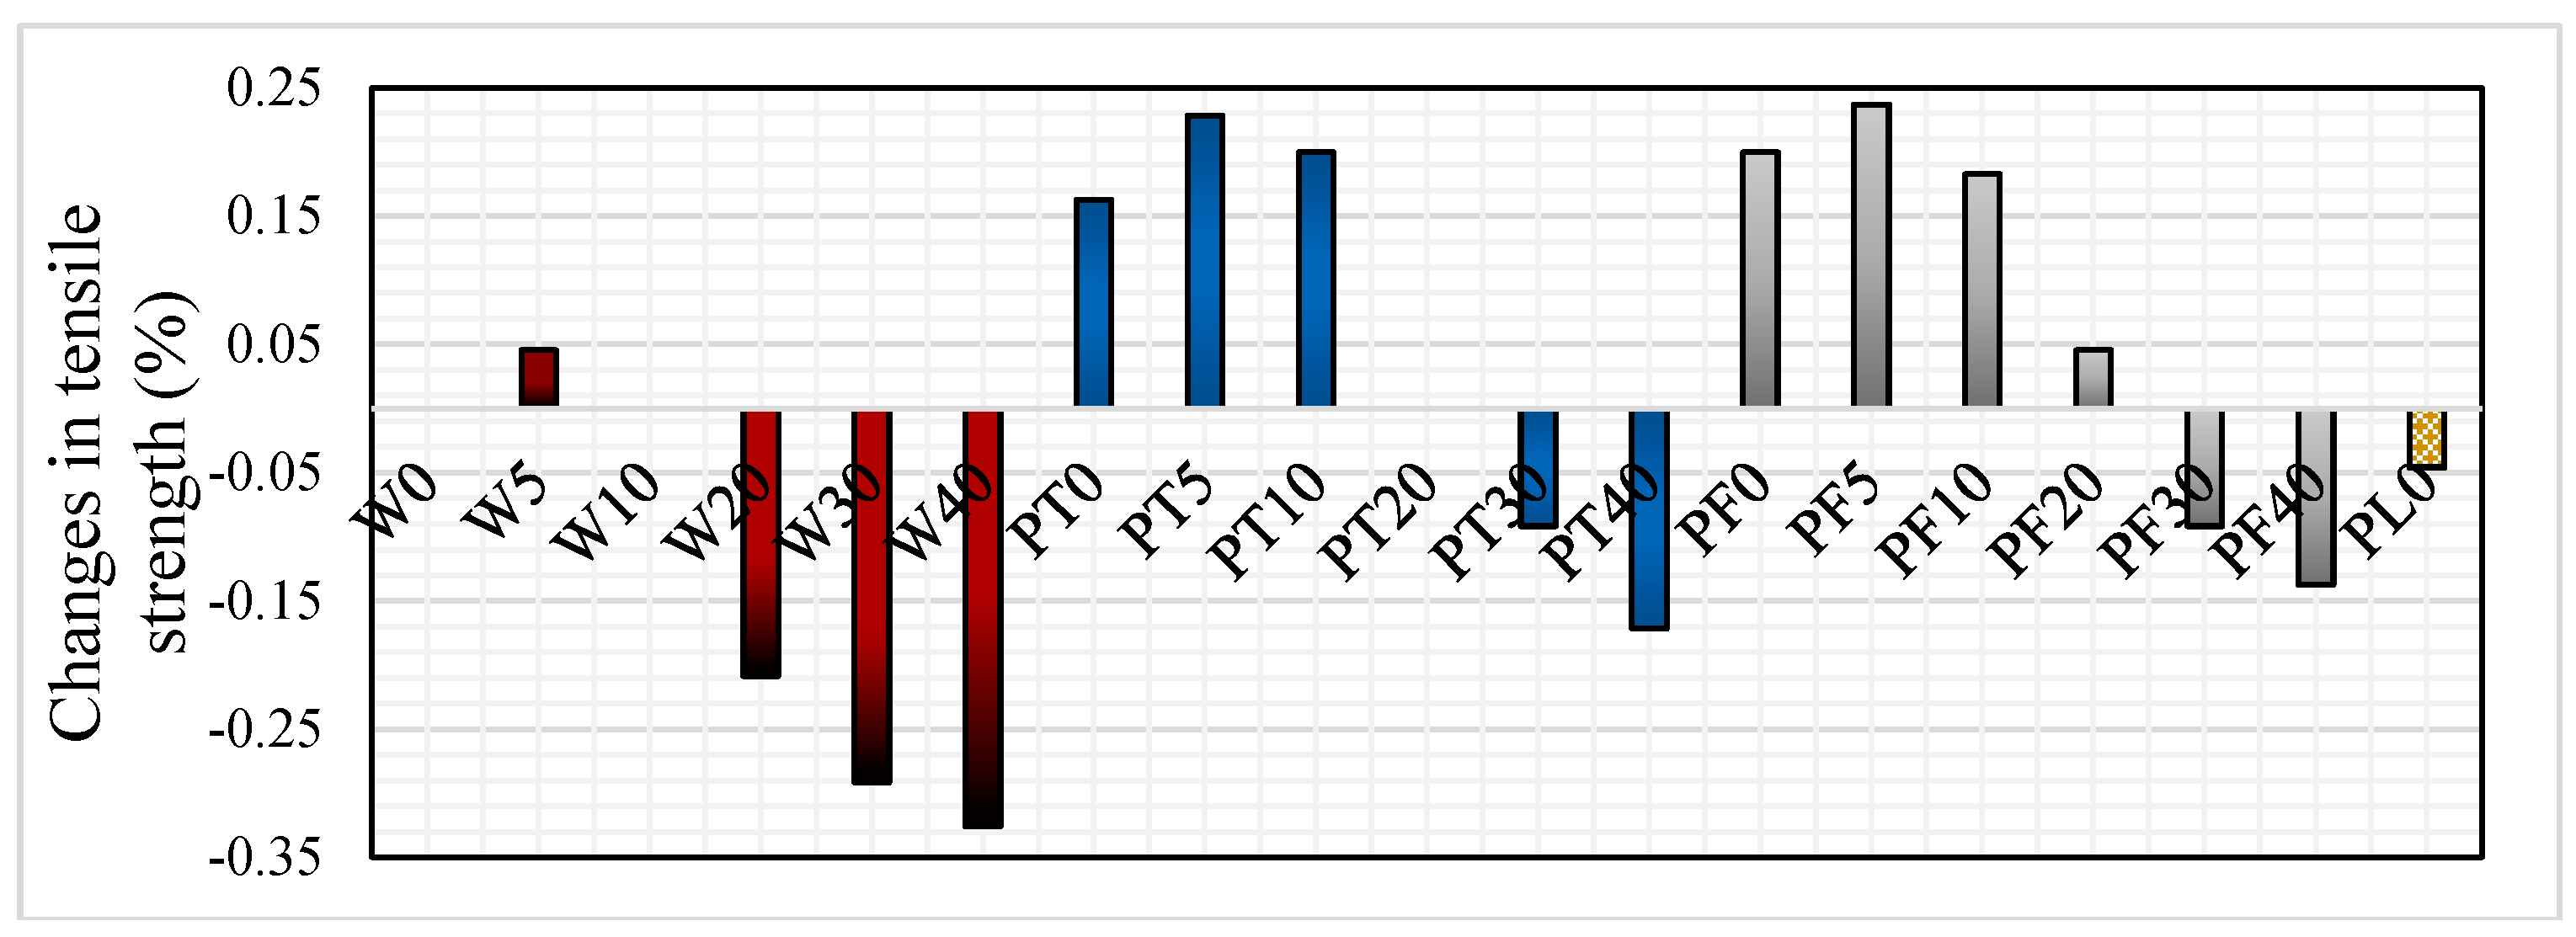
4.4. Splitting Tensile Strength
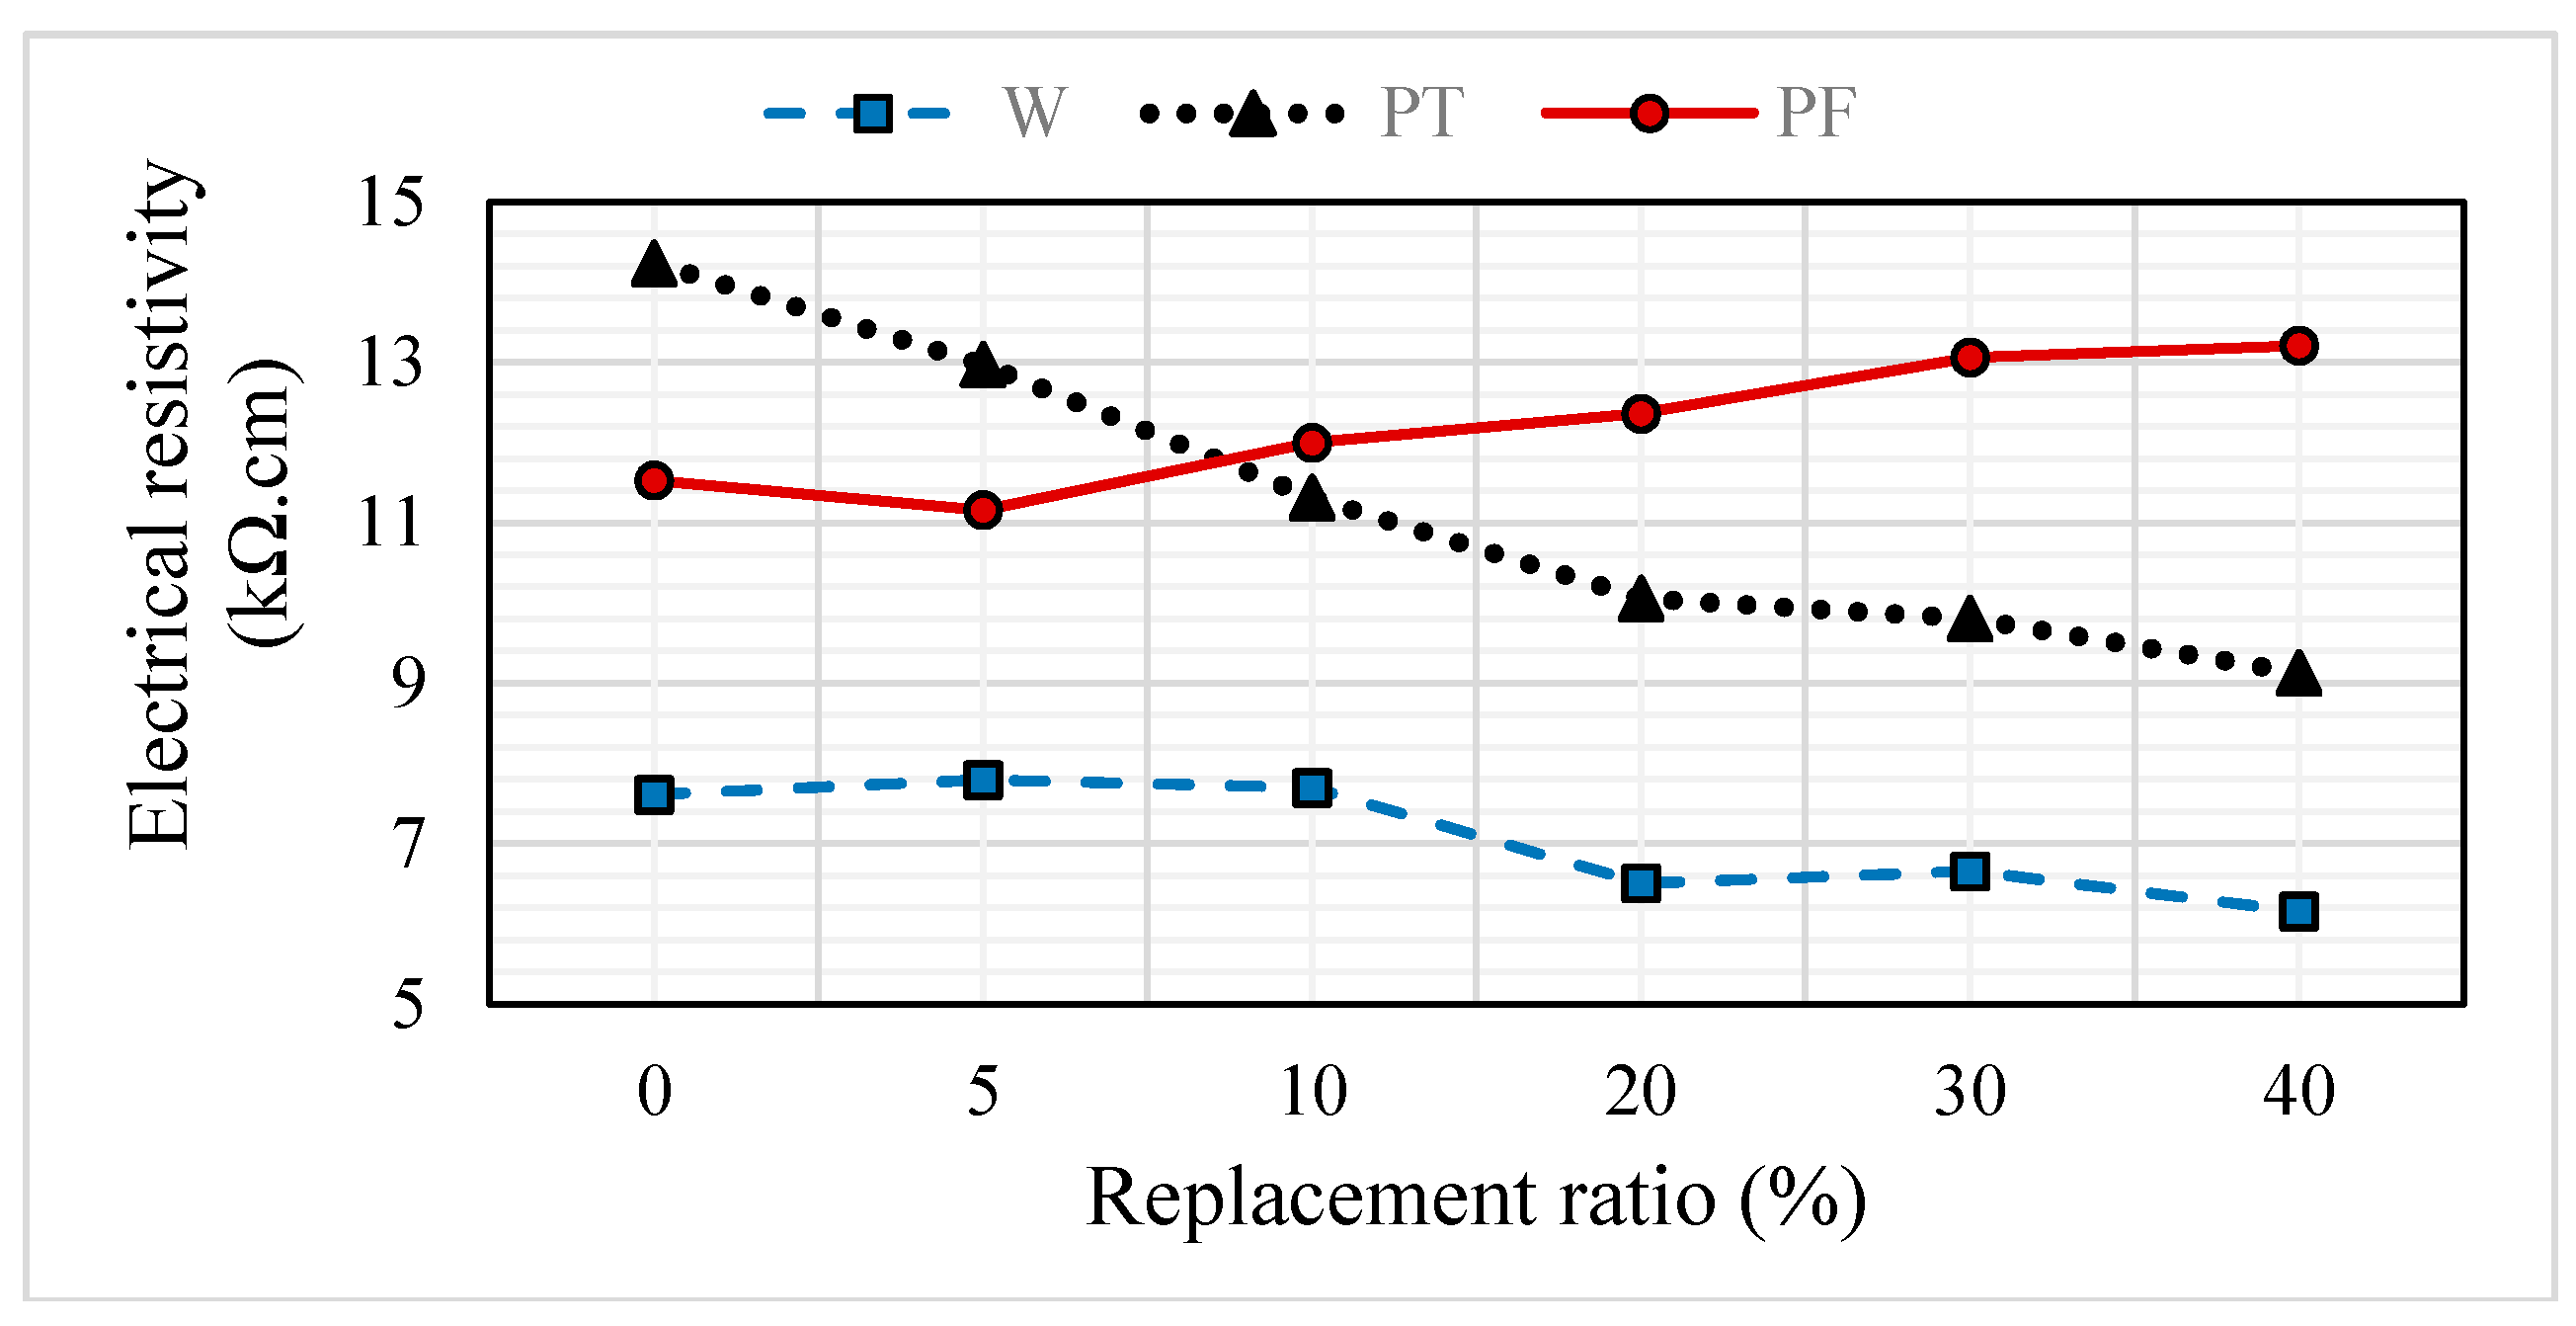
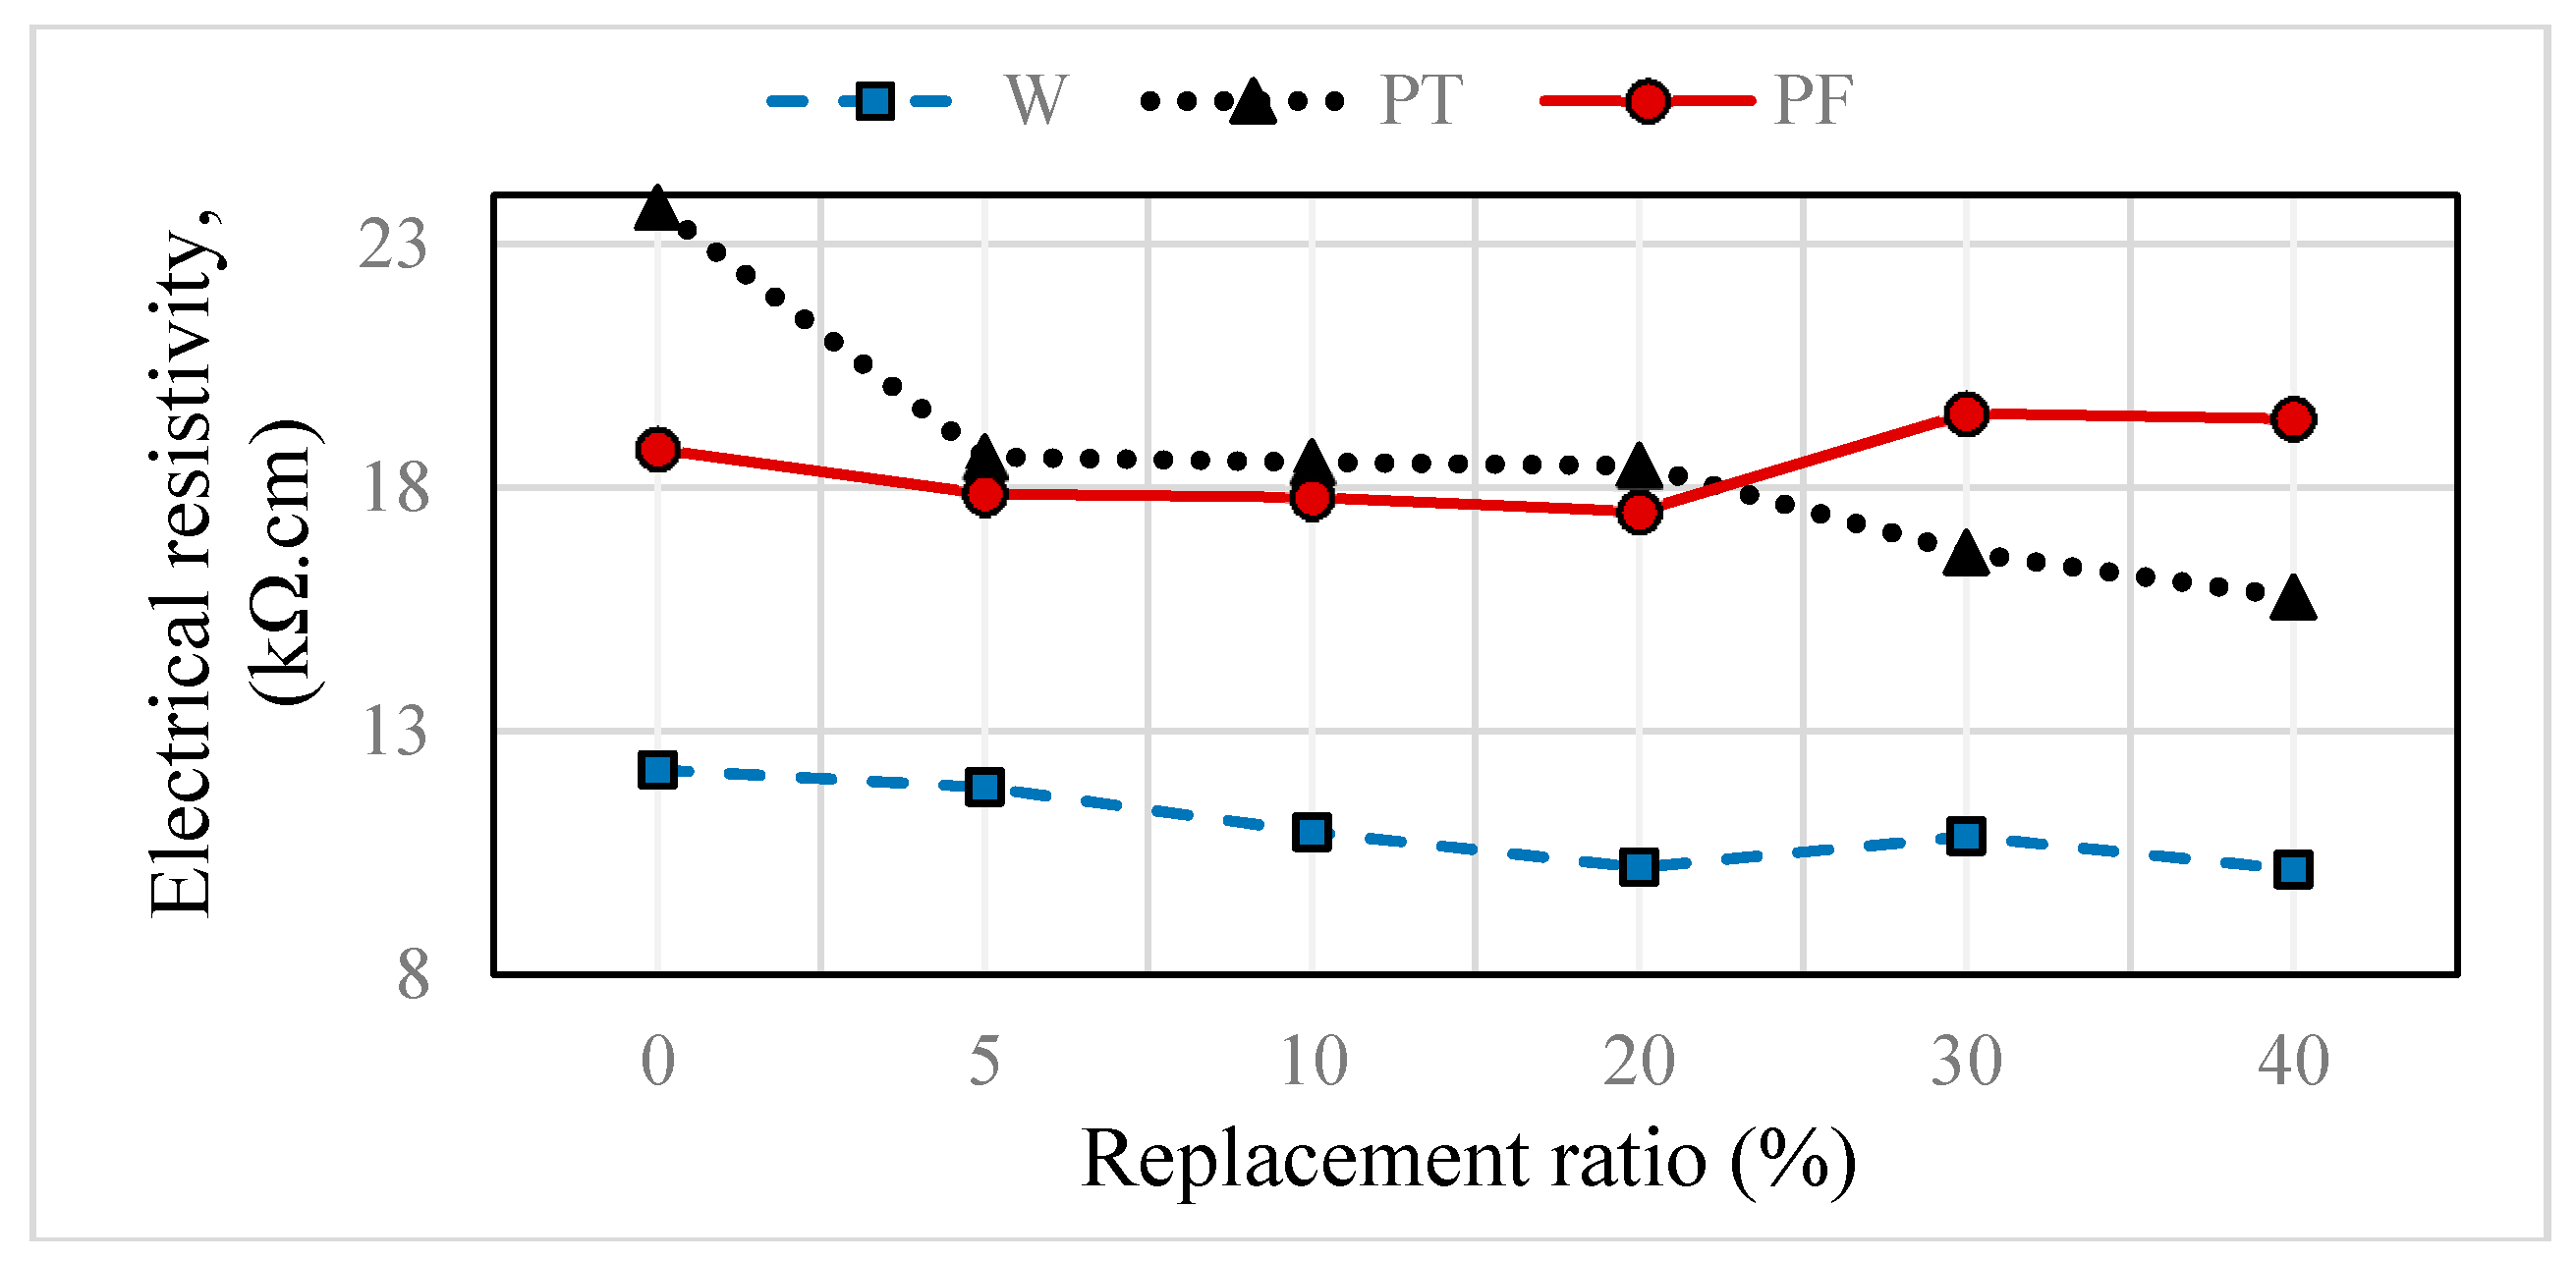
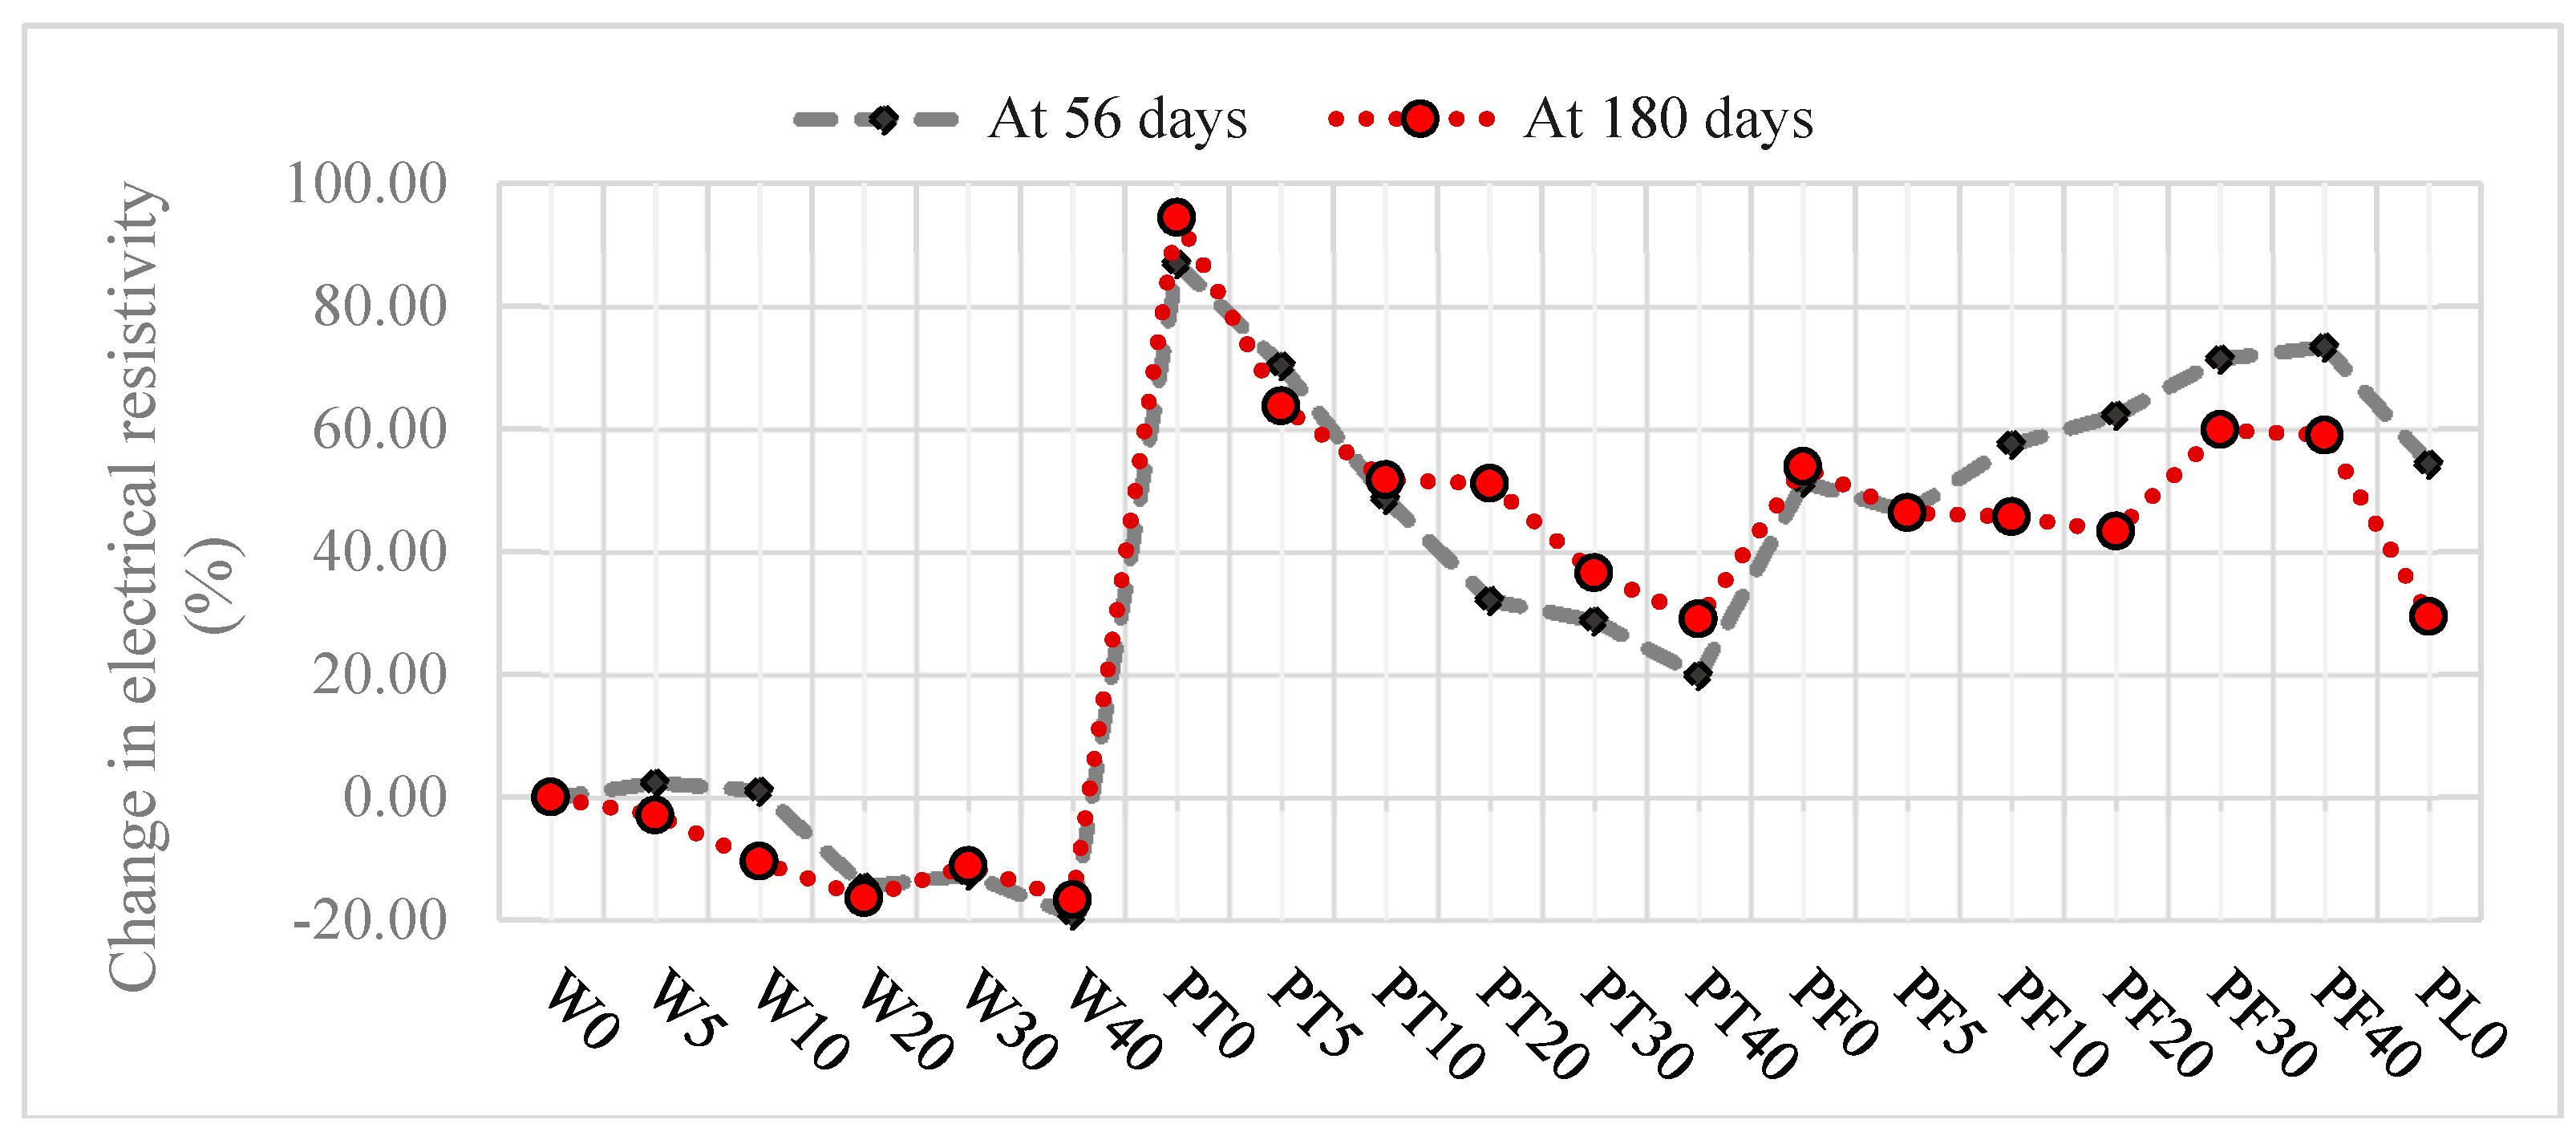
4.5. Electrical Resistivity (ER)
4.6. Resistance of Concrete to Sulphate Attack (SA)
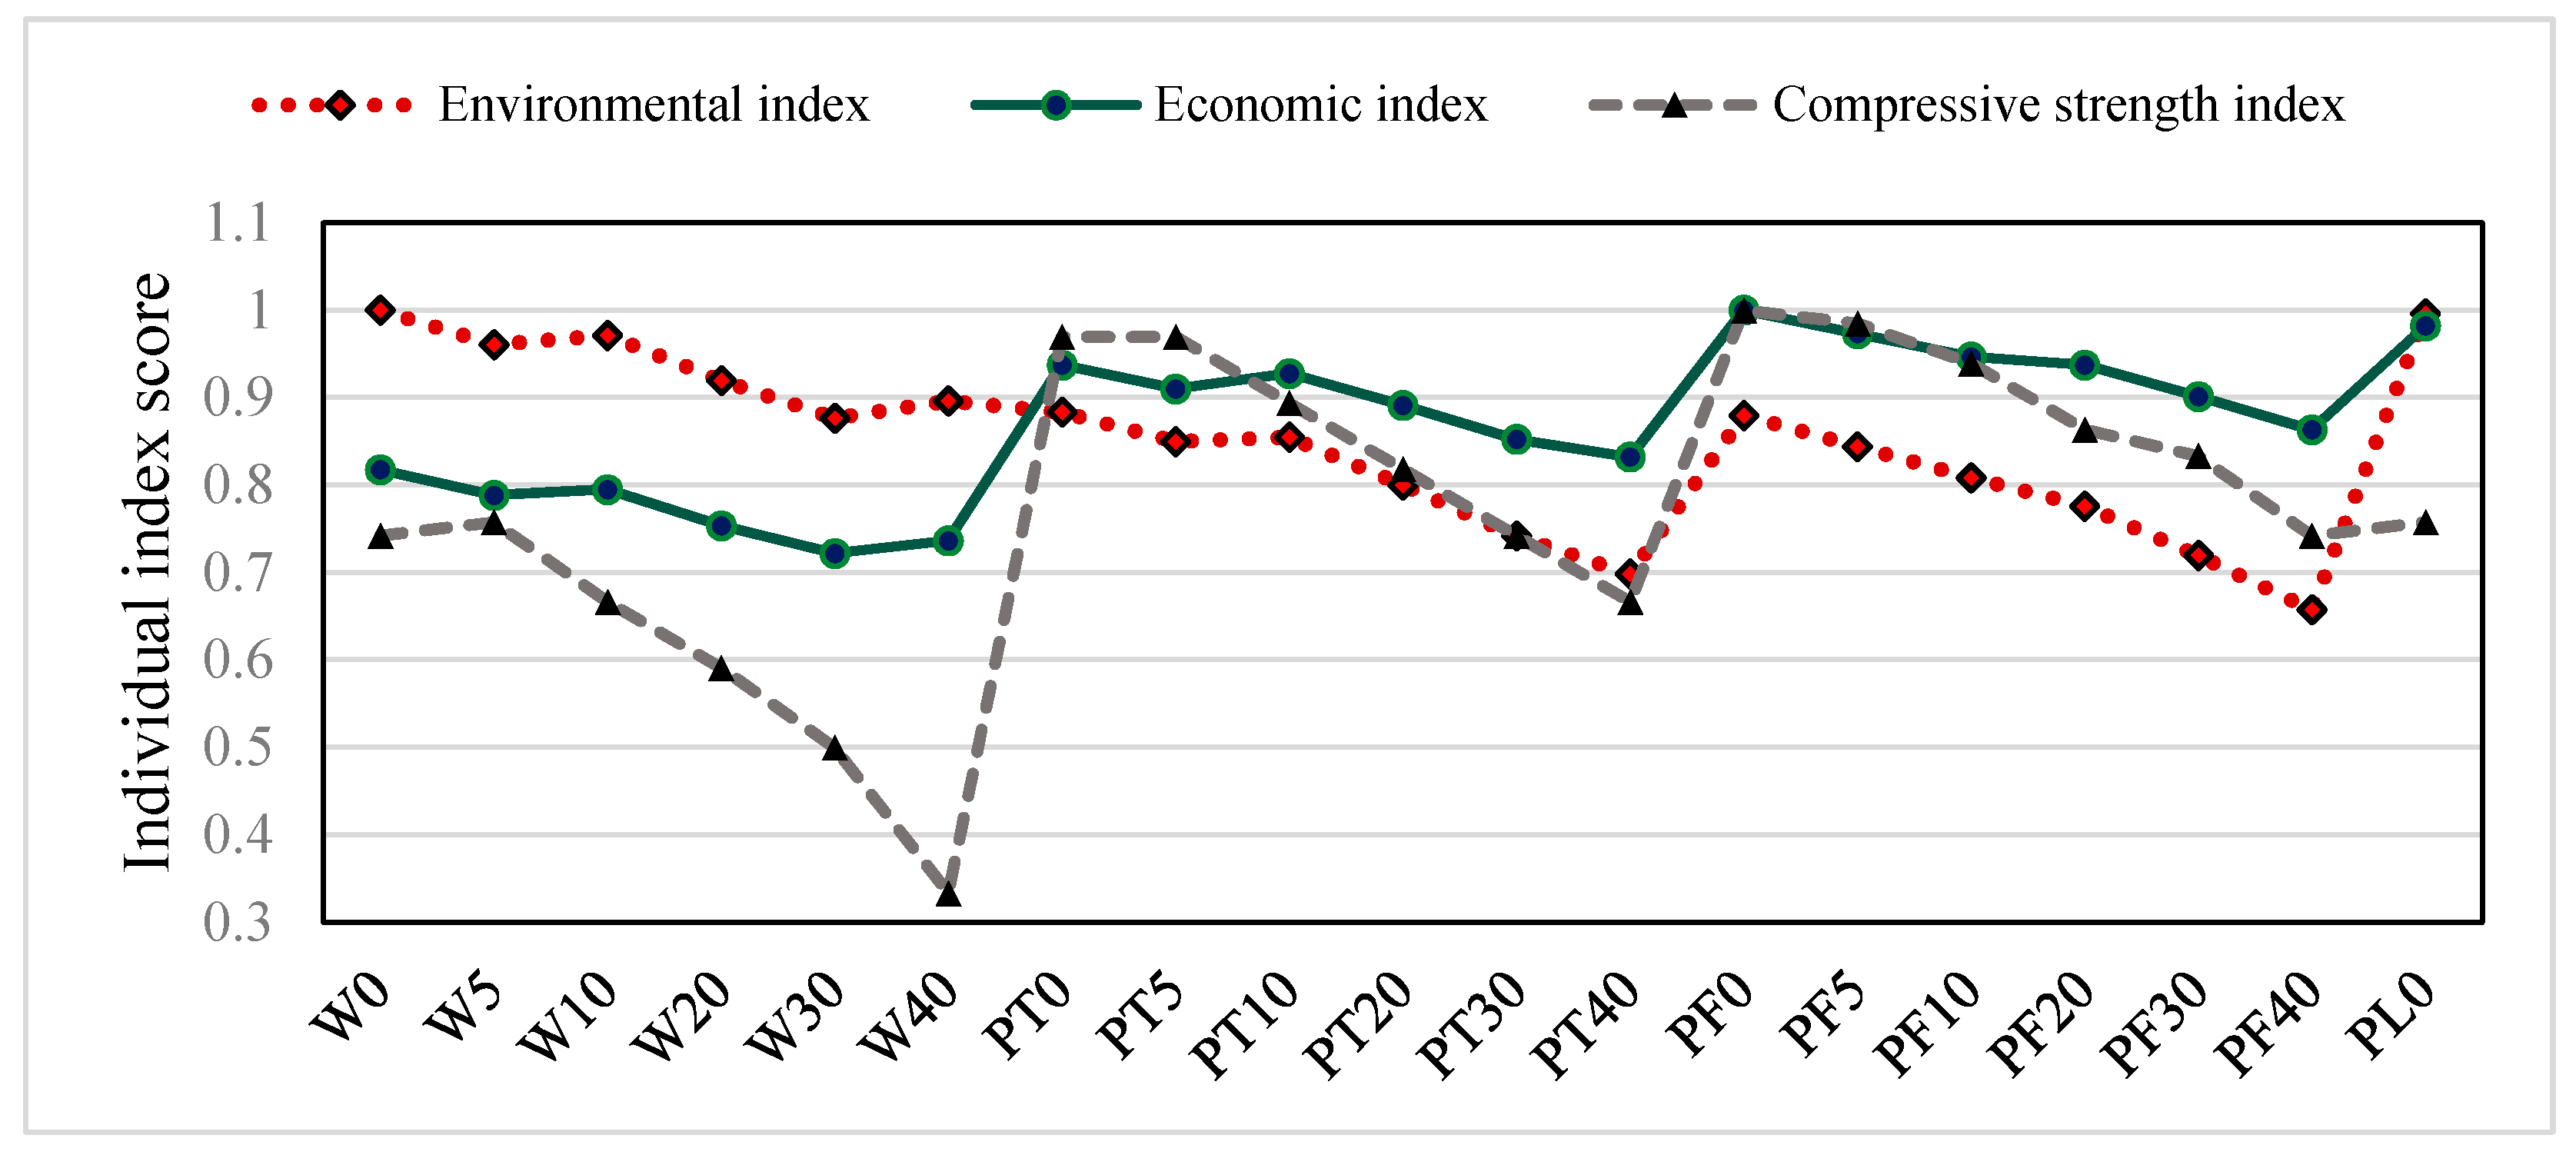
4.7. Environmental, Economic and Mechanical Indexes
5. Conclusions
- The workability of concrete is affected by WGP incorporation and greater ratios lead to increasingly greater changes. But using SP efficiently decreases the negative effects of waste on workability;
- 5% WGP content increases the density of concrete, but greater substitution ratios decreases density. The effect of using SP on density is stronger than that of WGP incorporation, but using SP does not change the downward trend of density for replacement ratios over 10%;
- When using SP with less cement content, the results are even much better. Accordingly, using admixtures can be said to be a step towards sustainable development;
- The ER of mix PF40 is 91% and 59% more than that of mixes W40 and W0, respectively. Therefore, using SP can be vital to obtain good electrical properties;
- The effect of WGP incorporation on the resistance to SA is much stronger than that of SP. However, using the two materials together provides the best results;
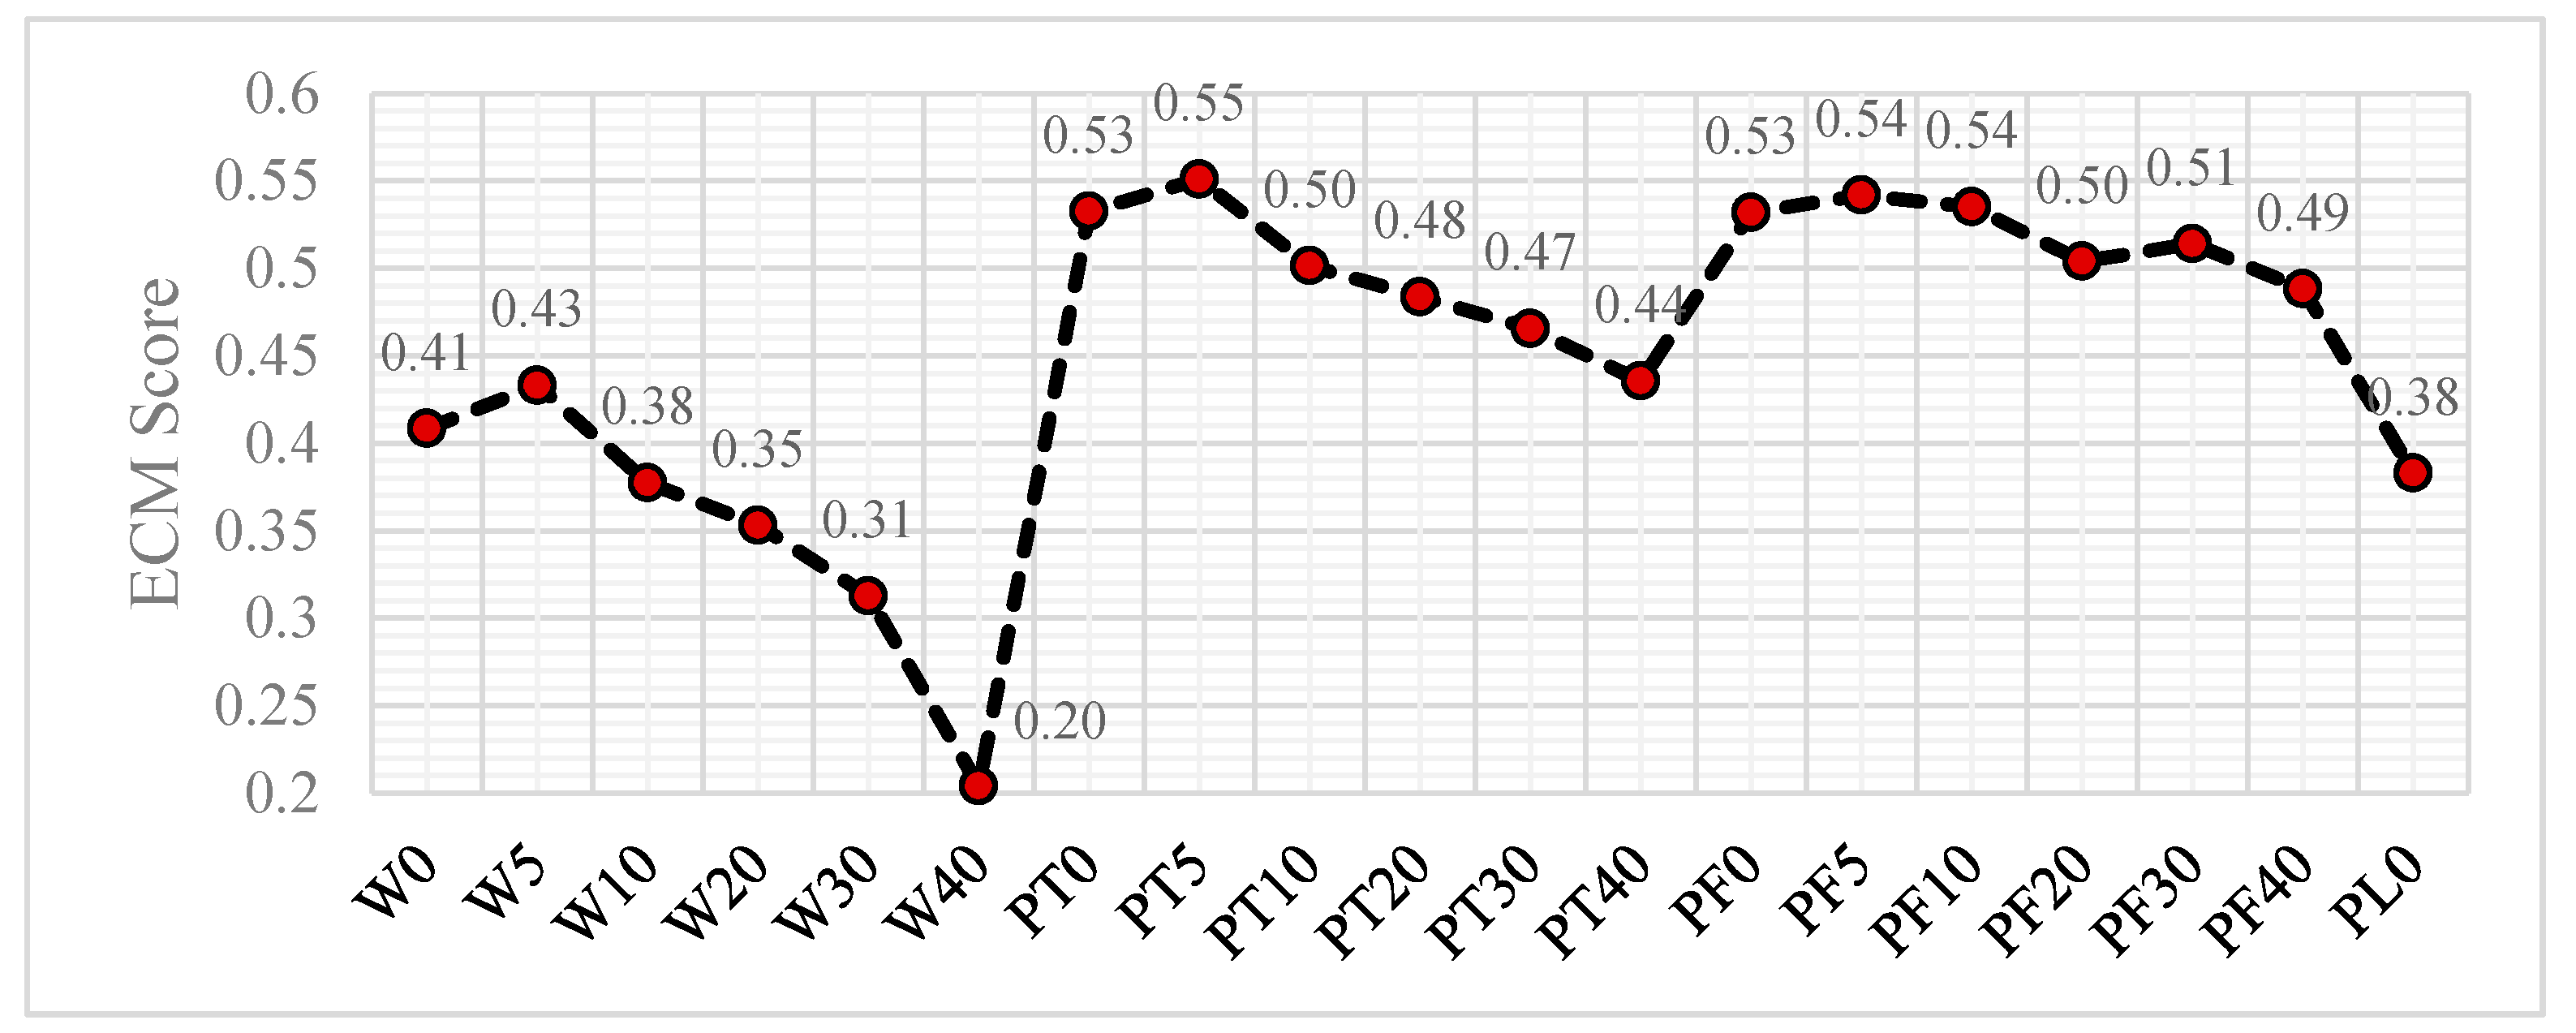
- Using waste in series W has led to a 0.21 decrease of the ECM index of the mix with 40% replacement in comparison with the mix produced without WGP, while this decrease is about 0.09 and 0.04 for series PT and PF, respectively. The ECM index of mixes PT0 and PF0 increased by 0.12 compared to mix W0. An increase in the replacement ratio did not significantly change the ECM score in series PT and PF, which proves the importance of using SP.
Author Contributions
Funding
Conflicts of Interest
Abbreviations
| ECM | multi-criteria evaluation index of concrete mixes |
| EI | environmental index |
| ER | electrical resistivity |
| GWP | global warming potential |
| SA | sulphate attack |
| SP | superplasticizer |
| SPL | Lignosulphonate-based superplasticizer |
| SPP | polycarboxylate-based superplasticizer |
| w/c | water to cement ratio |
| WGP | waste granite powder |
| WU | water used in concrete production |
References
- Kuntz, L.M. The “Greening” of the Concrete Industry: Factors Contributing to Sustainable Concrete. Master’s Thesis, Massachusetts Institute of Technology, Cambridge, MA, USA, 2006. [Google Scholar]
- Mendoza, J.; Feced, M.; Feijoo, G.; Josa, A.; Gabarrell, X.; Rieradevall, J. Life cycle inventory analysis of granite production from cradle to gate. Int. J. Life Cycle Assess. 2014, 19, 153–165. [Google Scholar] [CrossRef]
- Ramos, T.; Matos, A.; Schmidt, B.; Rio, J.; Sousa-Coutinho, J. Granitic quarry sludge waste in mortar: Effect on strength and durability. Constr. Build. Mater. 2013, 47, 1001–1009. [Google Scholar] [CrossRef]
- Kala, T. Effect of granite powder on strength properties of concrete. Int. J. Eng. Sci. 2013, 2, 36–50. [Google Scholar]
- Lakhani, R.; Kumar, R.; Tomar, P. Utilization of stone waste in the development of value added products: A state of the art review. J. Eng. Sci. Technol. Rev. 2014, 7, 180–187. [Google Scholar]
- Ali, N.; Jaffar, A.; Anwer, M.; Alwi, S.; Anjum, M.; Ali, N.; Raja, M.; Hussain, A.; Ming, X. The greenhouse gas emissions produced by cement production and its impact on environment: A review of global cement Processing. Int. J. Res. 2015, 2, 488–500. [Google Scholar]
- ASTM C618. Standard Specification for Coal Fly Ash and Raw or Calcined Natural Pozzolan for Use in Concrete; ASTM: West Conshohocken, PA, USA, 2012. [Google Scholar]
- Bacarji, E.; Toledo Filho, R.D.; Koenders, E.A.B.; Figueiredo, E.P.; Lopes, J.L.M.P. Sustainability perspective of marble and granite residues as concrete fillers. Constr. Build. Mater. 2013, 45, 1–10. [Google Scholar] [CrossRef]
- Elmoaty, A.E.M.A. Mechanical properties and corrosion resistance of concrete modified with granite dust. Constr. Build. Mater. 2013, 47, 743–752. [Google Scholar] [CrossRef]
- Mármol, I.; Ballester, P.; Cerro, S.; Monrós, G.; Morales, J.; Sánchez, L. Use of granite sludge wastes for the production of coloured cement-based mortars. Cem. Concr. Compos. 2010, 32, 617–622. [Google Scholar] [CrossRef]
- Medina, G.; Sáez del Bosque, I.F.; Frías, M.; Sánchez de Rojas, M.I.; Medina, C. Granite quarry waste as a future eco-efficient supplementary cementitious material (SCM): Scientific and technical considerations. J. Clean. Prod. 2017, 148, 467–476. [Google Scholar] [CrossRef]
- Mashaly, A.O.; Shalaby, B.N.; Rashwan, M.A. Performance of mortar and concrete incorporating granite sludge as cement replacement. Constr. Build. Mater. 2018, 169, 800–818. [Google Scholar] [CrossRef]
- Medina, G.; Sáez del Bosque, I.F.; Frías, M.; Sánchez de Rojas, M.I.; Medina, C. Durability of new recycled granite quarry dust-bearing cements. Constr. Build. Mater. 2018, 187, 414–425. [Google Scholar] [CrossRef]
- Dos Santos Vazzoler, J.; Vieira, G.L.; Teles, C.R.; Degen, M.K.; Teixeira, R.A. Investigation of the potential use of waste from ornamental stone processing after heat treatment for the production of cement-based paste. Constr. Build. Mater. 2018, 177, 314–321. [Google Scholar] [CrossRef]
- Pereira, P.; Evangelista, L.; de Brito, J. The effect of superplasticizers on the mechanical performance of concrete made with fine recycled concrete aggregates. Cem. Concr. Compos. 2012, 34, 1044–1052. [Google Scholar] [CrossRef]
- Pereira, P.; Evangelista, L.; de Brito, J. The effect of superplasticisers on the workability and compressive strength of concrete made with fine recycled concrete aggregates. Constr. Build. Mater. 2012, 28, 722–729. [Google Scholar] [CrossRef]
- Matias, D.; de Brito, J.; Rosa, A.; Pedro, D. Mechanical properties of concrete produced with recycled coarse aggregates–influence of the use of superplasticizers. Constr. Build. Mater. 2013, 44, 101–109. [Google Scholar] [CrossRef]
- Al-Tayeb, M.; Hamouda, H. Effect of superplasticizer on workability of concrete containing crumb rubber. Civ. Environ. Res. 2015, 7, 35–43. [Google Scholar]
- Bravo, M.; de Brito, J.; Evangelista, L.; Pacheco, J. Durability and shrinkage of concrete with CDW as recycled aggregates: Benefits from superplasticizer’s incorporation and influence of CDW composition. Constr. Build. Mater. 2018, 168, 818–830. [Google Scholar] [CrossRef]
- ASTM C136. Standard Test Method for Sieve Analysis of Fine and Coarse Aggregates; American Society for Testing and Materials (ASTM): West Conshohocken, PA, USA, 2014. [Google Scholar]
- ASTM C1602. Standard Specification for Mixing Water Used in the Production of Hydraulic Cement Concrete; ASTM: West Conshohocken, PA, USA, 2012. [Google Scholar]
- ACI 211.1. Standard Practice for Selecting Proportions for Normal, Heavyweight and Mass Concrete; American Concrete Institute: Farmington Hills, MI, USA, 1991. [Google Scholar]
- ASTM C143. Standard Test Method for Slump of Hydraulic-Cement Concrete; ASTM: West Conshohocken, PA, USA, 2008. [Google Scholar]
- ASTM C138. Standard Test Method for Density (Unit Weight), Yield, and Air Content (Gravimetric) of Concrete; ASTM: West Conshohocken, PA, USA, 2001. [Google Scholar]
- BS EN 12390-3. Testing Hardened Concrete: Compressive Strength of Test Specimens; British Standards Institution: Gunnersbury, UK, 2009. [Google Scholar]
- ASTM C496. Standard Test Method for Splitting Tensile Strength of Cylindrical Concrete Specimens; ASTM: West Conshohocken, PA, USA, 2004. [Google Scholar]
- Zongjin, L. Advanced Concrete Technology; John Wiley and Sons, Inc.: Hoboken, NJ, USA, 2011. [Google Scholar]
- Glavind, M.; Damtoft, J.; Röttig, S. Cleaner technology solutions in the life cycle of concrete products. In Proceedings of the Three-Day International Symposium on Sustainable Development and Concrete Technology, San Fransisco, CA, USA, 16–19 September 2001. [Google Scholar]
- Lippiatt, B. BEESRG 2.0: Building for Environmental and Economic Sustainability—Technical Manual and User Guide; National Institute of Standards and Technology: Gaithersburg, MD, USA, 2000.
- Björklund, T.; Tillman, A. LCA of Building Frame Structures: Environmental Impact Over the Life Cycle of Wooden and Concrete Frames. Technical Environmental Planning Report 2; Chalmers University of Technology: Gothenburg, Sweden, 1997. [Google Scholar]
- Josa, A.; Aguado, A.; Heino, A.; Byars, E.; Cardim, A. Comparative analysis of available life cycle inventories of cement in the EU. Cem. Concr. Res. 2004, 34, 1313–1320. [Google Scholar] [CrossRef]
- Marceau, M.; Nisbet, M.A.; Van-Geem, M. Life Cycle Inventory of Portland Cement Manufacture; Portland Cement Association Skokie: Skokie, IL, USA, 2006. [Google Scholar]
- Sjunnesson, J. Life Cycle Assessment of Concrete. Master’s Thesis, Lund University, Lund, Sweden, 2005. [Google Scholar]
- CPM LCI Database. Available online: http://www.cpmdatabase.cpm.chalmers.se (accessed on 6 September 2016).
- Chiaia, B.; Fantilli, A.; Guerini, A.; Volpatti, G.; Zampini, D. Eco-mechanical index for structural concrete. Constr. Build. Mater. 2014, 67, 386–392. [Google Scholar] [CrossRef]
- Marinković, S.; Radonjanin, V.; Malešev, M.; Ignjatović, I. Comparative environmental assessment of natural and recycled aggregate concrete. Waste Manag. 2010, 30, 2255–2264. [Google Scholar] [CrossRef] [PubMed]
- Rouwette, R. LCA of Geopolymer Concrete (E-Crete); Final Report; Aurora Construction Materials: Epping, Australia, 2012. [Google Scholar]
- European Federation of Concrete (EFCA). Environmental Product Declaration, Concrete Admixtures-Plasticisers and Superplasticisers. 2015. Available online: http://www.efca.info (accessed on 6 September 2016).
- Huang, Y. Life Cycle Assessment of Use of Recycled Materials in Asphalt Pavements. Ph.D. Thesis, Newcastle University, Newcastle upon Tyne, UK, 2007. [Google Scholar]
- Flower, D.; Sanjayan, J. Green house gas emissions due to concrete manufacture. Int. J. Life Cycle Assess. 2007, 12, 282–288. [Google Scholar] [CrossRef]
- ACI 318. Building Code Requirements for Structural Concrete (ACI 318-08) and Commentary (ACI 318R-08); American Concrete Institute: Farmington Hills, MI, USA, 2008. [Google Scholar]
- Valipour, M.; Yekkalar, M.; Shekarchi, M.; Panahi, S. Environmental assessment of green concrete containing natural zeolite on the global warming index in marine environments. J. Clean. Prod. 2014, 65, 418–423. [Google Scholar] [CrossRef]
- Lippiatt, B. BEESRG 3.0: Building for Environmental and Economic Sustainability—Technical Manual and User Guide; National Institute of Standards and Technology: Gaithersburg, MD, USA, 2002.
- Abukersh, S.; Fairfield, C. Recycled aggregate concrete produced with red granite dust as a partial cement replacement. Constr. Build. Mater. 2011, 25, 4088–4094. [Google Scholar] [CrossRef]
- Vijayalakshmi, M.; Sekar, A.; Ganesh prabhu, G. Strength and durability properties of concrete made with granite industry waste. Constr. Build. Mater. 2013, 46, 1–7. [Google Scholar] [CrossRef]


| Composition | Cement (%) | Granite Powder (%) |
|---|---|---|
| SiO2 | 21.63 | 72.9 |
| Al2O3 | 4.27 | 14.65 |
| Fe2O3 | 3.45 | 1.7 |
| CaO | 63.25 | 1.5 |
| Na2O | - | 3.85 |
| K2O | - | 3.98 |
| MgO | 2.77 | 0.37 |
| TiO2 | - | 0.235 |
| MnO | - | 0.026 |
| SO3 | 2.02 | 0 |
| C3A | 5.48 | - |
| P2O5 | - | 0.088 |
| L.O.I | 1.5 | 0.41 |
| N | Mix | Cement (kg/m3) | W/C Ratio | WGP (kg/m3) | Water (kg/m3) | Coarse Aggregate (kg/m3) | Fine Agregate (kg/m3) | SPP (kg/m3) | SPL (kg/m3) | Slump (kg/m3) |
|---|---|---|---|---|---|---|---|---|---|---|
| 1 | W0 | 400 | 0.5 | 0 | 200 | 1000 | 714 | 0 | 0 | 80 |
| 2 | W5 | 380 | 0.5 | 20 | 200 | 1000 | 709 | 0 | 0 | 75 |
| 3 | W10 | 360 | 0.51 | 40 | 204 | 995 | 699 | 0 | 0 | 80 |
| 4 | W20 | 320 | 0.52 | 80 | 208 | 989 | 685 | 0 | 0 | 75 |
| 5 | W30 | 280 | 0.525 | 120 | 210 | 987 | 673 | 0 | 0 | 75 |
| 6 | W40 | 240 | 0.54 | 160 | 216 | 979 | 656 | 0 | 0 | 90 |
| 7 | PT0 | 400 | 0.37 | 0 | 146.2 | 1069 | 783 | 3 | 0 | 75 |
| 8 | PT5 | 380 | 0.375 | 20 | 148.2 | 1067 | 775 | 3 | 0 | 80 |
| 9 | PT10 | 360 | 0.375 | 40 | 148.2 | 1067 | 771 | 3 | 0 | 75 |
| 10 | PT20 | 320 | 0.38 | 80 | 150.2 | 1064 | 759 | 3 | 0 | 85 |
| 11 | PT30 | 280 | 0.385 | 120 | 152.2 | 1061 | 747 | 3 | 0 | 75 |
| 12 | PT40 | 240 | 0.39 | 160 | 154.2 | 1059 | 735 | 3 | 0 | 80 |
| 13 | PF0 | 400 | 0.34 | 0 | 133.6 | 1085 | 798 | 4 | 0 | 85 |
| 14 | PF5 | 380 | 0.34 | 20 | 133.6 | 1085 | 794 | 4 | 0 | 80 |
| 15 | PF10 | 360 | 0.34 | 40 | 133.6 | 1085 | 789 | 4 | 0 | 85 |
| 16 | PF20 | 320 | 0.345 | 80 | 135.6 | 1083 | 777 | 4 | 0 | 85 |
| 17 | PF30 | 280 | 0.35 | 120 | 137.6 | 1080 | 765 | 4 | 0 | 90 |
| 18 | PF40 | 240 | 0.35 | 160 | 137.6 | 1080 | 756 | 4 | 0 | 90 |
| 19 | PL0 | 400 | 0.43 | 0 | 170.5 | 1037 | 751 | 1.5 | 1.5 | 80 |
| Flow (i) | GWPi (CO2-Equivalents) |
|---|---|
| CO2 | 1 |
| Methane | 24 |
| Nitrous oxide | 360 |
| fcm (MPa) | 22 | 33 | 39 | 44 | 49, 50 | 54, 55 | 57, 59 | 62, 64, 66 |
|---|---|---|---|---|---|---|---|---|
| Concrete volume (m3) | 0.6 | 0.53 | 0.51 | 0.5 | 0.47 | 0.46 | 0.45 | 0.43 |
| Correction coefficient | 1 | 0.8867 | 0.8473 | 0.8229 | 0.7844 | 0.7669 | 0.7495 | 0.7138 |
© 2018 by the authors. Licensee MDPI, Basel, Switzerland. This article is an open access article distributed under the terms and conditions of the Creative Commons Attribution (CC BY) license (http://creativecommons.org/licenses/by/4.0/).
Share and Cite
Asadi Shamsabadi, E.; Ghalehnovi, M.; De Brito, J.; Khodabakhshian, A. Performance of Concrete with Waste Granite Powder: The Effect of Superplasticizers. Appl. Sci. 2018, 8, 1808. https://doi.org/10.3390/app8101808
Asadi Shamsabadi E, Ghalehnovi M, De Brito J, Khodabakhshian A. Performance of Concrete with Waste Granite Powder: The Effect of Superplasticizers. Applied Sciences. 2018; 8(10):1808. https://doi.org/10.3390/app8101808
Chicago/Turabian StyleAsadi Shamsabadi, Elyas, Mansour Ghalehnovi, Jorge De Brito, and Ali Khodabakhshian. 2018. "Performance of Concrete with Waste Granite Powder: The Effect of Superplasticizers" Applied Sciences 8, no. 10: 1808. https://doi.org/10.3390/app8101808
APA StyleAsadi Shamsabadi, E., Ghalehnovi, M., De Brito, J., & Khodabakhshian, A. (2018). Performance of Concrete with Waste Granite Powder: The Effect of Superplasticizers. Applied Sciences, 8(10), 1808. https://doi.org/10.3390/app8101808