Article

Identification of Hybrid Okra Seeds Based on Near-Infrared Hyperspectral Imaging Technology

College of Biosystems Engineering and Food Science, Zhejiang University, 866 Yuhangtang Road, Hangzhou 310058, China
*
Author to whom correspondence should be addressed.
Appl. Sci. 2018, 8(10), 1793; https://doi.org/10.3390/app8101793
Submission received: 28 August 2018 / Revised: 18 September 2018 / Accepted: 25 September 2018 / Published: 1 October 2018

Abstract

:
Near-infrared (874–1734 nm) hyperspectral imaging technology combined with chemometrics was used to identify parental and hybrid okra seeds. A total of 1740 okra seeds of three different varieties, which contained the male parent xiaolusi, the female parent xianzhi, and the hybrid seed penzai, were collected, and all of the samples were randomly divided into the calibration set and the prediction set in a ratio of 2:1. Principal component analysis (PCA) was applied to explore the separability of different seeds based on the spectral characteristics of okra seeds. Fourteen and 86 characteristic wavelengths were extracted by using the successive projection algorithm (SPA) and competitive adaptive reweighted sampling (CARS), respectively. Another 14 characteristic wavelengths were extracted by using CARS combined with SPA. Partial least squares discriminant analysis (PLS-DA) and support vector machine (SVM) were developed based on the characteristic wavelength and full-band spectroscopy. The experimental results showed that the SVM discriminant model worked well and that the correct recognition rate was over 93.62% based on full-band spectroscopy. As for the discriminative model that was based on characteristic wavelength, the SVM model based on the CARS algorithm was better than the other two models. Combining the CARS+SVM calibration model and image processing technology, a pseudo-color map of sample prediction was generated, which could intuitively identify the species of okra seeds. The whole process provided a new idea for agricultural breeding in the rapid screening and identification of hybrid okra seeds.

Graphical Abstract

1. Introduction

Okra (Abelmoschus esculentu (L.) Moench), known as a supervising versatile vegetable, has been widely cultivated all over the world. It is a powerhouse of various nutrients, such as protein, cellulose, unsaturated fatty acids, and minerals, such as iron, calcium, manganese, potassium, zinc, and so on [1]. Additionally, it is low in calories and fat free [2]. It has been discovered that okra seeds are rich in flavonoids and polyphenols, all of which have strong anti-oxidative, anti-fatigue, and anti-cancer abilities [3,4,5,6]. Screening and identification of seeds has always been an important part of the agricultural breeding process. Breeding specialists typically cross-fertilize different pure lineages of the desired trait to produce offspring heterosis. At present, many studies have focused on the breeding of okra, which includes hybridization breeding [7,8,9]. Hybrid okra seeds have heterosis values that can rapidly increase productivity, improve the quality of okra as a food, and so on [7]. However, the process of obtaining hybrid okra seeds is time-consuming and laborious. Breeding experts often have to plant hybrids to a certain stage in order to screen the seeds [8,9]. They used plant characteristics, such as plant height, leaf width, and fruit length to select the optimal hybrid offspring.
Spectroscopic and spectral imaging techniques provide comprehensive structural information on the components and properties of samples at the molecular level [10]. Nowadays, near-infrared hyperspectral technology has been widely used in food detection and the identification of varieties [11,12,13,14,15]. Near-infrared hyperspectral imaging is a fast nondestructive detection technology combining machine vision and visible/near-infrared spectroscopy. With the help of near-infrared hyperspectral imaging, the spatial and spectral information of the samples can be contained simultaneously. Hundreds of contiguous wavebands for each spatial position of the sample make up the near-infrared hyperspectral images [16]. The spatial and spectral information that represents the external and internal information of the sample is provided in hypercube form and it is possible to obtain multiple sample spectra in a single scan [17,18]. So, it is very effective at detecting the seeds of hybrid okra by near-infrared hyperspectral imaging. Because different kinds of seeds contain different material information, seeds can be classified by near-infrared hyperspectral imaging combined with chemometrics. Yiying Zhao et al. (2017) identified the varieties of maize seeds using hyperspectral imaging and chemometrics [19]. They also studied the influence of calibration sample size on classification accuracy and obtained satisfactory results while using the radial basis function neural networks (RBFNN) model with a calibration accuracy of 93.85% and a prediction accuracy of 91.00%. Apart from pure seed classification, there are some studies that are focused on the spectral changes of seeds with different treatments. Xuping Feng et al. (2017) used near-infrared hyperspectral imaging technology and multidimensional data processing and analysis methods to distinguish transgenic maize seeds, and they managed to achieve a classification accuracy of up to 99.43% with the partial least squares discriminant analysis [20]. Min Huang et al. (2016) used near-infrared hyperspectral imaging to distinguish corn seeds of different years. They applied model updating to update the least squares support vector machines (LSSVM) model and the classification accuracy reached 94.40%, which was 10.30% higher than that of non-updated models [13]. Santosh Shrestha et al. (2016) used near-infrared hyperspectral imaging of a single tomato seed combined with multidimensional data processing methods to analyze the quality of tomato [21]. Junfeng Gao et al. (2013) used near-infrared hyperspectral imaging to distinguish jatropha seeds from different geographical environments, with an identification rate of 93.75% [22]. To our knowledge, there is no research on the classification of hybrid okra seeds with the help of near-infrared hyperspectral imaging. Because of its small size, we can obtain a large amount of okra seed information at the same time, which is convenient for analysis and processing. In this study, a total of 1740 okra seed samples of three different related varieties were collected.
The purpose of this study was to investigate four goals: (1) to examine the feasibility of using near infrared range (NIR) hyperspectral imaging techniques to identify the related hybrid okra seeds; (2) to select optimal characteristic wavelengths that identify the differences among hybrid okra seeds and their parent; (3) to build optimal discrimination models based on characteristic wavelengths, thus simplifying the prediction model and speeding up the operation; and, (4) to visualize the classification results of okra seeds in the form of a pseudo-color image by developing image processing algorithms.

2. Materials and Methods

2.1. Okra Seed Samples Preparation

The hybrid okra seeds used in this study and their parents were provided by the Zhejiang Academy of Agricultural Sciences, Zhejiang, China. All seeds were planted in the same block, line by line; planting conditions were strictly consistent, and all okra seeds were harvested at the same time in 2017. Then, all of the okra seeds were put into plastic bags and sealed in a plastic box to prevent moisture absorption during storage. The impact of environmental factors on seeds was eliminated as much as possible. The 1740 okra seeds included three different varieties: xiaolusi representing the father, xianzhi representing the mother, and penzai representing the hybrid progeny. Each variety had 580 seeds. All of the seeds were of normal quality with no apparent damage in appearance. Seed varieties were coded as 1, 2, and 3 for data processing. All of the samples were randomly divided into calibration and prediction sets in a ratio of 2:1. Therefore, 1160 okra seeds were used as the modeling set and 580 okra seeds were used as the prediction set. Okra seeds were evenly placed on a black plastic sheet.

2.2. Near-Infrared Hyperspectral Imaging

A laboratory-built hyperspectral imaging system was used to acquire hyperspectral images of okra seeds. The whole system includes the following equipment: an imaging spectrograph (ImSpector N17E; Spectral Imaging Ltd., Oulu, Finland); a high-performance CCD camera (C8484-05; Hamamatsu, Hamamatsu City, Japan) coupled with a camera lens (OLES22; Specim, Spectral Imaging Ltd., Oulu, Finland); two 150 W tungsten halogen lamps (Fiber-Lite DC950 Illuminator; Dolan Jenner Industries Inc., Boxborough, MA, USA); a mobile platform controlled by a stepper motor (Isuzu Optics Corp., Taiwan, China); and, a computer equipped with the data acquisition software (Xenics N17E, Isuzu Optics Corp., Taiwan, China) that controls the motor speed, exposure time, and so on. Next, a non-deformable and clear image should be obtained by the system. The spectral range of the hyperspectral imaging system whose spectral resolution is 5 nm is 874–1734 nm. The camera has 320 × 256 (spatial × spectral) pixels. In order to obtain clear and usable spectral images, relevant parameters of the test system need to be set before spectral collection. The height of the objective lens was set to 15 cm, the exposure time was set to 3 ms, and the moving speed of the platform was set to 15 mm/s. Before the spectral data and imaging process, the raw hyperspectral images should be corrected. The white reference image was acquired by using a white Teflon tile with nearly 100% reflectance. The black reference image was acquired by covering the lens completely with its opaque cap when the lights were all turned off. The calibrated image was calculated while using the following equation:
I C = I r a w I d a r k I w h i t e I d a r k
where I r a w is the raw hyperspectral image; I d a r k is the dark reference image and I w h i t e is the white reference image; I C is the calibrated hyperspectral image.

2.3. Spectral Collection

After near-infrared hyperspectral imaging acquisition, the spectral information of the whole images was collected. The spectral data of the okra seeds were collected at the wavelength range of 874–1734 nm. However, due to the influence of the surrounding environment and the optical equipment, the noise of the front and back ends of the spectrum was obvious. So, the obvious front and the rear bands of the noise were removed and the spectral data between 975.01–1645.82 nm was selected to obtain the average spectral image of the three kinds of okra seeds. To obtain the relevant information of okra seeds, the background and the region of interest should be segmented. The average spectrum of okra seeds was calculated by using the pixel’s spectrum of the region of interest. Firstly, the smoothed spectra were collected by applying wavelet transform (WT) which used Daubechies 8 with decomposition scale 3 to the raw spectra [20]. Then, image segmentation was performed based on the different reflectance values between the background and the seeds. Finally, the averaged spectrum of okra seeds was collected for further analysis and all of these processes were conducted in MATLAB (2013b).

2.4. Multivariate Data Analysis

Three different methods were used in the present study: principal component analysis (PCA), partial least squares discriminant analysis (PLS-DA), and support vector machine (SVM). Seed morphology was first used to explore the feasibility of seed classification of hybrid okra. PCA analysis was carried out to visually show the differences between different kinds of seeds by their average spectral characteristics. Since the full band spectrum contains a lot of redundant information, two methods of extracting the characteristic wavelengths were adopted in this study: successive projections algorithm (SPA) and competitive adaptive reweighted sampling (CARS). In addition to the 14 characteristic wavelengths extracted by SPA, CARS extracts 86 characteristic wavelengths—almost half of the total 200 bands. Thus, in order to reduce the number of characteristic wavelengths and to ensure the simplification of the models, SPA was used again to extract the characteristic wavelengths based on CARS. Next, the PLS-DA and SVM models that are based on the full spectrum and characteristic wavelengths were built. Finally, CARS-SPA-SVM combined with the image processing algorithm was used to draw the predicted pseudo-color map to show the classification results more intuitively.
PCA is a commonly used and effective data reduction compression algorithm and it has been used in NIR spectroscopy identification [23]. Its basic principle is to convert multiple related variables in the original data into a new comprehensive variable (principal component) through linear transformation. The main components of the first few contributions in the new variable cover the main information of the original data. Therefore, this article preserves the first three principal components and compares three types of okra seeds by comparing the spatial distribution of the samples on three principal components.
PLS-DA is a pattern recognition method that is widely used and classified by spectral data [24,25]. In this paper, the spectral data of the sample was used as the independent variable X, the class number was used as the dependent variable Y, and the PLS-DA model was established in the Unscrambler X 10.1 by the retention one method, and the prediction set sample was predicted based on this classification model. According to the absolute value of the difference between the sequence number of the sample and the predicted value of the model, the discriminant accuracy of the modeling set, and the prediction set was calculated. As the N value had a decimal number, the set threshold was 0.5 in the actual calculation. The parameters of the model were determined by the sum of the predicted residual squares.
SVM is a machine learning algorithm that is based on statistical learning Vapnik–Chervonenkis (VC) dimension theory and the structural risk minimization principle [26,27]. It can be used for qualitative and quantitative analysis of data. SVM maps the input space into high-dimensional space through the kernel function; it constructs the optimal classification plane to separate the two classes accurately and correctly, and it introduces the penalty coefficient and the relaxation coefficient (c, g) to make the correction. This ensures that that the classification interval of the two classes is the largest and it thus ensures minimum risk. SVM is widely used in data classification and analysis. In this paper, the model set and prediction set of MATLAB 2013b are input, the SVM program to identify the species of okra seed is run, and radial basis function (RBF) is used as a kernel function of the SVM model. The optimal (c, g) parameter combination is determined by the grid search method in the range of 2–8 to 28 optimization, and the accuracy of the output model is identified.
The quality of these classification models is evaluated by the classification recognition rate. If the predicted value obtained by these models is the same as the value that we have coded, we believe that the identification is correct. Furthermore, the classification recognition rate is calculated by identifying the ratio between the number of okra seeds whose identification is correct and the number of whole okra seeds.

2.5. Software Tools

Evince version 4.6 Hyperspectral image analysis soft package (ITT, Visual Information Solutions, Boulder, CO, USA) was used to analyze the hyperspectral image and MATLAB version R2013b (The Math-Works, Natick, MA, USA) was used to conduct multivariate data analysis. In addition, all of the graphs were designed using origin Pro 9.0 (Origin Lab Corporation, Northampton, MA, USA) software. The model performance was evaluated by the classification accuracy of the calibration set and the prediction.

3. Results and Discussion

3.1. Spectroscopic Analysis

A spectral image of the okra seeds that belong to our selected region is shown in Figure 1a and the trend of these lines that represent the components of the okra seeds is similar. Figure 1b shows the average spectra of all the samples that comprise three different varieties. Obvious and slight differences can be observed in Figure 1b. At the beginning and end of the band, the similarity between the male parent named xiaolusi and the hybrid offspring named penzai is relatively high, and the seeds of the female parent named xianzhi can be clearly distinguished from the other two species. In the middle band, the three are similar in the wave valley of the average spectrum, but the reflectivity is different, which can be used to separate the three different seeds. These changes may be due to the differences in the chemical and molecular structure of the progeny that is caused by different genetic effects of the parent, which all provide the basis for the subsequent chemometrics analysis [7,28]. Therefore, it is necessary to use NIR spectroscopy combined with chemometrics to establish discriminant models for the classification of seeds.

3.2. Principle Component Analysis of Spectral Data

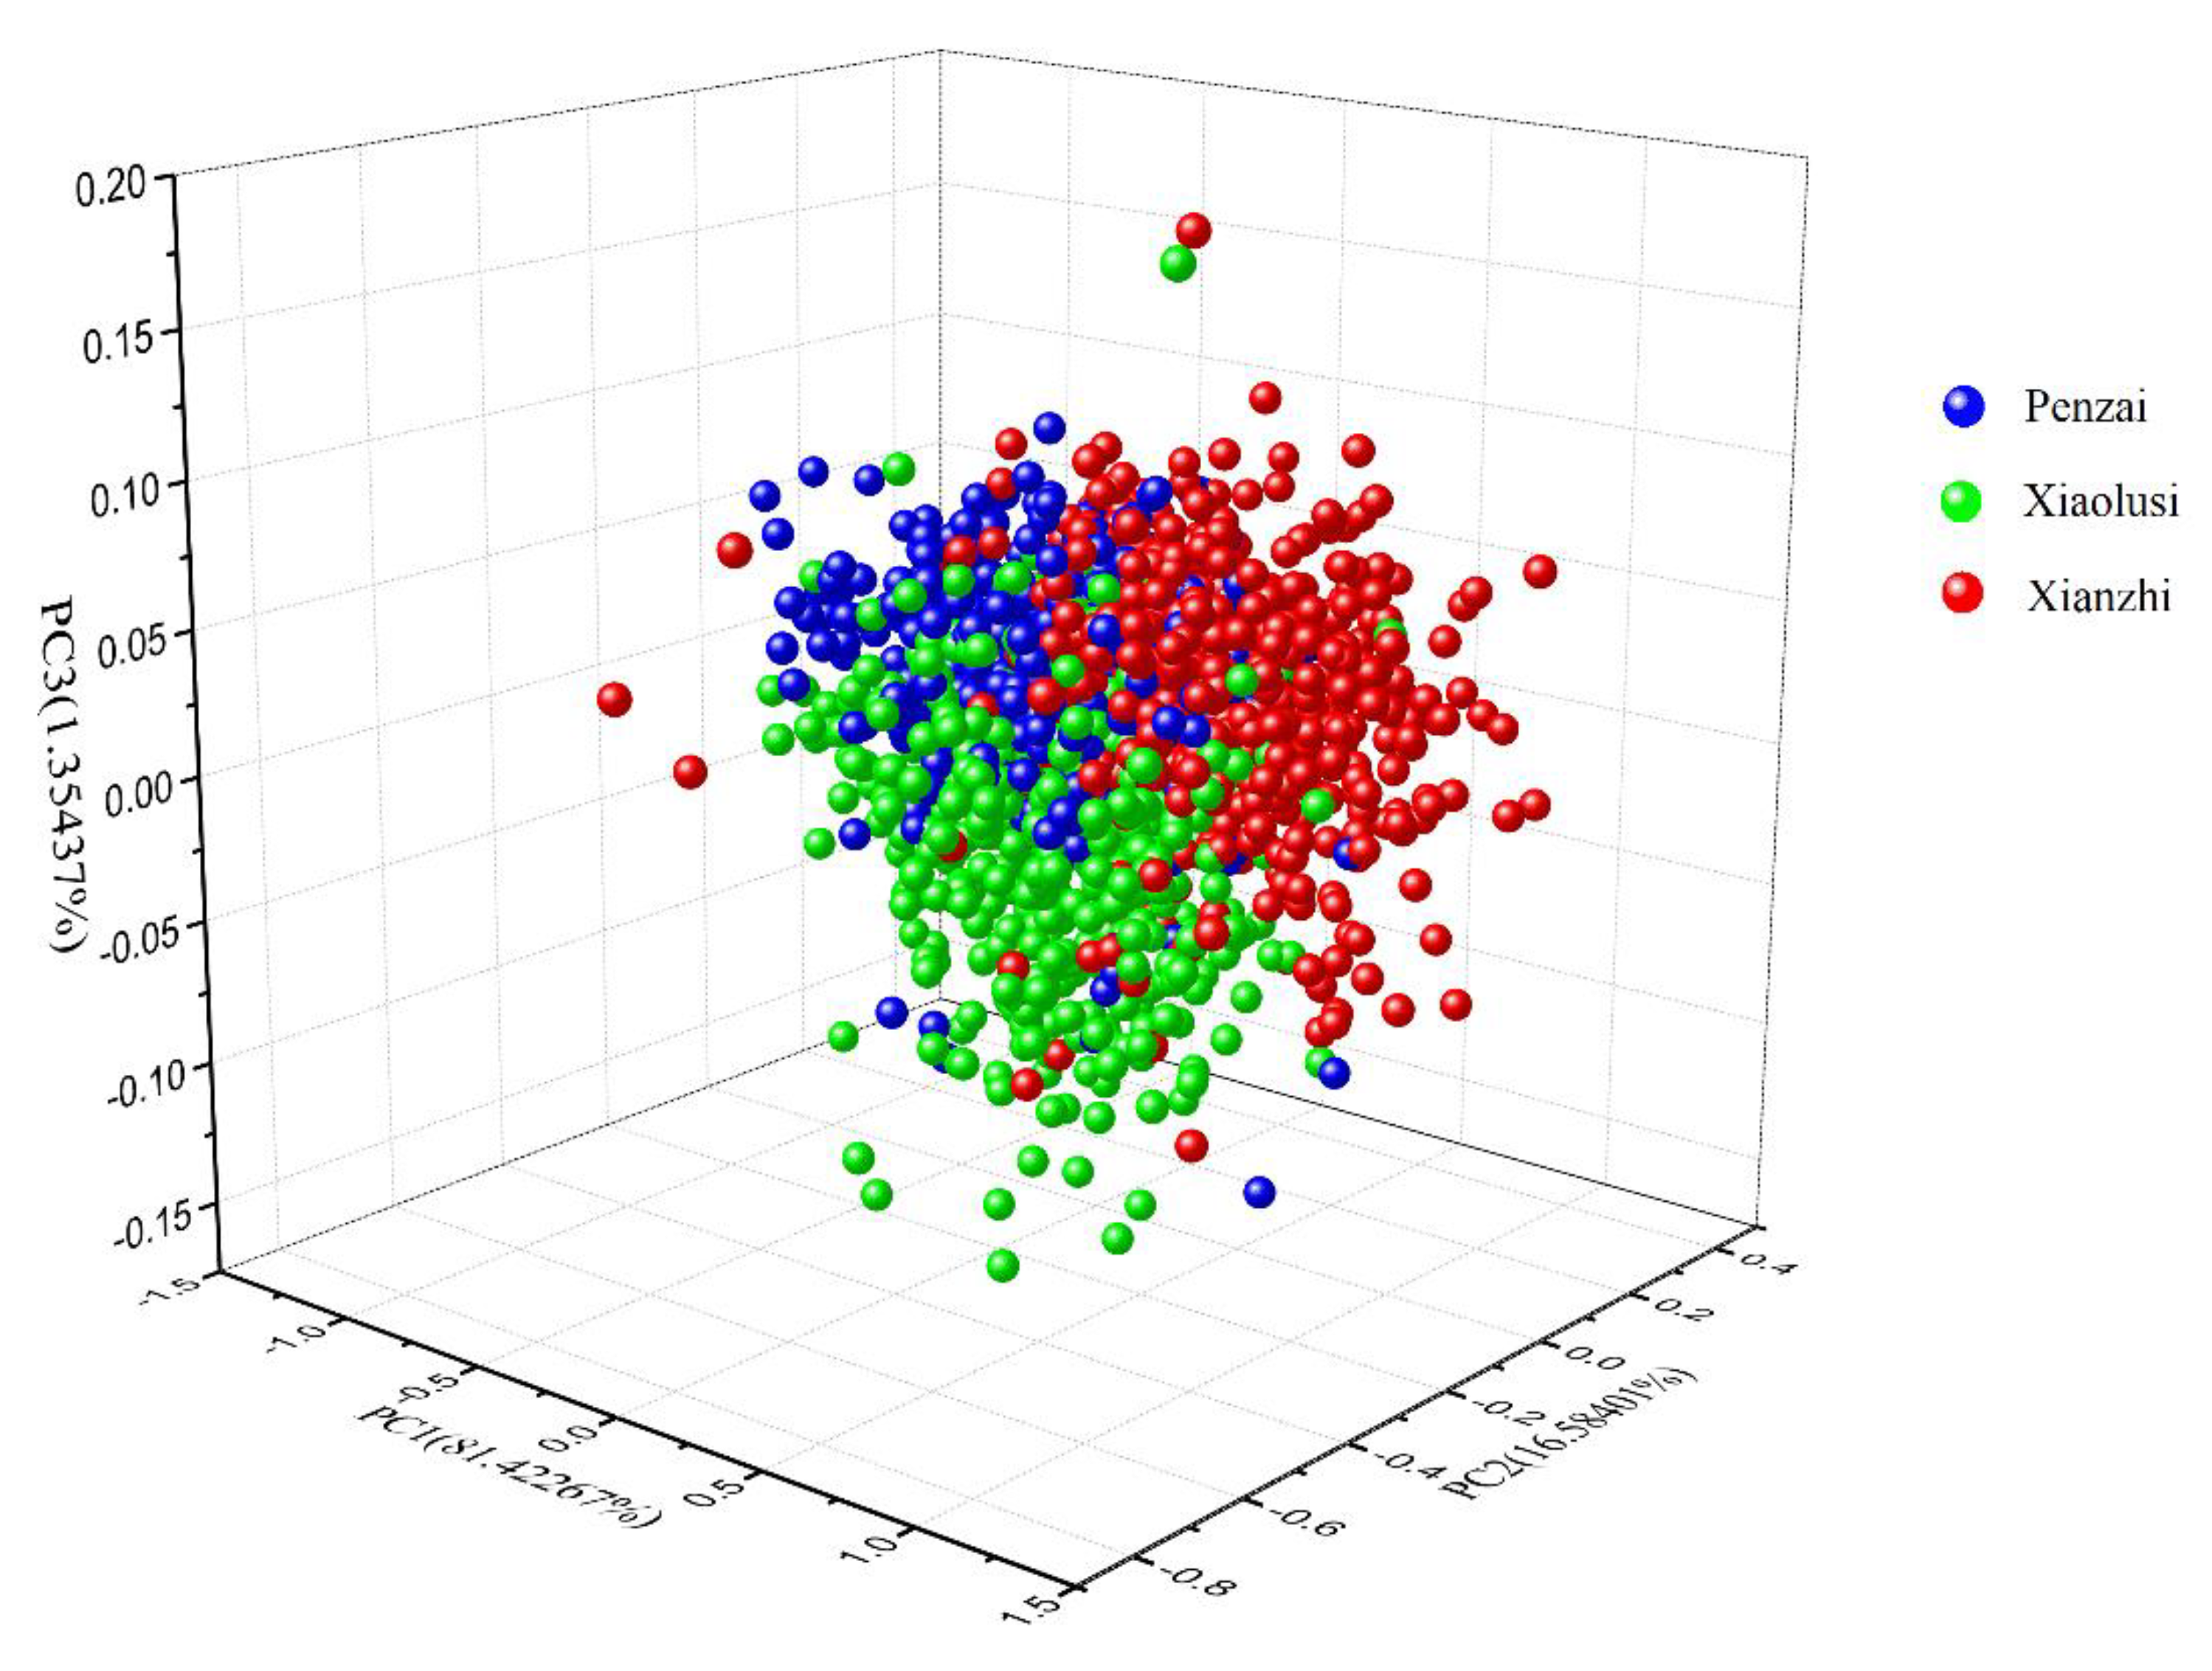
In order to explore the separability of different okra seeds, the PCA program that could minimize the interference of other useless data was applied to extract the critical components from the various spectral data [10,29,30]. The three-dimensional (3D) principal component (PC) score plot of all the samples is illustrated in Figure 2. All spectral data from a range of 975.01 to 1645.82 nm were analyzed and the explained variance rate of the first three principal components was 99.36%, of which the contribution rate of the first principal component (PC1) was 81.41%, the contribution rate of the second principal component (PC2) was 16.59%, and the contribution rate of the third principal component (PC3) was 1.36%. Such contribution rates explain the vast majority of variables. It was obvious that the three different varieties distributed separately, but their borders were unclear and overlapped. Distinguishing all three varieties of okra seeds was not easy by PCA. Conventional chemometric methods, such as PCA, might not be suitable for analyzing the spectral data of okra seeds [16,31]. Therefore, it is essential to conduct more modeling analyses to identify different kinds of okra seeds.

3.3. Classification Results and Analysis by the Discrimination Models Based on the Full Spectrum

Discrimination models which could classify the hybrid okra seeds were built based on the full spectrum. Firstly, PLS-DA and SVM were used to establish the discrimination models based on the full spectrum, and the accuracy of the classification recognition was used as an evaluation index of the model performance. As shown in Table 1, the classification ability of the SVM model, whose classification accuracy rate of the modeling set and the prediction set reached 99.31% and 93.62%, respectively, was obviously higher than that of the PLS-DA model. The correct recognition rate of the modeling set and the prediction set of the PLS-DA model reached 83.36% and 82.59%, respectively, which was also available for classification. Zhengjun Qiu et al. (2018) built SVM models to identify the variety of single rice seed [18]. Their accuracy of the training set and the test set reached 86.9% and 84.0%, respectively, which was not as good as our results. Xiaoling Yang et al. (2015) compared the classification results of waxy corn seeds while using the SVM model and the PLS-DA model [15]. They also found that the performance of SVM is better than PLS-DA on most types of selected input datasets. When comparing the classification results of the two discriminative methods, the differences may be due to the fact that the SVM model uses a radial basis function (RBF) as a kernel function, and it performs a grid search within the optimization range to obtain a global optimal parameter combination [26,27]. PLS-DA establishes a linear discriminant model, while the SVM algorithm establishes a non-linear model that can fully utilize the spectral information between different types and establish a classification model [24]. Therefore, the classification effect is significantly better than PLS-DA.

3.4. Selection of Effective Wavelengths

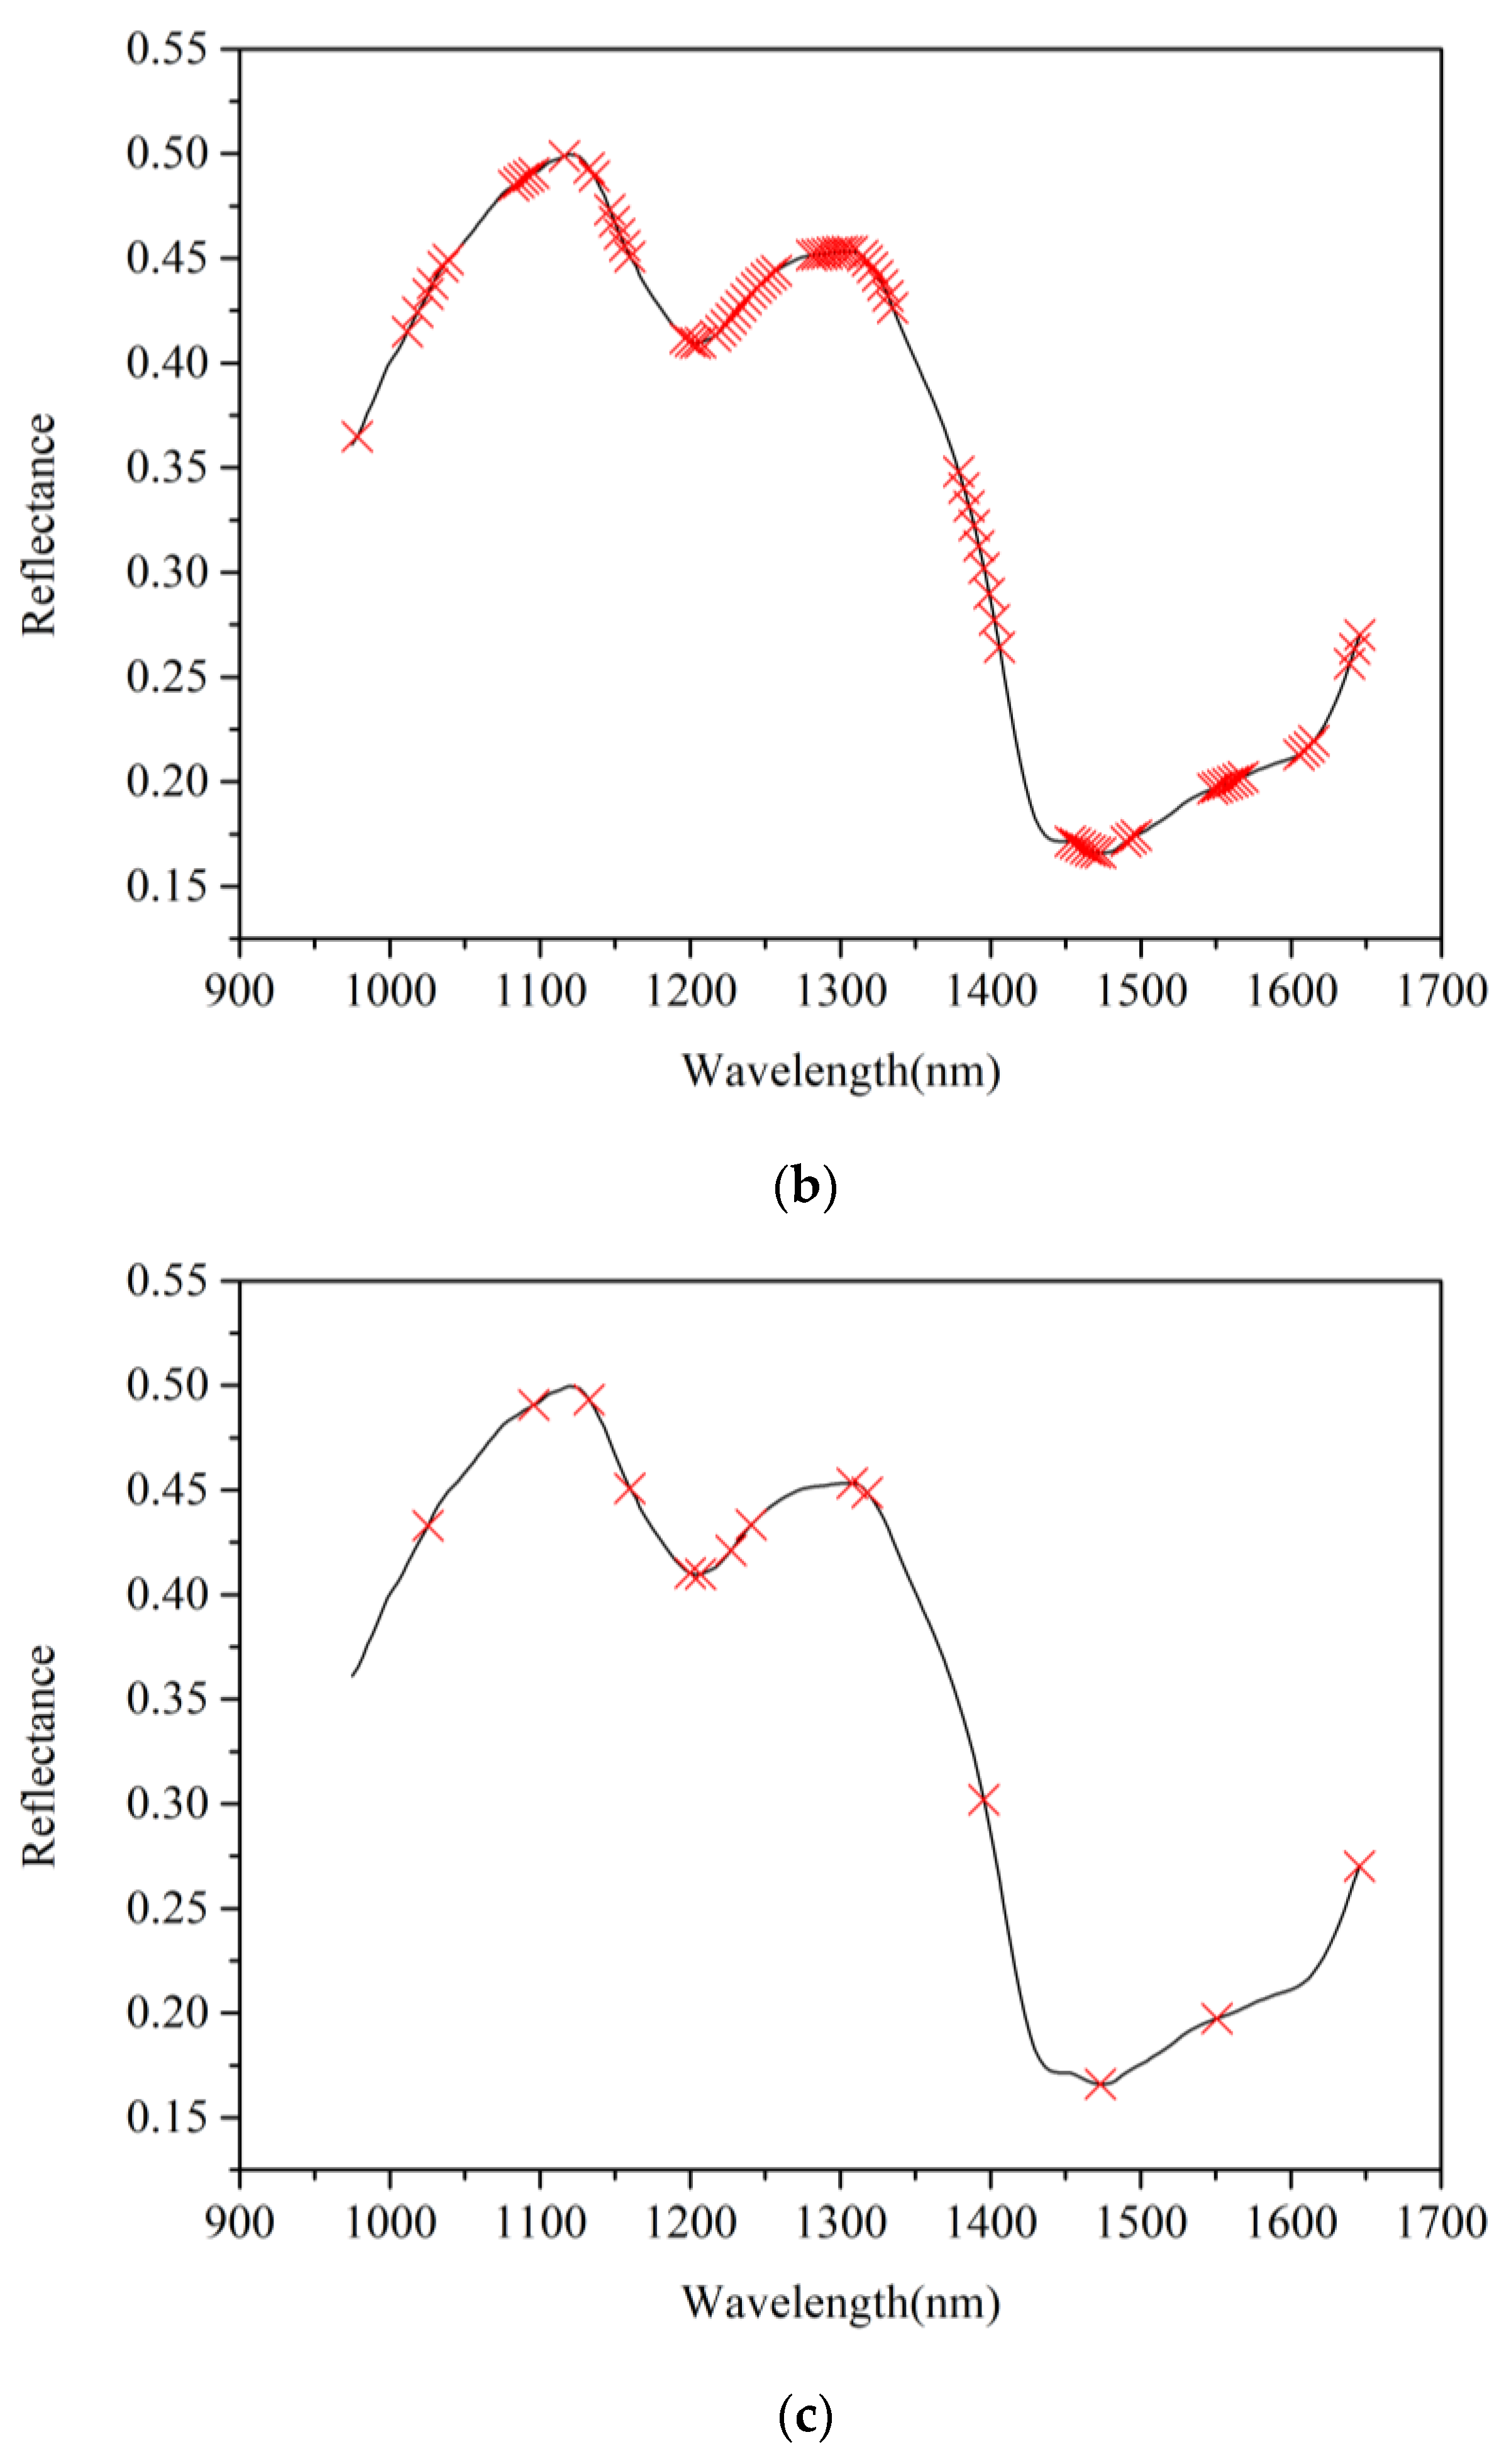
The whole band of spectral data contains redundant information, and, in order to increase the processing speed of the models and reduce the modeling time, two different algorithms that can extract the characteristic wavelength were applied in this study. Furthermore, a combination of two methods was used to obtain the optimal number of characteristic wavelengths. Figure 3a shows the characteristic wavelengths which were extracted by the successive projection algorithm (SPA). SPA is a forward feature variable selection method, which selects the combination of variables with minimal redundancy information and minimal collinearity, and it therefore has a wide range of applications in spectral feature wavelength selection [32,33,34,35]. Fourteen characteristic wavelengths were acquired. The band found near 1065 nm is related to the O-H stretching vibration [36]. The spectral regions which include 1041–1143 nm, 1211–1225 nm, 1360–1390 nm, and 1621–1654 nm are related to the C-H stretching vibration [36]. The band at around 1472 nm is related to the N-H stretching vibration [36]. These groups exist in amino acids and other substances found in okra seeds, such as leucine, lysine, valine, and phenylalanine [37], indicating that the selected characteristic wavelength is representative and it can be used to establish an effective and reliable discriminant analysis model.
CARS, a characteristic wavelength selection method, is based on Monte Carlo sampling and PLS regression coefficients. It was used to choose the optimal wavelengths. Initially, 86 characteristic wavelengths were extracted from the 200 full-band wavelengths. Although there is a certain degree of deletion for the whole band, it could be more concise. Figure 3b shows the distribution of characteristic wavelengths that were selected by CARS. Therefore, in this study, in order to further reduce the number of characteristic wavelengths, CARS was further screened in conjunction with SPA. Finally, 14 characteristic wavelengths were selected. The changes of the distribution of optimal wavelengths are shown in Figure 3c. All of the bands that are selected by CAR + SPA are related to the stretching vibration of the functional groups, which include N-H group, C-H group, and C=O group [36]. According to some studies, the unsaturated fatty acids, proteins, and hydrocarbons of okra seeds also contain the corresponding functional groups [38].

3.5. Classification Results and Analysis by the Discrimination Models Based on the Characteristic Band Spectrum

Discrimination models were built based on the characteristic wavelengths to simplify the complexity and increase the operating speed. When it came to practical breeding applications, a detection device of hybrid okra seeds required faster processing speed and a more reliable model. SPA, CARS, and CAR + SPA were used to select the optimal wavelengths. The classification results using the SVM model were superior to the PLS-DA classification results that are shown in Table 2, and the CARS algorithm had better discrimination results than SPA and CARS + SPA. This may be because CARS extracts much larger characteristic wavelengths than the other two, and the spectrum contained sufficient active ingredients. Many studies have shown that there are differences in the internal content between the hybrid seeds and the parent, and near-infrared hyperspectral imaging could obtain the internal information of the okra seeds [1,2,20,22,24]. The classification accuracy rate of the prediction set of the SVM model that is based on CARS (94.83%) was even higher than the SVM model based on the whole band spectrum. However, the accuracy of the established classification discrimination model based on the characteristic wavelength was lower than the models based on the full spectrum. This was particularly evident in the classification results of the PLS-DA model. When comparing the two classification models based on SPA and CARS + SPA, the recognition rate was over 79%. After the characteristic wavelengths were extracted by CARS + SPA, SVM was used to establish the model whose classification accuracy rate of the modeling set and the prediction set reached 97.41% and 92.24%, respectively, which provided a new reference method for the breeding identification of hybrid okra seeds. Yiying Zhao et al. (2018) used SVM models to classify the variety of maize seeds [19]. Based on the optimal wavelengths, they achieved 93.85% calibration accuracy and 91.00% prediction accuracy, which was worse than our model. Wenwen Kong et al. (2013) established classification models to classify rice seed cultivar [39]. Their SVM models based on optimal wavelengths achieved classification accuracy rates of 97.30% and 89.47% for the modeling set and the prediction set, respectively, which was almost as good as our models. The good effect of CARS indicates that most of the spectral bands are valid for the classification of okra seeds. Excessive deletion of spectral data is likely to result in the loss of a lot of classification information, thus causing the other two methods to be unsatisfactory.
The results show that the near-infrared hyperspectral technology, when combined with the chemometrics method, can identify different kinds of okra seeds quickly and effectively and the SVM model has a good classification effect. Since okra seeds and their offspring were used as research subjects, there was a transmission of genetic information between parents and their offspring. Therefore, there was some overlap between the content of hybrid seeds and the content of material between parents, which forms a barrier to the identification of spectral classifications.

3.6. Visual Prediction of Okra Seeds

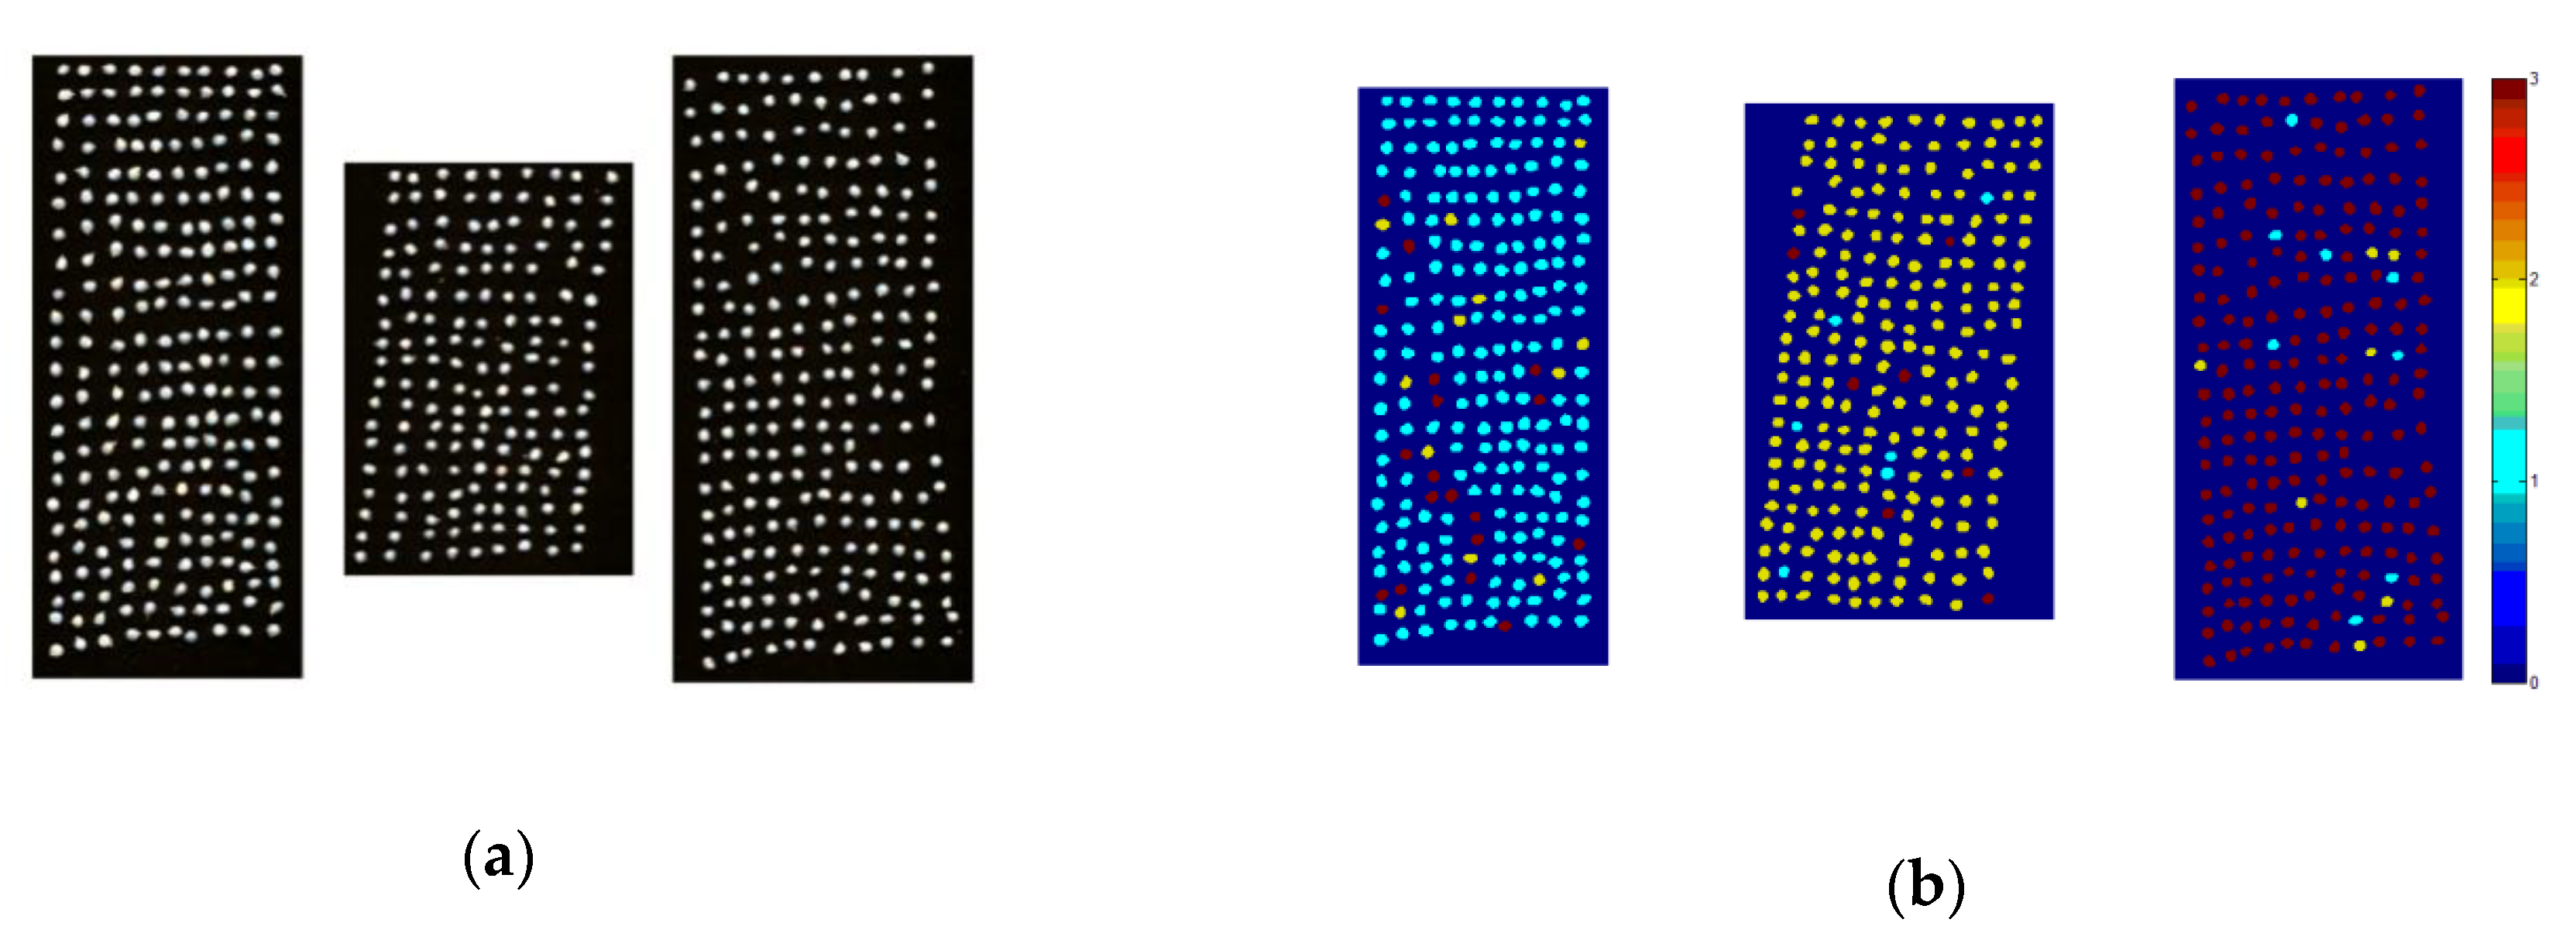
Hyperspectral images contain the spectral and spatial information of the samples simultaneously, and there is a certain correspondence that can be used by image processing technology between spectral and spatial information. In order to verify the performance of the classification model, the okra seed prediction maps were plotted based on the average spectrum of each seed in the hyperspectral image. The combination of the model and the image processing technology can generate a pseudo-color map for predicting the type of the sample, and distinguish different sample types with different colors, as well as to visualize the classification results intuitively. Because of the large amount of data in the full spectrum, the computational complexity is high, which is not conducive to the rapid prediction of the sample. Therefore, this paper selected the SVM model based on the optimal wavelengths extracted by the CARS algorithm as the classification model. The average spectrum of each okra seed in the hyperspectral image was taken as input, and the three different types of okra seeds were selected to be 686 grains in total. The original seed map and prediction map are shown in Figure 4. In Figure 4, blue refers to the female parent (xianzhi), yellow refers to the father (xiaolusi), and red refers to the hybrid seed (penzai). Comparing Figure 4a,b, the three different kinds of okra seeds can hardly be distinguished by the naked eye in the original map. There were some misjudgments in the classification images of the three okra seeds, but the overall correct discrimination rate is 91.41%. Affected by factors such as hyperspectral image segmentation algorithms and image resolution, the okra seeds in the visualized pseudo-color map have undergone some deformation, but most of them are still intact and they do not affect the identification and analysis. This method can be used to make rough preliminary judgments on the species of hybrid okra seeds, which provides a new method for the rapid and accurate screening of seeds in the process of cross breeding.

4. Conclusions

In this study, three types of okra seeds were identified using near-infrared hyperspectral imaging technology. A total of 1740 okra seeds were selected as the samples, of which 1160 seeds were used as the modeling set and 580 seeds were used as the prediction set. The PCA method was used to process the spectral data to initially observe the classification of the three types of okra seeds. Fourteen characteristic wavelengths were selected using the SPA algorithm, and 86 characteristic wavelengths were extracted using the CARS algorithm. Fourteen characteristic wavelengths were further extracted using the SPA algorithm based on the wavelengths that were extracted by CARS to simplify the models. PLS-DA and SVM discriminant models that were based on the full spectrum and the optimal spectrum were established. When compared with the two algorithms, the SVM algorithm is more effective at classifying the hybrid okra seeds. The recognition rate of the modeling set and the prediction set of the full-band discrimination model reached 99.31% and 93.62%, respectively. The characteristic wavelengths that were extracted by using CARS had a better modeling effect. The recognition rates of the modeling set and the prediction set reached 98.71% and 94.83%, respectively. Using the CARS + SVM model combined with image processing techniques, a pseudo-color map of category classification was generated to identify different kinds of okra seeds. The results show that the near-infrared hyperspectral image technology combined with chemometrics can identify the species of okra’s parent and hybrid offspring, and provide methods and ideas for the later rapid detection methods of okra hybrid breeding. Future experiments will focus on expanding the information on the number of species of okra seeds to form a spectroscopic database of okra seeds to improve the reliability and stability of the classification and identification model, so as to classify the hybrid okra seeds more quickly and efficiently.

Author Contributions

X.F. designed the entire core architecture and J.Z. and X.L. performed the experiments; J.Z. summarized and processed the data; J.Z. wrote the article; Y.H. is a principle investigator for this project and a corresponding author.

Funding

This research was funded by the National Key R&D program of China (2016YFD0300606), and National Natural Science Foundation of China (Grant No. 31801257).

Acknowledgments

We are thankful to the Zhejiang Academy of Agricultural Sciences, Zhejiang, China for technical support in the process of obtaining the hybrid seeds. I also want to thank my girlfriend Ling Lu for her spiritual support and I am happy to have such a wonderful research life.

Conflicts of Interest

The authors declare no conflict of interest. The funders had no role in the design of the study; in the collection, analyses, or interpretation of data; in the writing of the manuscript, or in the decision to publish the results.

References

  1. Kumar, P.S.; Sreeparvathy, S. Studies on heterosis in okra (Abelmoschus esculentus (L.) Moench). Electron. J. Plant Breed. 2010, 1, 1431–1433. [Google Scholar]
  2. Reddy, M.T.; Babu, K.H.; Ganesh, M.; Begum, H.; Babu, J.D. Exploitation of hybrid vigour for yield and its components in okra [Abelmoschus esculentus (L.) Moench]. Am. J. Agric. Sci. Technol. 2013, 1, 1–17. [Google Scholar] [CrossRef]
  3. Adelakun, O.E.; Oyelade, O.J.; Adeomowaye, B.I.; Adeyemi, I.A.; Van, D.V.M. Chemical composition and the antioxidative properties of nigerian okra seed (Abelmoschus esculentus Moench) flour. Food Chem. Toxic. 2009, 47, 1123–1126. [Google Scholar] [CrossRef]
  4. Arapitsas, P. Identification and quantification of polyphenolic compounds from okra seeds and skins. Food Chem. 2008, 110, 1041–1045. [Google Scholar] [CrossRef] [PubMed]
  5. Xia, F.; Zhong, Y.; Li, M.; Chang, Q.; Liao, Y.; Liu, X.; Pan, R. Antioxidant and anti-fatigue constituents of okra. Nutrients 2015, 7, 8846–8858. [Google Scholar] [CrossRef] [PubMed]
  6. Hu, L.; Yu, W.; Li, Y.; Prasad, N.; Tang, Z. Antioxidant activity of extract and its major constituents from okra seed on rat hepatocytes injured by carbon tetrachloride. Biomed. Res. Int. 2015, 2014, 341291. [Google Scholar] [CrossRef] [PubMed]
  7. Maciel, G.M.; Luz, J.M.; Campos, S.F.; Finzi, R.R.; Azevedo, B.N.; Maciel, G.M.; Luz, J.M.; Campos, S.F.; Finzi, R.R.; Azevedo, B.N. Heterosis in okra hybrids obtained by hybridization of two methods: Traditional and experimental. Hort. Bras. 2017, 35, 119–123. [Google Scholar] [CrossRef]
  8. Seth, T.; Chattopadhyay, A.; Chatterjee, S.; Dutta, S.; Singh, B. Selecting parental lines among cultivated and wild species of okra for hybridization aiming at YVMV disease resistance. J. Agric. Sci. Technol. 2016, 18, 751–762. [Google Scholar]
  9. Das, S.; Chattopadhyay, A.; Dutta, S.; Chattopadhyay, S.B.; Hazra, P. Breeding okra for higher productivity and yellow vein mosaic tolerance. Int. J. Veg. Sci. 2013, 19, 58–77. [Google Scholar] [CrossRef]
  10. Yin, W.; Zhang, C.; Zhu, H.; Zhao, Y.; He, Y. Application of near-infrared hyperspectral imaging to discriminate different geographical origins of chinese wolfberries. PLoS ONE 2017, 12, e0180534. [Google Scholar] [CrossRef] [PubMed]
  11. Rodríguez-Pulido, F.J.; Barbin, D.F.; Sun, D.W.; Gordillo, B.; González-Miret, M.L.; Heredia, F.J. Grape seed characterization by NIR hyperspectral imaging. Postharvest Biol. Technol. 2013, 76, 74–82. [Google Scholar] [CrossRef]
  12. Sun, J.; Jiang, S.; Mao, H.; Wu, X.; Li, Q. Classification of black beans using visible and near infrared hyperspectral imaging. Int. J. Food Prop. 2016, 19, 1687–1695. [Google Scholar] [CrossRef]
  13. Huang, M.; Tang, J.; Yang, B.; Zhu, Q. Classification of maize seeds of different years based on hyperspectral imaging and model updating. Comput. Electron. Agric. 2016, 122, 139–145. [Google Scholar] [CrossRef]
  14. Serranti, S.; Cesare, D.; Marini, F.; Bonifazi, G. Classification of oat and goat kernels using nir hyperspectral imaging. Talanta 2013, 103, 276–284. [Google Scholar] [CrossRef] [PubMed]
  15. Yang, X.; Hong, H.; You, Z.; Cheng, F. Spectral and image integrated analysis of hyperspectral data for waxy corn seed variety classification. Sensors 2015, 15, 15578–15594. [Google Scholar] [CrossRef] [PubMed]
  16. Gowen, A.A.; O’Donnell, C.P.; Cullen, P.J.; Downey., G.; Frias, J.M. Hyperspectral imaging—An emerging process analytical tool for food quality and safety control. Trends Food Sci. Technol. 2007, 18, 590–598. [Google Scholar] [CrossRef]
  17. Zhang, C.; Wang, Q.; Liu, F.; He, Y.; Xiao, Y. Rapid and non-destructive measurement of spinach pigments content during storage using hyperspectral imaging with chemometrics. Measurement 2017, 97, 149–155. [Google Scholar] [CrossRef]
  18. Qiu, Z.; Chen, J.; Zhao, Y.; Zhu, S.; He, Y.; Zhang, C. Variety identification of single rice seed using hyperspectral imaging combined with convolutional neural network. Appl. Sci. 2018, 8, 212. [Google Scholar] [CrossRef]
  19. Zhao, Y.; Zhu, S.; Zhang, C.; Feng, X.; Feng, L.; He, Y. Application of hyperspectral imaging and chemometrics for variety classification of maize seeds. RSC Adv. 2018, 8, 1337–1345. [Google Scholar] [CrossRef] [Green Version]
  20. Feng, X.; Zhao, Y.; Zhang, C.; Cheng, P.; He, Y. Discrimination of transgenic maize kernel using nir hyperspectral imaging and multivariate data analysis. Sensors 2017, 17, 1894. [Google Scholar] [CrossRef] [PubMed]
  21. Shrestha, S.; Knapič, M.; Žibrat, U.; Deleuran, L.C.; Gislum, R. Single seed near-infrared hyperspectral imaging in determining tomato (Solanum lycopersicum L.) seed quality in association with multivariate data analysis. Sens. Actuators B Chem. 2016, 237, 1027–1034. [Google Scholar] [CrossRef]
  22. Gao, J.; Li, X.; Zhu, F.; He, Y. Application of hyperspectral imaging technology to discriminate different geographical origins of jatropha curcas l. Seeds. Comput. Electron. Agric. 2013, 99, 186–193. [Google Scholar] [CrossRef]
  23. Zhang, S.; Jie, D.; Zhang, H. NIR spectroscopy identification of persimmon varieties based on pca-svm. Comput. Comput. Technol. Agric. IV 2010, 345, 118–123. [Google Scholar]
  24. Shao, Y.; Yuan, L.; Jiang, L.; Jian, P.; Yong, H.; Dou, X. Identification of pesticide varieties by detecting characteristics of chlorella pyrenoidosa using visible/near infrared hyperspectral imaging and raman microspectroscopy technology. Water Res. 2016, 104, 432–440. [Google Scholar] [CrossRef] [PubMed]
  25. Zhang, C.; Jiang, H.; Liu, F.; He, Y. Application of near-infrared hyperspectral imaging with variable selection methods to determine and visualize caffeine content of coffee beans. Food Bioprocess Technol. 2017, 10, 1–9. [Google Scholar] [CrossRef]
  26. Burges, C.J.C. A tutorial on support vector machines for pattern recognition. Data Min. Knowl. Discov. 1998, 2, 121–167. [Google Scholar] [CrossRef]
  27. Wu, D.; He, Y.; Feng, S.; Sun, D.W. Study on infrared spectroscopy technique for fast measurement of protein content in milk powder based on LS-SVM. J. Food Eng. 2008, 84, 124–131. [Google Scholar] [CrossRef]
  28. Düzyaman, E. Phenotypic diversity within a collection of distinct okra (Abelmoschus esculentus) cultivars derived from turkish land races. Genet. Resour. Crop Evol. 2005, 52, 1019–1030. [Google Scholar] [CrossRef]
  29. Williams, P.J.; Kucheryavskiy, S. Classification of maize kernels using NIR hyperspectral imaging. Food Chem. 2016, 209, 131–138. [Google Scholar] [CrossRef] [PubMed]
  30. Zhang, X.; Fei, L.; Yong, H.; Li, X. Application of hyperspectral imaging and chemometric calibrations for variety discrimination of maize seeds. Sensors 2012, 12, 17234–17246. [Google Scholar] [CrossRef] [PubMed]
  31. Noh, H.K.; Lu, R. Hyperspectral laser-induced fluorescence imaging for assessing apple fruit quality. Postharvest Biol. Technol. 2007, 43, 193–201. [Google Scholar] [CrossRef]
  32. Zhang, J.; Rivard, B.; Rogge, D.M. The successive projection algorithm (SPA), an algorithm with a spatial constraint for the automatic search of endmembers in hyperspectral data. Sensors 2008, 8, 1321–1342. [Google Scholar] [CrossRef] [PubMed]
  33. Nie, P.; Dong, T.; He, Y.; Xiao, S. Research on the effects of drying temperature on nitrogen detection of different soil types by near infrared sensors. Sensors 2018, 18, 391. [Google Scholar] [CrossRef] [PubMed]
  34. Li, X.; Xu, K.; Zhang, Y.; Sun, C.; He, Y. Optical determination of lead chrome green in green tea by fourier transform infrared (FT-IR) transmission spectroscopy. PLoS ONE 2017, 12, e0169430. [Google Scholar] [CrossRef] [PubMed]
  35. Xie, C.; Xu, N.; Shao, Y.; He, Y. Using FT-IR spectroscopy technique to determine arginine content in fermented cordyceps sinensis mycelium. Spectrochim. Acta Part A Mol. Biomol. Spectrosc. 2015, 149, 971. [Google Scholar] [CrossRef] [PubMed]
  36. Burns, D.A.; Ciurczak, E.W. Handbook of Near-Infrared Analysis; CRC Press: Boca Raton, FL, USA, 2008; pp. 211–230. [Google Scholar]
  37. Bryant, L.A.; Montecalvo, J.R.; Morey, K.S.; Loy, B. Processing, functional, and nutritional properties of okra seed products. J. Food Sci. 2010, 53, 810–816. [Google Scholar] [CrossRef]
  38. Agbo, E.A.; Nemlin, J.G.; Anvoh, B.K.; Gnakri, D. Characterisation of lipids in okra mature seeds. Int. J. Biol. Chem. Sci. 2010, 4, 184–192. [Google Scholar] [CrossRef]
  39. Kong, W.; Zhang, C.; Liu, F.; Nie, P.; He, Y. Rice seed cultivar identification using near-infrared hyperspectral imaging and multivariate data analysis. Sensors 2013, 13, 8916–8927. [Google Scholar] [CrossRef] [PubMed]
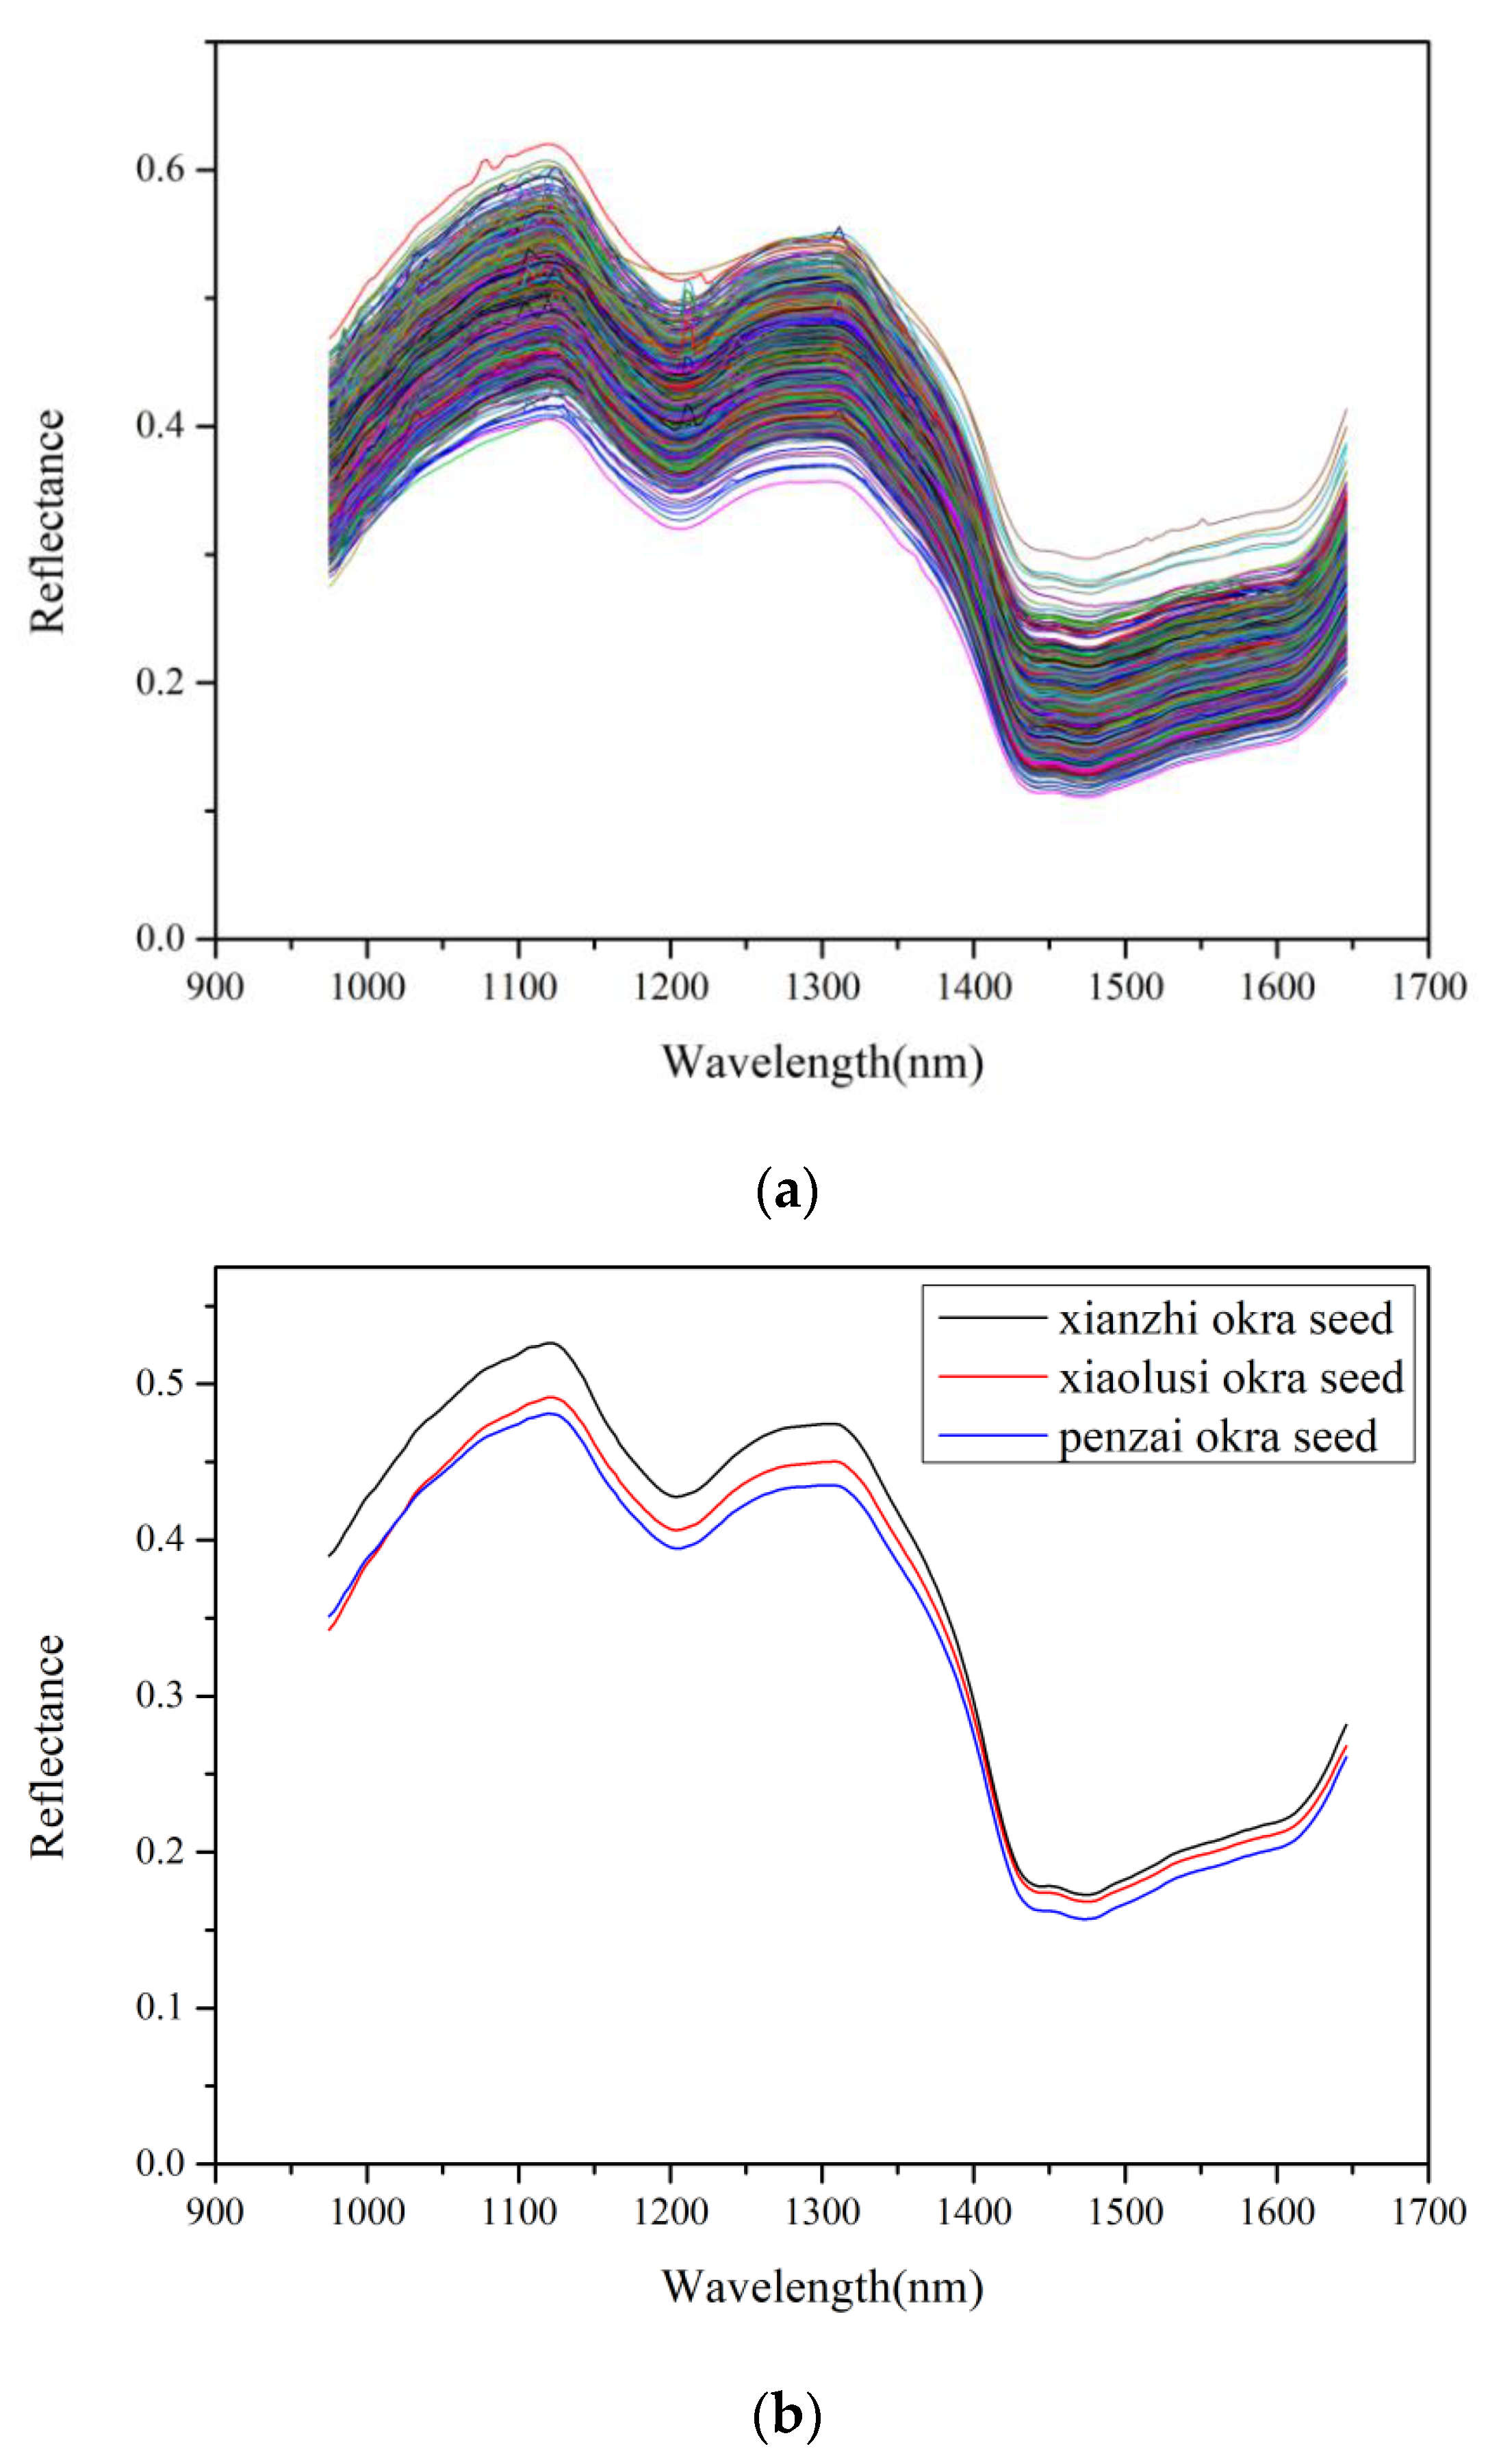
Figure 1. Spectral image of the okra seeds that were extracted from region of interest (ROI) using the near-infrared hyperspectral technology: (a) raw spectral image of all okra seeds; and, (b) average spectral image of three different varieties of okra seeds.
Applsci 08 01793 g001
Figure 2. The three-dimensional (3D) principal component (PC) score plot of three different varieties of okra seeds.
Applsci 08 01793 g002
Figure 3. The distribution spectral image of characteristic wavelengths selected by different methods: (a)the spectral image of characteristic wavelengths selected by successive projection algorithm (SPA); (b) the spectral image of characteristic wavelengths selected by competitive adaptive reweighted sampling (CARS); (c) the spectral image of characteristic wavelengths selected by CARS + SPA.
Applsci 08 01793 g003aApplsci 08 01793 g003b
Figure 4. Images of the three different strains of okra seeds: (a) The raw hyperspectral image; and, (b) The pseudo-color image; (from left to right: xianzhi, xiaolusi, penzai).
Applsci 08 01793 g004
Table 1. Comparison of discrimination results obtained by partial least squares (PLS) and support vector machine (SVM) models with the complete spectral data. PLS-DA: partial least squares discriminant analysis.
MethodsFull Wavelength
ParameterCalibration SetPrediction Set
PLS-DA983.36%82.59%
SVM(256, 5.2780)99.31%93.62%
Note: PLS-DA model’s parameter means the optimal number of LVs; SVM model’s parameter means different penalty parameters (c) and kernel function parameters (g), shown as (c, g).
Table 2. Discrimination results of the PLS-DA and SVM models based on characteristic wavelength. SPA: successive projection algorithm; CARS: competitive adaptive reweighted sampling.
MethodsPLS-DASVM
SPAParameter8Parameter(256, 27.8576)
Calibration Set79.74%Calibration Set95.34%
Prediction Set79.48%Prediction Set91.55%
CARS+SPAParameter9Parameter(256, 48.5029)
Calibration Set81.47%Calibration Set97.41%
Prediction Set79.31%Prediction Set92.24%
CARSParameter9Parameter(256, 9.1896)
Calibration Set84.40%Calibration Set98.71%
Prediction Set82.41%Prediction Set94.83%
Note: PLS-DA model’s parameter means the optimal number of LVs; SVM model’s parameter means different penalty parameters (c) and kernel function parameters (g), shown as (c, g).