Article

Dynamic and Quantitative Assessment of Blood Coagulation Status with an Oscillatory Rheometer

1
Department of Thoracic, Cardiac and Vascular Surgery, Clinical Research Laboratory, University Hospital Tuebingen, 72076 Tuebingen, Germany
2
Department of Micro- and Nanoanalytics, University of Applied Sciences Iserlohn, 58644 Iserlohn, Germany
*
Author to whom correspondence should be addressed.
Appl. Sci. 2018, 8(1), 84; https://doi.org/10.3390/app8010084
Submission received: 29 November 2017 / Revised: 22 December 2017 / Accepted: 4 January 2018 / Published: 9 January 2018
(This article belongs to the Section Chemical and Molecular Sciences)

Abstract

:
During open heart surgery, the haemostasis status of a patient has to be monitored permanently in order to quickly and reliably detect bleeding or coagulation-based disorders. Currently, no single medical device is available to provide a comprehensive solution for monitoring the coagulation status (coagulation, platelets and fibrinolysis). We intend to approach this problem with a rheological method. Here, we compared the performance of an oscillatory rheometer with a medical reference device, a ball coagulometer. Measuring the extrinsic coagulation (prothrombin time; PT), various heparin concentrations (0.5–2.0 IU/mL) could be differentiated and also discriminated from the intrinsic coagulation (activated partial thromboplastin time; aPTT) providing comparable clotting times between rheometer and ball coagulometer. In addition, the oscillatory rheometer was capable to detect the antagonising of heparin with the equimolar concentration of protamine and also the titration of various protamine concentrations (0.5–3.0 IU/mL) to a fixed heparin concentration (2 IU/mL). The addition of increasing concentrations of heparin to citrated blood prolonged the clotting time (CT), changed the slope calculated by linear regression of the elastic and viscous shear moduli (i.e., information of the coagulation process) and changed the value of the shear moduli at the end of the measurement (300 s). These results indicate that the oscillatory rheometer is capable to dynamically measure the haemostasis status with different activators and various inhibitor concentrations.

Graphical Abstract

1. Introduction

Annually, almost one million procedures in heart surgery are performed worldwide using a heart-lung machine [1]. The extracorporeal circulation (ECC) comprises several methods such as extracorporeal membrane oxygenation (ECMO) to provide respiratory support, extracorporeal life support (ECLS) and ventricular assist devices (VAD) to give cardiac support and dialysis [2,3]. Anticoagulants (e.g., heparin) are necessary to prevent life-threatening coagulation induced by the contact of blood with foreign surfaces [4]. To prevent bleeding or thrombosis during and after ECC, which can last several hours, a continuous monitoring of the coagulation status is necessary [5]. Currently, the modern intensive care does not provide a comprehensive point-of-care solution for the coagulation status and blood clotting problems, because a single medical device that fast and reliably detects all bleeding-based disorders (coagulation, fibrinolysis and platelet function) is lacking so far [2]. Thus, a haemostasis system that is able to perform fast and complex analyses with low or no sample preparation near the patient (point-of-care) is required.
Currently, there are many physical approaches to realise such a haemostasis system, but none can be used as a point-of care system so far. For example a nanomechanic device filled with hydrogels to measure single platelets within a microfluidic channel was suggested as additional platelet function assay [6], but measurement of coagulation dynamics would not be possible. The acoustic radiation force orthogononal excitation optical coherence elastography (ARFOE-OCE) as a non-contact measurement of coagulation in whole blood is advantageous being non-invasive, however, can only determine the elastic shear modulus so far [7]. A laser illumination of the blood sample is detected by a high speed complementary-metal-oxide-semiconductor (CMOS) camera in the Laser Speckle Rheology (LSR) method. A close correlation to conventional coagulation results was recorded by the researchers, still needing further improvements for a miniaturisation towards a hand-held LSR system [8,9].
We intend to address the point-of-care issue by rheometry, which can provide important information about the microstructure and dynamics of complex fluids such as polymer solutions and suspensions of colloid particles. Similar to those technical solutions, human whole blood is a complex suspension of various cell types and proteins that is subject to continuous variations. Mathematical models have shown a correlation between haematocrit and haemodynamic factors. Due to its diverse and changing states human whole blood can be regarded as a Newtonian as well as a non-Newtonian fluid [10,11].
Monitoring the changes in viscoelastic properties of blood clotting provides a real-time indicator of the blood coagulation status of a patient. The conversion of fibrinogen into insoluble fibrin through the enzyme thrombin is an important step in the coagulation process [12]. Afterwards, following the coagulation cascade, fibrin is cross-linked with aggregated platelets leading to a platelet-fibrin mesh. This increases the viscoelastic modulus of coagulated blood [13]. The clotting time (CT) can be obtained by measuring changes of viscoelastic properties of human whole blood, which is an important indicator of the patient’s coagulation status. During the coagulation process the viscoelastic modulus increases over time and the linear slope describes the dynamics of clot formation. The maximum plateau modulus provides information on clot firmness, which is dependent on blood fibrinogen level, fibrin cross-linking and platelet numbers [8].
In the long run, we intend to develop a small and relatively economical rheometer to be used in clinical diagnostics or even in a point-of-care setting. Here, the first step was to investigate if an already commercially used rheometer can detect the coagulation process and differentiate various coagulation assays. In this work, an oscillatory rheometer (‘Kinexus Pro’, Malvern Instruments GmbH, Herrenberg, Germany) was used to measure within the linear viscoelastic region, where a fluid can be reversibly deformed without being destroyed. Between two plates or a plate and a cone a sample is placed and sheared by oscillation. The sample properties determine the selection of the geometry. The cone/plate system is used for homogenous samples or dispersions with a certain particle size (Dmax ≤ 0.1 d; with Dmax particle size and d measuring gap), otherwise the plate/plate system is used. Two measurement modes can be performed to obtain all viscoelastic parameters (complex shear modulus G* with elastic/storage G′ and viscous/loss modulus G″). The first mode applies a sinusoidal angular displacement to the sample and is called deformation-controlled measurement. The second mode (shear stress controlled) applies a sinusoidal torque. This device can measure over frequency (up to 100 Hz) or over time. At low frequencies the low torque signal-to noise level limits the measurement. At higher frequencies inertia effects dominate the measurement [14,15,16]. As a medical reference device, the ball coagulometer was used where a stainless steel ball is kept within a magnetic field. It provides the clotting time in seconds, due to the displacement of the ball by a fibrin thread. The magnetic sensor detects this change in position and the time measurement is stopped. Common used coagulation assays with fibrin formation as end point, such as the Prothrombin time (PT, extrinsic coagulation pathway) or the activated partial thromboplastin time (aPTT, intrinsic coagulation pathway), as well as the fibrinogen concentration can be determined by the ball coagulometer [17,18,19]. Similarly to the ball coagulometer the oscillatory rheometer should also be able to provide the clotting time, but additionally the change of viscous and elastic shear moduli over time during coagulation process and the clot firmness in maximum shear moduli.
The purpose of the current study was to investigate the reliability and repeatability of the oscillatory rheometer and its possible limitations in detecting blood coagulation. To enable adaption of the rheometer for medical application a comparison between the oscillatory rheometer and a ball coagulometer (KC 1A, ABW Medizin und Technik GmbH, Lemgo, Germany) as a medical reference device was performed.

2. Materials and Methods

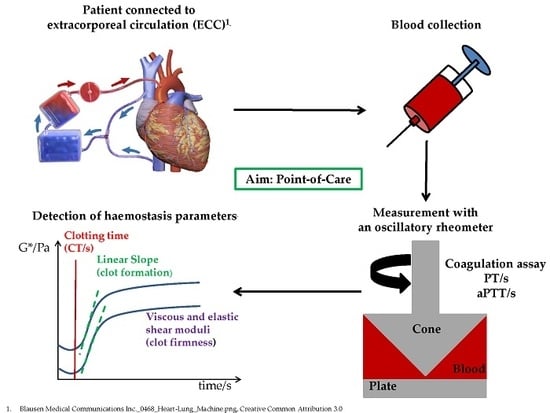
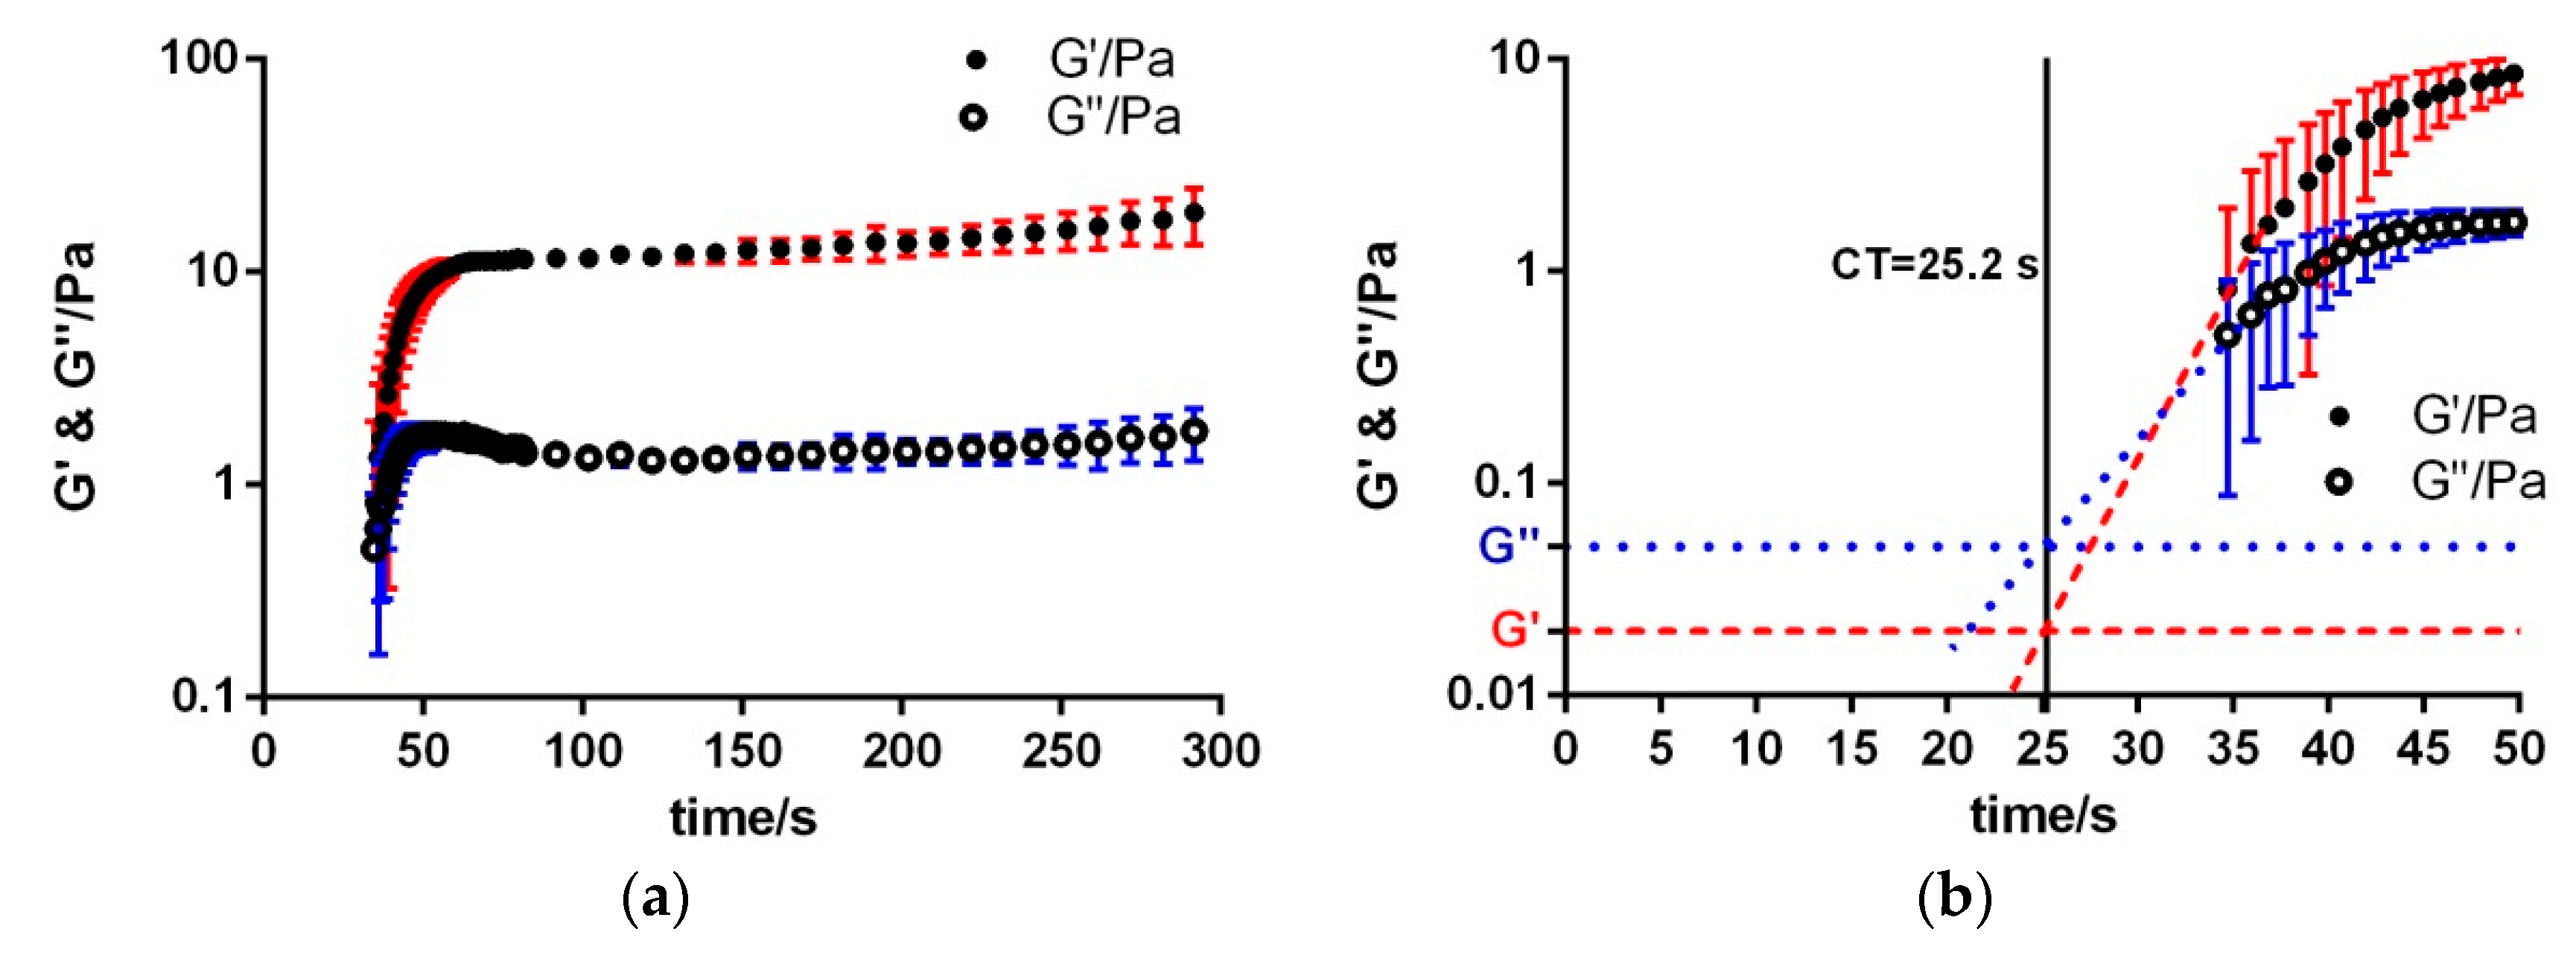
2.1. Oscillatory Rheometer

A shear stress-controlled measurement (0.01–20 Pa) was performed with Kinexus Pro (Malvern Instruments GmbH, Herrenberg, Germany) at different frequencies to verify which shear stress is located in the linear viscoelastic region. The sample properties determine the selection of the geometry. The oscillatory rheometer used here, was used with a plate/cone system in the shear stress-controlled measurement.
In preliminary experiments, a shear stress of 0.04 Pa with 1 Hz (for aPTT measurement 0.1 Hz) and a 1°/40 mm stainless steel cone geometry with a plate were determined as a compromise of device errors (torque and inertia effects) and measurement time. All measurements were performed at 37 °C. Additionally, a solvent trap was used to prevent drying effects of the sample. A pre-incubation of the blood sample at 37 °C for 2 min was performed before starting the experiment. For each measurement a sample volume of 350 µL was applied and ten independent repetitions performed (n = 10).

2.2. Ball Coagulometer (KC 1A)

As a medical reference device a ball coagulometer was used (KC 1A, ABW Medizin und Technik GmbH, Lemgo, Germany). Citrated blood was pre-incubated with a stainless steel ball in a cuvette at 37 °C for 2 min. Then the activators (Thromborel or Pathromtin and CaCl2, see below) were added to initiate the coagulation process. Inhibitors for coagulation (Na-heparin, see below) were used to prolong the coagulation process. For blood measurements 280 µL (n = 10) of blood—activator/inhibitor mixture was used.

2.3. Blood

Human whole blood was collected by venipuncture in citrate monovettes (0.106 mol/L Trisodium citrate, S Monovette 3 mL 9NC, Sarstedt AG, Nümbrecht, Germany) from healthy volunteers in accordance with the Research and Ethics Unit of the University of Tuebingen, Germany (project approval number 270/2010BO1). Trisodium citrate was chosen as anticoagulant as it reversibly removes the calcium ions in the human whole blood to inhibit the coagulation process. Prior to the blood collection, written informed consent was obtained from all blood donors. Criteria for the blood donators were no smokers, no intake of haemostasis affecting drugs such as acetylsalicylic acid at least 7 days prior to blood donation. Several blood donors were used, but within one test series with 10 repetitions, the same donor was used.

2.4. Prothrombin Time (PT)

Thromborel S (Siemens Healthcare Diagnostics Inc., Marburg, Germany) consists of a lyophilised thromboplastin from the human placenta (≤60 g/L), calcium chloride (about 1.5 g/L), stabilisers and preservatives. It is used to determine the prothrombin time (PT) according to the physician A.J. Quick, which is the function of the extrinsic coagulation system to measure the activities of the coagulation factors II, V, VII and X [20].
When used according to manufacturer’s instructions to determine the PT (two parts Thromborel S mixed with one part citrated blood), the blood is diluted strongly and the rheological properties are altered. Therefore, Thromborel was re-dissolved in a fifth of the recommended volume (2 mL water instead of 10 mL) to achieve a higher concentration and thus a smaller volume of the activator could be added to the blood, keeping the rheological properties closer to the physiological situation. 250 µL citrated blood and 100 µL Thromborel were incubated for 2 min at 37 °C. Afterwards both components were mixed and the coagulation process was initiated.

2.5. Activated Partial Thromboplastin Time (aPTT)

This coagulation assay can detect disorders of the intrinsic pathway. Heparin blood (0.5–3 IU/mL) is mixed with Pathromtin and incubated for 2 min at 37 °C. Pathromtin consists of silicone dioxide particles, vegetable phospholipids, sodium chloride (2.4 g/L), Hepes (pH = 7.6) and as preservative sodium azide (<1 g/L). To initiate the coagulation process CaCl2 (c = 0.025 mol/L) was added. The mixture was prepared with all components in equal volumes (1:1:1). The mixture is applied onto the surface of the oscillatory rheometer and the measurement is started manually.

2.6. Heparin and Protamine

Heparin-sodium (Ratiopharm Merckle GmbH, Blaubeuren, Germany, 25,000 IU/5 mL) was added to citrated blood to obtain a concentration of 0.5, 0.8, 1.0, 1.5, 2.0 and 3.0 IU/mL of heparin.
Heparin inhibits the activation of factor X and inhibits thrombin which is responsible for the transformation of fibrinogen to fibrin. By suitable choice of activators and anticoagulants, the coagulation can be selectively activated or inhibited.
Protamine (MEDA Pharma GmbH & Co. KG, Bad Homburg, Germany) was used to neutralise the effect of heparin. With 1 mL of protamine hydrochloride (c = 10 mg/mL; corresponding to 1000 IU/mL protamine) the effect of 1000 IU added heparin can be neutralised. At first the different heparin concentrations were neutralised by protamine. Additionally, a concentration series with different protamine units (0.5, 1.0, 1.5, 2.0 and 3 IU/mL) were examined on 2 IU/mL of Na-heparin.

2.7. Statistical Analyses

Data are presented as means with standard deviation (SD). Normally distributed data were analysed using One Way ANOVA (for the comparison of two parameters: t-test with F-test) with Bonferroni’s multiple comparison test to analyse differences between groups. Non-normally distributed data were analysed using a non-parametric test (Kruskal-Wallis test with Dunn’s multiple comparison post-hoc test; for comparison of two parameters: Mann-Whitney test). Statistical significance of clotting time (CT), linear slope of elastic and viscous shear moduli and viscous and elastic shear moduli at 300 s were defined as p < 0.05. All statistical analyses were performed using GraphPad Prism (Version 5, GraphPad Software, La Jolla, San Diego, CA, USA). Further diagrams were drawn with the help of Origin Pro 8 (Origin Lab Corporation, Northampton, MA, USA). Mathematical calculations such as the mean, standard deviation (SD) and the linear slope (regression analysis) at the beginning of a measurement were determined with Microsoft Excel 2013.

3. Results

Coagulation monitoring is of utmost importance during ECC and also in various diseases [21]. Here, we investigated the viscoelastic properties over time during coagulation using the oscillatory rheometer and compared the obtained data to a medical reference device (ball coagulometer KC 1A). For the device of interest, the oscillatory rheometer, repeatability was assessed for the most commonly used coagulation measurements. As coagulation without activator varies considerably, different activators and inhibitors were used in order to increase repeatability. First, activation with Thromborel (Prothrombin time, PT), which, due to its fast action, reduces variability between blood donors, was used as reference measurement. Later on, activated partial thromboplastin was measured and protamine antagonism of heparin as well as protamine titration was performed.

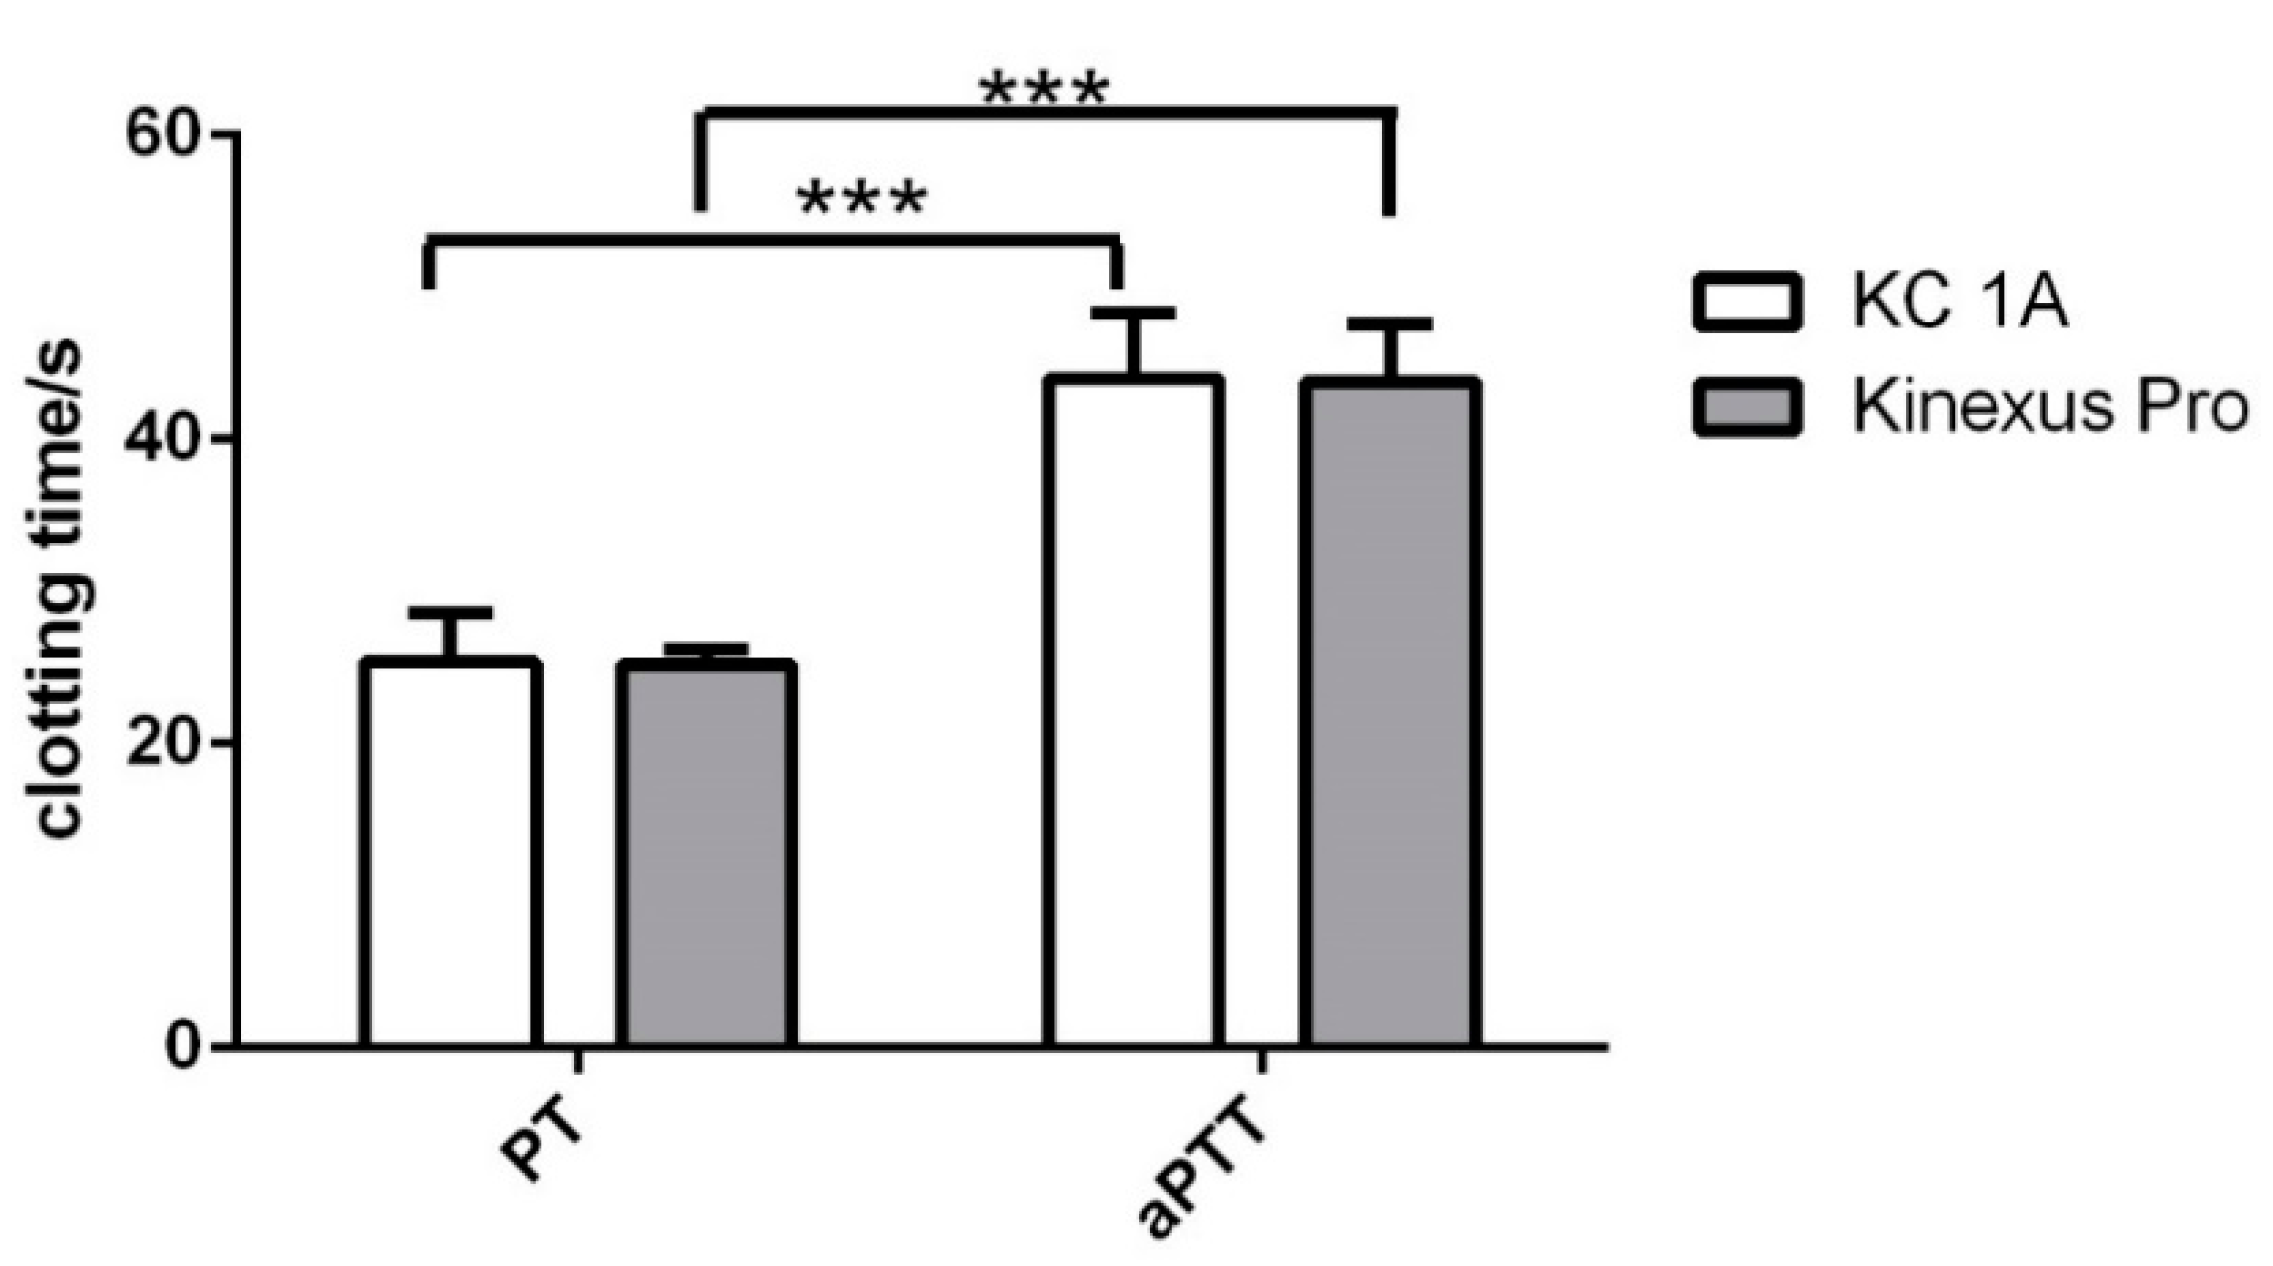
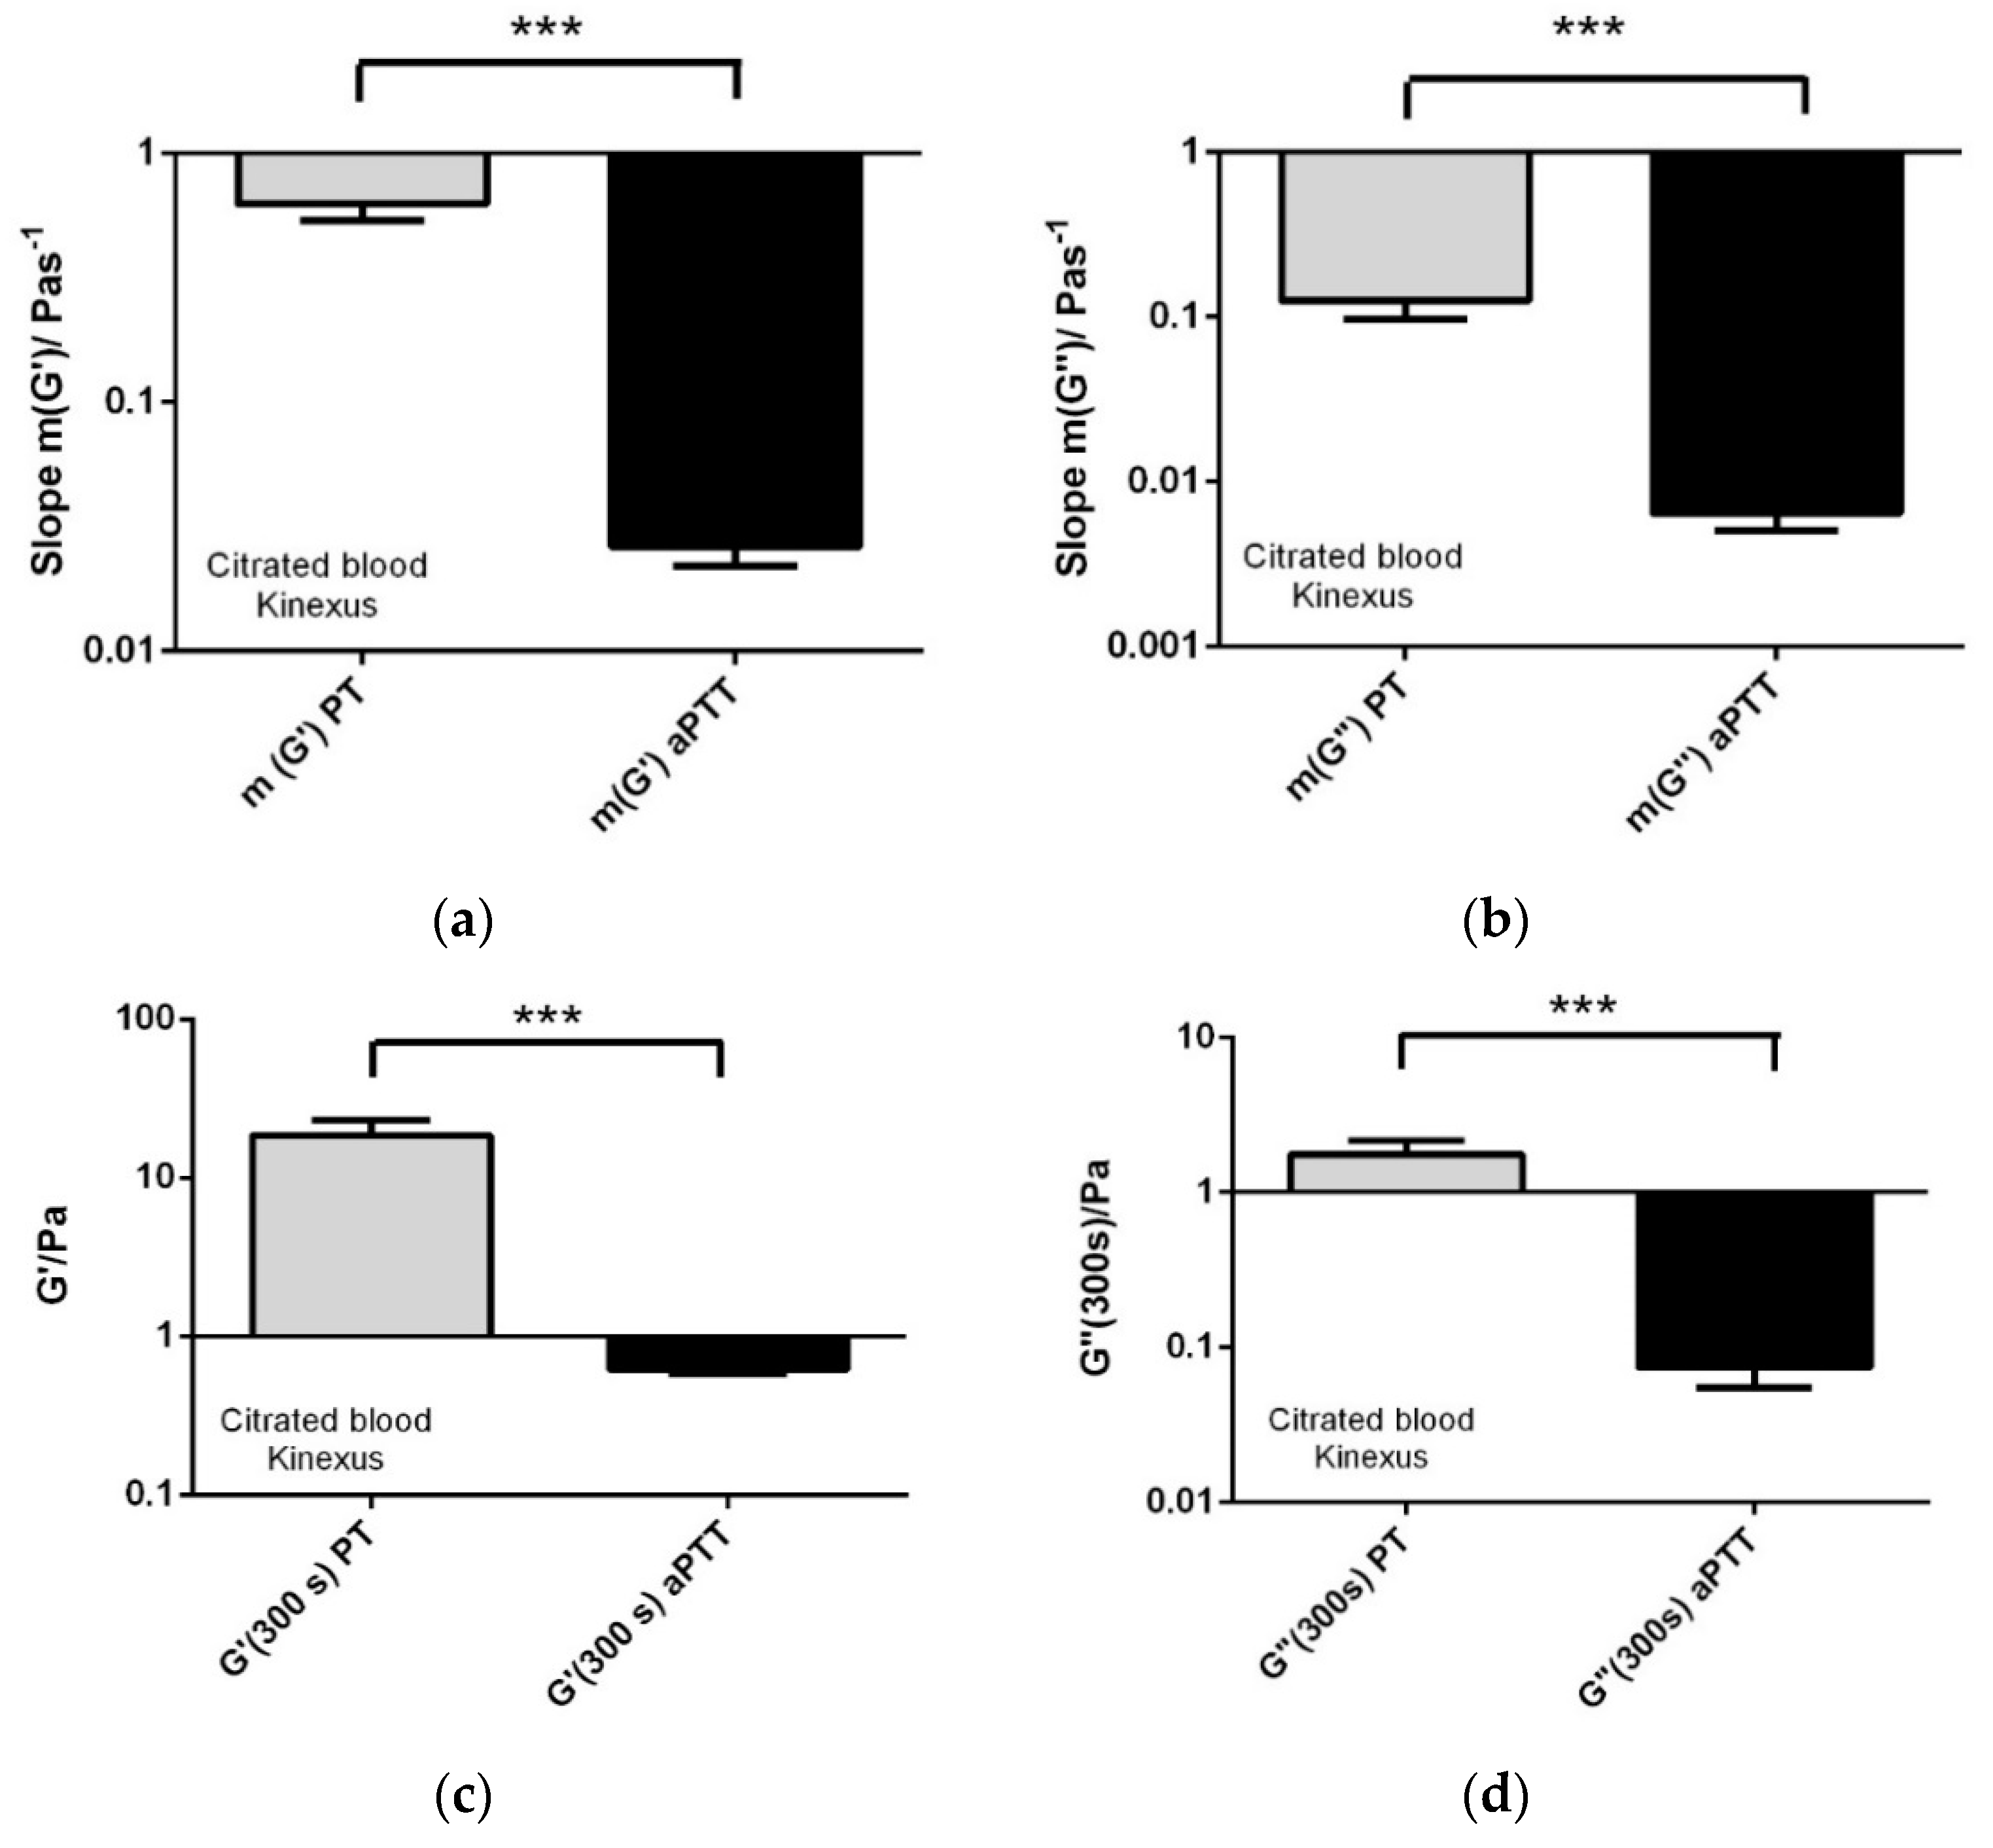
3.1. Extrinsic Coagulation

The strong activation of the extrinsic coagulation by tissue factor (Thromborel) can be seen in Figure 1. Repeated measurements (n = 10) of Thromborel-activated blood from the same donor are shown over time (300 s). The data of uncoagulated blood were taken from literature, where an elastic shear modulus of 0.02 Pa (blue dashed line) and a viscous shear modulus of 0.05 Pa (red dashed line) at 1 Hz are given and shown here as a constant dashed line in the diagram [22]. Upon addition of Thromborel coagulation is initiated and the means of viscous and elastic shear modulus increase (Figure 1a). The clotting time (CT) was graphically determined as the intersection between the shear moduli of uncoagulated citrated whole blood (dashed lines) and the linear slope of the shear moduli of citrated blood with the activator Thromborel (see enlarged section in Figure 1b). The identified mean CT by the oscillatory rheometer (25.2 ± 1.2) s was comparable to the provided reference measurement determined by the ball coagulometer (25.4 ± 3.3) s.
Apart from simply determining the CT, the oscillatory rheometer is able to provide further information on the coagulation status, which are summarised in Table 1. The linear slope at the beginning of the measurement describes the change of the shear moduli over time, i.e., this parameter provides information about the dynamics of the coagulation process. The linear slopes (m) of the elastic and viscous shear moduli of citrated blood activated with Thromborel were (600.0 × 10⁻³ ± 8.0 × 10⁻³) Pa/s and (100.0 × 10⁻³ ± 0.029) Pa/s, respectively. At approximately 60 s the initially steep slopes of elastic and viscous shear moduli level out but still increase at a constant albeit very small rate. To compare the shear moduli or clot firmness respectively of each measurement, the timepoint at 300 s was chosen arbitrarily, where the values of viscous and elastic shear modulus were taken in the plateau phase of the experiment. The elastic component measured (18.5 ± 4.5) Pa and the viscous shear modulus (1.7 ± 0.4) Pa. The subsequent measurements with citrated blood and various heparin concentrations were compared with these initial data.

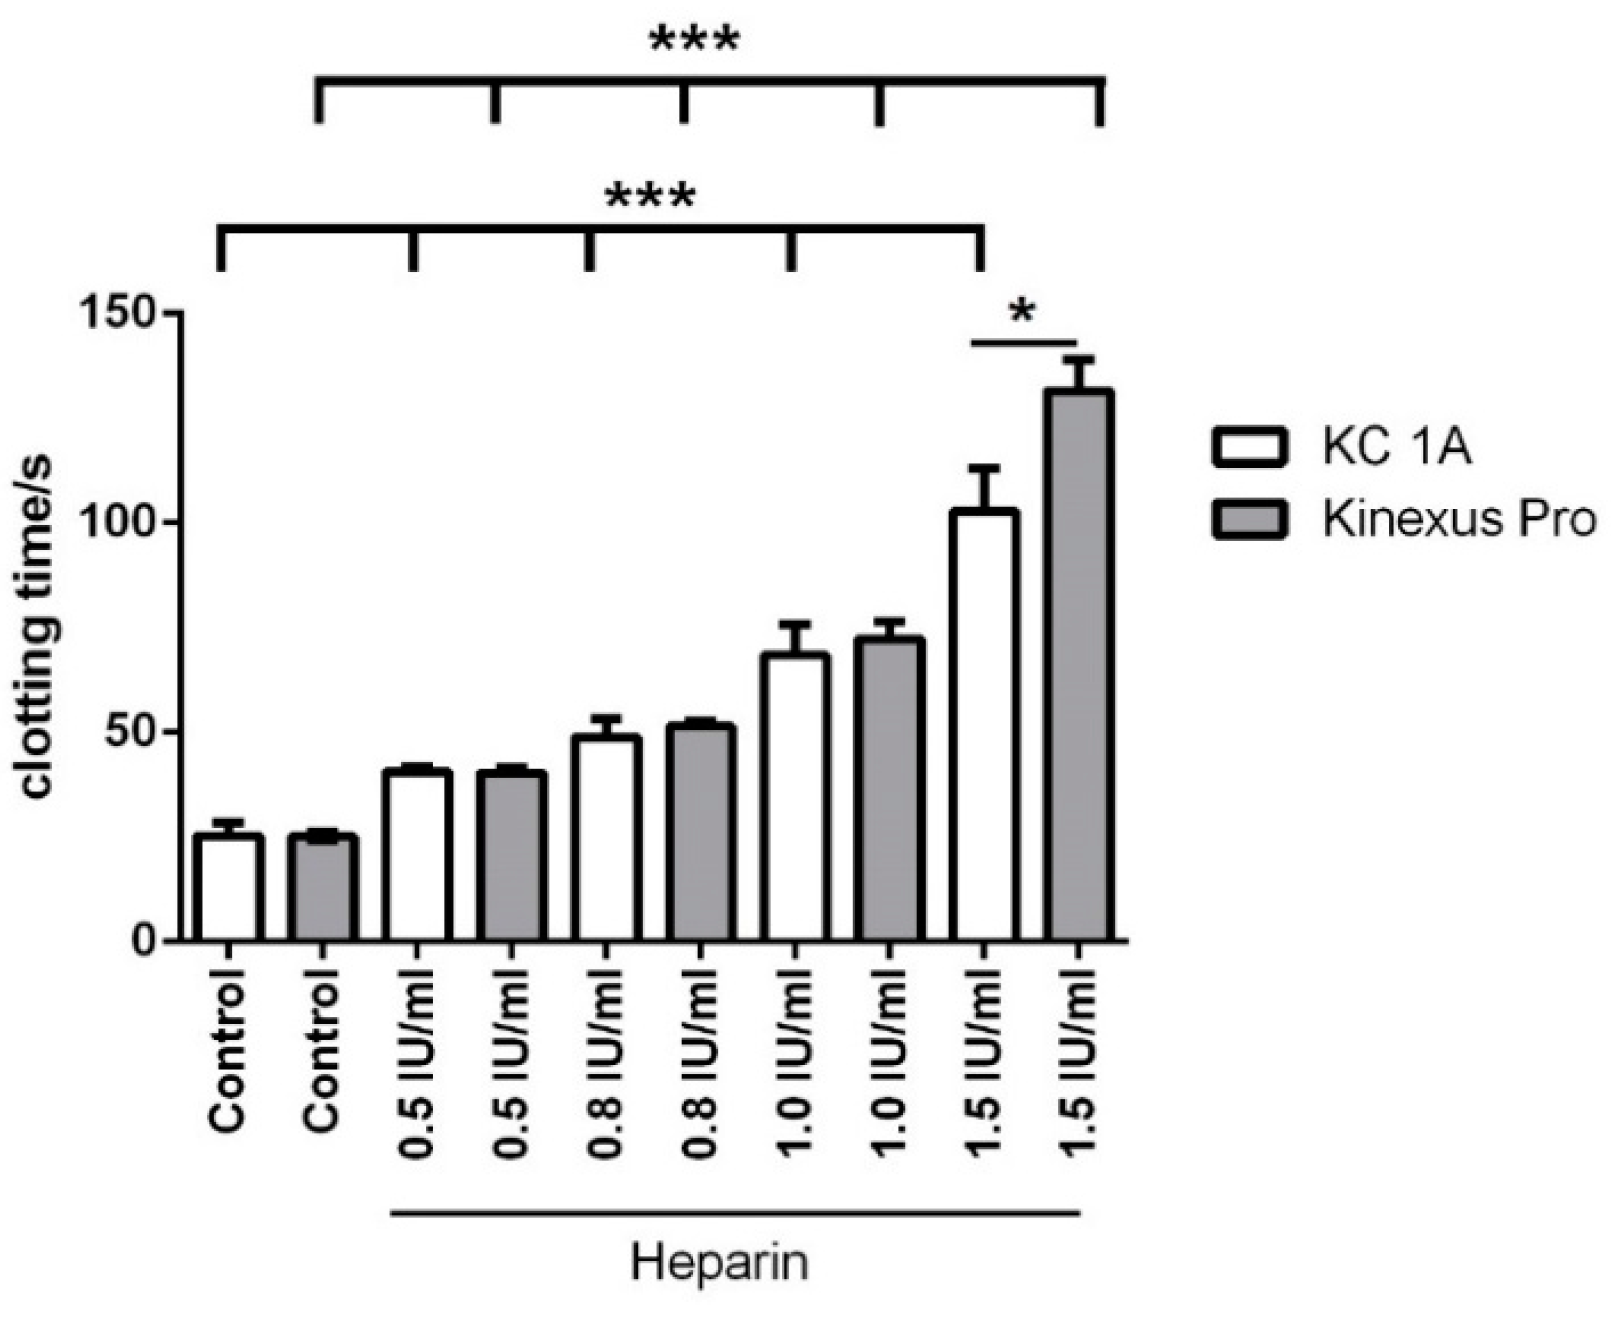
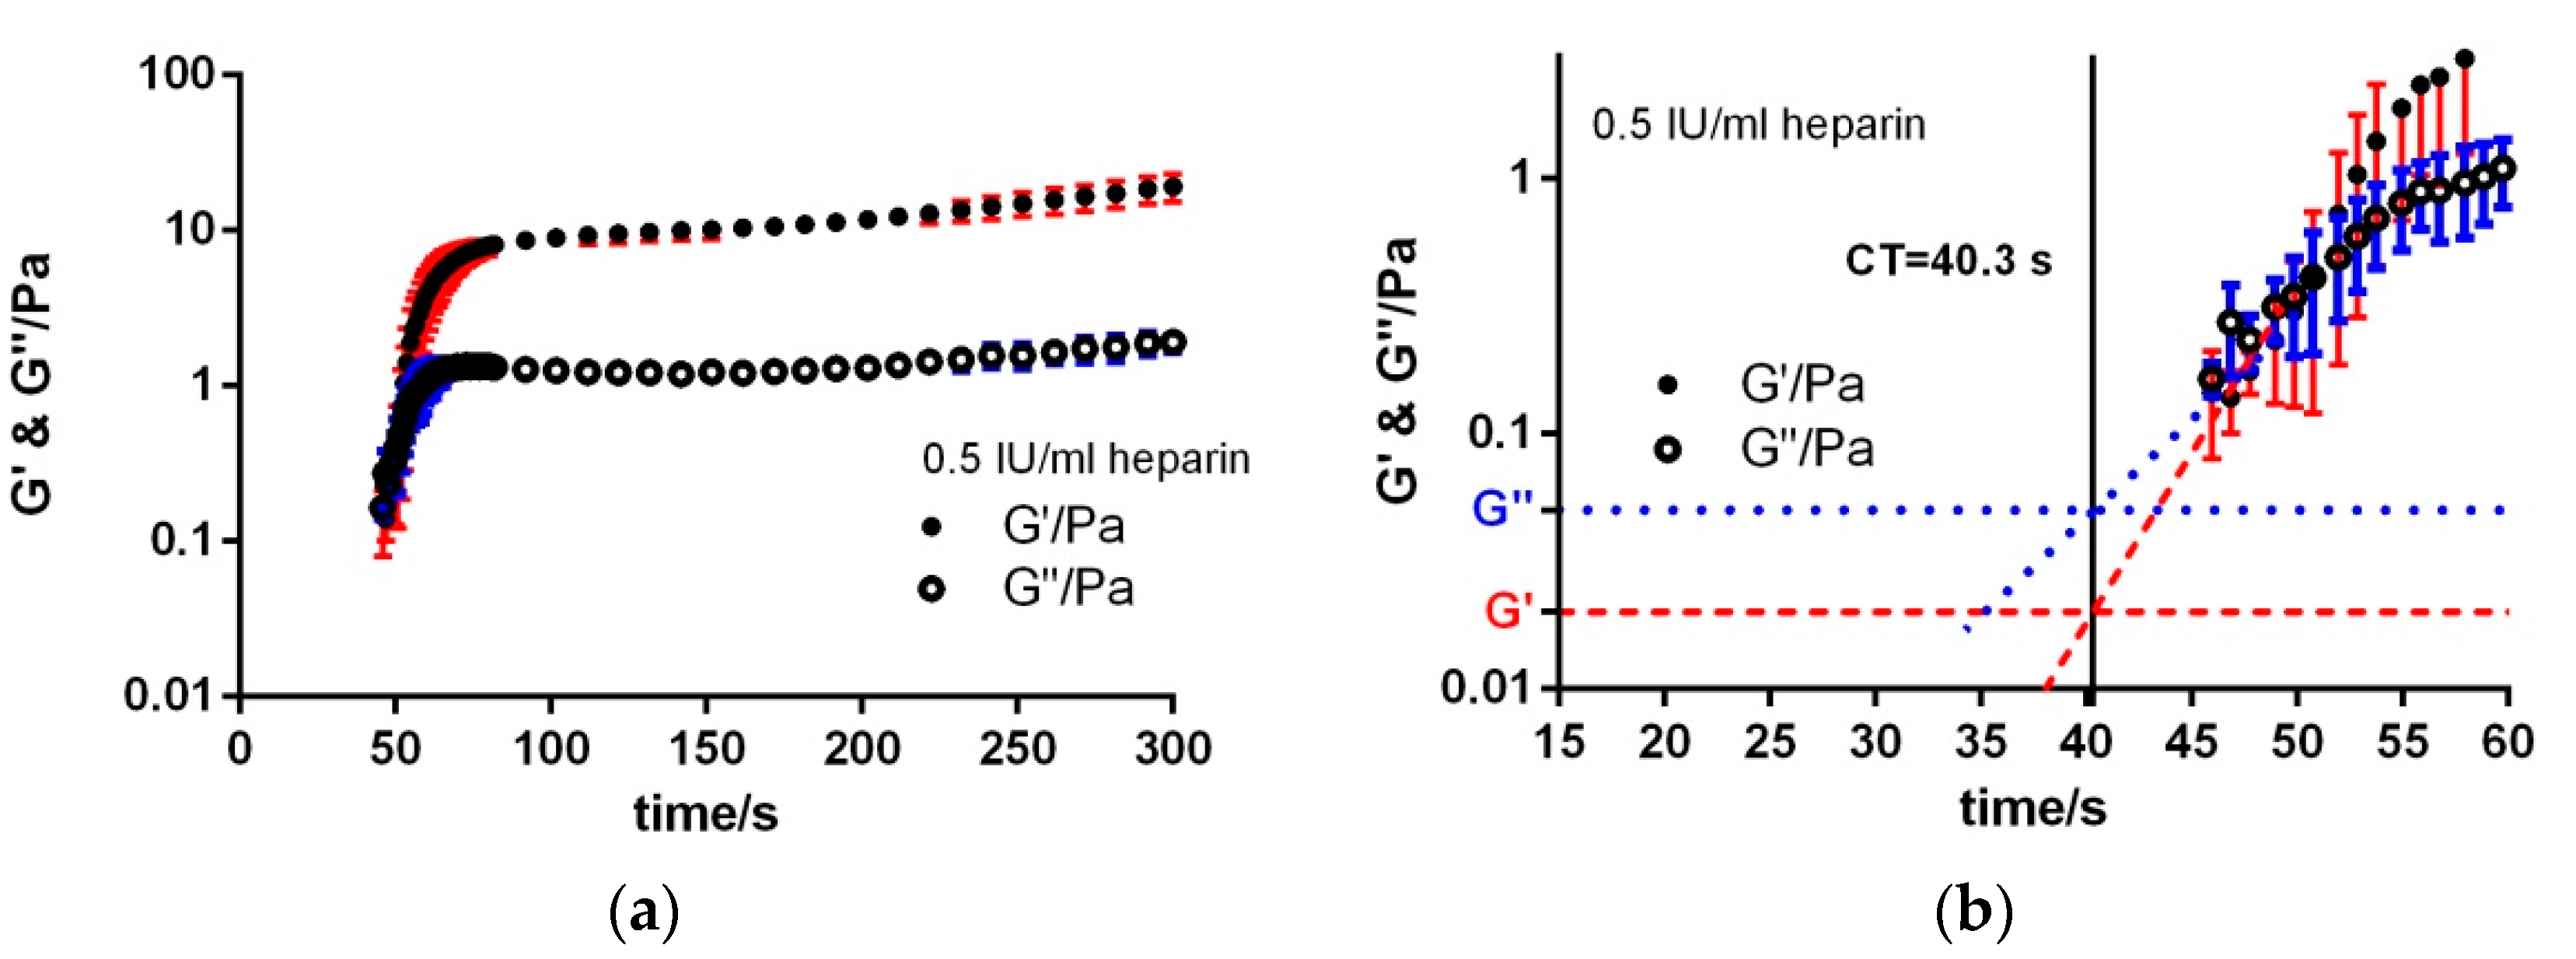
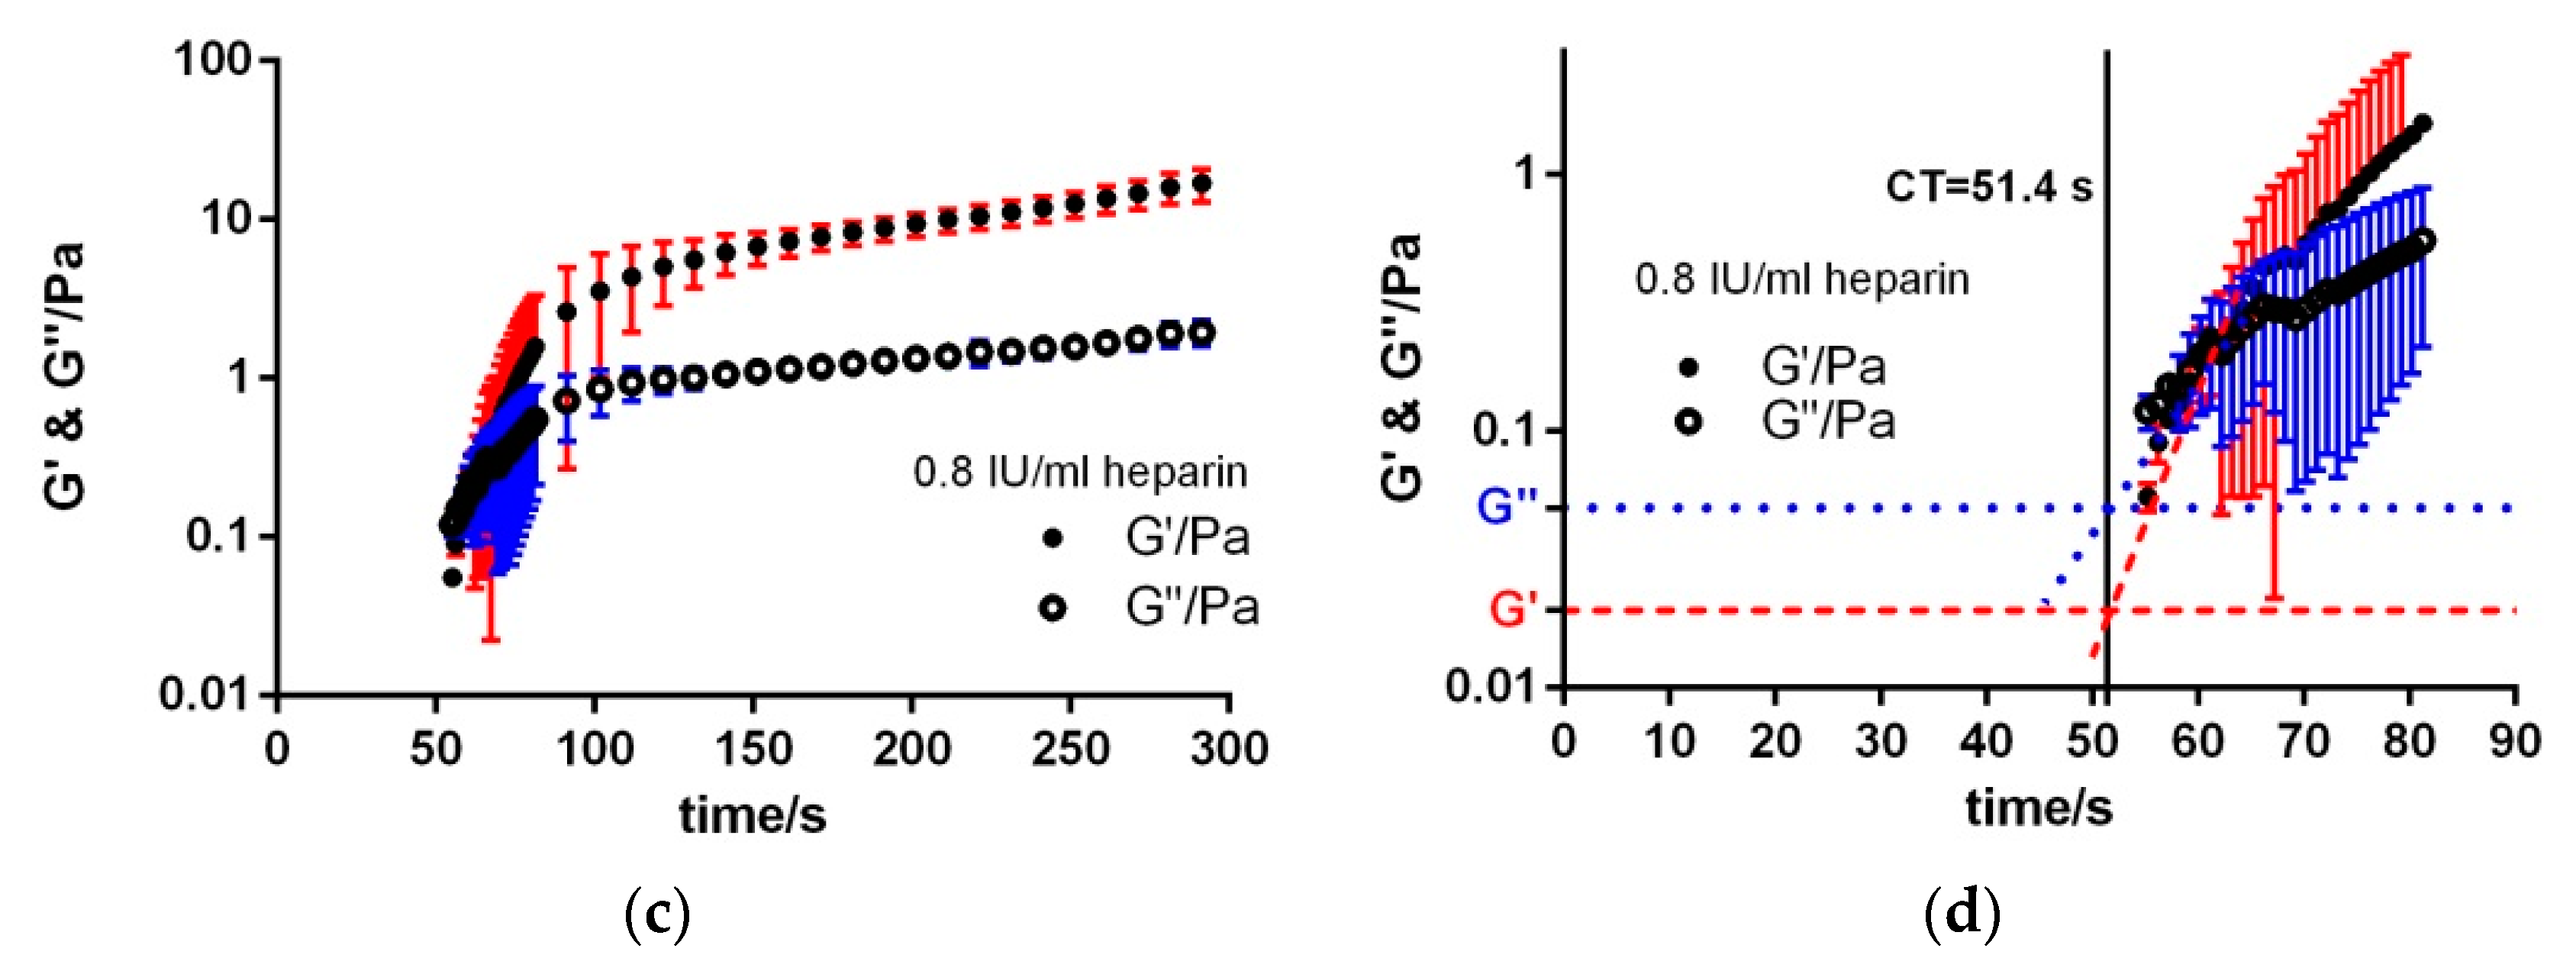
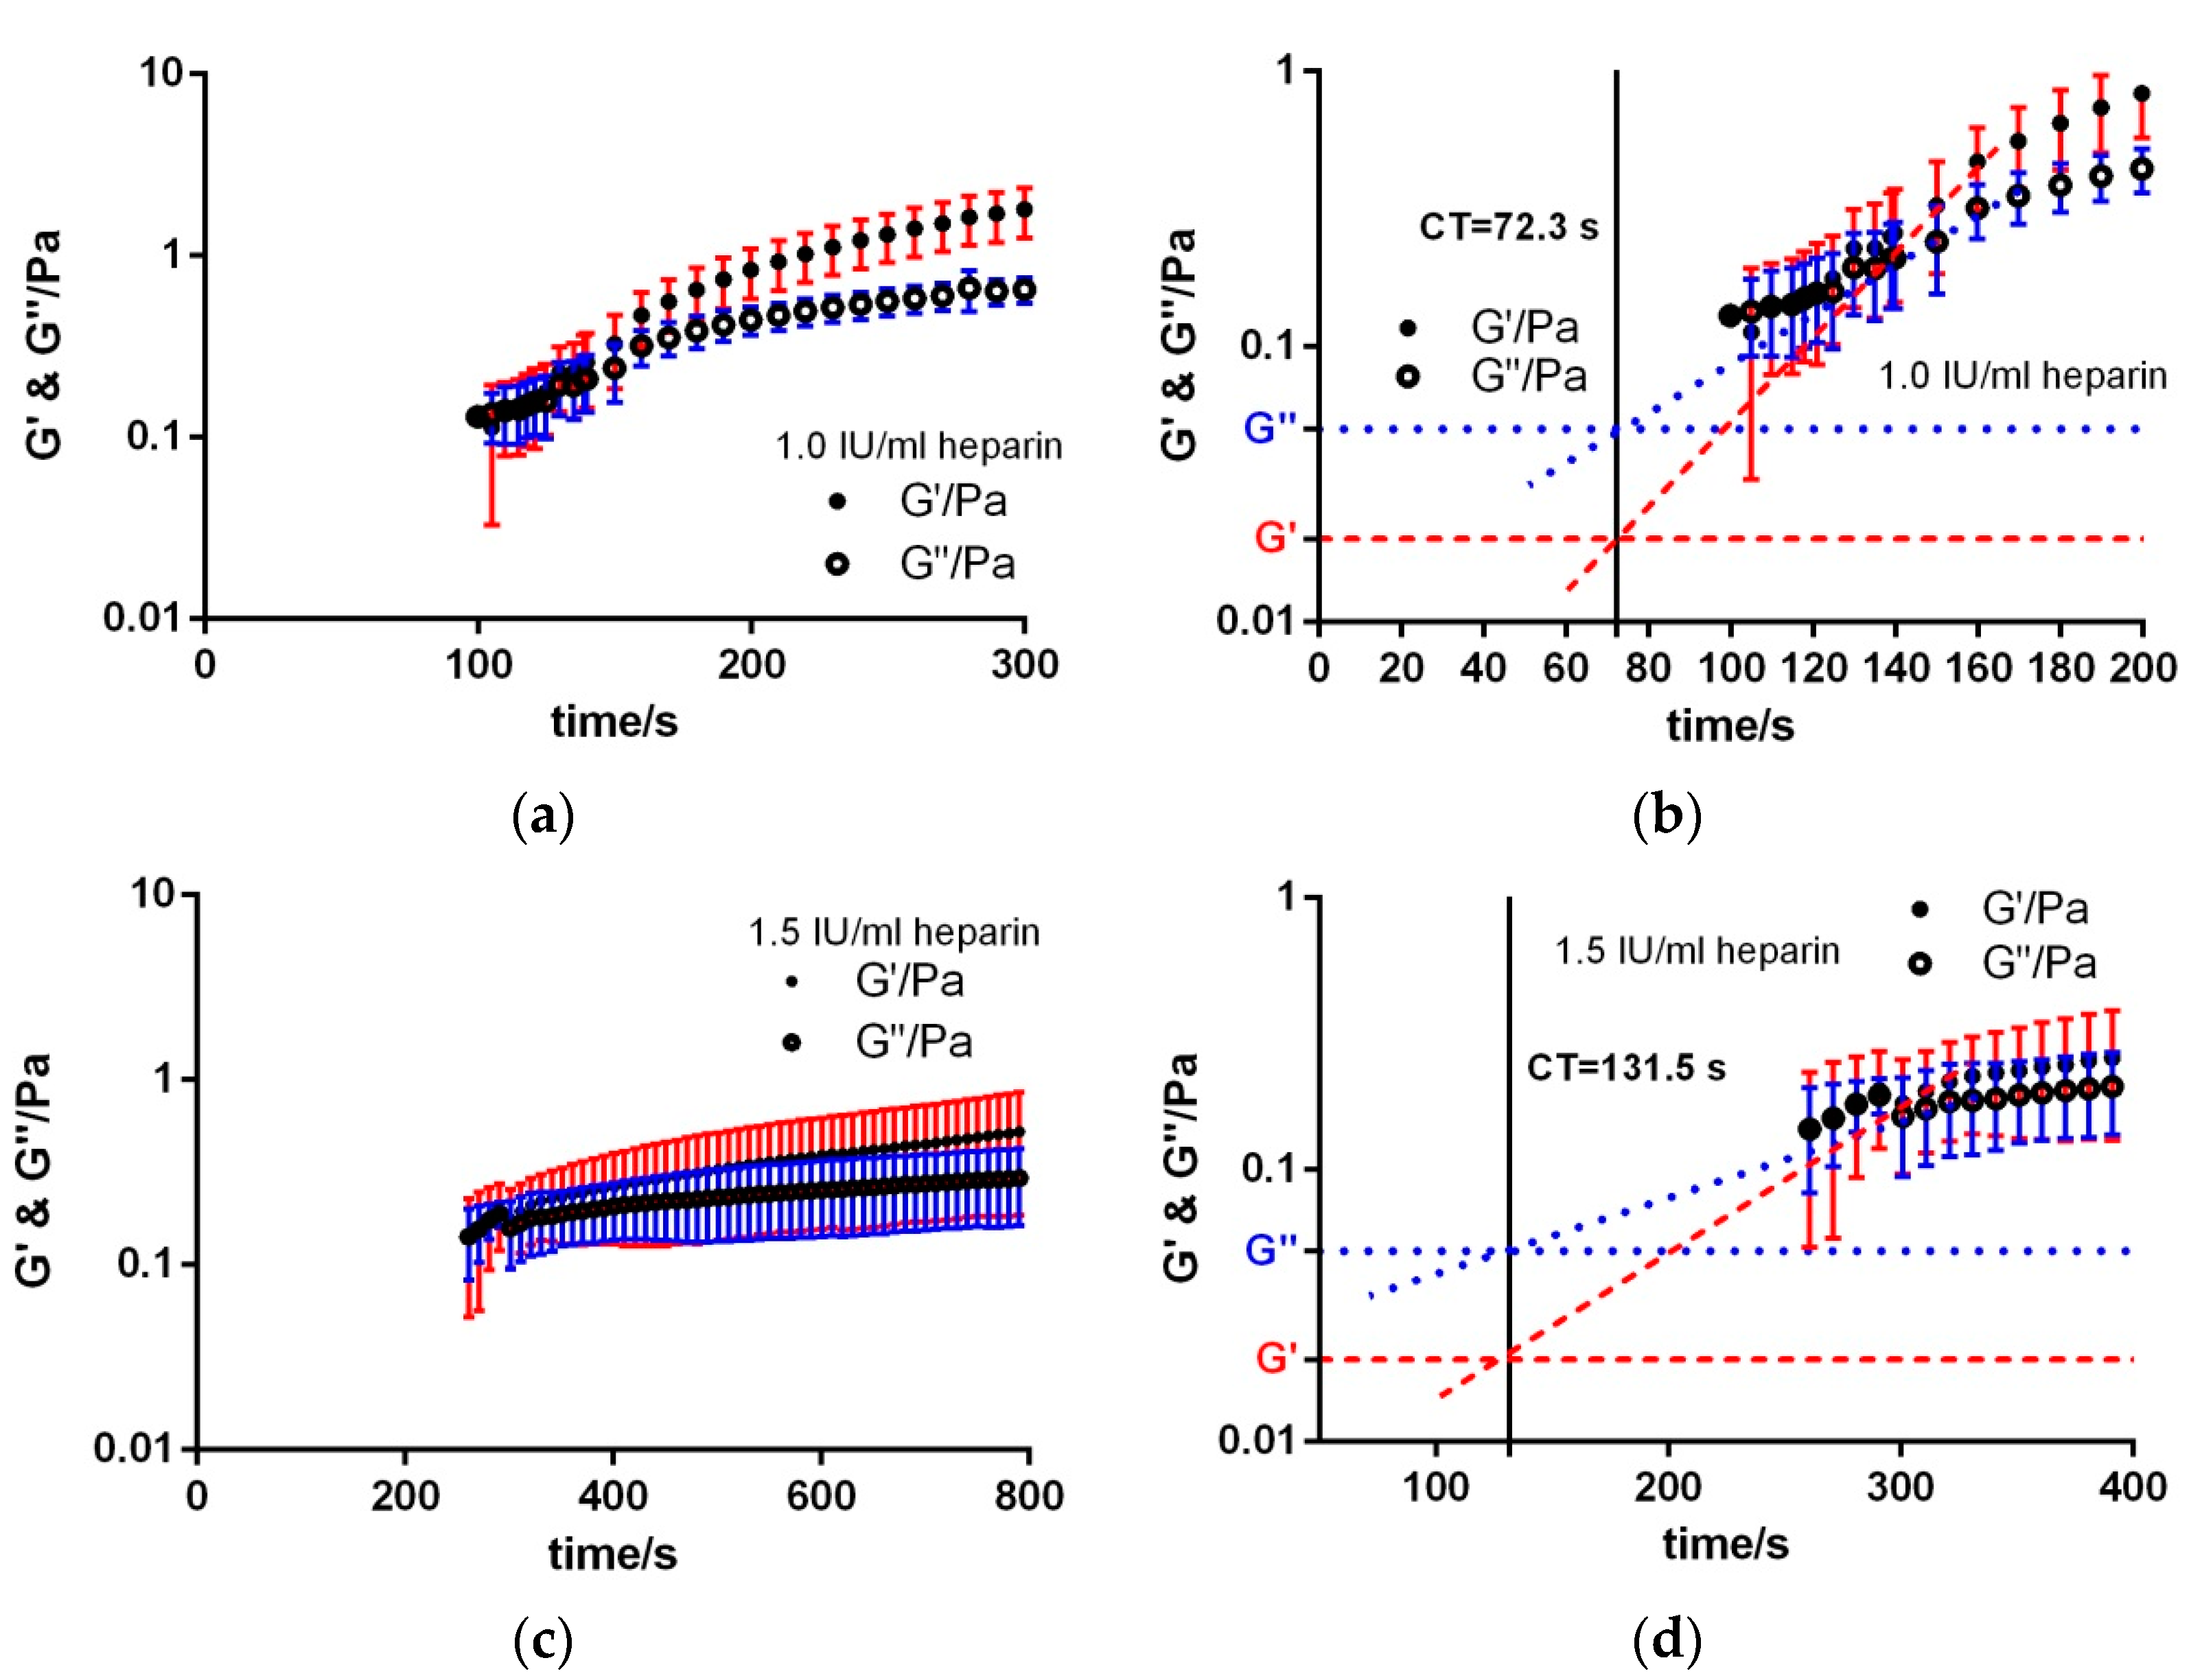
3.2. Heparin Titration

The addition of increasing concentrations of heparin to citrated blood prolonged the CT, changed the linear slopes of the elastic and viscous shear moduli and changed the value of the shear moduli at the end of the measurement (300 s) (see Table 1, Appendix Figure A1 and Figure A2).
The oscillatory rheometer provided a CT of (40.3 ± 1.2) s for 0.5 IU/mL heparin in citrated blood, which was similar to that measured by KC 1A (40.5 ± 1.3) s. Equally, the other concentrations of heparin yielded similar CT between oscillatory rheometer and ball coagulometer, which were not significantly (ns) different from each other except for 1.5 IU/mL heparin (Table 1, Appendix Figure A3). More importantly, the comparison of the diverse heparin concentrations showed that each concentration had a significantly different CT and could therefore be differentiated from each other. Comparing linear slopes of elastic and viscous shear moduli with the diverse heparin concentrations, it was quite obvious that with increasing heparin concentration the slopes decreased (Table 1, Figure A4a,b) as was expected with a lower clot formation over a certain time period. Interestingly, after 300 s both elastic and viscous shear moduli of the control measurement without heparin, 0.5 IU/mL and 0.8 IU/mL heparin were not significantly different from each other, while the two higher heparin concentrations 1.0 IU/mL (G′ = (1.8 ± 0.5) Pa, G″ = (6.5 × 10⁻¹ ± 0.7 × 10⁻¹) Pa) and 1.5 IU/mL (G′ = (0.5 ± 0.3) Pa, G″ = (3.0 × 10⁻¹ ± 0.5 × 10⁻¹) Pa) showed significantly decreased values (see, Table 1, Figure A4c,d). This indicates that concentrations below 1 IU heparin did increase clotting time but no measurable effect on fibrin network and clot firmness was observed. Moreover, higher heparin concentrations led to higher standard deviations. A higher difference between ball coagulometer and oscillatory rheometer could be observed at citrated blood with a concentration of 1.5 IU/mL heparin. Concentrations of 2.0 and 3.0 IU/mL were not repeatable by ball coagulometer or oscillatory rheometer, and are thus not shown here. In fact, at heparin concentrations above 2 IU/mL, other methods (e.g., Heptest-Stat assay) are used to guide heparin dosing in clinical practise [23].
These experiments show that the oscillatory rheometer and the reference medical device provided comparable CT results. Furthermore, the rheometer visualised the coagulation process by the change of viscous and elastic shear moduli over a certain time period. By increasing heparin concentrations the parameters changed towards prolonged CT values, lower linear slopes of viscous and elastic components and lower viscous and elastic shear moduli values.

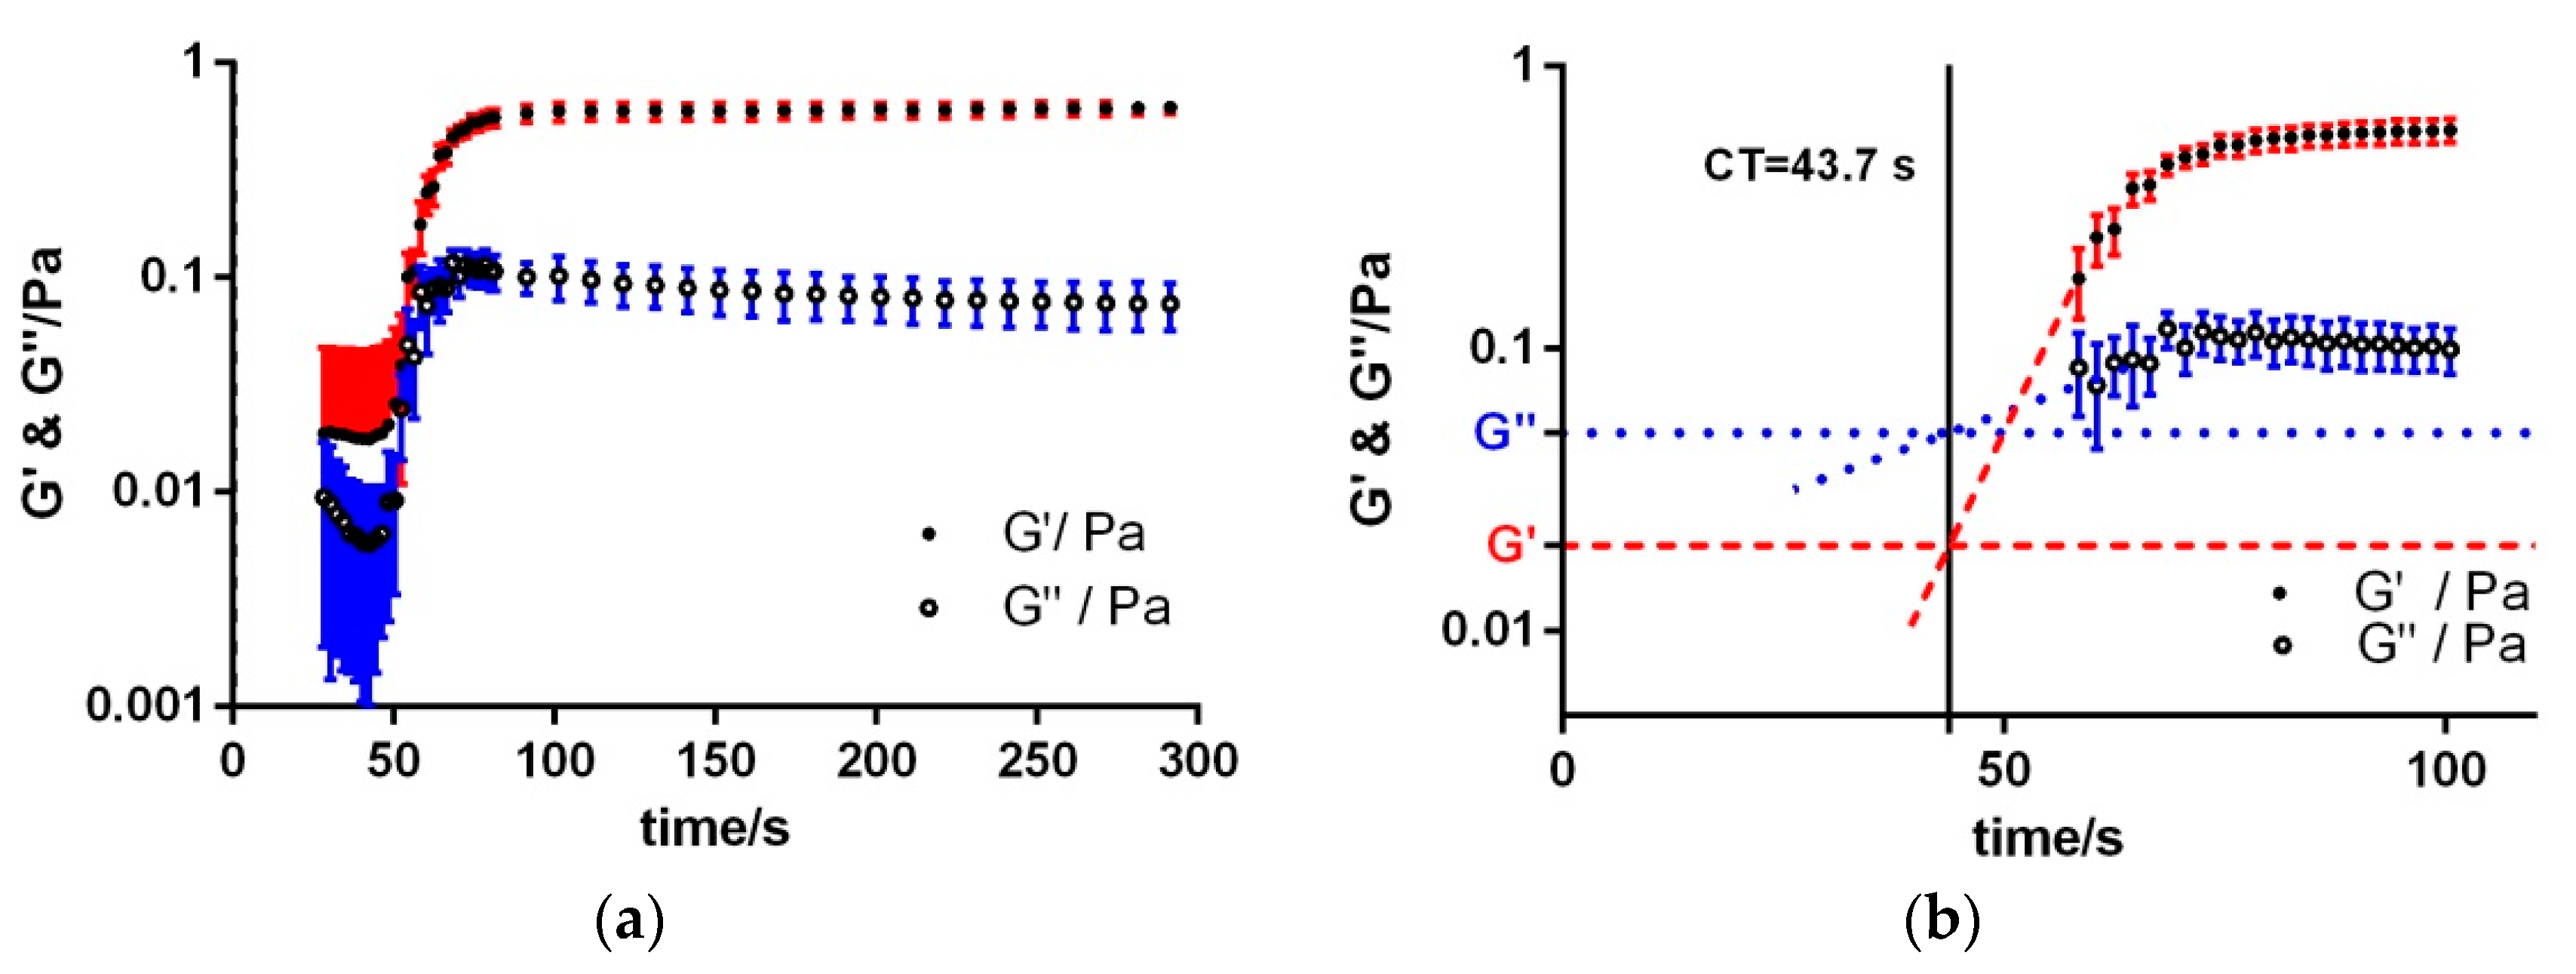
3.3. Intrinsic Coagulation

A further coagulation assay (aPTT, intrinsic coagulation) was performed in this work to verify that the oscillatory rheometer can detect and even differentiate the coagulation process from the already investigated PT assay. Citrated blood was activated with Pathromtin and CaCl2 to investigate the activated partial thromboplastin time. Preliminary experiments showed that measurements with 1 Hz and a shear stress of 0.04 Pa did not provide repeatable results, because inertia effects were dominating. Therefore, a frequency of 0.1 Hz with the same shear stress was used to obtain the results in Figure 2. Elastic and viscous shear moduli initially showed a short “lag phase” before both changed rapidly over time, similar to the PT (Figure 2a,b). This reflects the strength of the activator, which is stronger for the Prothrombin assay. Similar to the PT assay shown above, the linear slopes and values for elastic (G′) and viscous (G″) shear moduli were determined here as well and the calculated clotting time compared to the reference device KC 1A.
Table 2 summarises the obtained values. It is clearly obvious that here is no significant difference between the clotting times determined via Kinexus (43.7 ± 3.9) s or KC 1A (44.1 ± 4.3) s (Table 2, Appendix Figure A5).
Comparing the linear slopes and the G′ and G″ at 300 s between PT and aPTT measurements (Kinexus), these are significantly lower with aPTT assay than with PT assay (Appendix Figure A6a–d), indicating a slower coagulation and less firm clot stability in aPTT. Thus, as the oscillatory rheometer and the ball coagulometer provided significantly different results for the two coagulation assays (PT and aPTT), both devices are therefore capable to differentiate between these two coagulation methods.

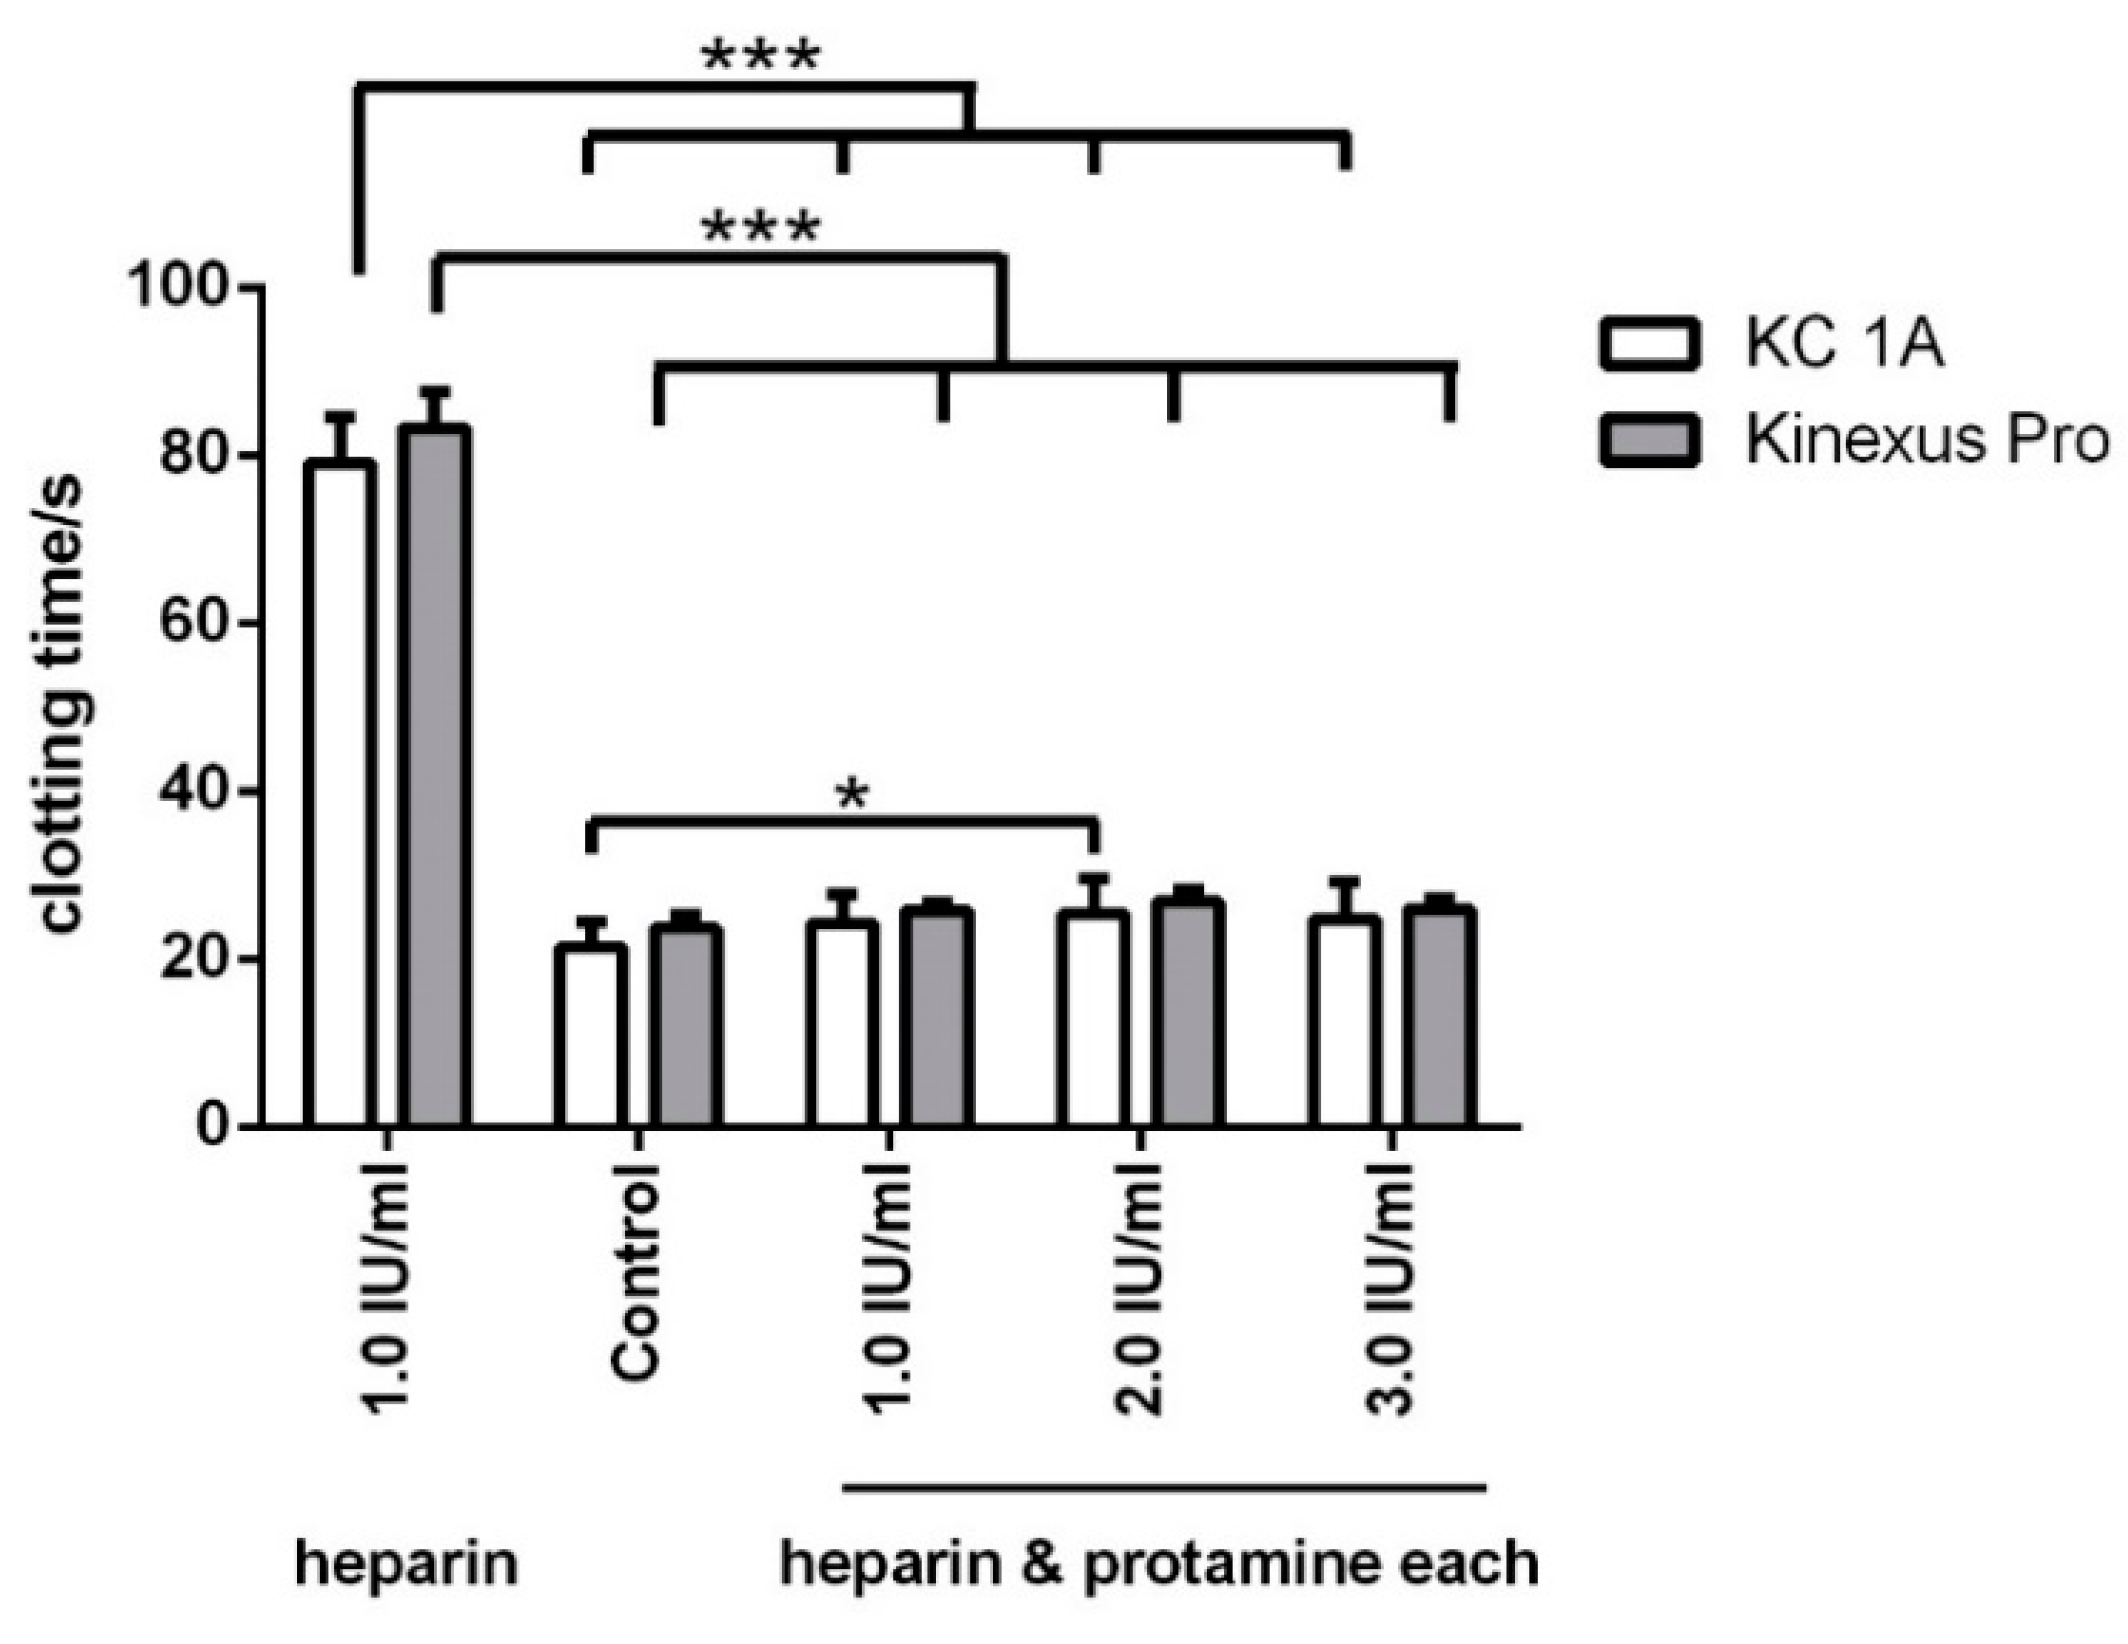
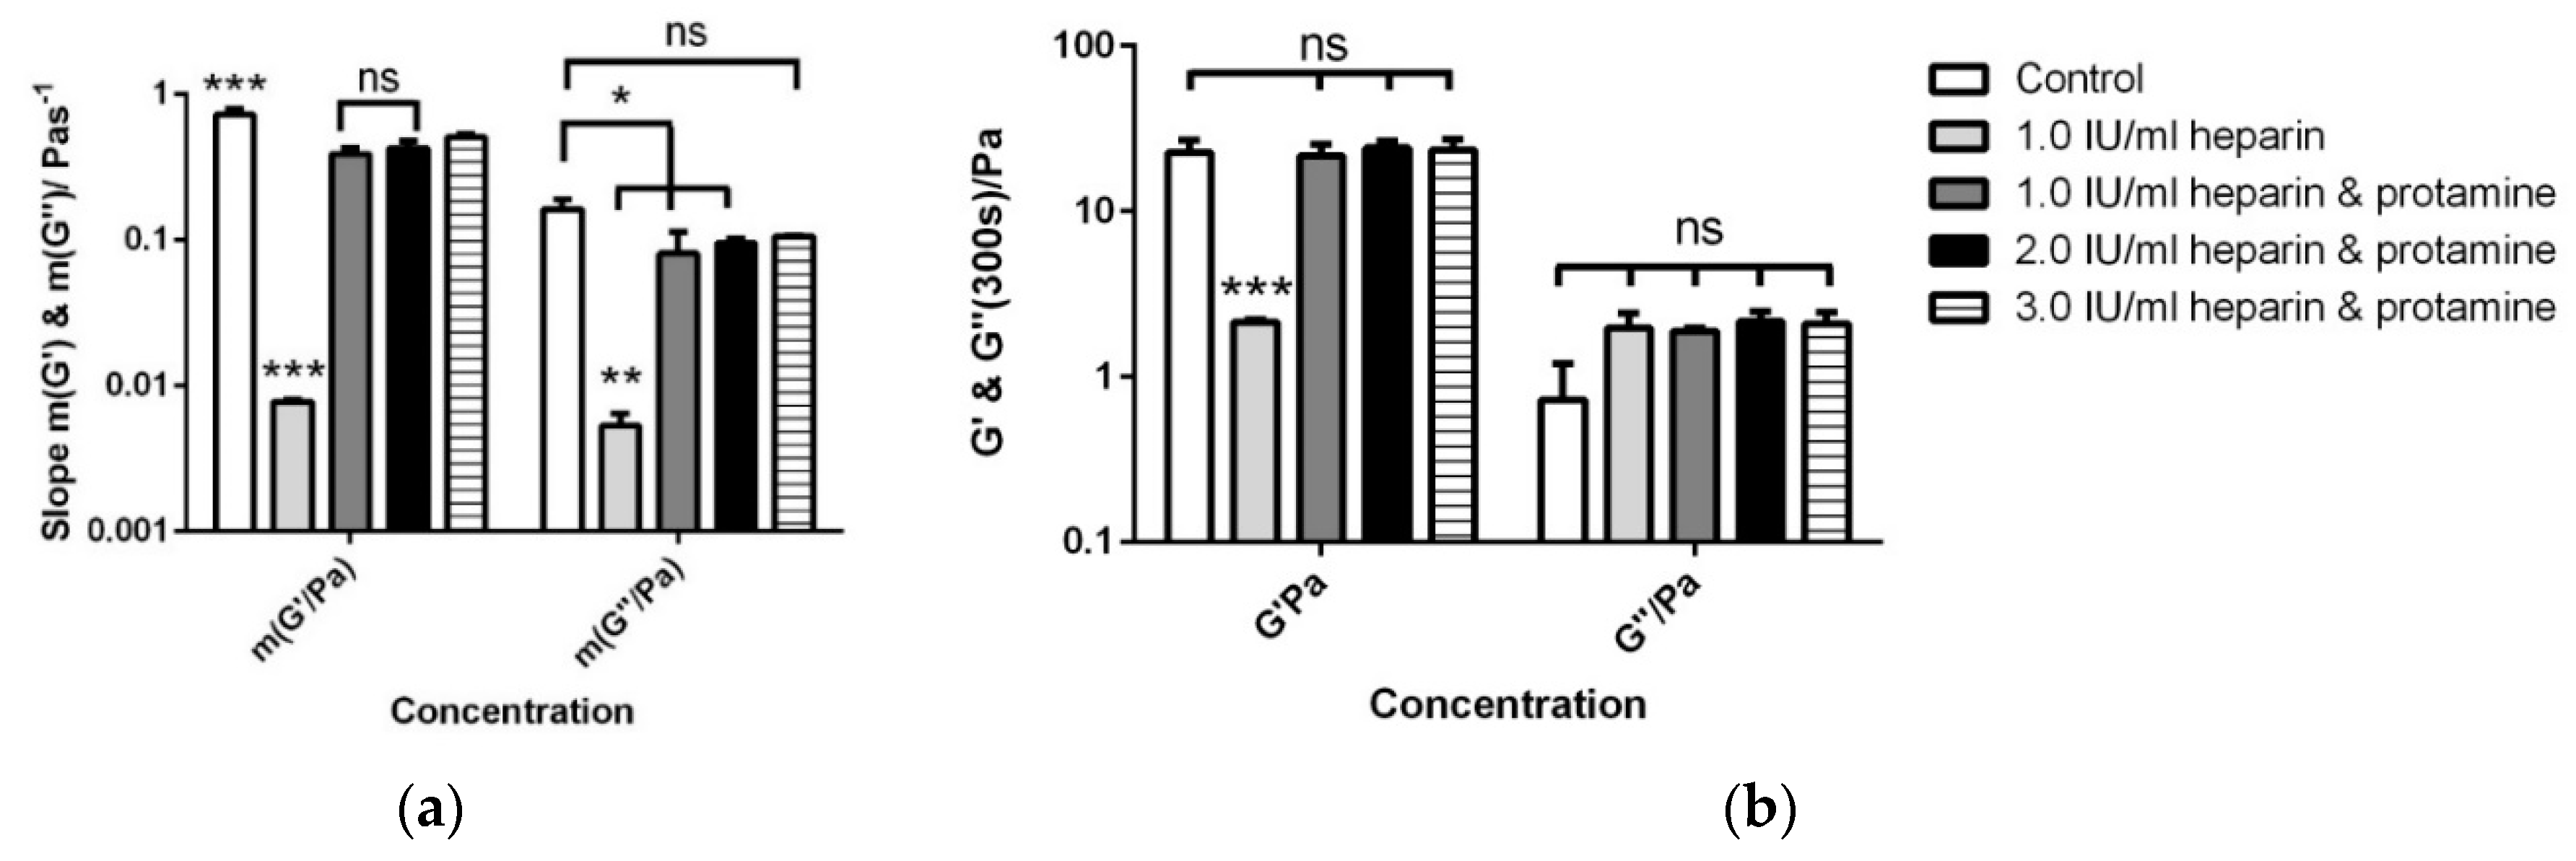
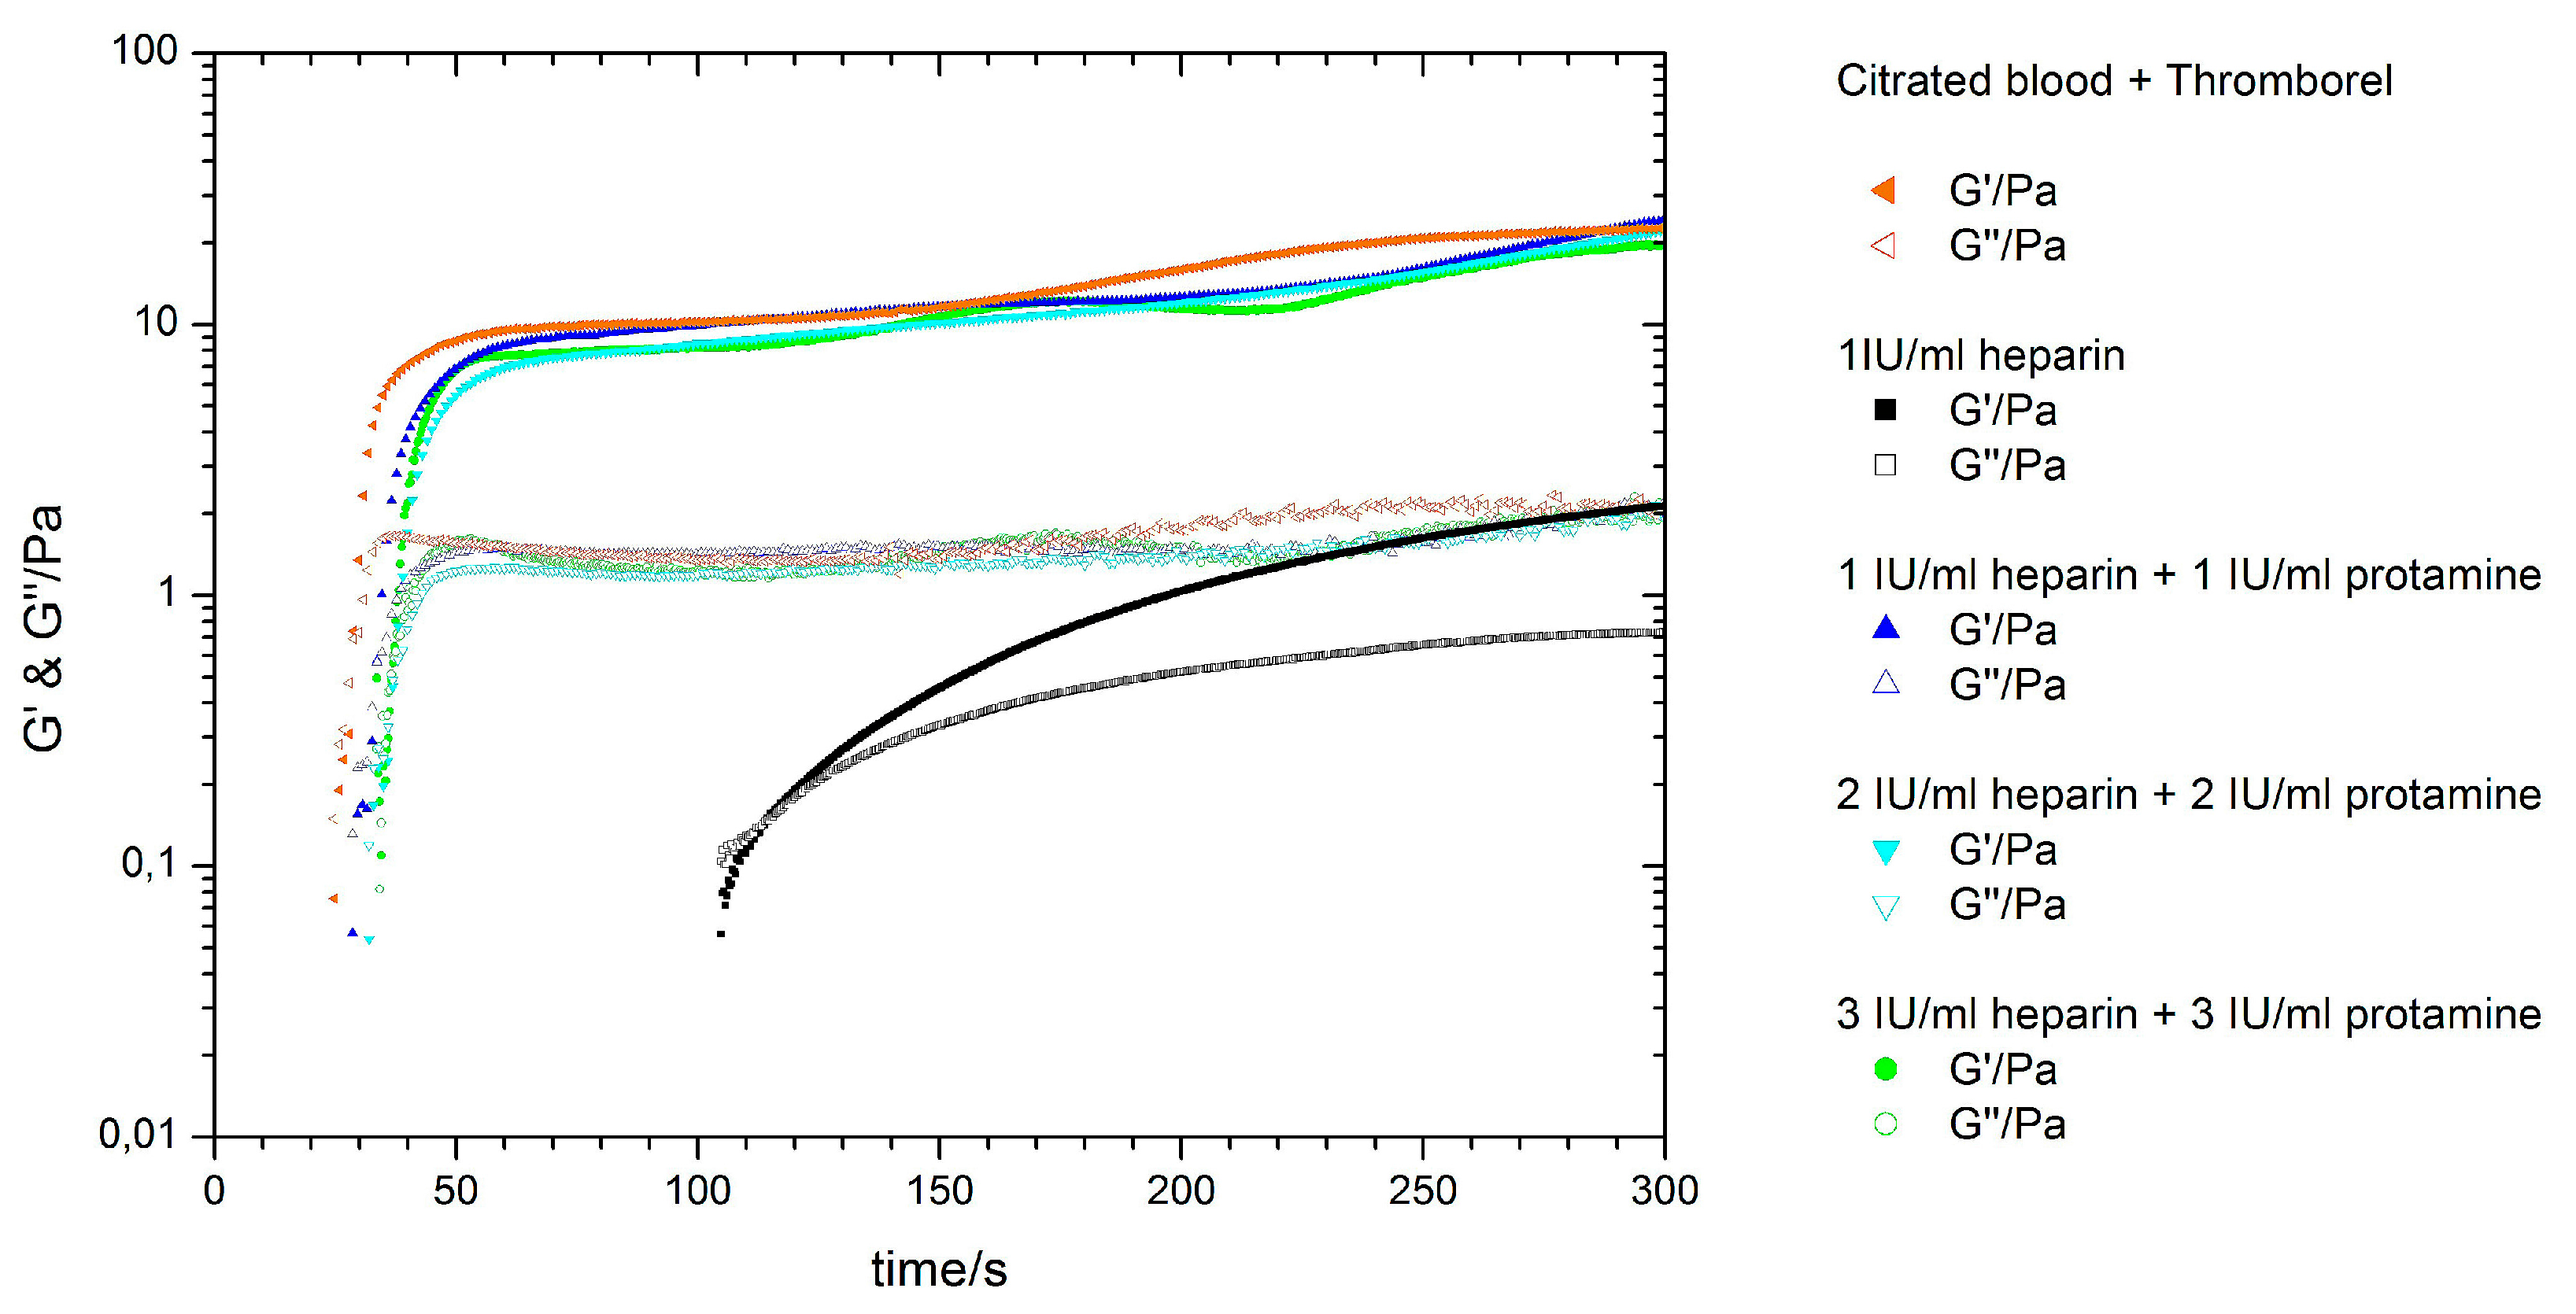
3.4. Antagonising Heparin with Equimolar Concentrations of Protamine

During extracorporeal circulation, human whole blood is usually anticoagulated with heparin. After weaning from ECC, protamine is used as heparin antagonist to restore the initial coagulation state. The following experiments were performed to visualise the ability of the oscillatory rheometer to determine the effect of protamine neutralising heparin. Therefore, citrated whole blood was additionally anticoagulated with 1.0, 2.0 and 3.0 IU/mL heparin and simultaneously neutralised with the equivalent amount of protamine before activation with Thromborel (Figure 3). As reference measurements, citrated blood without heparin (orange curves) and with 1 IU/mL heparin (black curves) were activated with Thromborel. Once a ratio of 1:1 of heparin and protamine was given, the effect of heparin was almost completely abolished and the curves were more or less congruent to the reference measurement of citrated blood with Thromborel. In contrast, the heparin solution with 1 IU/mL showed a prolonged clotting time and a lower slope compared to the reversed heparin measurements. The following table (Table 3) summarises the clotting times, linear slopes and the viscous and elastic shear moduli at 300 s. As before, there was no significant difference between clotting times measured by the oscillatory rheometer and KC 1A, neither at measurements with or without additional heparin or at the various combinations of heparin and protamine (Appendix Figure A7).
Furthermore, the clotting times (CTs) of the protamine antagonised heparin concentrations were not significantly different from the control measurement without heparin, but significantly different from the heparinised (1 IU/mL) control samples, providing evidence of the functionality of equimolar protamine as antagonist. An exception was the CT of the ball coagulometer at a concentration 2 IU/mL heparin/protamine that was significantly different from the mean control.
Despite the CT not being significantly different between protamine-antagonised heparin samples and non-heparinised control, the linear slopes of these antagonised samples were significantly different from the control (Figure A8a) indicating a slight shift towards a slower coagulation process than without any heparin or protamine, which is not detectable in the CT. However, the slopes of elastic and viscous shear moduli of the antagonised samples were still significantly different from the heparinised control.
The mean of elastic and viscous shear moduli at 300 s, indicative of clot firmness, yielded similar tendencies between samples as the CT. All heparin concentrations with their equimolar protamine concentrations were not significantly different from the mean control without heparin (Figure A8b). The heparinised control (1 IU/mL heparin) only showed a significantly reduced mean elastic shear modulus at 300 s compared the non-heparinised control and the protamine-antagonised samples, while the viscous shear modulus was not significantly different between the samples. The oscillatory rheometer is capable to detect the antagonising of heparin with the equimolar concentration of protamine.
The next experimental step was the titration of various protamine concentrations to a fixed heparin concentration, to obtain by titration the current heparin concentration in the blood sample.

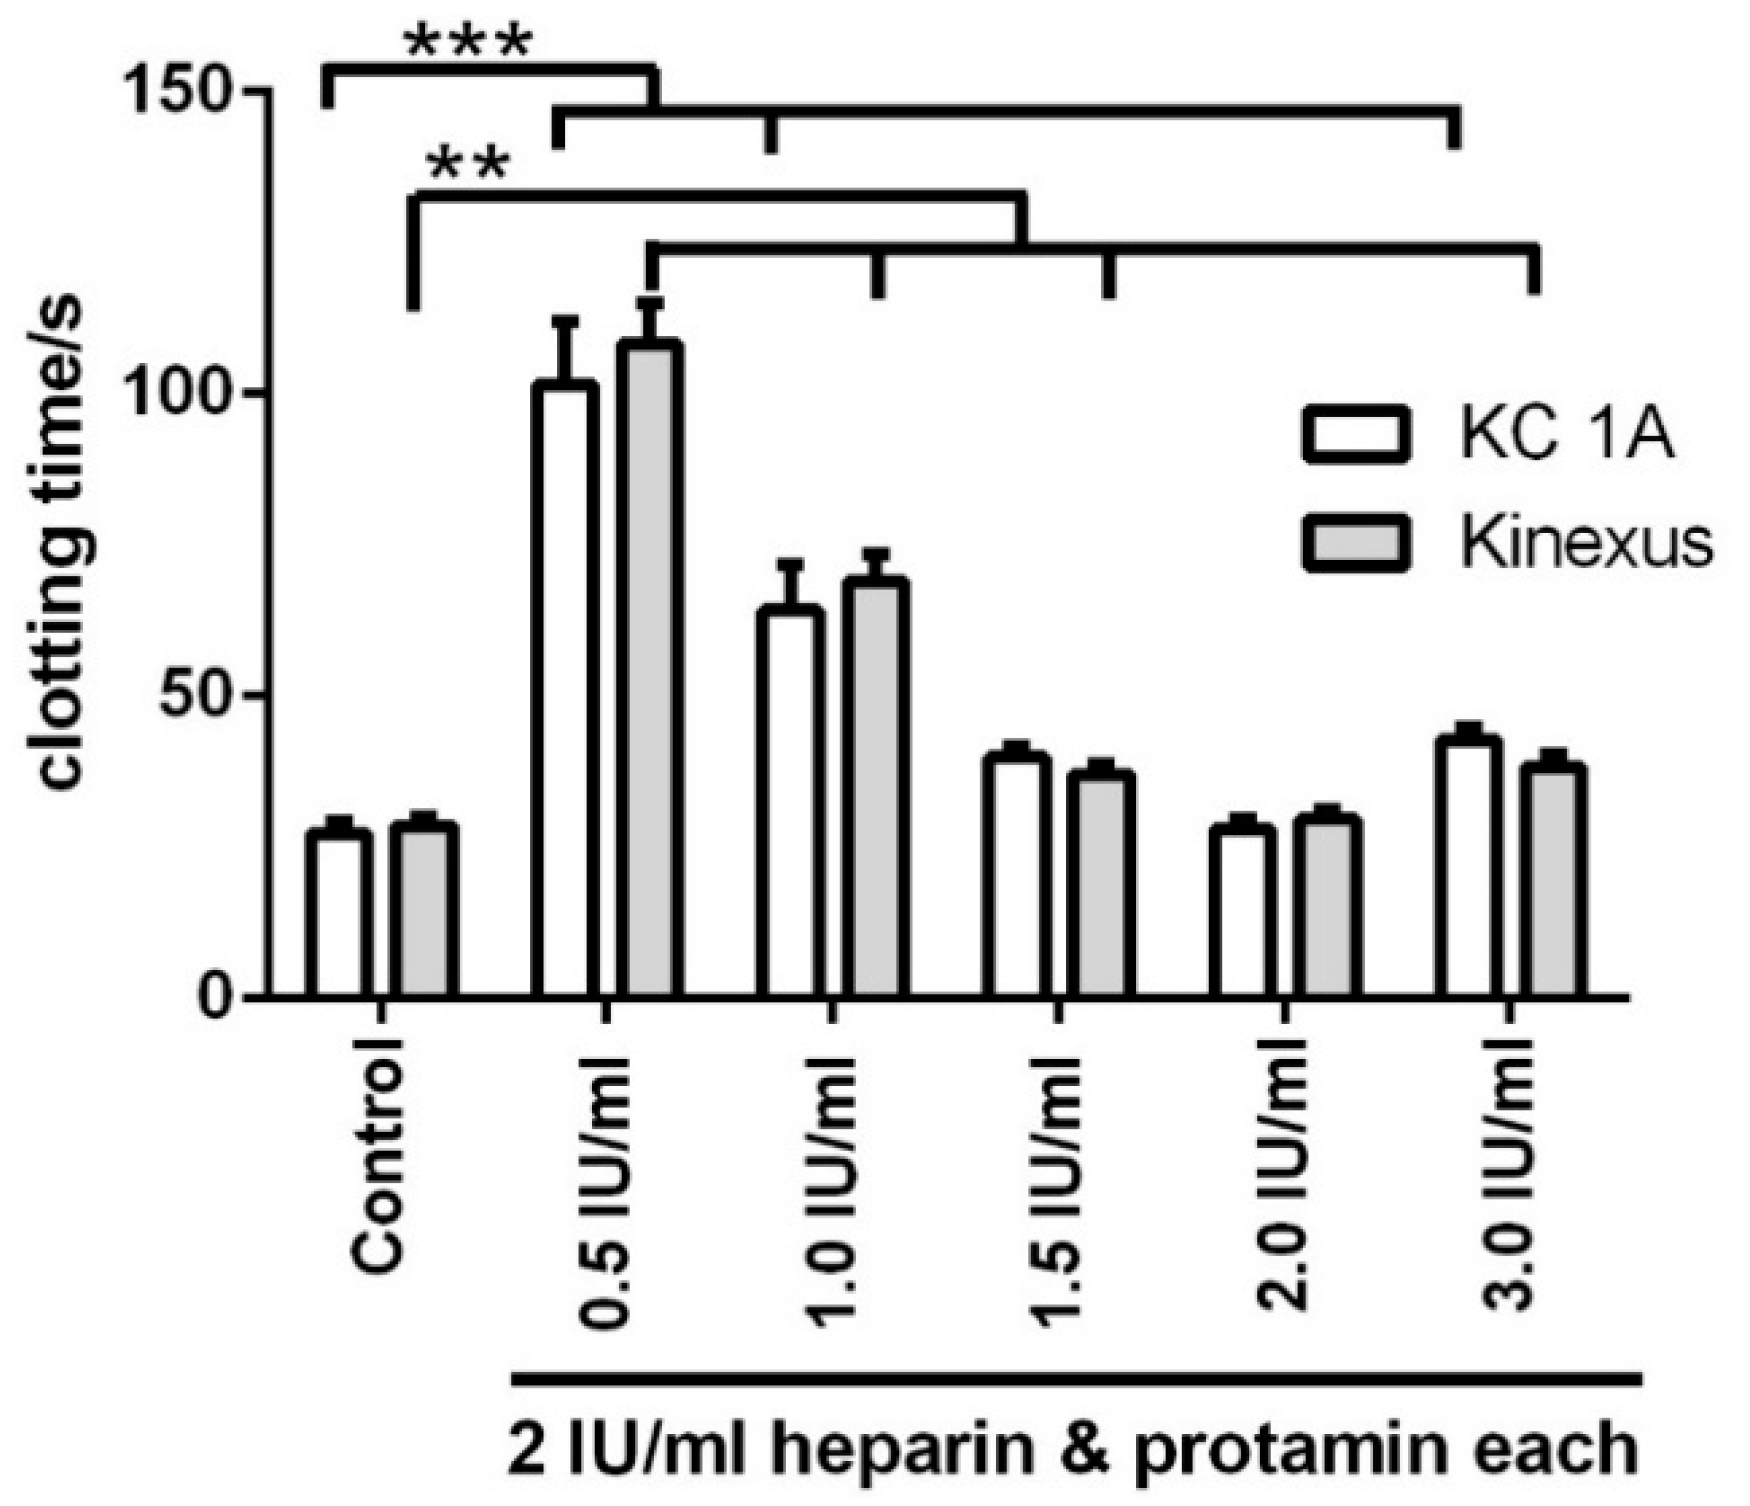
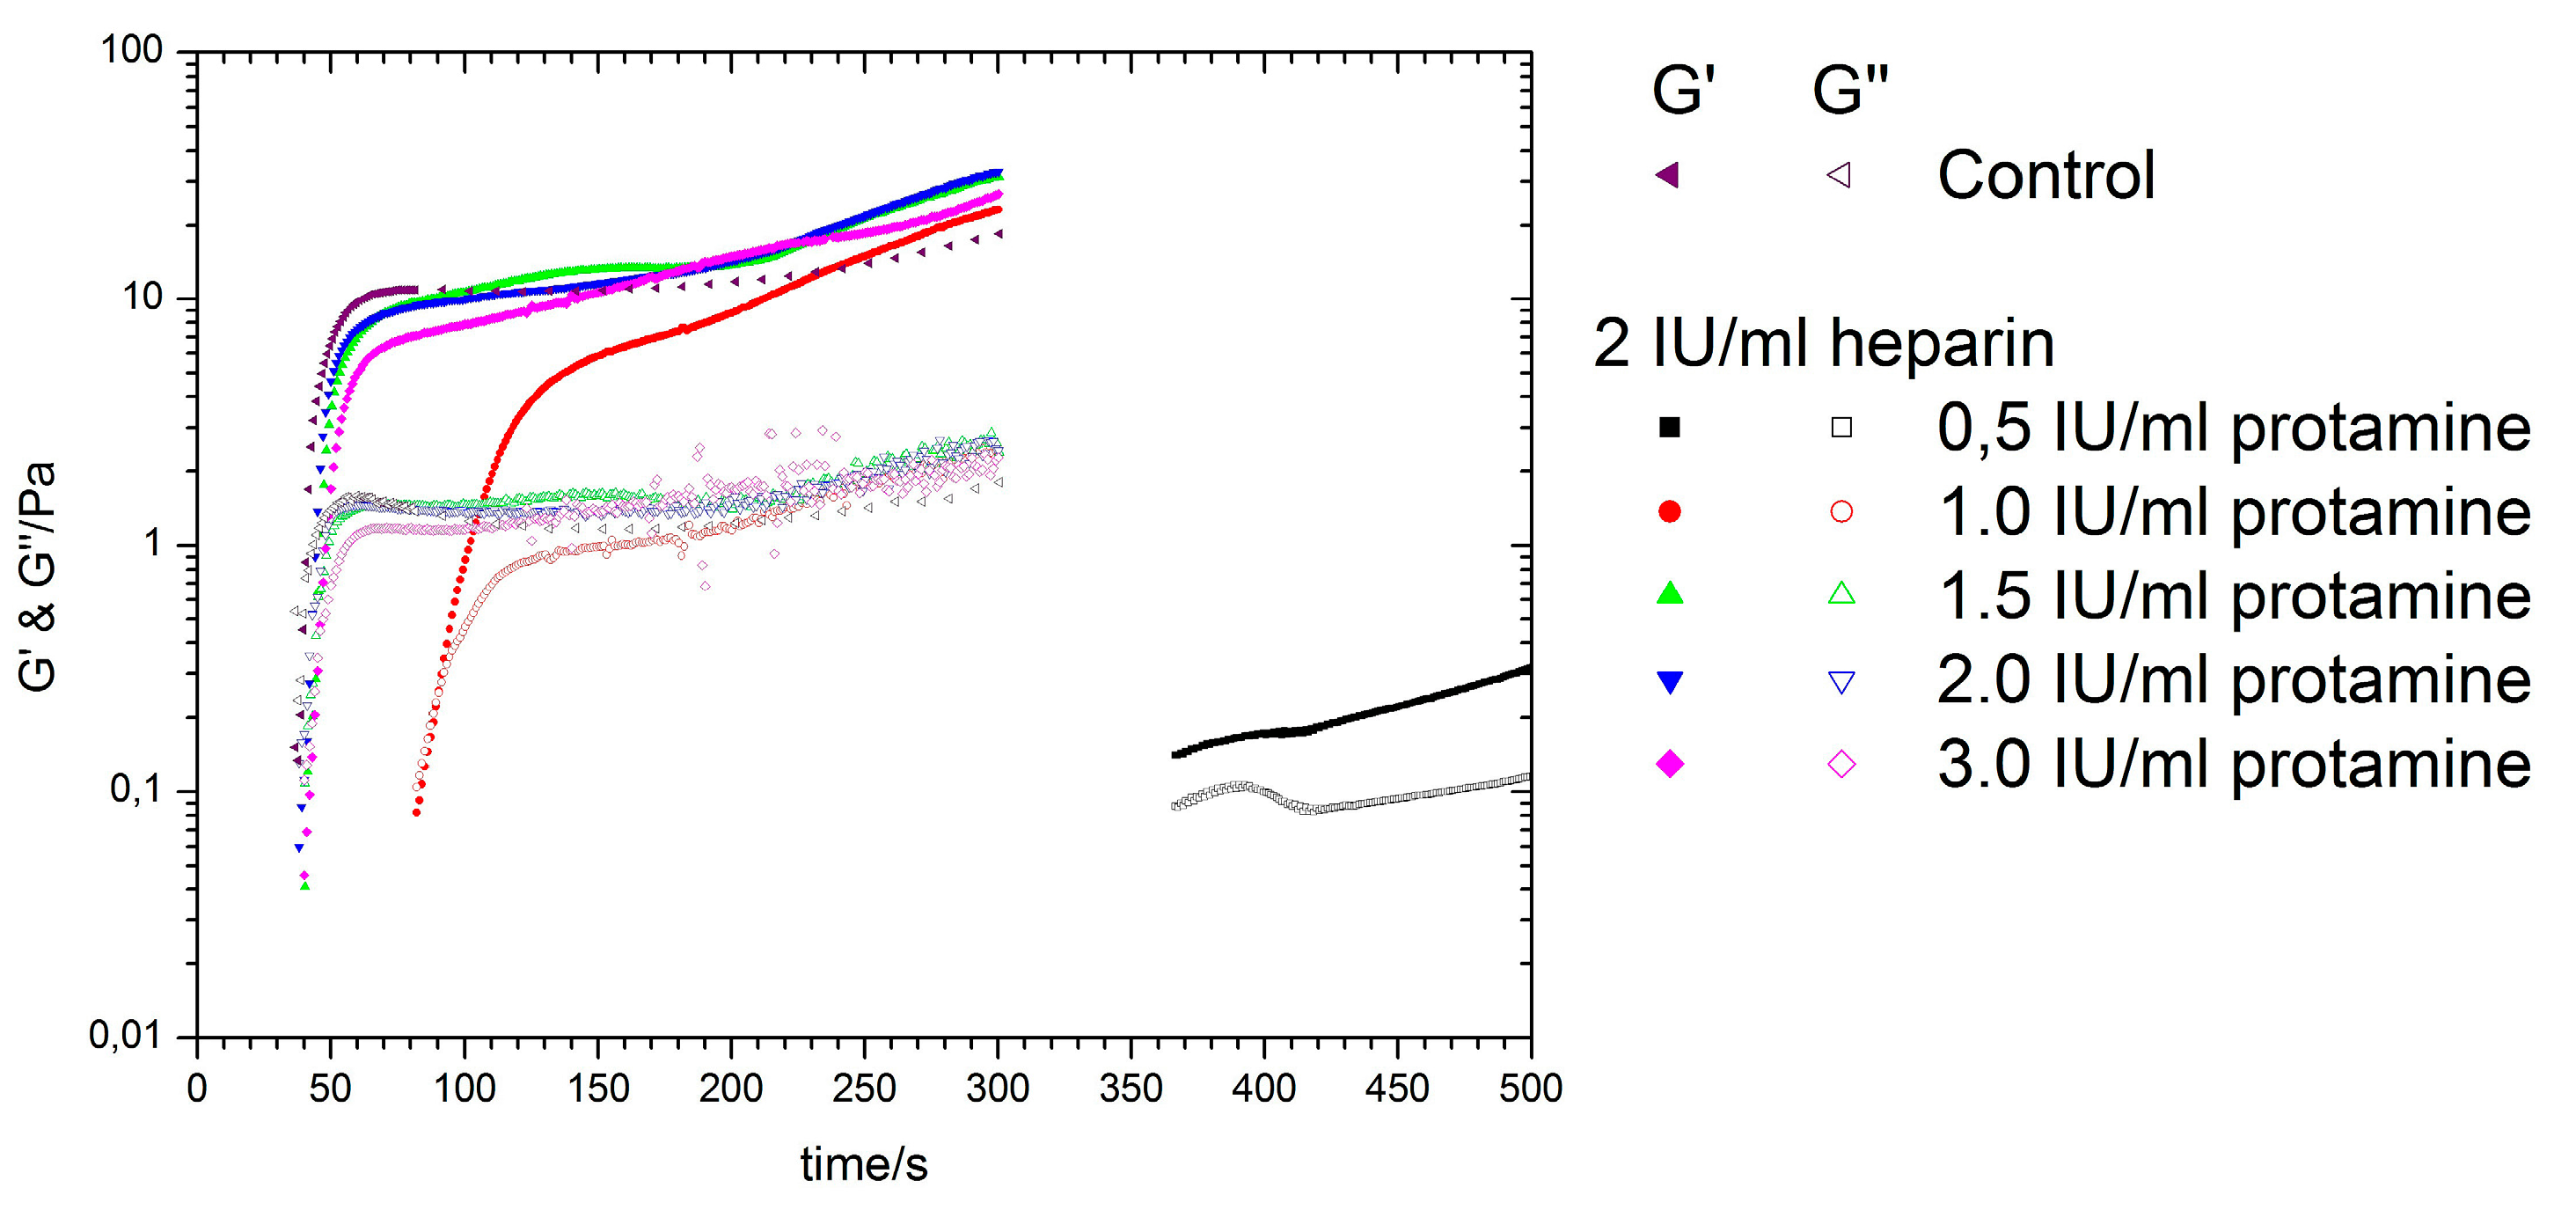
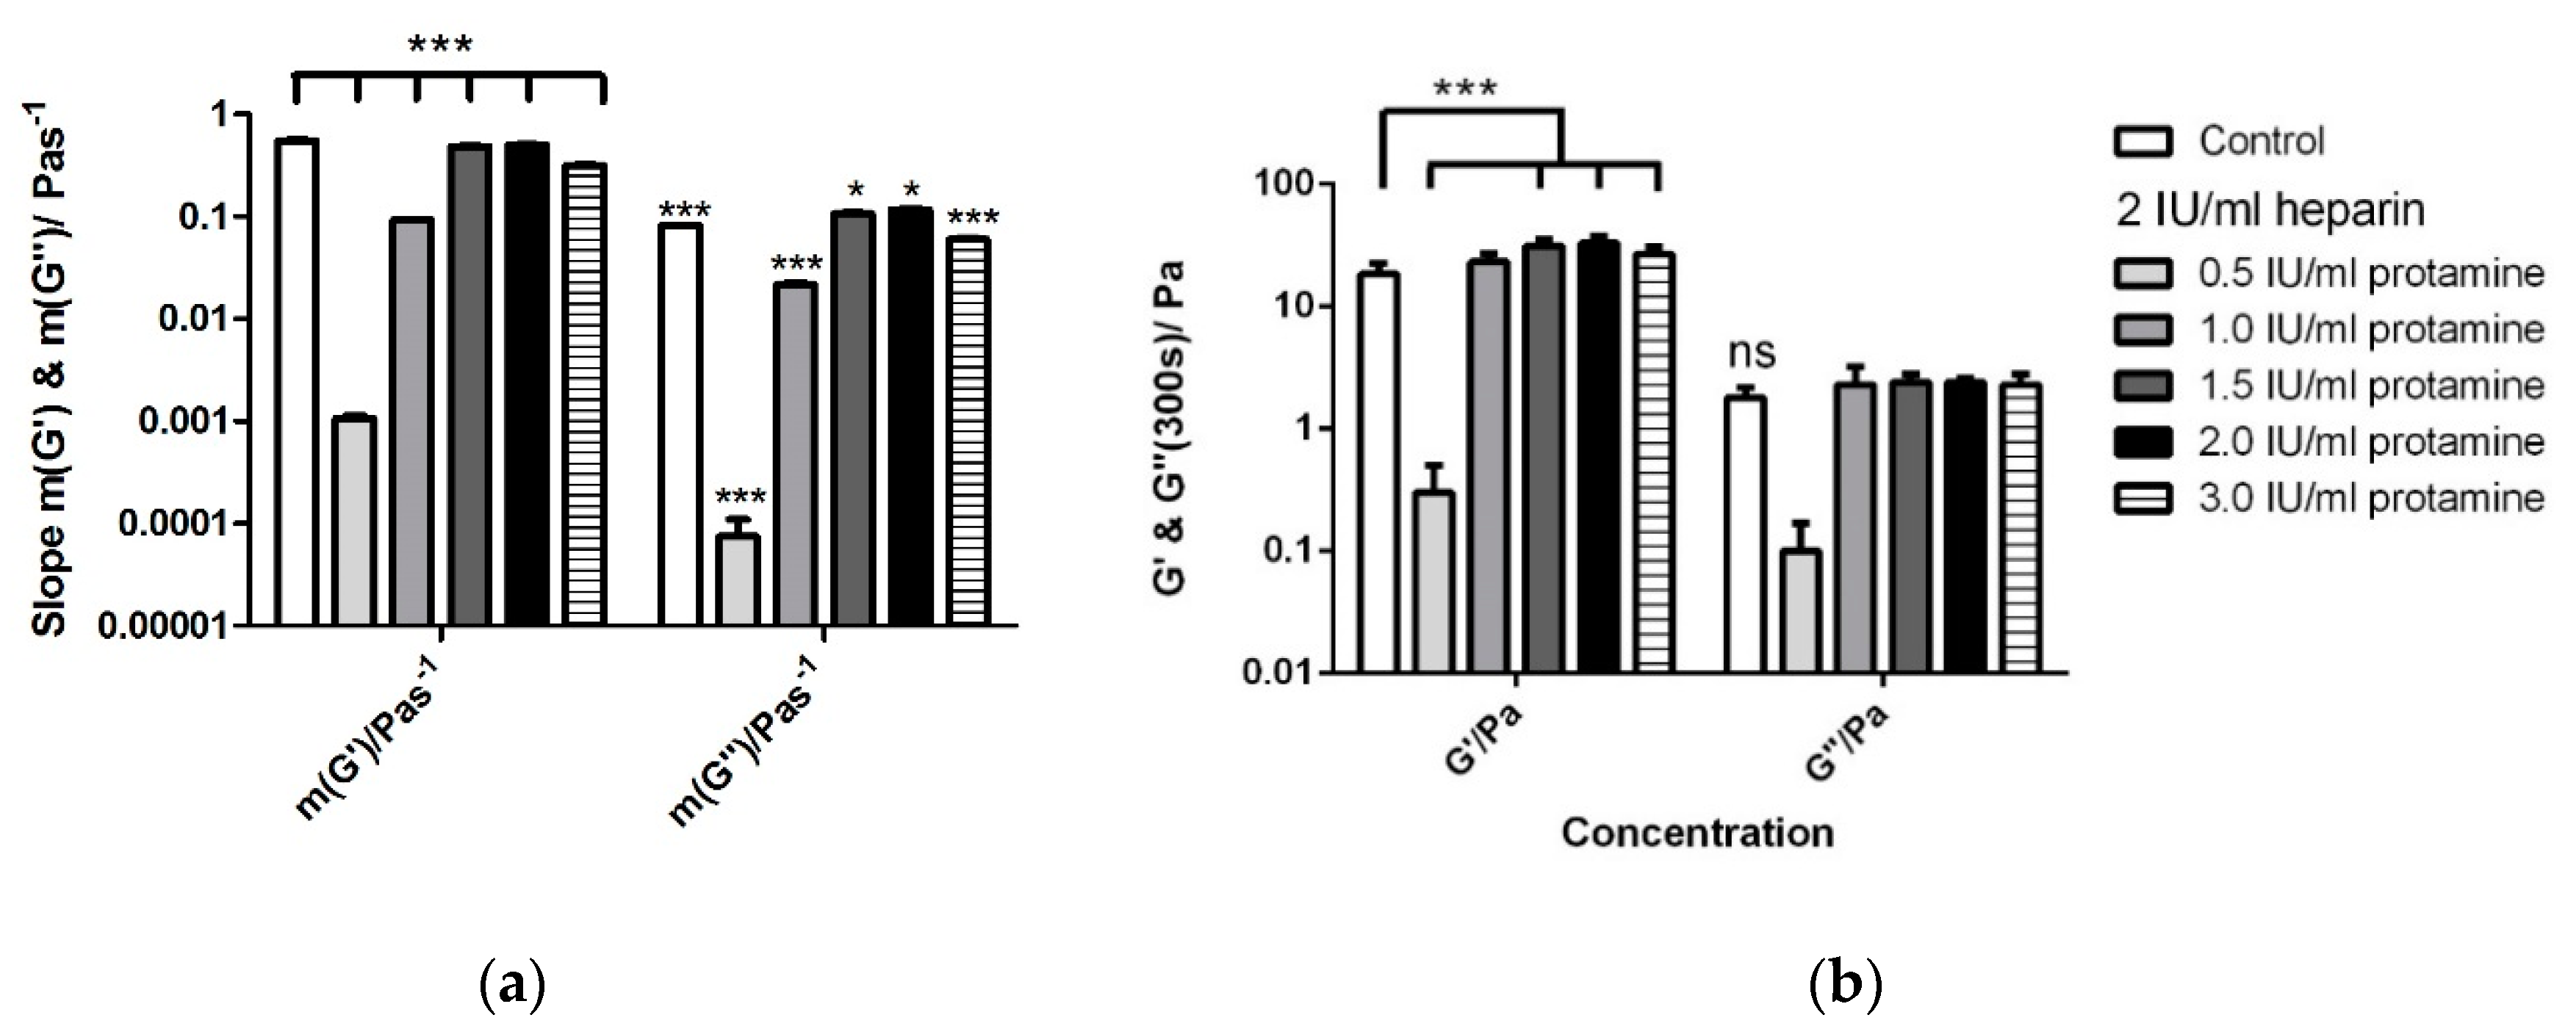
3.5. Titration of Various Protamine Concentrations to a Fixed Heparin Concentration

The actual heparin concentration during surgeries is often not known and has to be determined e.g., via back titration with protamine. The aim of this experiment was to investigate if the oscillatory rheometer can measure the back titration of various protamine concentrations (0.5, 1.0, 1.5, 2.0 and 3.0 IU/mL) to neutralise a fixed heparin concentration (2 IU/mL). As control, citrated blood without any heparin was activated by Thromborel (Figure 4, magenta lines). The lower concentrations of protamine (0.5 and 1.0 IU/mL, black and red lines, respectively) were too weak to neutralise heparin and thus the shear moduli shifted to the right indicating a delayed coagulation. However, the other concentrations of protamine (1.5–3.0 IU/mL) showed similar shear moduli as the non-heparinised control. Taking a closer look at the CT values provided by the oscillatory rheometer and KC 1A, there was again no significant difference between both devices (Table 4; Appendix Figure A9). However, only the equimolar concentrations of heparin and protamine resulted in comparable CT values to the control, for all other protamine concentrations, there was a significant difference in CT values within the assay system (Kinexus Pro or KC 1A). Here, the KC 1A showed a slightly better differentiation between protamine concentrations, as only the equimolar concentration was not significantly different from the control. The oscillatory rheometer measurements showed non-significant CT values for the equimolar concentration (2 IU/mL) and 1.5 IU/mL heparin. Furthermore, the linear slopes of viscous and elastic shear moduli were all significantly different from the control measurements without heparin (Appendix Figure A10a), indicating similarly to Figure A8 that there was a slight difference in coagulation between samples that was not obvious in the CT value. A surplus of heparin led to slightly flatter linear slopes (m (G′), m (G″)) compared to the mean control, but a shortage of protamine decreased the slopes by a far greater amount. The equimolar heparin-protamine concentration and 2 IU/mL heparin with 1.5 IU/mL protamine provided almost the same result as the control measurements. The elastic but not the viscous shear moduli at 300 s were significantly different from the control without heparin (Appendix Figure A10b).
If there is a surplus of protamine, the clotting time is prolonged, the linear slopes and the viscous and elastic shear moduli were lower as in the control measurement. These first experiments indicate that the measurement of the current heparin level by the titration method with protamine can be determined with rheological methods that would normally be performed in clinical practice with the Haemostasis Management system (HMS), but further studies are necessary to confirm these promising results.

4. Discussion

In this study, an oscillatory rheometer was used to evaluate blood coagulation status in dependence of different coagulation activators and inhibitors. We are the first to investigate the applicability of the rheological measurements to the currently used coagulation parameters for intrinsic (activated partial thromboplastin time, aPTT), extrinsic (prothrombin time, PT) coagulation, heparin status and back titration of heparin with protamine. To our knowledge this has not been done as extensively as in our work. The rheometer could differentiate between extrinsic (PT) and intrinsic coagulation (aPTT) in a similar fashion as the reference system KC 1A. Here, the rheometer provided clotting times comparable to those measured with the ball coagulometer (KC 1A). As additional feature, the oscillatory rheometer provided linear slopes of elastic and viscous components that describe the kinetics of the coagulation process as the change of both shear moduli over time. The elastic and viscous shear moduli at a certain time point give information about the portion of each components in the fluid. In this work, we used the shear moduli at 300 s after addition of the coagulation activator Thromborel, which gave an indication of the firmness of the resulting blood clot. The clotting time of the oscillatory rheometer is comparable to the systems detecting the plasmatic coagulation (here ball coagulometer KC 1A). Furthermore, the change of shear moduli over time (linear slopes) and the shear moduli at a certain time point might be comparable to viscoelastic monitoring devices such as free oscillation rheology (FOR) [24] or the Rotational Thromboelastometry (ROTEM).
Apart from simply differentiating between extrinsic and intrinsic coagulation, the oscillatory rheometer was able to differentiate between various heparin concentrations added to the blood samples. Overall, human whole blood in combination with coagulation activator or inhibitor has larger deviations (Kinexus Pro, coefficient of variation for e.g., citrated blood with Thromborel; v1Hz(G′) = 7.11%) than calibration fluids (Kinexus Pro, coefficient of variation for e.g., xanthan 0.2%; v1Hz(G′) = 2.1%), which is due to the biological variation even with the same donor (day-to day variability).
During extracorporeal circulation, the contact of blood to the large foreign surface requires a relatively strong systemic anticoagulation. Therefore, the present heparin concentration should be monitored to timely react with the addition of further heparin if necessary. The results of the heparin and protamine titration showed that with the dynamic measurements of the oscillatory rheometer were more sensitive than those of the ball coagulometer. For instance, the oscillatory rheometer identified all heparin/protamine concentrations as significantly different except the equimolar concentration when measuring clotting times (see Figure A9). In contrast to that, the ball coagulometer could not differentiate between equimolar heparin/protamine and 2.0 IU/mL heparin with 1.5 IU/mL protamine. The oscillatory rheometer (see Figure A10a,b) provided significantly different results (e.g., 2.0 IU/mL heparin/1.5 IU/mL protamine) for the linear slopes (clot formation) and the elastic shear modulus at the end of the measurement (maximum clot firmness). This example shows that further parameters can facillate the interpretation of medical parameters in clinical practice. Further, it might be possible to detect clinical conditions that do not influence the clotting time (e.g., a slight thrombocytopenia), but have an influence on the clot formation and the clot firmness.
So the rheometer was capable to detect the back titration of heparin with protamine which is normally performed with the Haemostasis Management system (HMS). That device determines the level of heparin in the blood, based on a titration with the heparin antagonist protamine. According to Nolde, the equimolar concentrations of heparin and protamine provided the lowest clotting time [25]. A deficit and also a surplus of protamine lead to prolonged clotting time. This is due to the surplus of protamine exhibiting an anticoagulant activity itself by inhibiting factor V activation [26]. This phenomenon could be also observed within the oscillatory rheometer measurements, a surplus of protamine, led to a prolonged clotting time, the linear slopes and the viscous and elastic shear moduli were lower than in the control measurement.
Currently, there are standardly used clotting measurements devices on the market (e.g., the simple KC 1A or sophisticated ROTEM) and also newer devices in their research phase. One example of a novel clotting measurement was reported by Gongting et al. [27]. The resonant acoustic spectroscopy with optical vibrometry (RASOV) measures the clot elastic modulus (CEM in kPa) via acoustic spectroscopy. A magnetic force produces a vibration to the sample surface and the result is a specific resonant frequency. Their study showed that the system is sensitive to various fibrinogen contents and is capable to assess different CEM of purified clots formed with varying amounts of fibrinogen and thrombin. On the one hand, the RASOV has the potential to analyse the clot structure, composition and its functional mechanical properties, but on the other hand it is not able to measure coagulation dynamics like the oscillatory rheometer in this study [27].
Despite several attempts to establish free oscillation rheometry, the Rotational thromboelastometry (ROTEM) remains the gold standard for sophisticated haemostasis monitoring [28]. It is a medical device that is currently used in clinical practice [29,30,31]. The ROTEM uses a fixed cuvette (Cup) with a cylindrical pin that is immersed into the cup filled with whole blood (gap of 1 mm). The movement of the rotating pin is restricted once the blood starts clotting. This is detected by a spring affixed to the pin. The kinetic change is detected optically by an integrated computer (TEMogram). Using several cuvettes at a time with different reagents, it is able to measure the interactions of coagulation factors, inhibitors and cellular components during the phases of clotting and subsequent lysis over time [30,32,33,34]. Compared to the ROTEM, Kinexus Pro provided also information on the coagulation process over time in dependence of the chosen coagulation assay and of various inhibitor concentrations. Furthermore, the rheometer is also capable to provide the clotting time (CT) and the clot firmness at a certain time point. In contrast to the oscillatory rheometer, ROTEM just measures the elasticity of the blood sample, but does not provide information on the shear moduli. Kinexus Pro can measure the change of viscous and elastic shear moduli over time, which might have a potential advantage to analyse the portion of each components in the fluid. Currently, the oscillatory rheometer is still only a research instrument and cannot be used during ECC, due to the need of manual cleaning after each measurement. Nonetheless, the first results of the oscillatory rheometer are promising as the changes can be monitored over time, thus the system might be used in medical research laboratories and maybe for routine measurements. Sophisticated blood analysis, e.g., the dissolution of a blood clot ((hyper) fibrinolysis), have to be analysed by ROTEM [30].
However, the ROTEM is expensive and sensitive to shock. Moreover, it is complicated to operate (many manual pipetting steps and special expertise for the interpretation of the results) and extremely shock sensitive. Thus, a low vibration working place is required and the device cannot be used at the patients’s bedside. Furthermore, the ROTEM needs a relatively long time (up to 40 min, fibrinolysis) to obtain all information compared to the easy coagulation (e.g., ball coagulometer) devices [35].
This might be an advantage of the oscillatory rheometer, as the measurements are faster than with ROTEM but provide more information on coagulation status than ball coagulometer and nearly the information of ROTEM. Nevertheless, future hardware improvements are necessary, including a miniaturisation of the system, due to the lack of space in clinical practice and the option of fast and repeated measurements. A possible solution would be the substitution of the measuring chamber with a disposable chamber functioning as a cuvette. If a disposable chamber cannot be realised, a microfluidic system with connectors from the ECC to the measuring chamber might be another solution. The latter system requires refined microchannels that do not activate blood components by shear force due to turbulences or edges. Otherwise, a thrombus can be generated in the blood sample and provide falsified data of the current haemostasis status.
Additionally, a cleaning and waste reservoir should be integrated into the microfluidic system and pipetting steps minimised by automatisation.

5. Conclusions

In summary, the results of our study indicate that blood coagulation can be measured with the oscillatory rheometer. The use of different activators and various inhibitor concentrations provided a proof-of concept that reliable haemostasis monitoring is possible and comparable to devices used in routine diagnosis. There are currently further studies needed to provide additional evidence of the suitability of the oscillatory rheometer to detect blood coagulation optimisation steps (e.g., miniaturisation, automatisation and fluidic system) in order to create a convenient device to meet our ultimate goal, a haemostasis system near the patient (point-of-care) that performs fast and complex analyses with low or no sample preparation.

Acknowledgments

The authors would like to thank Torsten Remmler (Malvern Instruments GmbH) for his valuable technical support on this project. This study was partly funded by the “Bundesministerium für Wirtschaft und Energie” as a ZIM cooperation project (KF2589406FR2). Furthermore, we acknowledge the support by Deutsche Forschungsgemeinschaft and Open Access Publishing Fund of University of Tübingen.

Author Contributions

Silju-John Kunnakattu, Sandra Stoppelkamp, Theresia Groß, Nicole Rauch, Stefan Fennrich and Hans P. Wendel conceived and designed the experiments; Silju-John Kunnakattu, Theresia Groß, Juvano Knieps, Tim Kemper performed the experiments; Silju-John Kunnakattu, Sandra Stoppelkamp and Theresia Groß analysed the data; Hans P. Wendel, Nicole Rauch, Stefan Fennrich contributed reagents/materials/analysis tools; Silju-John Kunnakattu, Theresia Groß, Sandra Stoppelkamp wrote the paper.

Conflicts of Interest

The authors declare no conflict of interest.

Appendix A

Figure A1. Repeatability measurements of citrated blood with additional heparin activated by Thromborel. Mean elastic and viscous shear moduli of citrated and heparinised (a) 0.5 IU/mL, (c) 0.8 IU/mL) blood activated with Thromborel (n = 10 ± SD) are shown over time. The measurement was performed at a shear stress of 0.04 Pa with 1 Hz and a 1°/40 mm stainless steel cone geometry; (b,d) Enlarged parts from diagrams (a,c), respectively. The dashed red line at 0.02 Pa visualises the elastic shear modulus and the dotted blue line at 0.05 Pa the viscous shear modulus of uncoagulated citrated blood with no coagulation activator. After the addition of the activator Thromborel the increase of G′ and G″ was smaller than without heparin. The inhibitor heparin prolonged the clotting time (CT, black solid line) in comparison to the reference measurement.
Applsci 08 00084 g0a1aApplsci 08 00084 g0a1b
Figure A2. Repeatability measurements of citrated blood with additional heparin activated by Thromborel. Mean elastic and viscous shear moduli of citrated and heparinised (a) 1.0 IU/mL (n = 10 ± SD), (c) 1.5 IU/mL (n = 4 ± SD) blood activated with Thromborel are shown over time. The measurement was performed at a shear stress of 0.04 Pa with 1 Hz and a 1°/40 mm stainless steel cone geometry; (b,d) Enlarged parts from diagrams (a,c), respectively. The dashed red line at 0.02 Pa visualises the elastic shear modulus and the dotted blue line at 0.05 Pa the viscous shear modulus of uncoagulated citrated blood with no coagulation activator. After the addition of the activator Thromborel the increase of G′ and G″ was smaller than without heparin. In comparison to 0.5, 0.8 IU/mL heparin and the reference measurement, the clotting time (CT, black solid line) was further prolonged by 1.0 IU/mL (72.3 s) and 1.5 IU/mL heparin (131.5 s).
Applsci 08 00084 g0a2
Figure A3. Clotting time (CT) of citrated blood with various heparin concentrations activated with Thromborel measured with Kinexus Pro (grey) or KC 1A (white). The asterics above the bars indicate that this particular bar is significantly different from all others. Apart from the higher heparin concentration (1.5 IU/mL; * p < 0.05) there was no significant difference between CT measured with both devices. The addition of heparin led to significant increases in CT values (*** p < 0.001) for each concentration and in both devices.
Applsci 08 00084 g0a3
Figure A4. Analysis of linear slopes of elastic (a) and viscous (b) shear moduli and the elastic (c) and viscous (d) shear moduli at 300 s in Kinexus Pro measurement of citrated blood with additional heparin activated with Thromborel. The linear slopes of the elastic shear moduli (a) were significantly different from each other except 1.0 and 1.5 IU/mL heparin and those of viscous shear moduli (b) were significantly different from each other except the control without heparin and the lowest conentration of 0.5 IU/mL. The asterics above the bars indicate that this particular bar is significantly different from all others. The shear moduli at 300 s (c,d) were indicative of clot firmness. For both elastic (c) and viscous (d) shear moduli, there was a sharp significant decrease obsesrved for 1.0 and 1.5 IU/mL heparin. The two higher concentrations were not significantly different any longer, which hints towards a “yes-no” answer in clot firmness. * p < 0.05, *** p < 0.001, ns-non significant.
Applsci 08 00084 g0a4
Figure A5. Comparison between PT and aPTT, respectively, measured with Kinexus Pro and KC 1A (n = 10). The asterics above the bars indicate that this particular bar is significantly different from all others. The clotting times (CT) determined with either Kinexus or the ball coagulometer were not significantly different within one assay but significantly longer for aPTT measurements in both devices. *** p < 0.001.
Applsci 08 00084 g0a5
Figure A6. Comparison between extrinsic and intrinsic assays determined with the oscillatory rheometer (n = 10). The asterics above the bars indicate that this particular bar is significantly different from all others. The linear slopes of elastic (a) and viscous (b) shear moduli of PT were significantly steeper than for aPTT. Similarly, the clot firmess, described by (c) the elastic and (d) the viscous shear moduli at 300 s were significantly stronger, i.e., higher, for PT than for aPTT measuremets. *** p < 0.001.
Applsci 08 00084 g0a6
Figure A7. Clotting times (CT) of citrated blood with various heparin and the equimolar protamine concentrations activated with Thromborel (n = 5). The asterics above the bars indicate that this particular bar is significantly different from all others. Comparing CTs measured with KC 1A and Kinexus Pro, there was no significant difference observed, i.e., the systems provided comparable results with the three heparin-protamine combinations. * p < 0.05, *** p < 0.001.
Applsci 08 00084 g0a7
Figure A8. The oscillatory rheometer measurements of heparin-antagonising with protamine in citrated blood activated with Thromborel (n = 5). The asterics above the bars indicate that this particular bar is significantly different from all others. (a) The mean linear slopes of elastic (G′) and viscous (G″) shear moduli (±SD) of citrated blood with heparin and protamine are still significantly less steep than the control sample without heparin, but much steeper than the heparinised sample without protamine; (b) The means of elastic (G′) and viscous (G″) shear moduli at 300 s (±SD) of the protamine-antagonised heparin samples are not significantly different from the non-heparinised control, indicating a similar clot firmness in those samples. * p < 0.05, ** p < 0.01, *** p < 0.001, ns-non significant.
Applsci 08 00084 g0a8
Figure A9. Clotting times of the back titration of heparin (2 IU/mL) with protamine (0.5–3.0 IU/mL) (n = 3). The effect of the inhibitor heparin was reversed by various concentrations of protamine. The control measurement was citrated blood with Thromborel. The asterics above the bars indicate that this particular bar is significantly different from all others. Both devices provided similar clotting times and were thus comparable. The lowest protamine concentration of 0.5 IU/mL had a strongly delayed clotting time (CT). The mean CT of the equimolar concentration of protamine/heparin with 2 IU/mL was not significantly different from the clotting time of the control measurement. For Kinexus, the lower concentration of 1.5 IU/mL was also not significantly different from the control. ** p < 0.01, *** p < 0.001.
Applsci 08 00084 g0a9
Figure A10. Back titration of heparin with protamine determined by the oscillatory rheometer (n = 3). The asterics above the bars indicate that this particular bar is significantly different from all others. Citrated blood was heparinised (2.0 IU/mL) and antagonised with various protamine concentrations before activation with Thromborel. Non-heparinised citrated blood activated by Thromborel served as control. (a) The mean linear slopes of elastic and viscous shear moduli (±SD) were all significantly different from the non-heparinsed control; (b) The elastic shear moduli were significantly different, whereas the visocus shear moduli were not significantly different from the mean control. * p < 0.05, *** p < 0.001.
Applsci 08 00084 g0a10

References

  1. Punjabi, P.P.; Taylor, K.M. The science and practice of cardiopulmonary bypass: From cross circulation to ecmo and sirs. Glob. Cardiol. Sci. Pract. 2013, 2013, 249–260. [Google Scholar] [CrossRef] [PubMed]
  2. Krajewski, S.; Krauss, S.; Kurz, J.; Neumann, B.; Schlensak, C.; Wendel, H.P. Real-time measurement of free thrombin: Evaluation of the usability of a new thrombin assay for coagulation monitoring during extracorporeal circulation. Thromb. Res. 2014, 133, 455–463. [Google Scholar] [CrossRef] [PubMed]
  3. Rose, E.A.; Gelijns, A.C.; Moskowitz, A.J.; Heitjan, D.F.; Stevenson, L.W.; Dembitsky, W.; Long, J.W.; Ascheim, D.D.; Tierney, A.R.; Levitan, R.G.; et al. Long-term use of a left ventricular assist device for end-stage heart failure. N. Engl. J. Med. 2001, 345, 1435–1443. [Google Scholar] [CrossRef] [PubMed]
  4. Niimi, Y.; Ishiguro, Y.; Nakata, Y.; Goto, T.; Morita, S.; Yamane, S. Platelet adhesion to heparin coated oxygenator fibers under in vitro static conditions: Impact of temperature. ASAIO J. 2001, 47, 361–364. [Google Scholar] [CrossRef] [PubMed]
  5. Metzelder, S.M. Einfluss Dreier Verschiedener Techniken der Extrakorporalen Zirkulation auf Parameter der Hämodynamik, Inflammation, Blutgerinnung und Hämolyse bei Aortokoronaren Bypass-Operationen; RWTH Aachen University: Aachen, Germany, 2009. [Google Scholar]
  6. Myers, D.R.; Qiu, Y.; Fay, M.E.; Tennenbaum, M.; Chester, D.; Cuadrado, J.; Sakurai, Y.; Baek, J.; Tran, R.; Ciciliano, J.C.; et al. Single-platelet nanomechanics measured by high-throughput cytometry. Nat. Mater. 2017, 16, 230–235. [Google Scholar] [CrossRef] [PubMed]
  7. Xu, X.; Zhu, J.; Chen, Z. Dynamic and quantitative assessment of blood coagulation using optical coherence elastography. Sci. Rep. 2016, 6, 24294. [Google Scholar] [CrossRef] [PubMed]
  8. Tripathi, M.M.; Hajjarian, Z.; Van Cott, E.M.; Nadkarni, S.K. Assessing blood coagulation status with laser speckle rheology. Biomed. Opt. Express 2014, 5, 817–831. [Google Scholar] [CrossRef] [PubMed]
  9. Tripathi, M.M.; Egawa, S.; Wirth, A.G.; Tshikudi, D.M.; Van Cott, E.M.; Nadkarni, S.K. Clinical evaluation of whole blood prothrombin time (PT) and international normalised ratio (INR) using a laser speckle rheology sensor. Sci. Rep. 2017, 7, 9169. [Google Scholar] [CrossRef] [PubMed]
  10. Marn, P.T.J. Numerical study of blood flow in stenotic artery. Appl. Rheol. 2009, 19, 13060. [Google Scholar]
  11. Collins, W.E.; Shibeshi, S.S. Correleation of hemorheology parameter hematocrit with hemodynamic factors and arterial diseases. Appl. Rheol. 2010, 20, 64092. [Google Scholar]
  12. Versteeg, H.H.; Heemskerk, J.W.; Levi, M.; Reitsma, P.H. New fundamentals in hemostasis. Physiol. Rev. 2013, 93, 327–358. [Google Scholar] [CrossRef] [PubMed]
  13. Dempfle, C.E.; Kalsch, T.; Elmas, E.; Suvajac, N.; Lucke, T.; Munch, E.; Borggrefe, M. Impact of fibrinogen concentration in severely ill patients on mechanical properties of whole blood clots. Blood Coagul. Fibrinolysis Int. J. Haemost. Thromb. 2008, 19, 765–770. [Google Scholar] [CrossRef] [PubMed]
  14. Mezger, T. Das Rheologie Handbuch: Für Anwender von Rotations-und Oszillations-Rheometern; Vincentz: Hannover, Germany, 2010. [Google Scholar]
  15. Frank, A.J. Understanding Instrument Inertia Corrections in Oscillation; TA Instruments: New Castle, DE, USA, 2005. [Google Scholar]
  16. Kinexus Pro+®—Forschungs Rheometer zur Charakterisierung Komplexer Fluide. Malvern Instruments Ltd.: Herrenberg, Germany. Available online: http://www.Malvern.Com/de/products/product-range/kinexus-range/kinexus-pro-plus/default.Aspx (accessed on 28 September 2016).
  17. ABW Medizin und Technik GmbH. Mc 1—Micro Macro Vet. Available online: http://www.Merlinmedical.Net/index.Php?Id=15&l=1 (accessed on 2 July 2014).
  18. ABW Medizin und Technik GmbH/Heinrich Amelung GmbH. Operation Manual mc1. Instructions. Merlin Medical Experience the Power of Innovation. Available online: http://www.merlinmedical.net/en/info-box/operation-manuals/ (accessed on 5 January 2017).
  19. ABW Medizin und Technik GmbH. Mechanical Ball Method-Measuring Principle. Available online: http://www.Merlinmedical.Net/index.Php?Id=6&l=1 (accessed on 5 July 2014).
  20. Siemens Healthcare Diagnostics Inc. Thromborel S (Package Insert). Available online: https://de.scribd.com/document/256489960/Insert-de-TP-Thromborel-S (accessed on 5 January 2017).
  21. Hartmann, M.; Sucker, C.; Boehm, O.; Koch, A.; Loer, S.; Zacharowski, K. Effects of cardiac surgery on hemostasis. Transfus. Med. Rev. 2006, 20, 230–241. [Google Scholar] [CrossRef] [PubMed]
  22. Tomaiuolo, G.; Carciati, A.; Caserta, S.; Guido, S. Blood linear viscoelasticity by small amplitude oscillatory flow. Rheol. Acta 2016, 55, 485–495. [Google Scholar] [CrossRef]
  23. Kappes, U. Zur Überwachung der antikoagulanzien-therapie. In HEPTEST-STAT [Arbeitsanleitung]; HEPTEST Laboratories Inc.: Augsburg, Germany, 2010. [Google Scholar]
  24. Evans, P.A.; Hawkins, K.; Lawrence, M.; Barrow, M.S.; Williams, P.R.; Williams, R.L. Studies of whole blood coagulation by oscillatory shear, thromboelastography and free oscillation rheometry. Clin. Hemorheol. Microcirc. 2008, 38, 267–277. [Google Scholar] [PubMed]
  25. Matthias, N. Einfluss Verschiedener Heparinisierungsprotokolle auf den Postoperativen Blutverlust und das Gerinnungssystem bei Kardiochirurgischen Operationen unter Einsatz der Extrakorporalen Zirkulation; Universität Hamburg: Hamburg, Germany, 2002. [Google Scholar]
  26. Ainle, F.N.; Preston, R.J.S.; Jenkins, P.V.; Nel, H.J.; Johnson, J.A.; Smith, O.P.; White, B.; Fallon, P.G.; O’Donnell, J.S. Protamine sulfate down-regulates thrombin generation by inhibiting factor v activation. Blood 2009, 114, 1658–1665. [Google Scholar] [CrossRef] [PubMed]
  27. Wu, G.; Krebs, C.R.; Lin, F.C.; Wolberg, A.S.; Oldenburg, A.L. High sensitivity micro-elastometry: Applications in blood coagulopathy. Ann. Biomed. Eng. 2013, 41, 2120–2129. [Google Scholar] [CrossRef] [PubMed]
  28. Winstedt, D.; Tynngard, N.; Olanders, K.; Schott, U. Free oscillation rheometry monitoring of haemodilution and hypothermia and correction with fibrinogen and factor xiii concentrates. Scand. J. Trauma Resusc. Emerg. Med. 2013, 21, 20. [Google Scholar] [CrossRef] [PubMed]
  29. Hans, G.A.; Besser, M.W. The place of viscoelastic testing in clinical practice. Br. J. Haematol. 2016, 173, 37–48. [Google Scholar] [CrossRef] [PubMed]
  30. Whiting, D.; DiNardo, J.A. Teg and rotem: Technology and clinical applications. Am. J. Hematol. 2014, 89, 228–232. [Google Scholar] [CrossRef] [PubMed]
  31. Bolliger, D.; Seeberger, M.D.; Tanaka, K.A. Principles and practice of thromboelastography in clinical coagulation management and transfusion practice. Transfus. Med. Rev. 2012, 26, 1–13. [Google Scholar] [CrossRef] [PubMed]
  32. Spannagl, M. Blutgerinnungsanalytik. In Poct—Patientennahe Labordiagnostik; Luppa, B.P., Schlebusch, H., Eds.; Springer: Berlin/Heidelberg, Germany, 2008; pp. 91–99. [Google Scholar]
  33. Schöchl, H.; Solomon, C.; Schulz, A.; Voeckel, W.; Hanke, A.; Griensven, M.V.; Redl, H.; Bahrami, S. Thromboelastometry (tem®) findings in disseminated intravascular coagulation in a pig model of endotoxinemia. Feinstein Inst. Med. Res. 2011, 17, 266–272. [Google Scholar]
  34. Calatzis, A.; Spannagl, M.; Vorweg, M. Zielgerichtete Behandlung akuter Hämostasestörungen mit Hilfe der Rotem Analyse; Tem Innovations GmbH: München, Germany, 2011. [Google Scholar]
  35. Daraktchiev, A.T. Evaluation Eines Neuen Thromboelastographie-Verfahrens-Rotem (Rotationselastometrie); Philipps-University Marburg: Marburg, Germany, 2009. [Google Scholar]
Figure 1. The oscillatory rheometer reliably determines the prothrombin time (PT) of citrated blood activated with Thromborel. (a) Mean elastic and viscous shear moduli of citrated blood activated with Thromborel (n = 10 ± SD) are shown over time. The measurement was performed at a shear stress of 0.04 Pa with 1 Hz and a 1°/40 mm stainless steel cone geometry; (b) Enlarged part from diagram (a). The dashed red line at 0.02 Pa visualises the elastic shear modulus and the dotted blue line at 0.05 Pa the viscous shear modulus of uncoagulated citrated blood with no coagulation activator. After the addition of the activator Thromborel an increase of G′ and G″ was observed. The black solid line is the clotting time (CT = 25.2 s).
Applsci 08 00084 g001
Figure 2. The activated partial thromboplastin time (aPTT) is performed as a further coagulation assay with the oscillatory rheometer. Citrated blood was activated by Pathromtin and CaCl2. (a) The mean of n = 10 measurements with respective standard deviations are shown. The measurement was performed at a shear stress of 0.04 Pa with 0.1 Hz and a 1°/40 mm stainless steel cone geometry; (b) Enlarged part from diagram (a). The dashed red line at 0.02 Pa visualises the elastic shear modulus and the dotted blue line at 0.05 Pa the viscous shear modulus of uncoagulated citrated blood with no coagulation activator. After the addition of the activator Pathromtin and CaCl2 an increase of G′ and G″ was observed. The clotting time (CT) is about 43.7 s (black solid line). The values of G′ and G″ at 300 s are smaller in comparison to the PT control measurements.
Applsci 08 00084 g002
Figure 3. Citrated blood was heparinised and antagonised with protamine before activation with Thromborel. The effect of the inhibitor heparin was reversed by the equivalent amount of protamine. Citrated blood (orange) and a heparinised (1 IU/mL) citrated blood (black) activated with Thromborel were the reference measurements. All protamine-neutralised heparin concentrations provided results comparable to the reference measurement of citrated blood without heparin (orange) (n = 5).
Applsci 08 00084 g003
Figure 4. Back titration of heparin with protamine. Citrated blood was heparinised (2.0 IU/mL) and simultaneously antagonised with various concentrations of protamine before activation with Thromborel. Citrated blood without heparin activated by Thromborel served as control. The effect of the inhibitor heparin was reversed by various concentrations of protamine (1.5–3.0 IU/mL). Both, 0.5 and 1.0 IU/mL protamine were too weak to reverse the effect of heparin. The lowest protamine concentration of 0.5 IU/mL has a strongly delayed clotting time (CT), a flatter slope and a lower elastic and viscous shear moduli compared to the other measurements.
Applsci 08 00084 g004
Table 1. Comparative data of Kinexus Pro and KC 1A for the measurement of the prothrombin time (PT) (n = 10). Citrated blood without and with various concentrations of heparin was activated by Thromborel. Summary of the clotting time (CT), elastic (G′) and viscous (G″) shear moduli at 300 s and linear slopes (m (G′) and m (G″)).
SampleKinexus ProKC 1AKinexus Pro
CT/sCT/sG′ (Pa) at 300 sG″ (Pa) at 300 sm (G′/Pa s−1)m (G″/Pa s−1)
Control25.2 ± 1.025.4 ± 3.318.5 ± 4.5 1.7 ± 0.46.0 × 10−1 ± 0.8 × 10−11.2 × 10−1 ± 0.3 × 10⁻¹
0.5 IU/mL40.3 ± 1.240.5 ± 1.318.6 ± 3.91.8 ± 0.24.4 × 10−1 ± 0.7 × 10−19.0 × 10−2 ± 1.8 × 10⁻²
0.8 IU/mL51.4 ± 1.348.8 ± 4.517.5 ± 3.92.0 ± 0.41.4 × 10−1 ± 0.8 × 10−12.3 × 10−2 ± 1.3 × 10⁻²
1.0 IU/mL72.3 ± 4.268.4 ± 7.31.8 ± 0.56.5 × 10−1 ± 0.7 × 10−18.6 × 10−3 ± 2.3 × 10−34.2 × 10−3 ± 1.2 × 10⁻³
1.5 IU/mL (n = 4)131.5 ± 7.4102.7 ± 10.30.5 ± 0.33.0 × 10−1 ± 0.5 × 10−11.2 × 10−3 ± 0.8 × 10−39.0 × 10−4 ± 6.3 × 10⁻⁴
Table 2. Citrated blood activated by Pathromtin and CaCl2 (n = 10). Summary of the clotting time (CT), elastic (G′) and viscous (G″) shear moduli at 300 s and linear slopes (m (G′) and m (G″)).
TestKinexus ProKC 1AKinexus Pro
CT/sCT/sG′ (Pa) at 300 sG″ (Pa) at 300 sm (G′/Pa s−1)m (G″/Pa s−1)
aPTT43.7 ± 3.9 44.1 ± 4.3 6.2 × 101 ± 0.4 × 10−17.4 × 10−2 ± 1.9 × 10−22.6 × 10−2 ± 0.4 × 10⁻² 6.4 × 10⁻³ ± 1.4 × 10⁻³
Table 3. Citrated blood activated by Thromborel (Control) and various concentrations of heparin neutralised with the equimolar amount of protamine were equally activated by Thromborel (n = 5). Summary of the clotting time (CT), elastic (G′) and viscous (G″) shear moduli at 300 s and linear slopes (m (G′) and m (G″)).
SampleKinexus ProKC 1AKinexus Pro
CT/sCT/sG′ (Pa)at 300 sG″ (Pa)at 300 sm (G′/Pa s−1)m (G″/Pa s−1)
Control23.7 ± 1.621.4 ± 2.922.7 ± 4.32.0 ± 0.572.3 × 10−2 ± 7.5 × 10−216.1 × 10⁻² ± 3.0 × 10⁻²
1.0 IU/mL heparin83.3 ± 4.279.0 ± 5.62.1 ± 0.050.7 ± 0.077.8 × 10−3 ± 2.2 × 10−35.3 × 10−3 ± 1.2 × 10⁻³
1.0 IU/mL heparin and protamine25.8 ± 0.924.3 ± 3.521.5 ± 3.81.9 ± 0.339.0 × 10−2 ± 4.0 × 10−28.1 × 10−2 ± 3.3 × 10⁻²
2.0 IU/mL heparin and protamine 26.9 ± 1.325.4 ± 4.124.1 ± 2.42.2 ± 0.442.7 × 10−2 ± 5.0 × 10−29.5 × 10−2 ± 0.7 × 10⁻²
3.0 IU/mL heparin and protamine25.9 ± 1.324.7 ± 4.523.5 ± 3.62.1 ± 0.151.0 × 10−2 ± 3.2 × 10−211.0 × 10⁻² ± 0.1 × 10⁻²
Table 4. Summary of the clotting time (CT), elastic (G′) and viscous (G″) shear moduli at 300 s and linear slopes (m (G′) and m (G″)). Citrated blood was heparinised (2.0 IU/mL) and antagonised with various concentrations of protamine (0.5–3.0 IU/mL) before activation with Thromborel (n = 3). Citrated blood without heparin activated by Thromborel served as control.
SampleKinexus ProKC 1AKinexus Pro
CT/sCT/s (KC 1A)G′ (Pa)G″ (Pa)m (G′/Pa s−1)m (G″/Pa s−1)
Control28.5 ± 1.427.2 ± 1.918.4 ± 4.11.8 ± 0.4554.5 × 10−3 ± 6.5 × 10−382.0 × 10⁻³ ± 1.6 × 10⁻³
2 IU/mL heparin with:
0.5 IU/mL protamine108.3 ± 6.8101.4 ± 10.50.3 ± 0.21.1 × 10−1 ± 6.9 × 10−1110.0 × 10−5 ± 2.1 × 10−57.5 × 10−5 ± 3.5 × 10⁻⁵
1.0 IU/mL protamine69.1 ± 4.464.2 ± 7.523.1 ± 3.92.3 ± 0.993.5 × 10−3 ± 0.6 × 10−321.6 × 10⁻³ ± 1.0 × 10⁻³
1.5 IU/mL protamine37.1 ± 1.839.9 ± 1.931.3 ± 3.72.4 ± 0.4490.0 × 10−3 ± 0.6 × 10−3106.0 × 10−3 ± 3.1 × 10⁻³
2.0 IU/mL protamine29.7 ± 1.628.1 ± 1.732.9 ± 4.62.4 ± 0.2505.0 × 10−3 ± 4.2 × 10−3116.0 × 10−3 ± 2.4 × 10⁻³
3.0 IU/mL protamine38.3 ± 2.242.7 ± 2.126.8 ± 4.12.3 ± 0.5317.2 × 10−3 ± 4.8 × 10−360.0 × 10⁻³ ± 1.4 × 10⁻³

