Structural Health Monitoring and Time-Dependent Effects Analysis of Self-Anchored Suspension Bridge with Extra-Wide Concrete Girder

Abstract
:1. Introduction
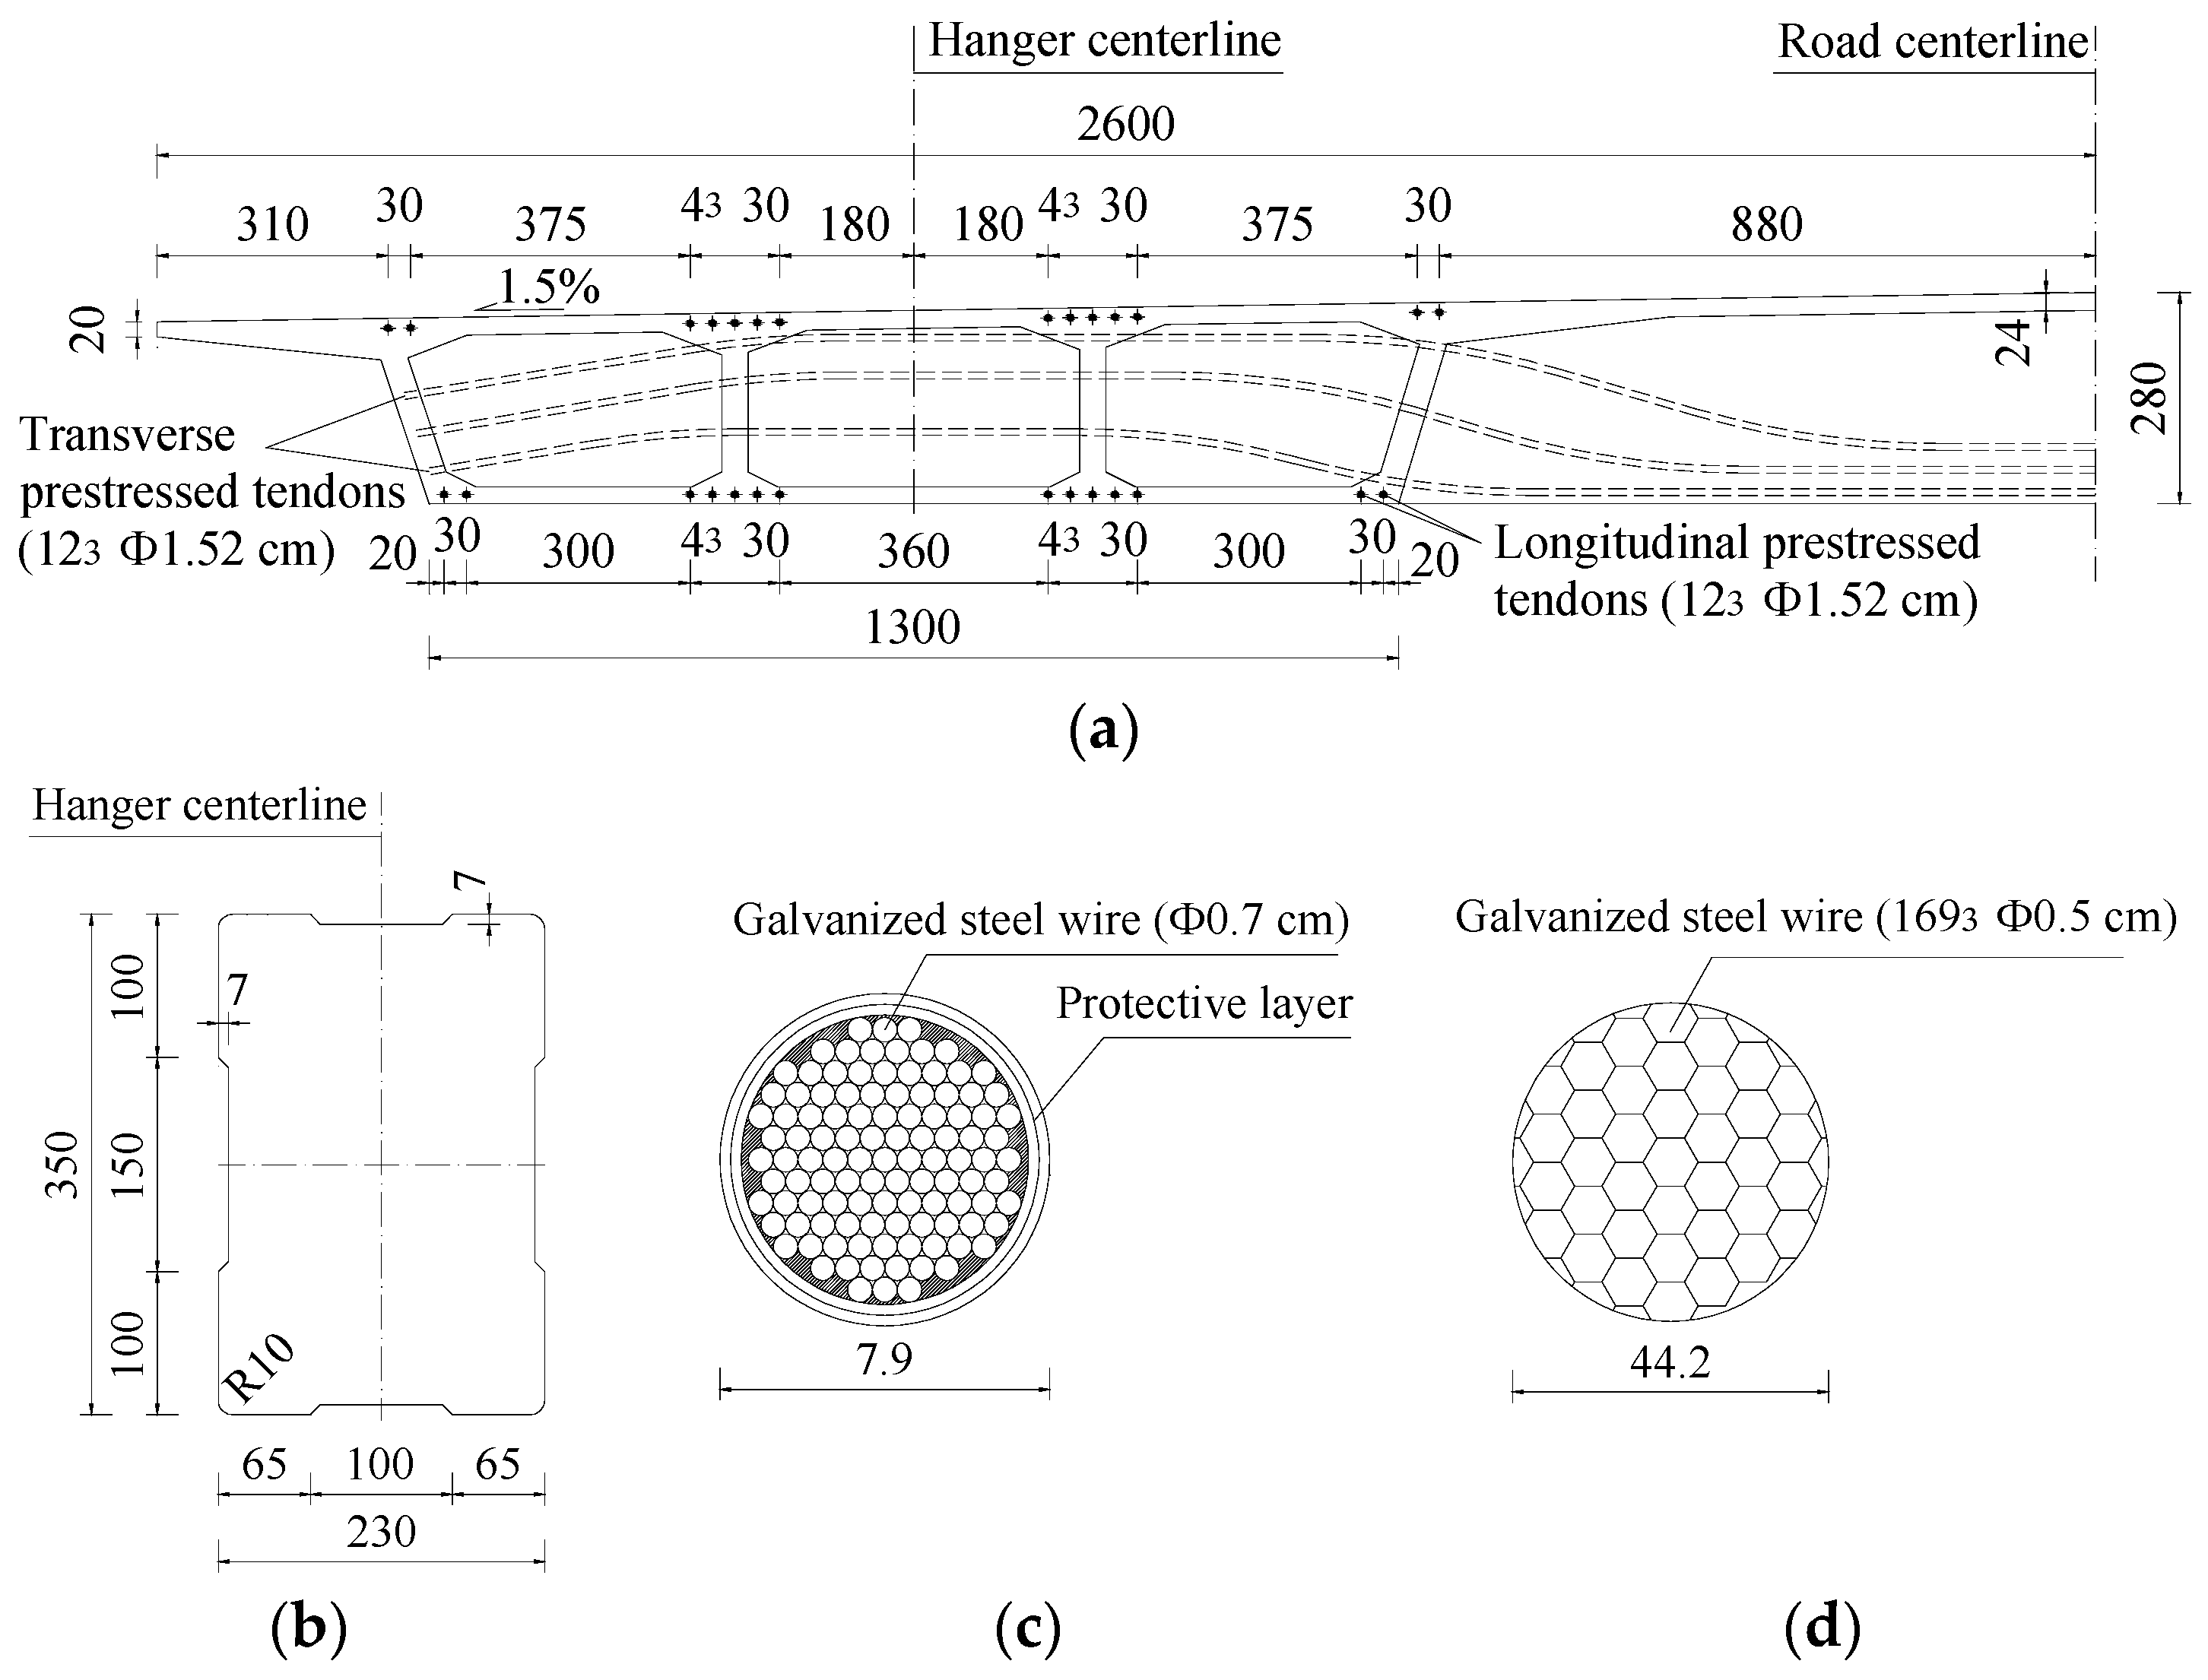
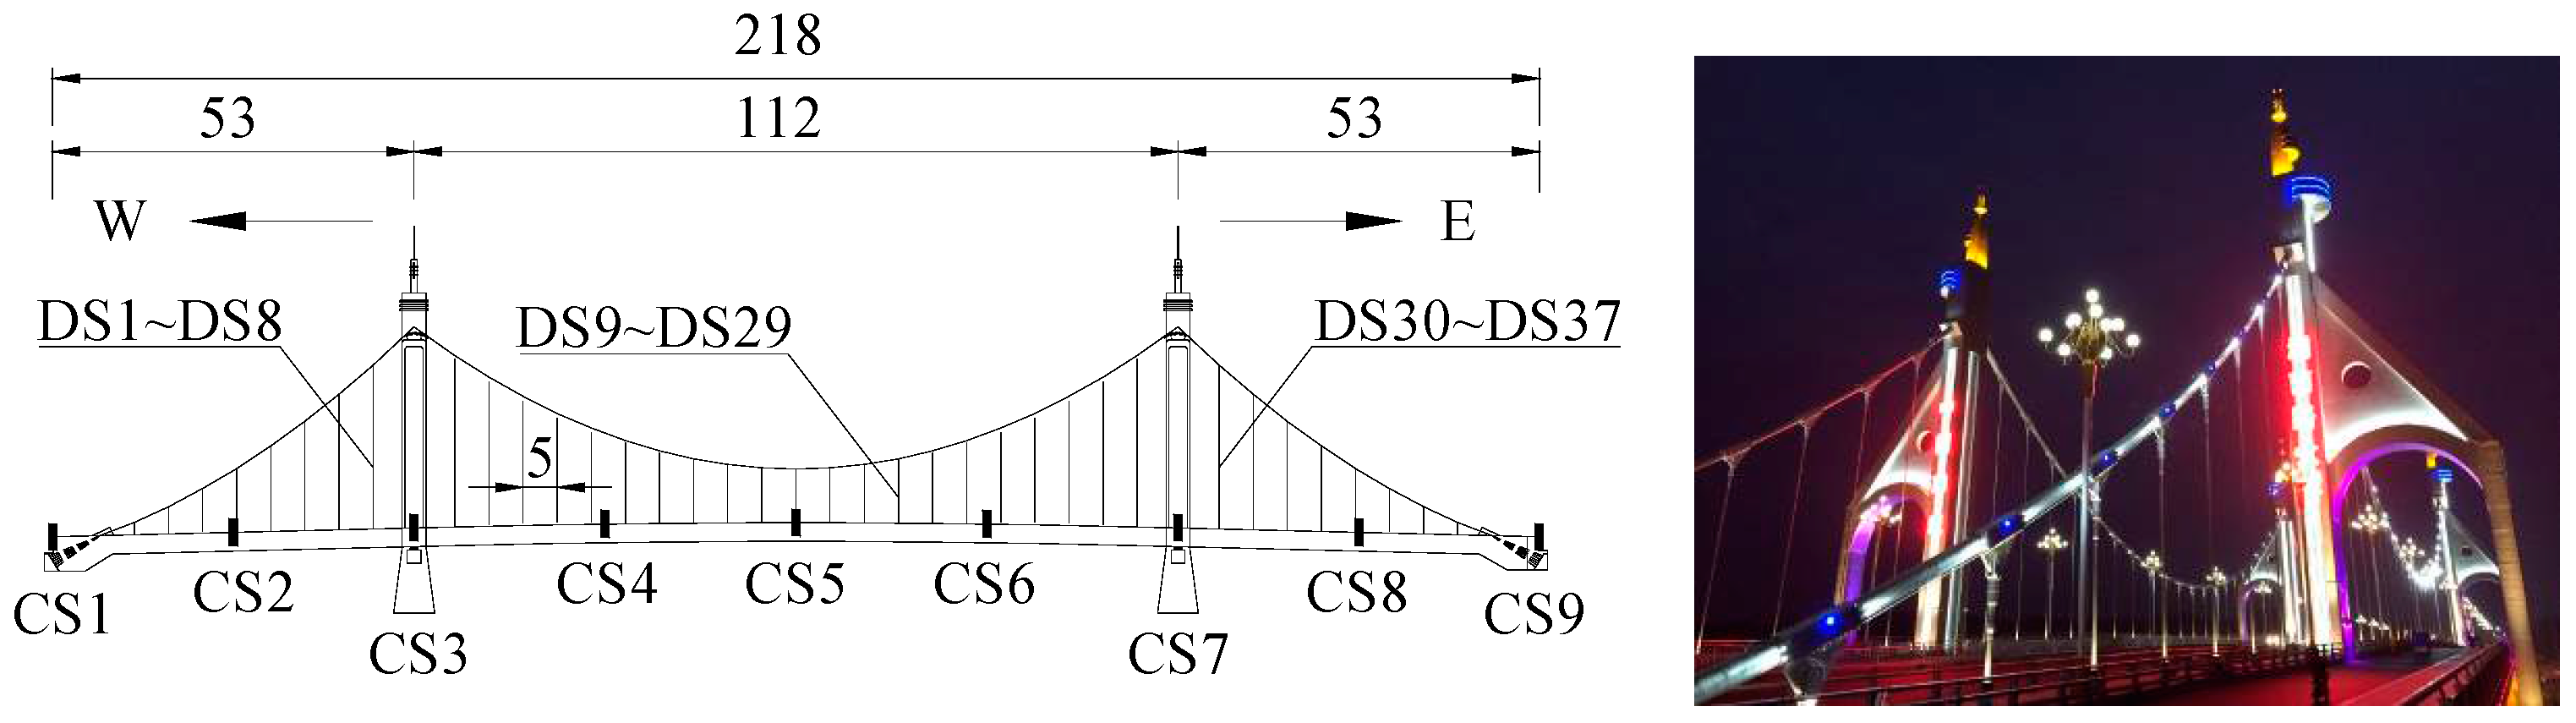
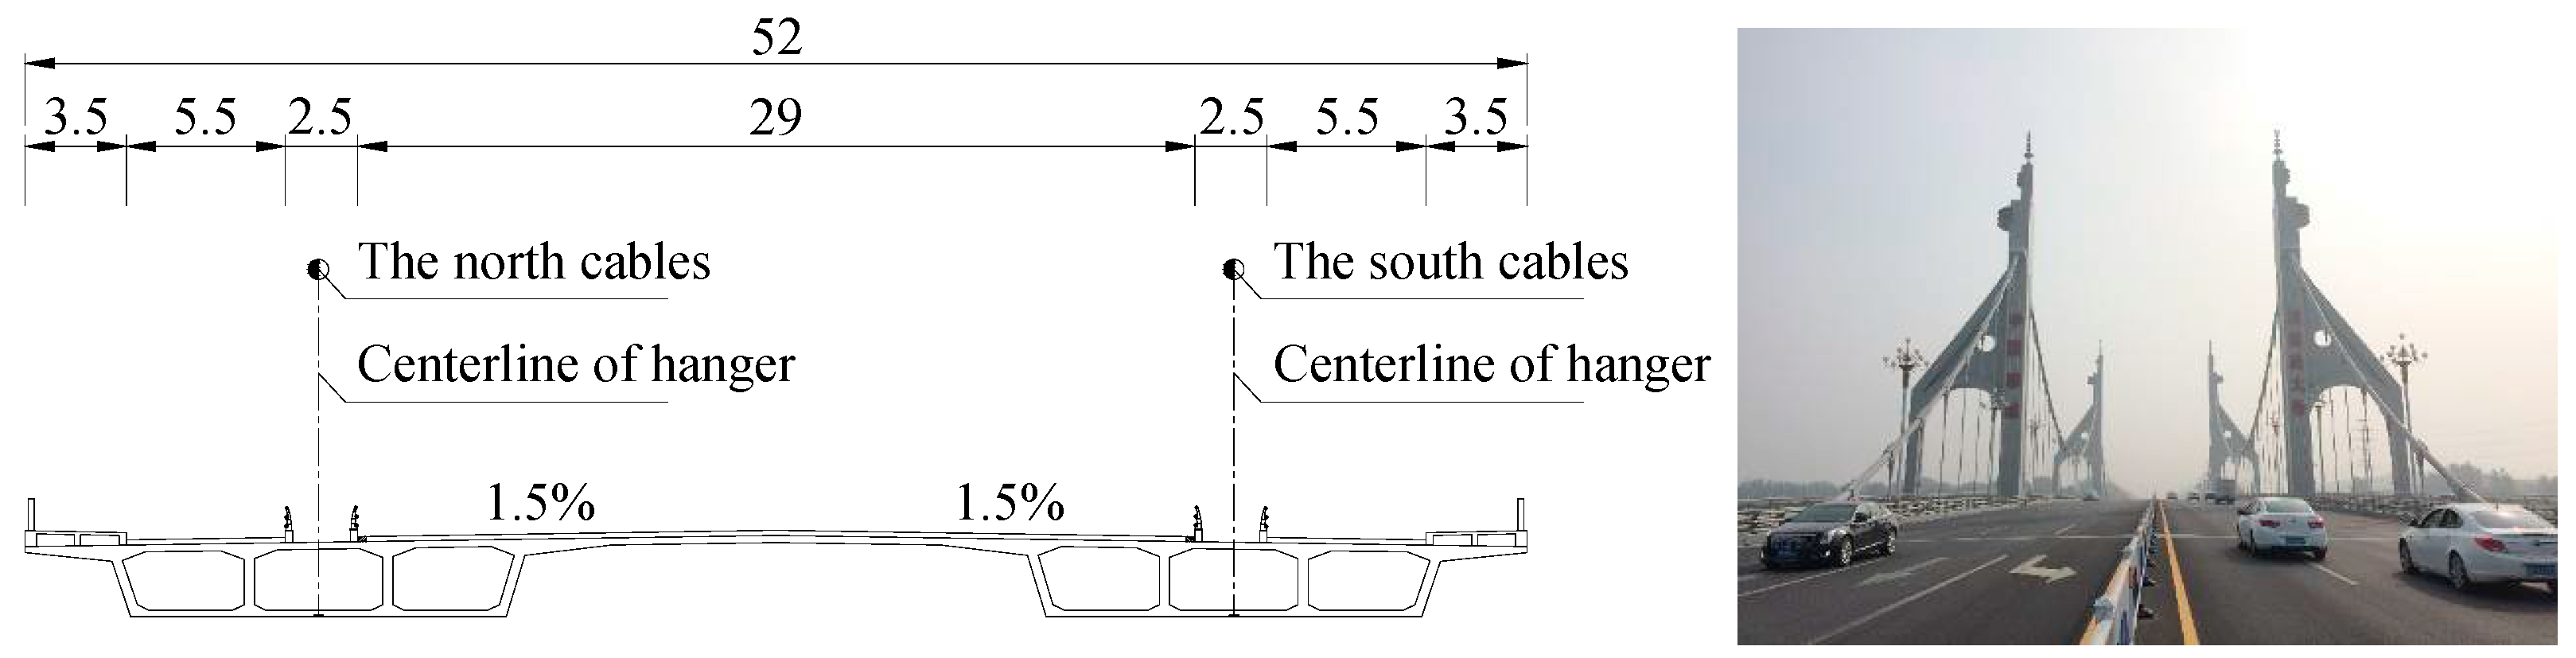
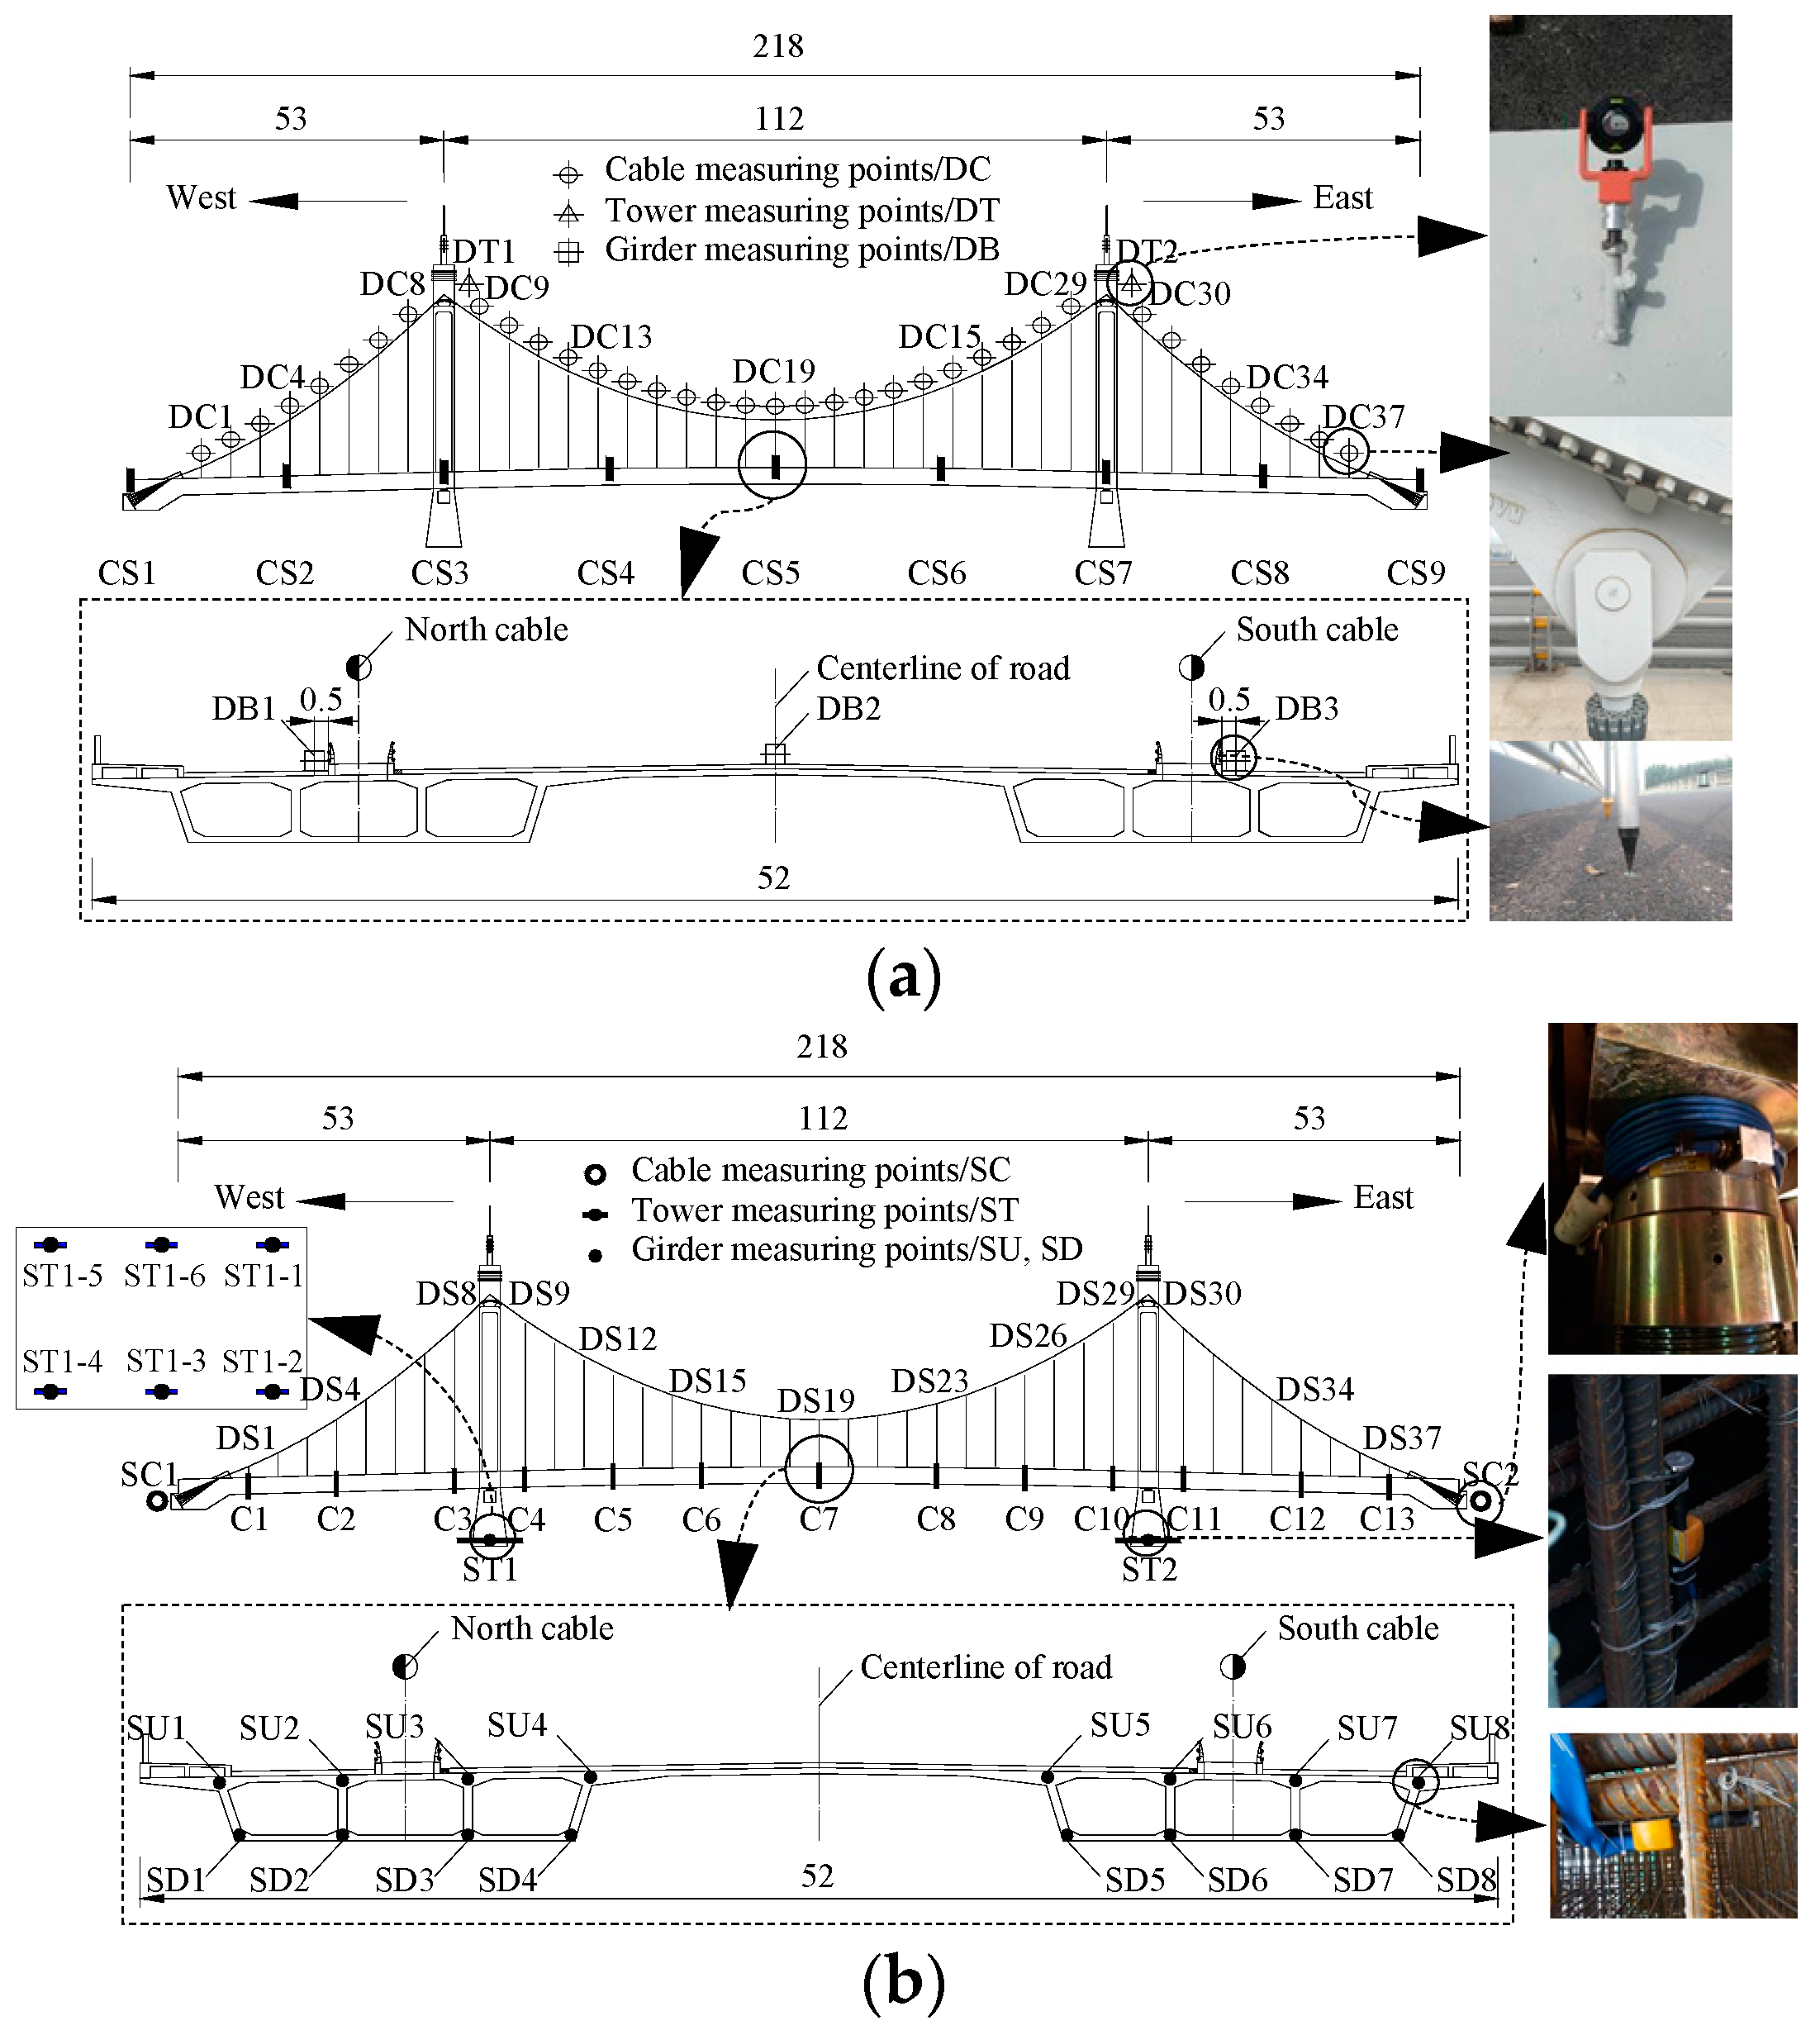
2. Hunan Road Bridge
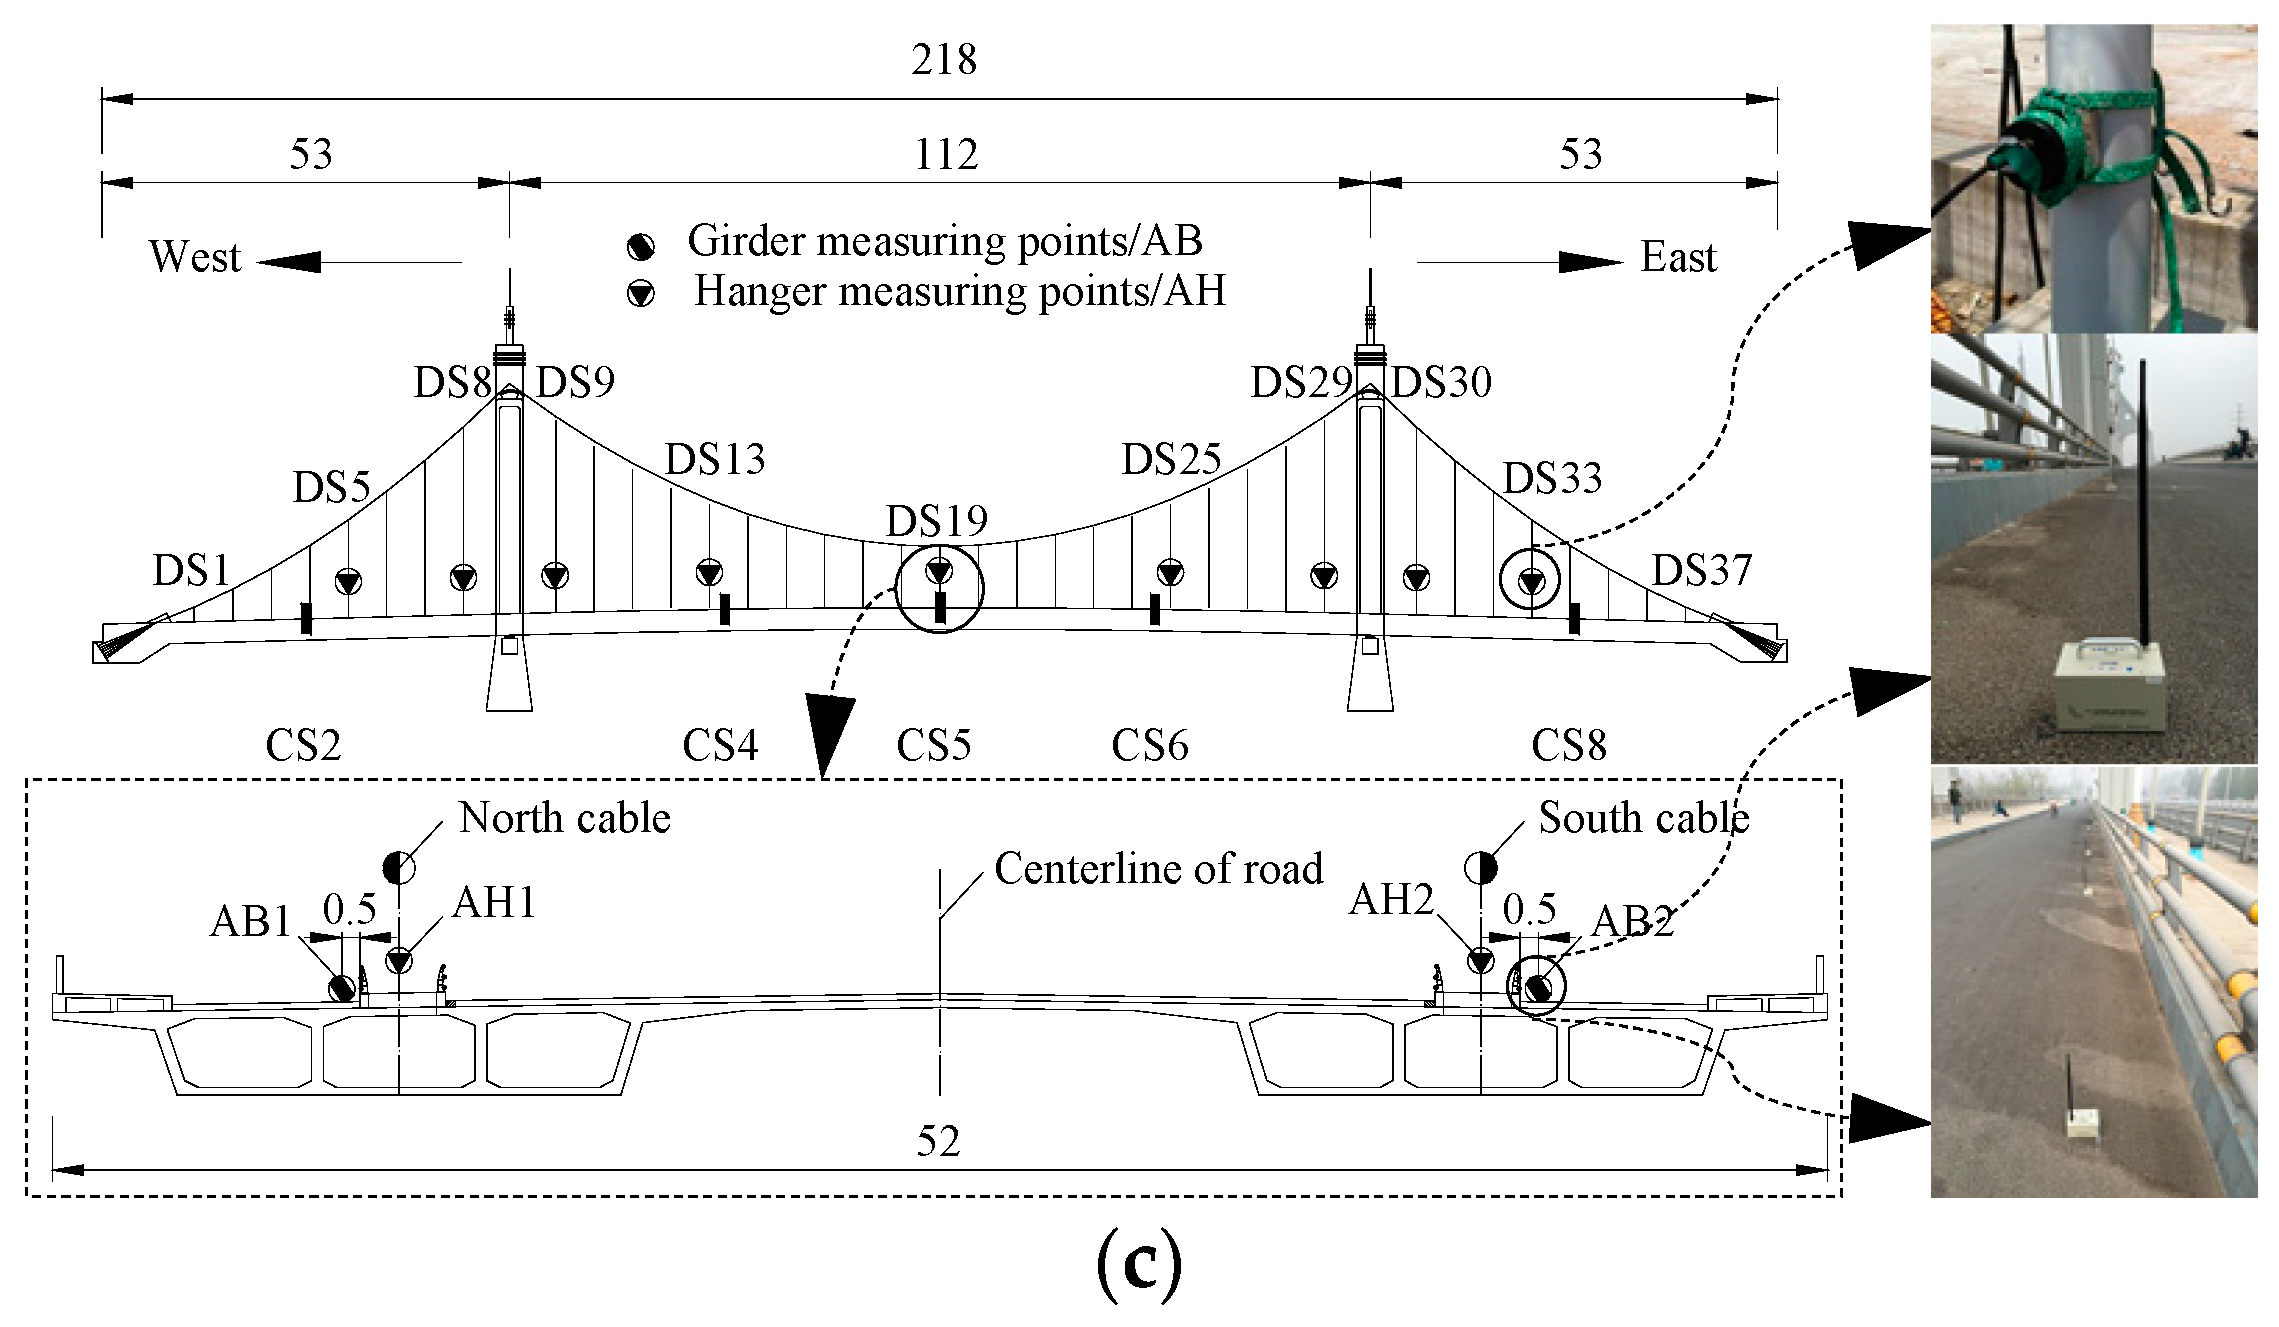
3. Health Monitoring System
4. Simulation and Prediction Methods
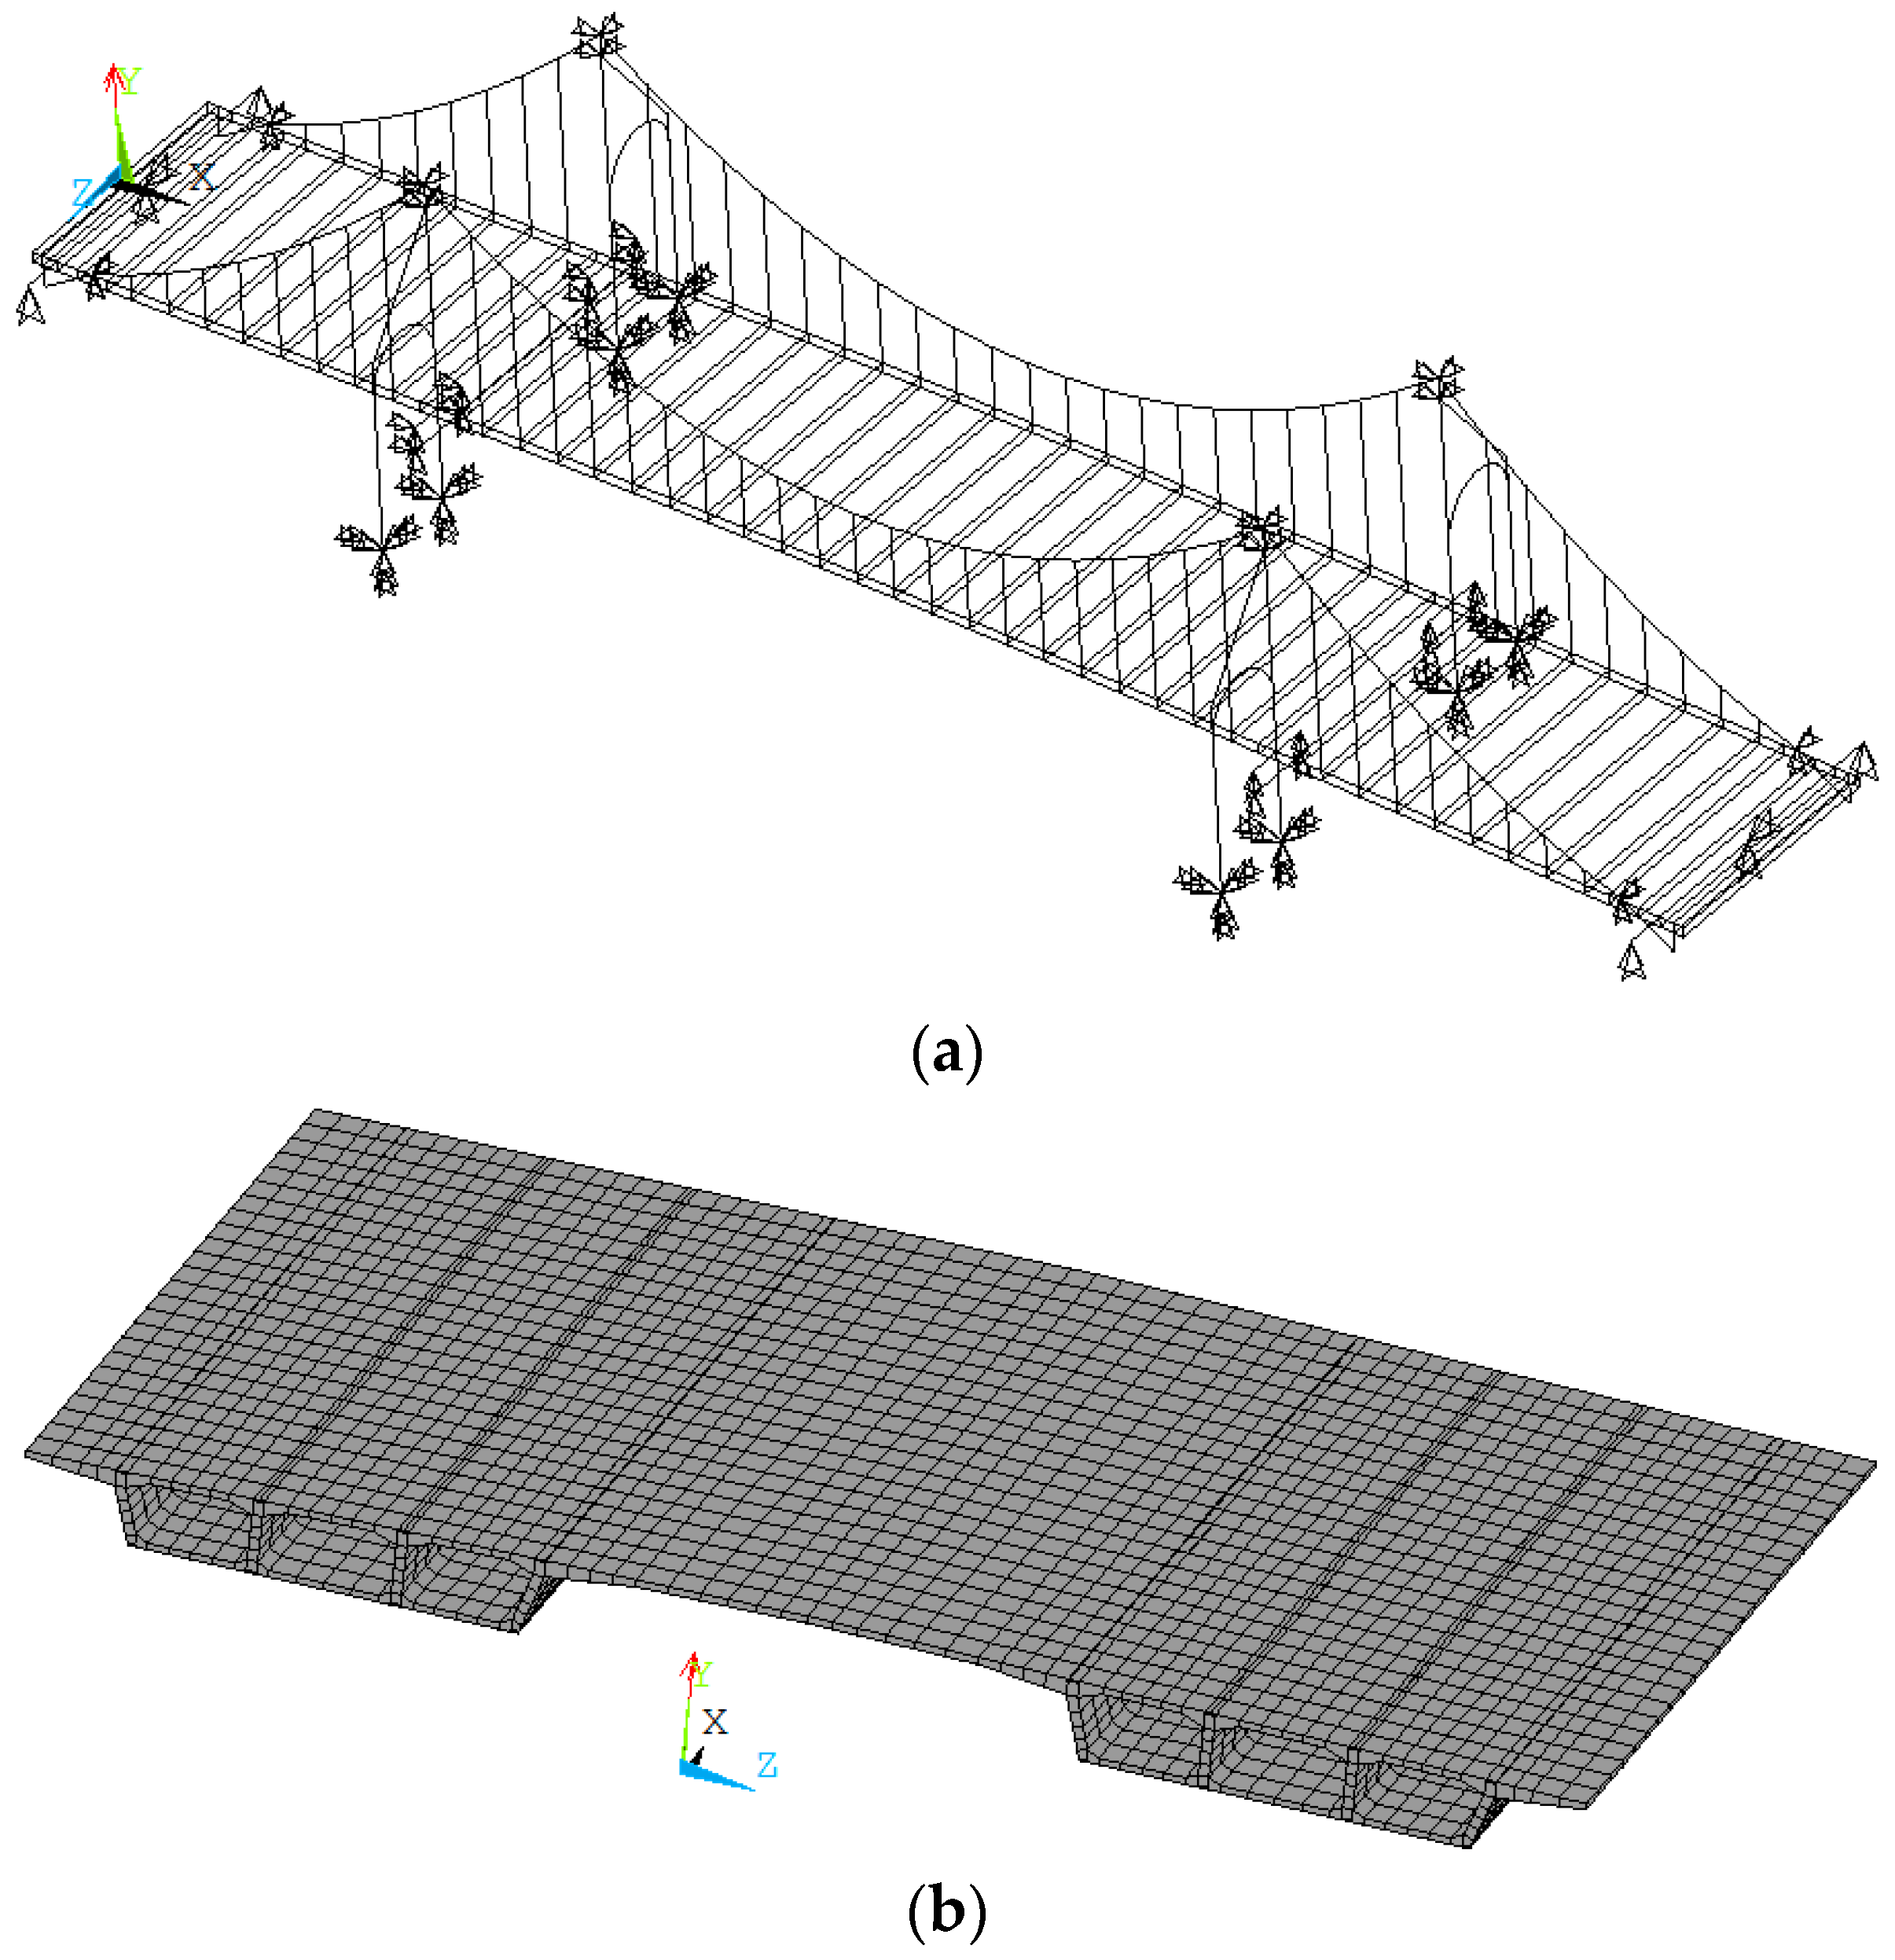
4.1. Finite Element Model
4.2. Prediction Methods of Concrete Shrinkage and Creep Effects
5. Results of Health Monitoring
5.1. Global Deformation
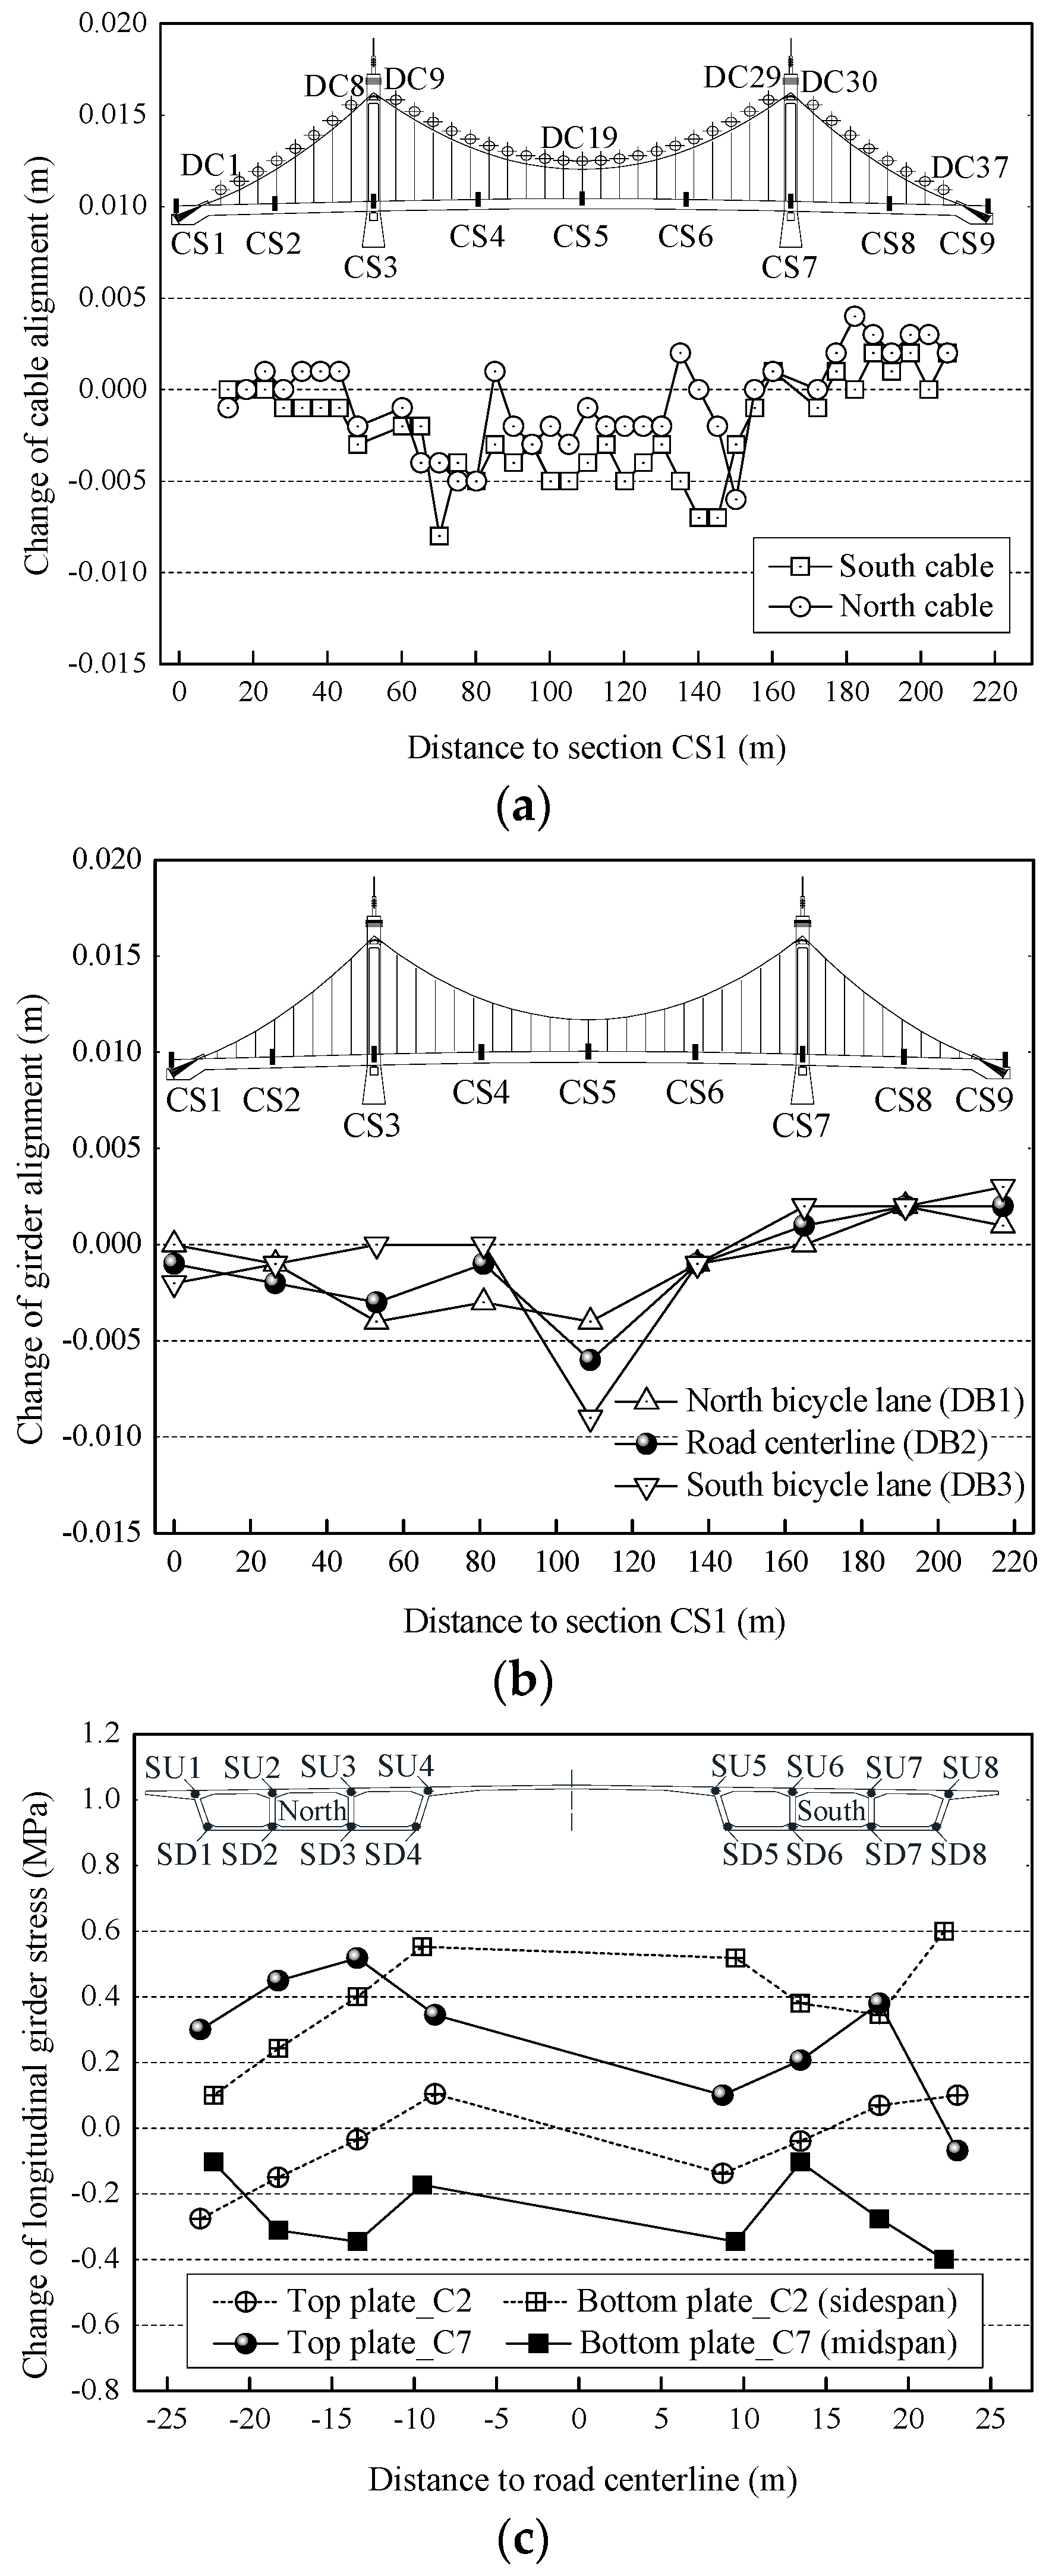
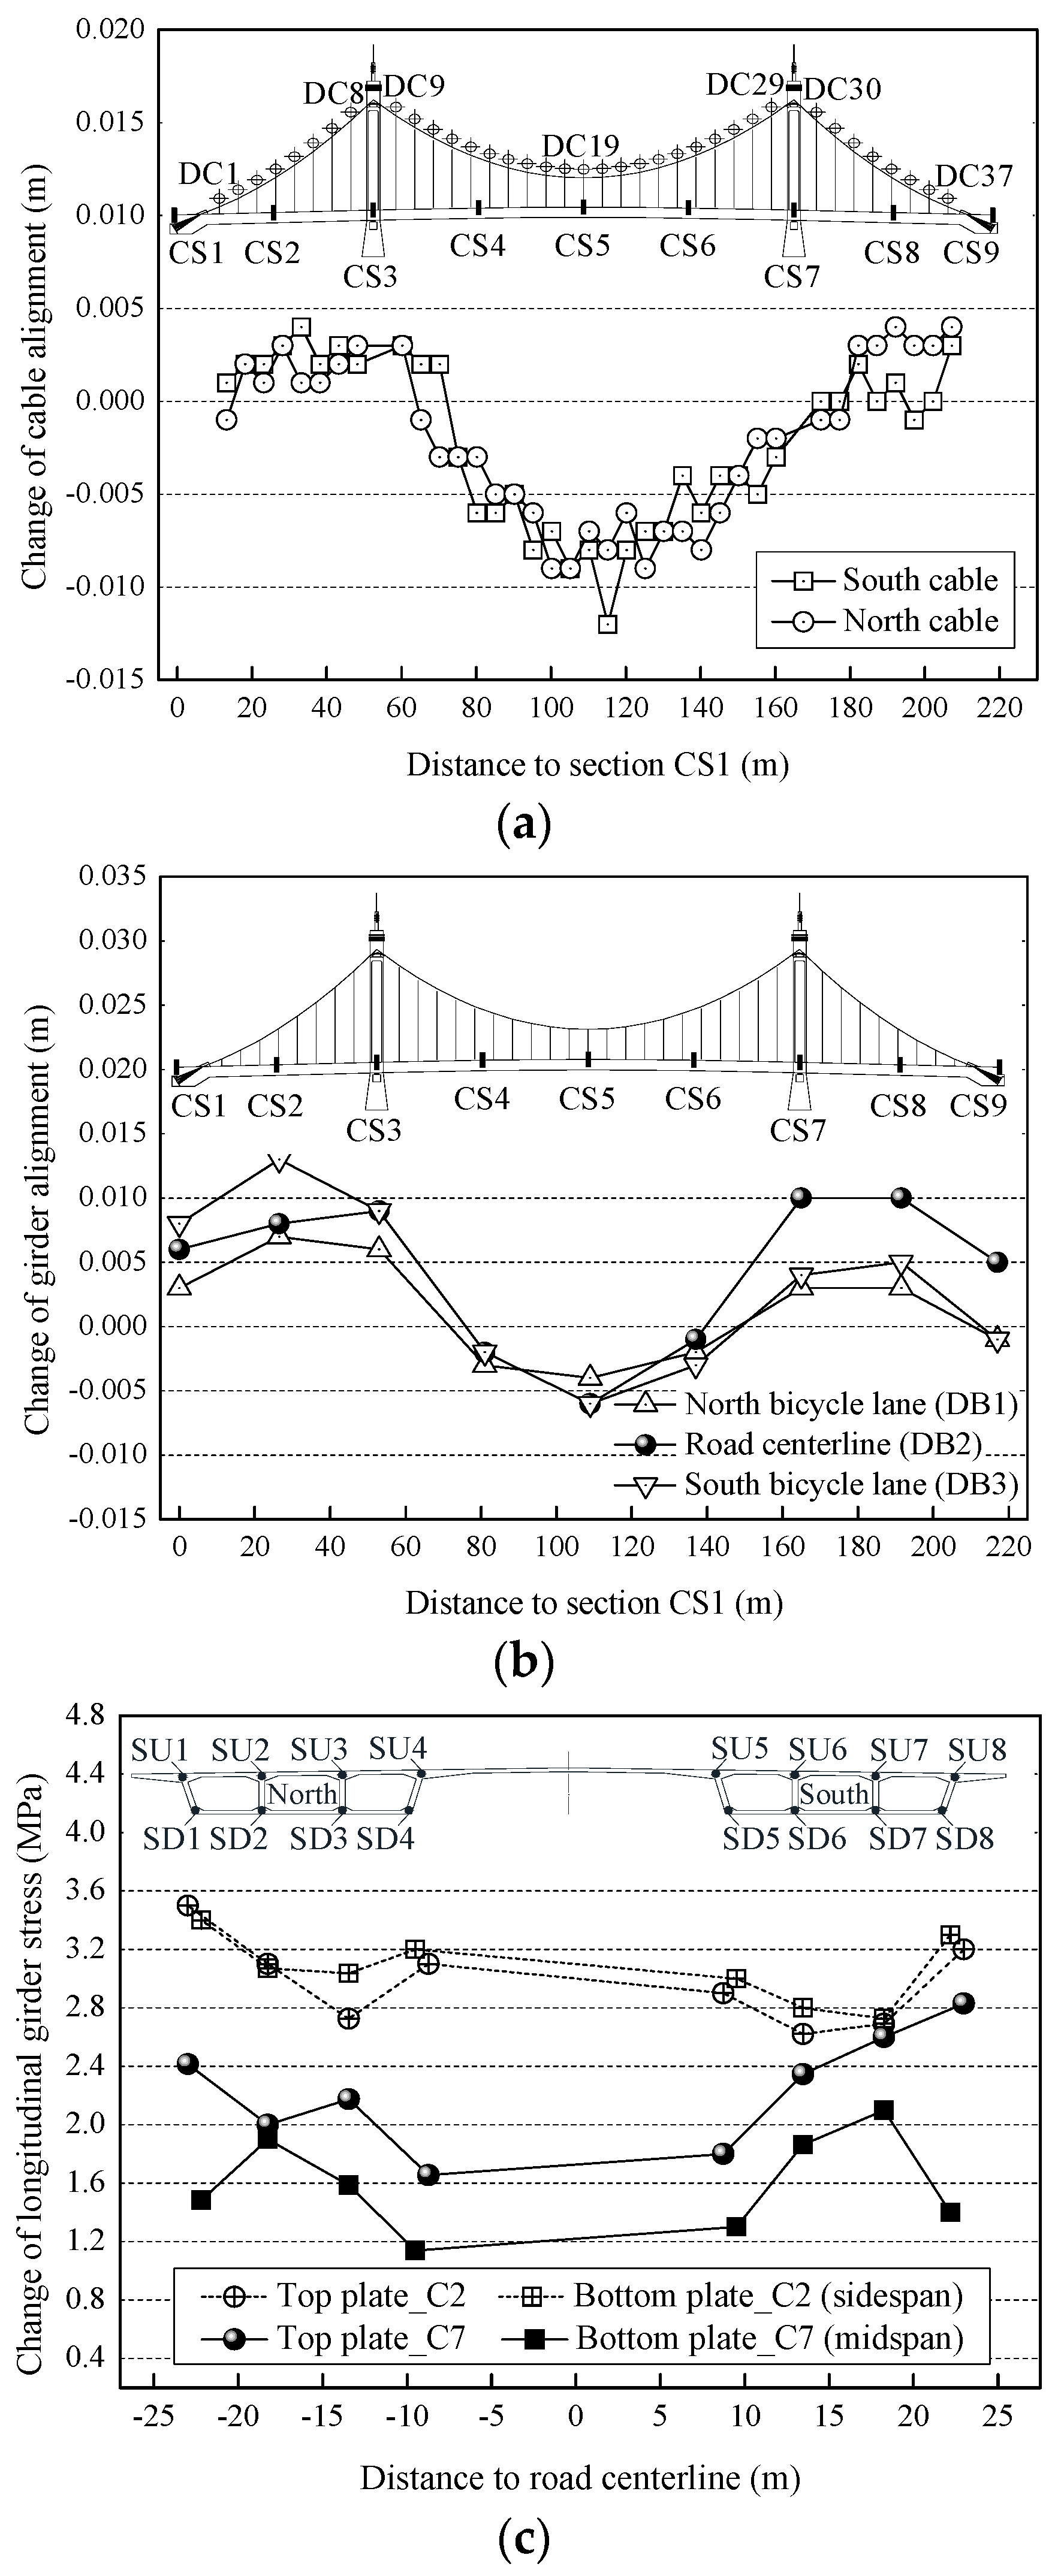
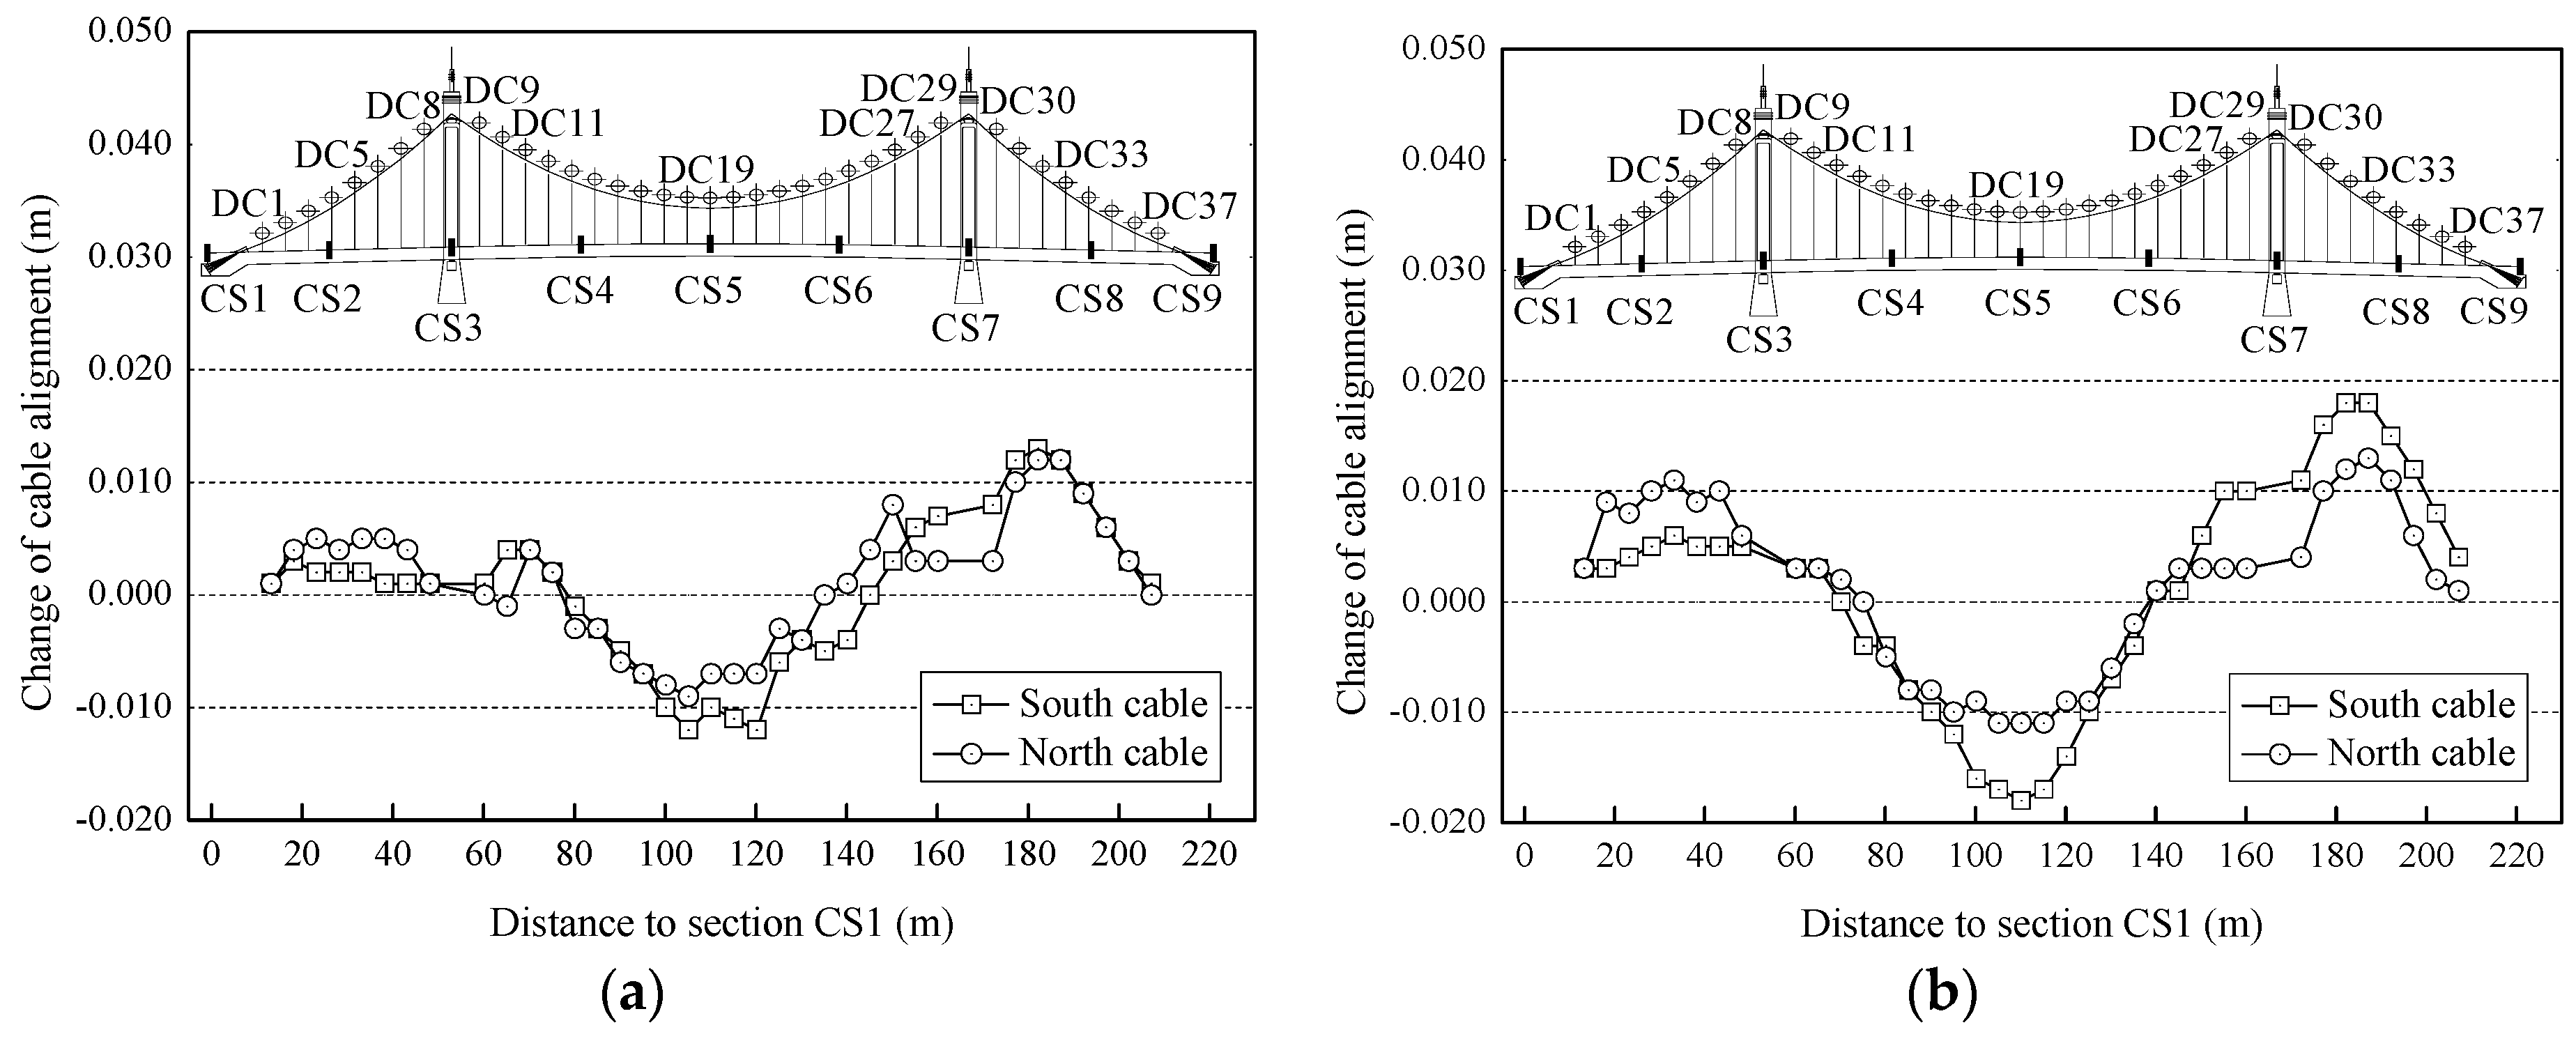
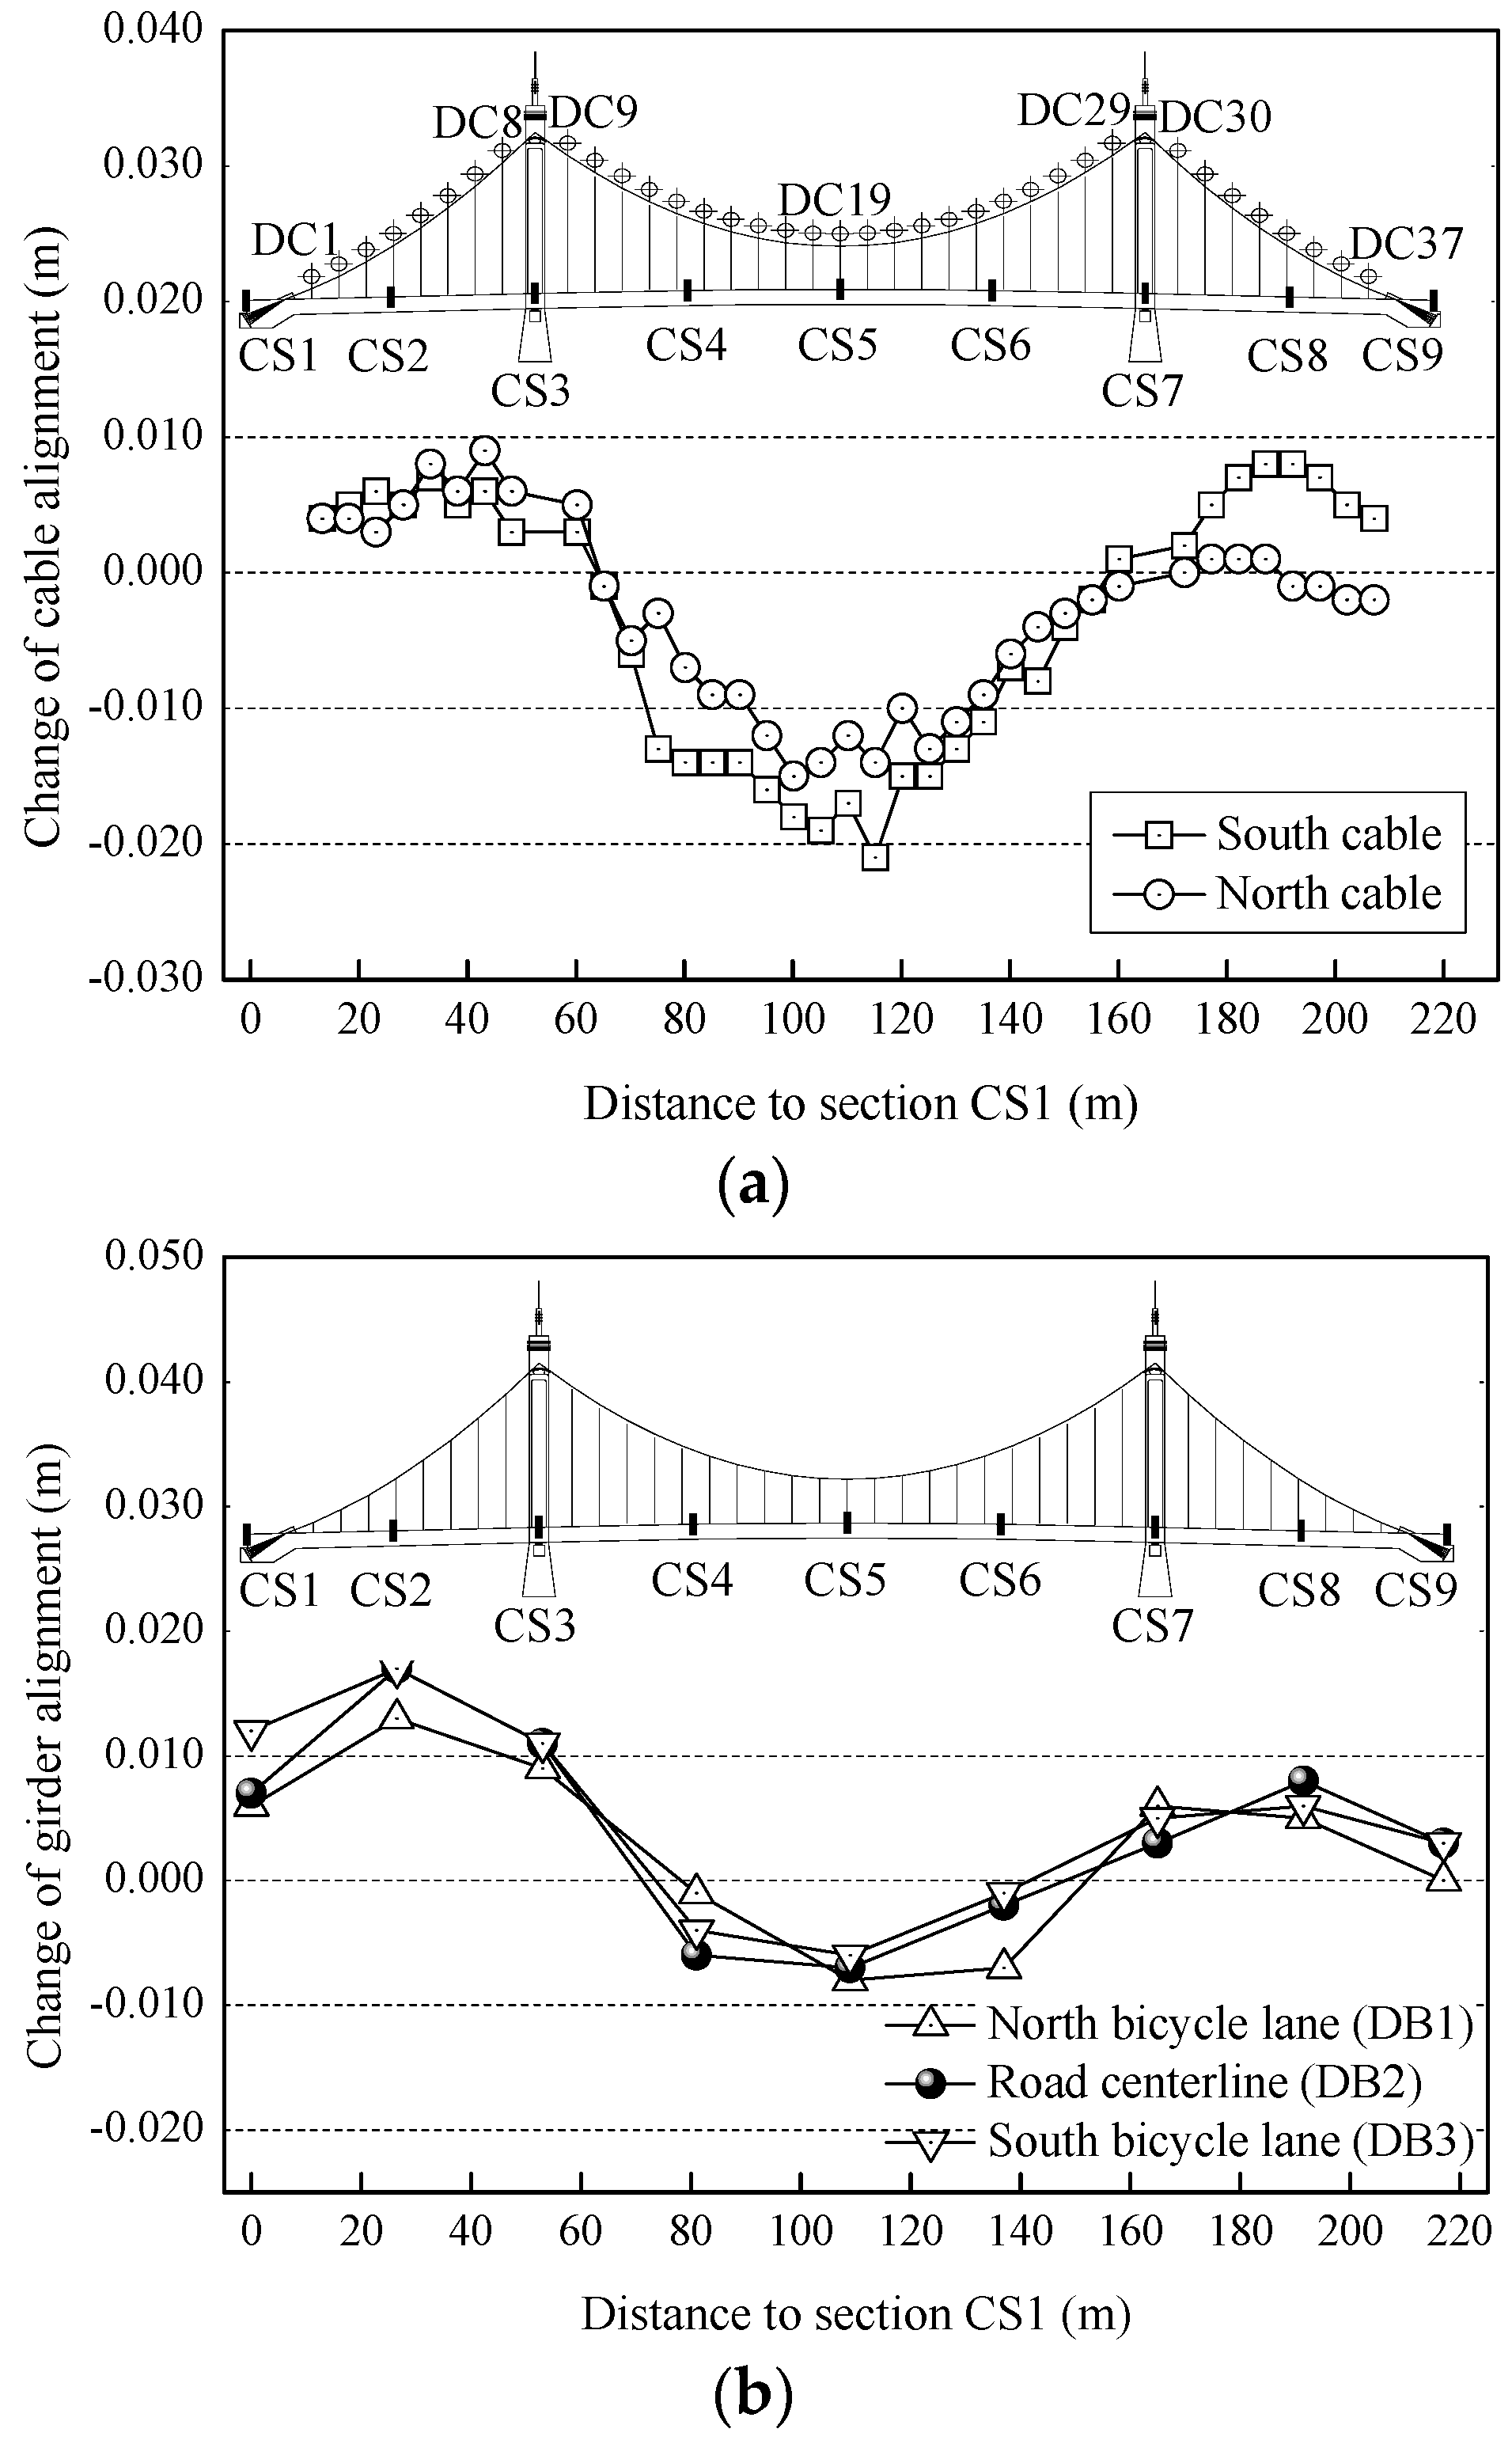
5.1.1. Cable Alignments
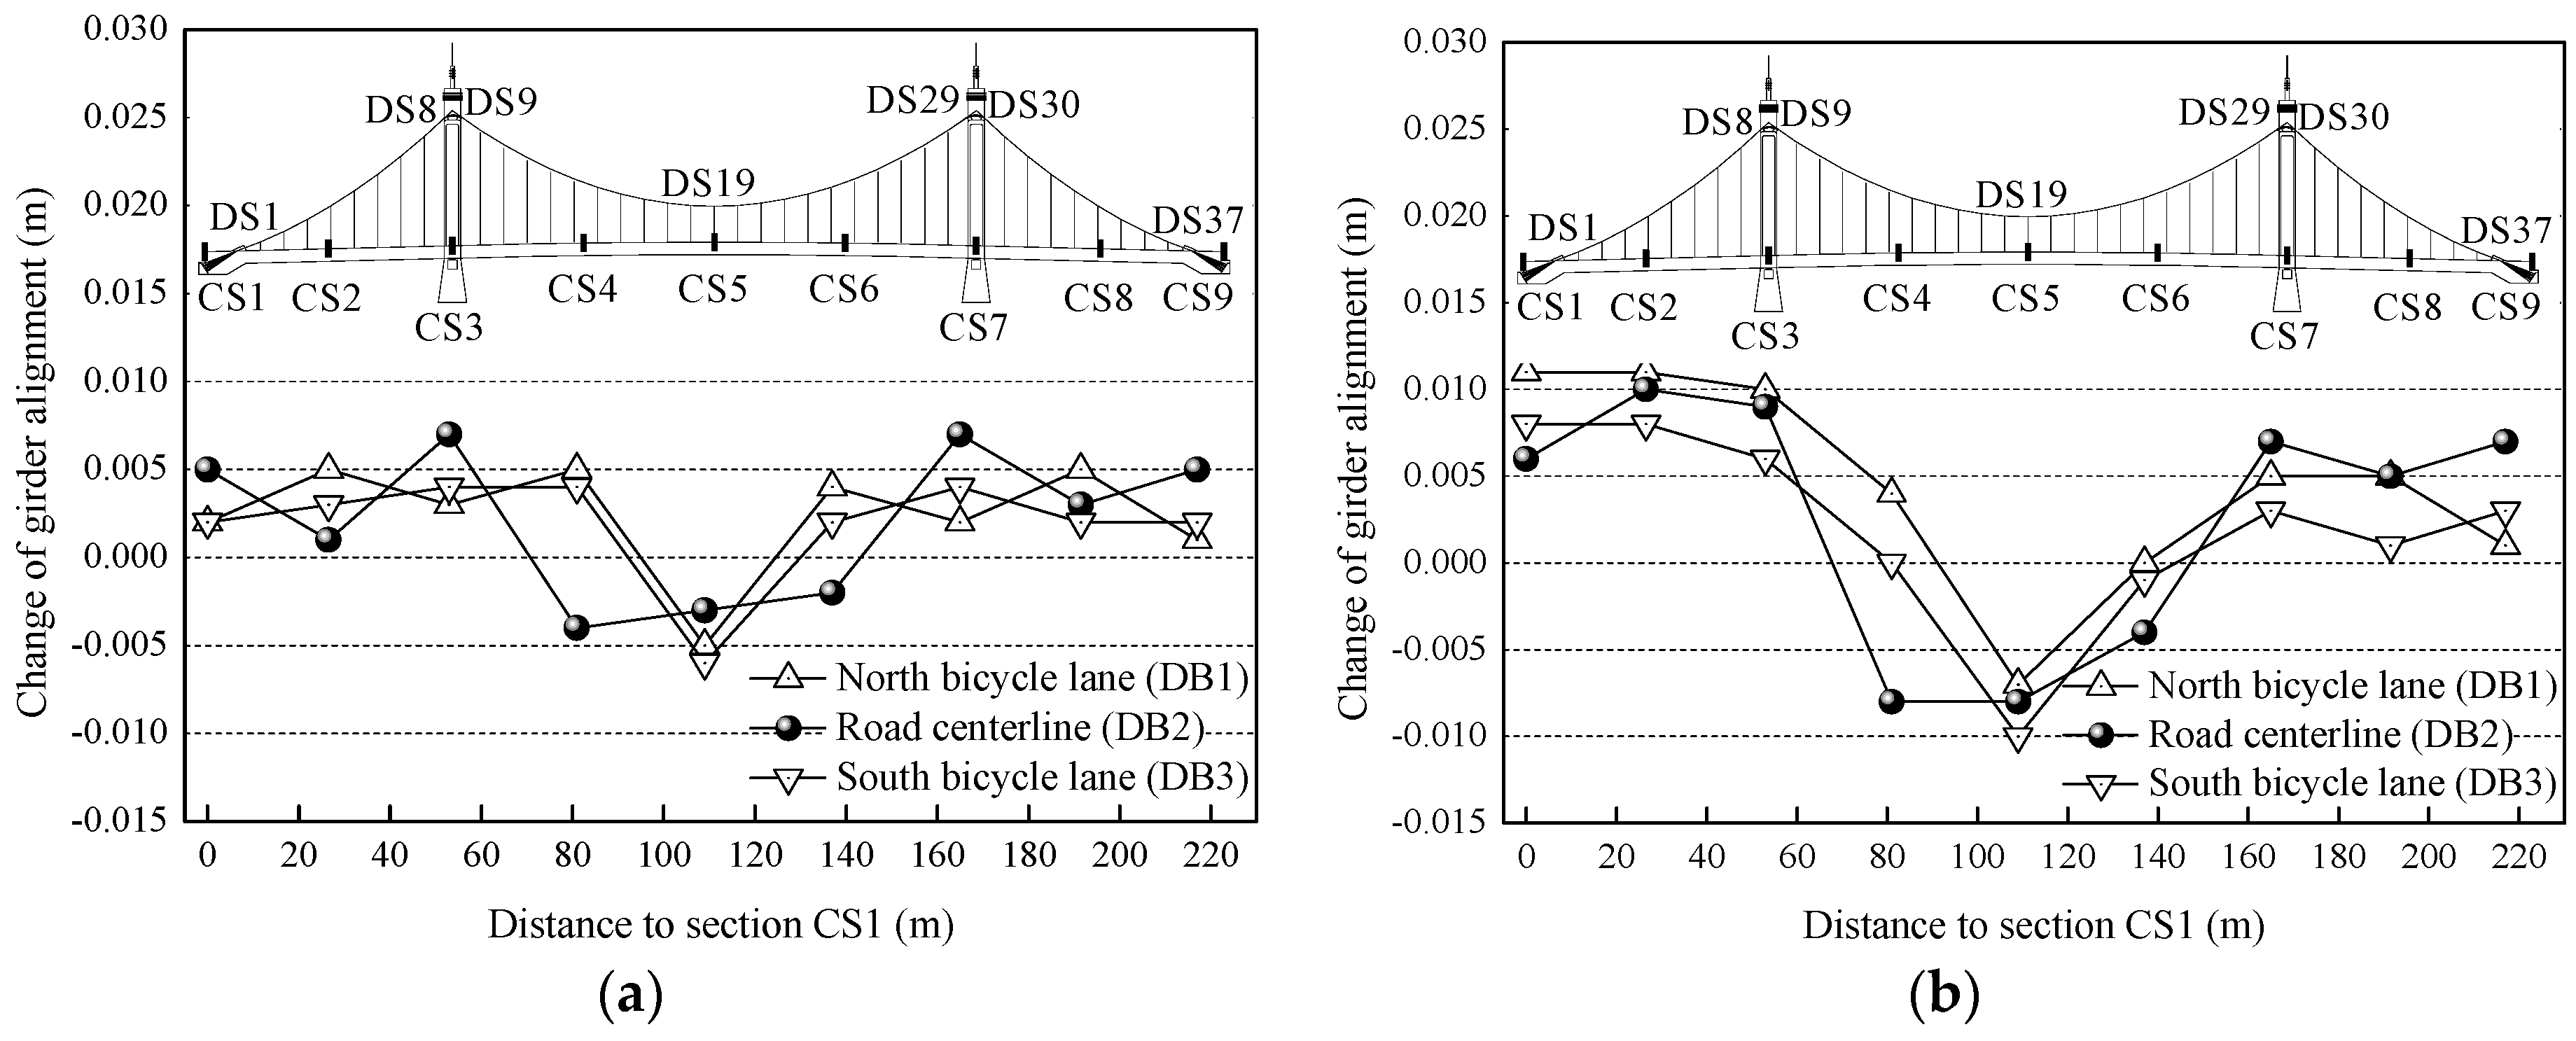
5.1.2. Girder Alignments
5.1.3. Tower Top Deformations
5.2. Vibration Monitoring Results
5.3. Internal Force Monitoring Results
5.3.1. Cable Forces
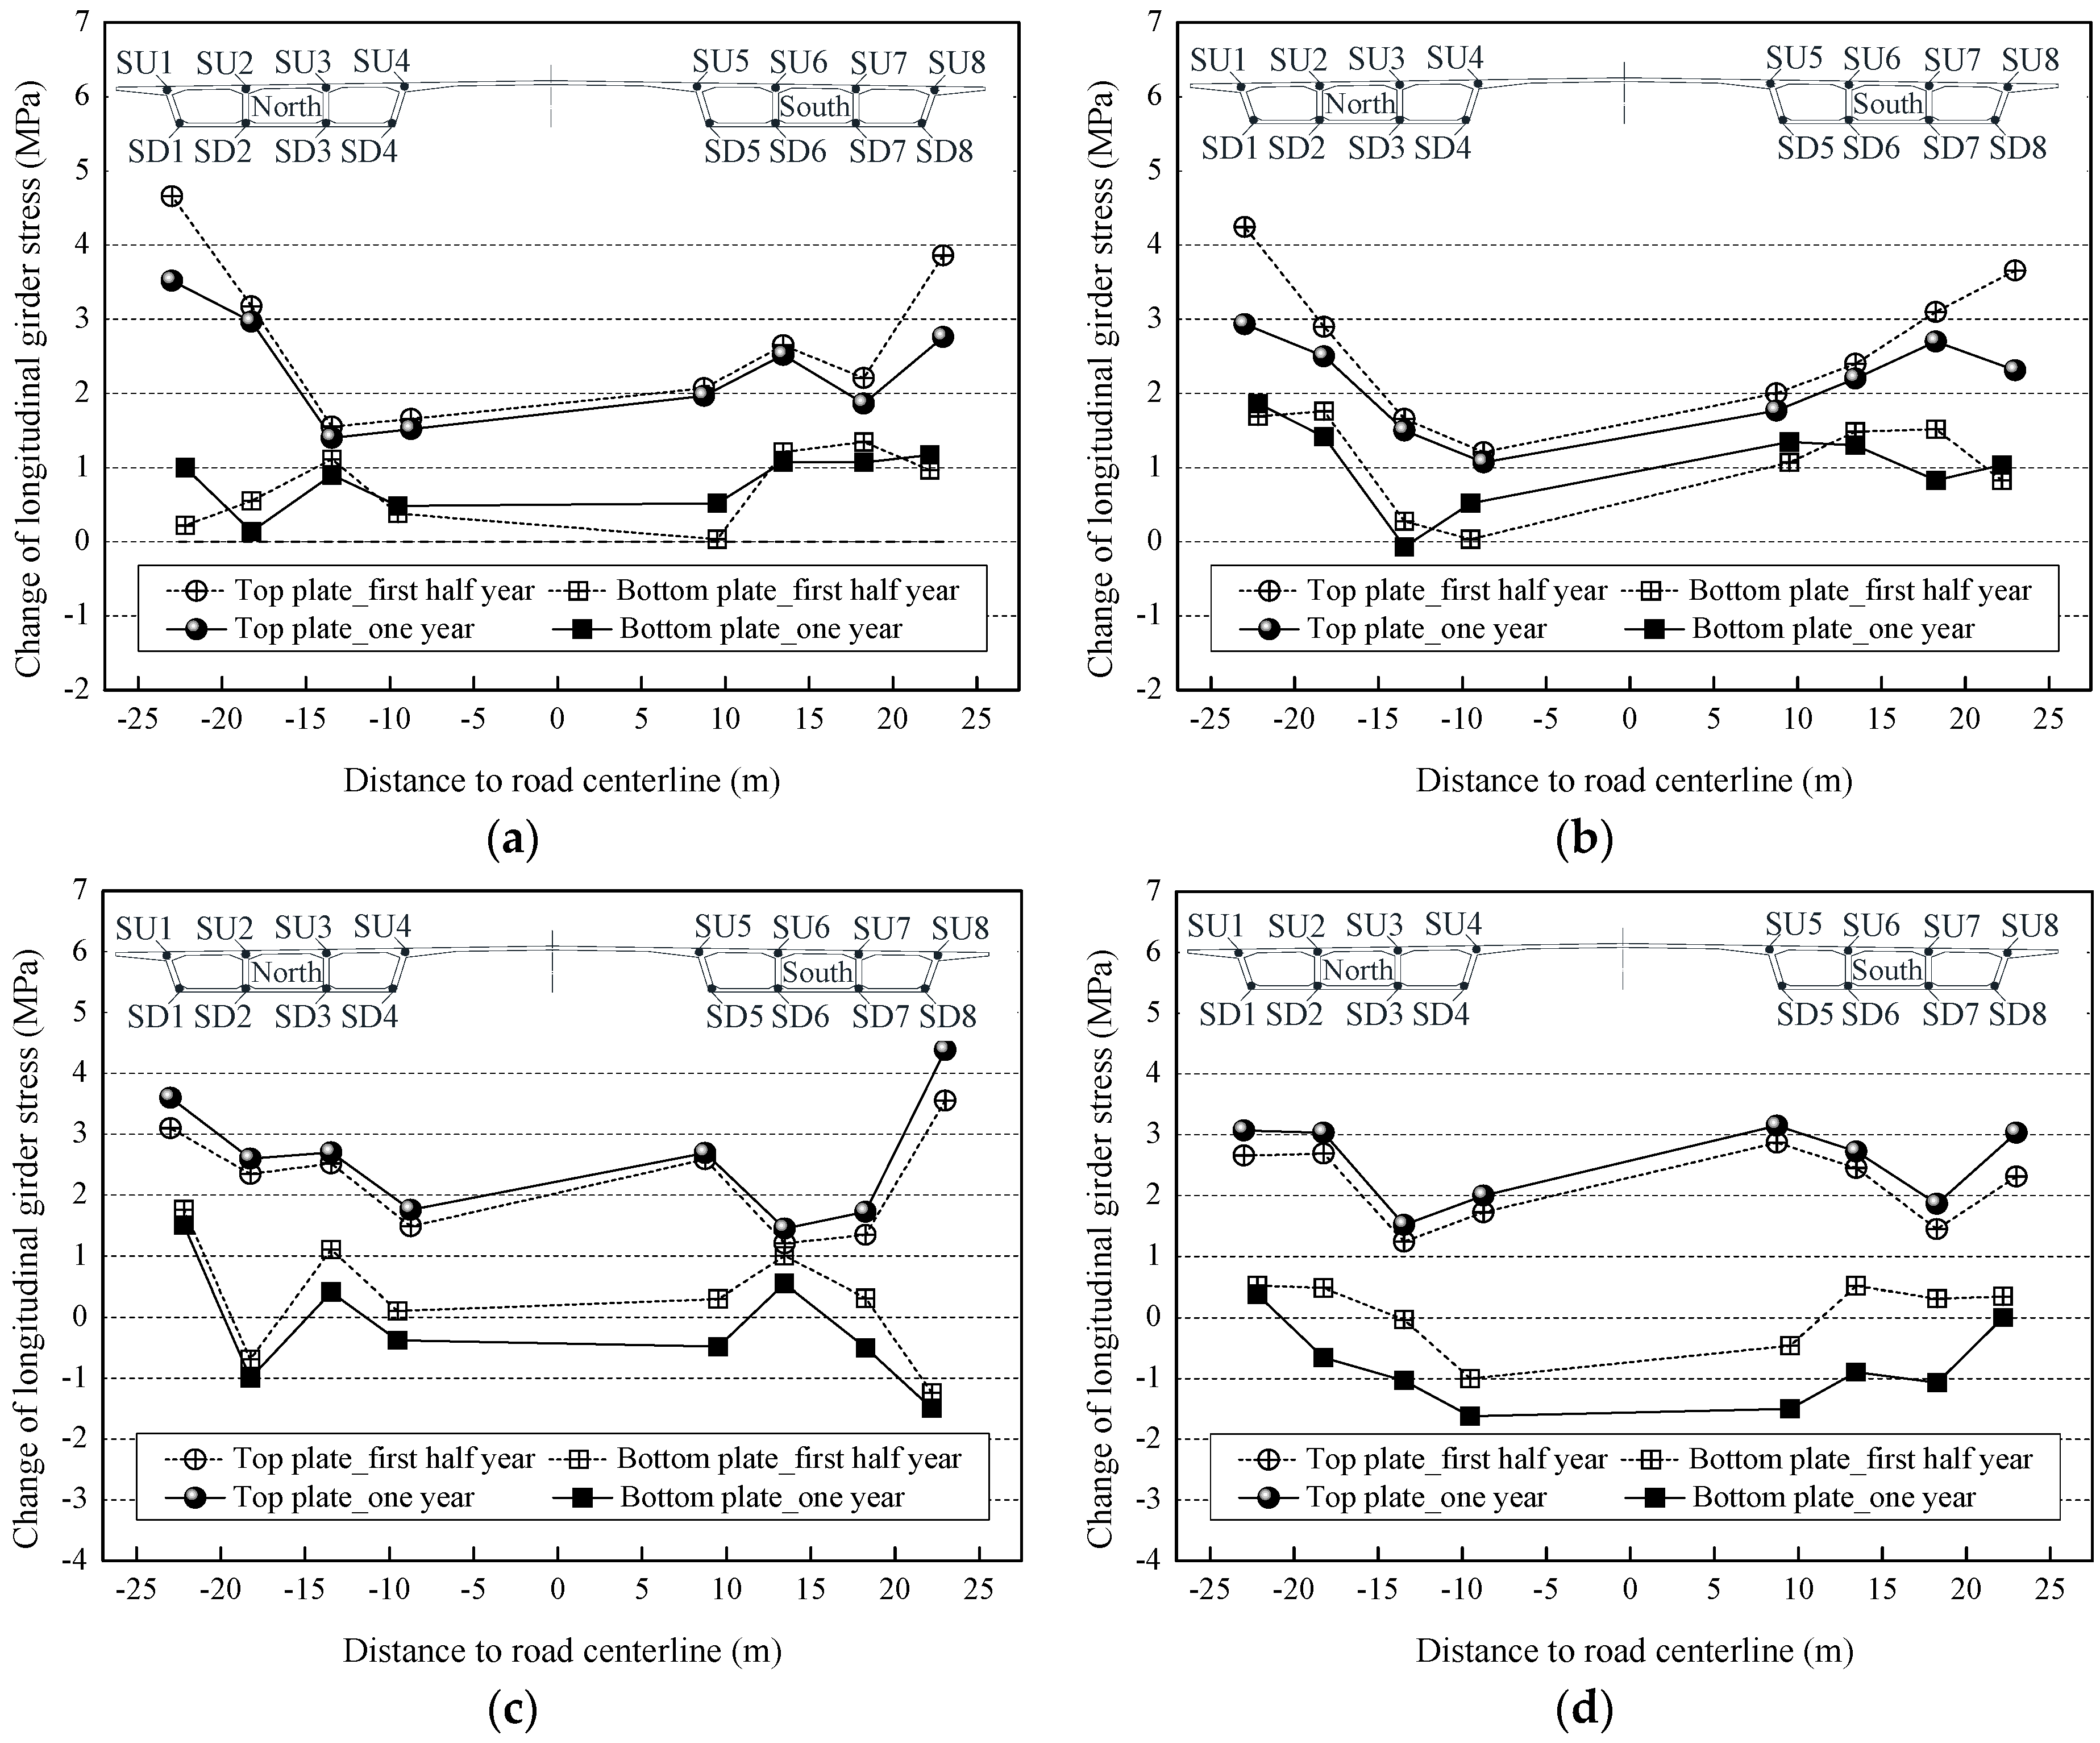
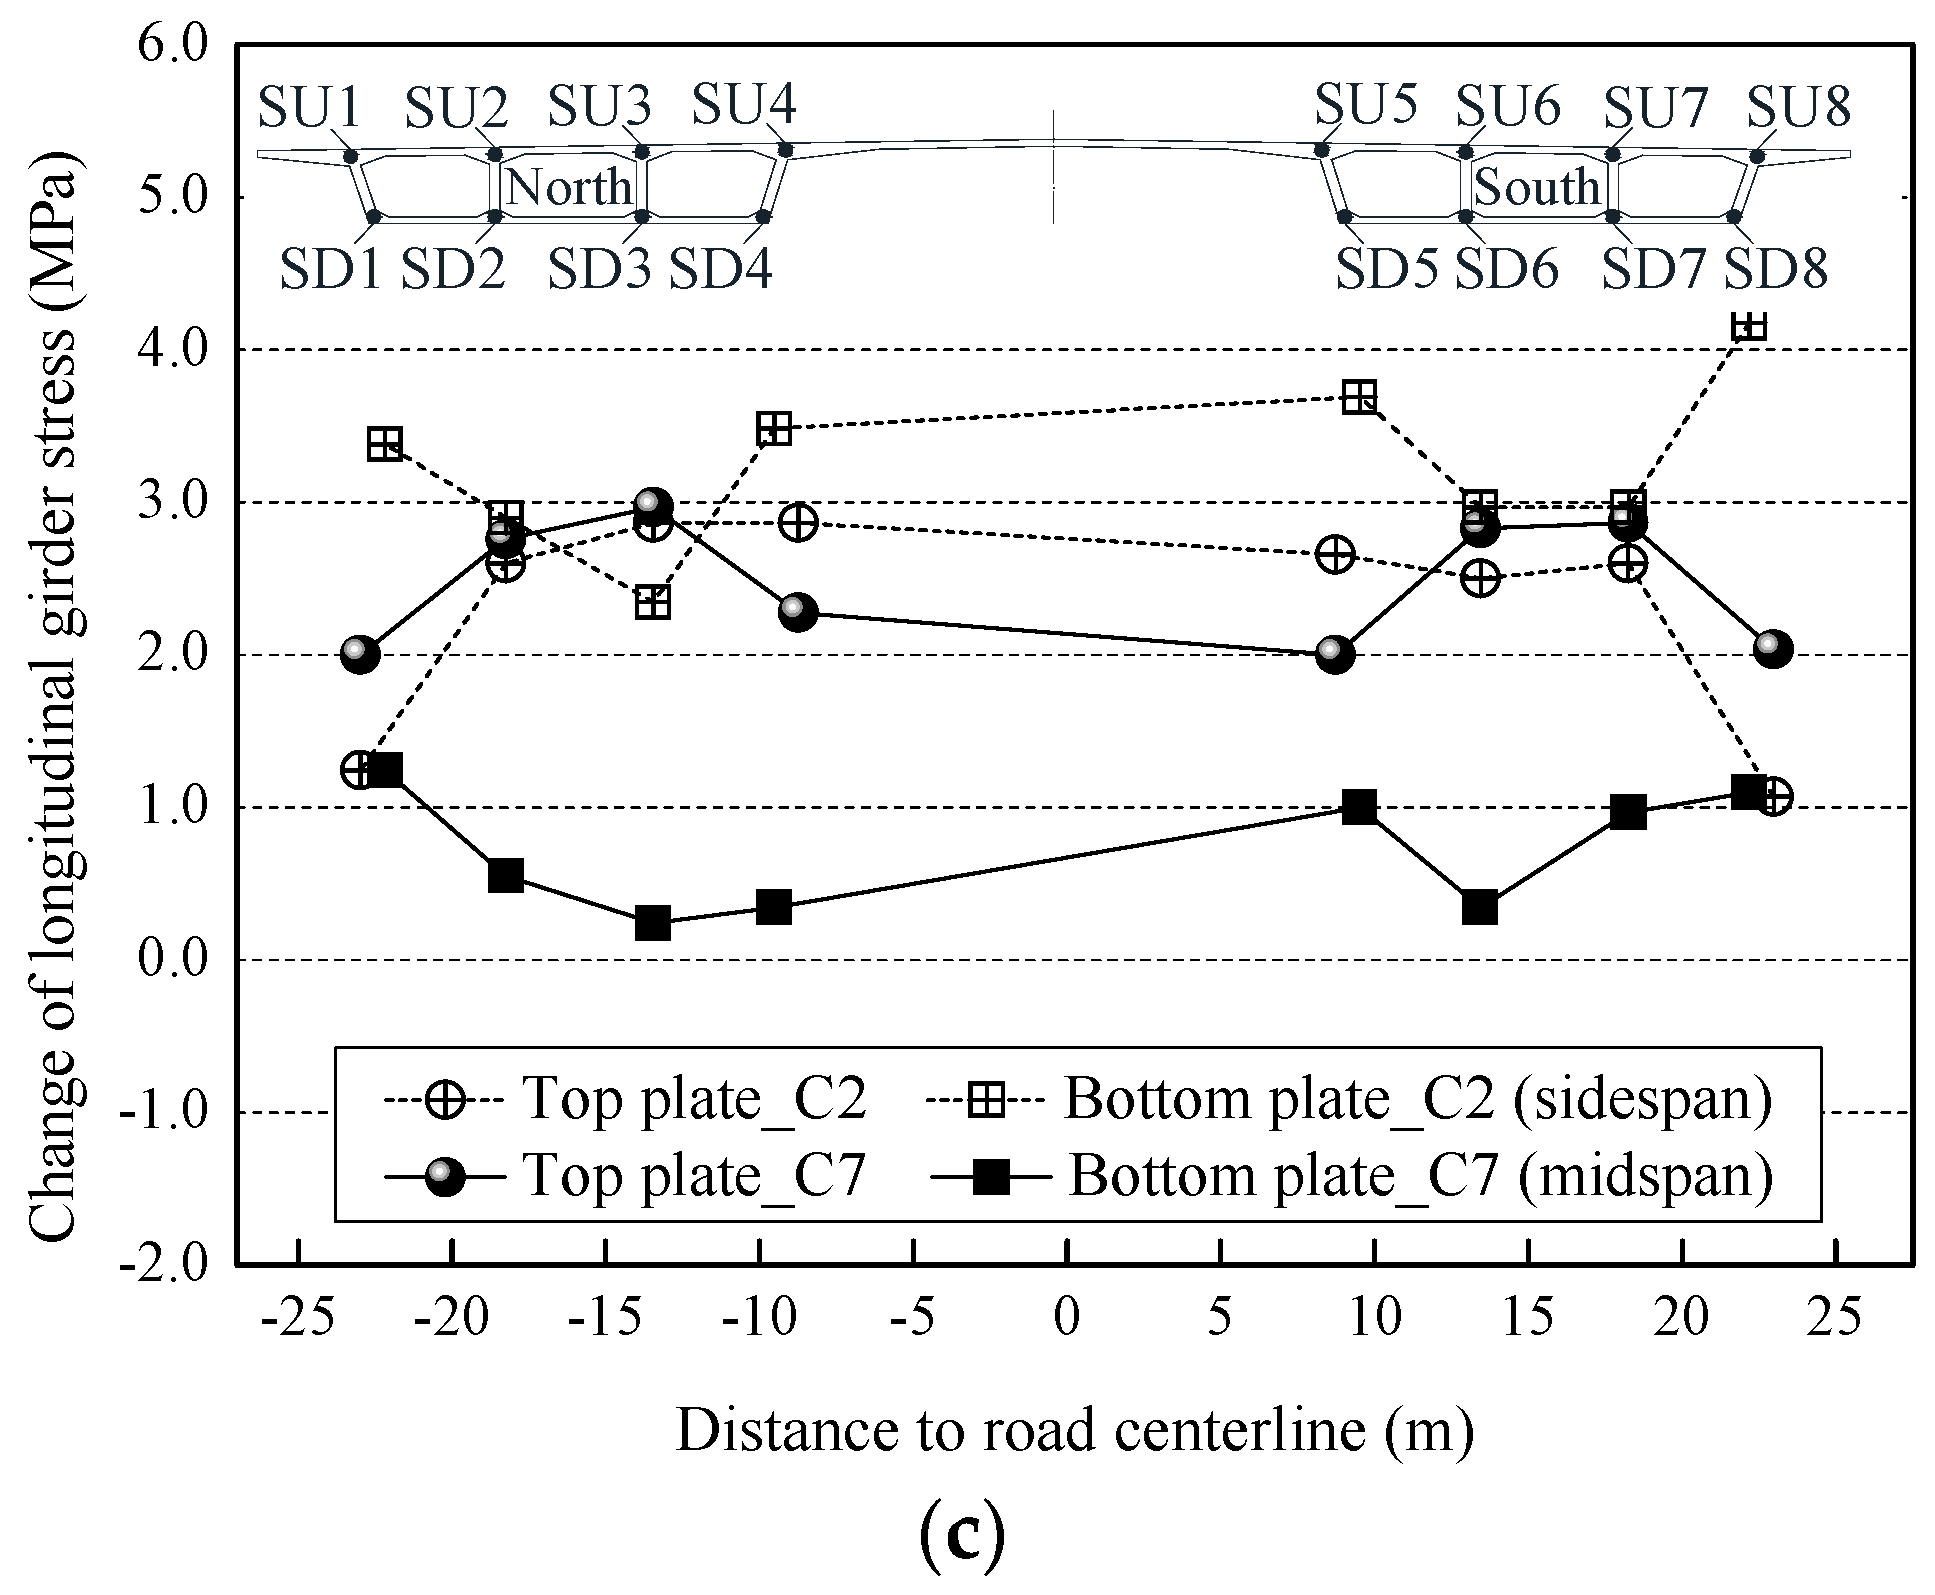
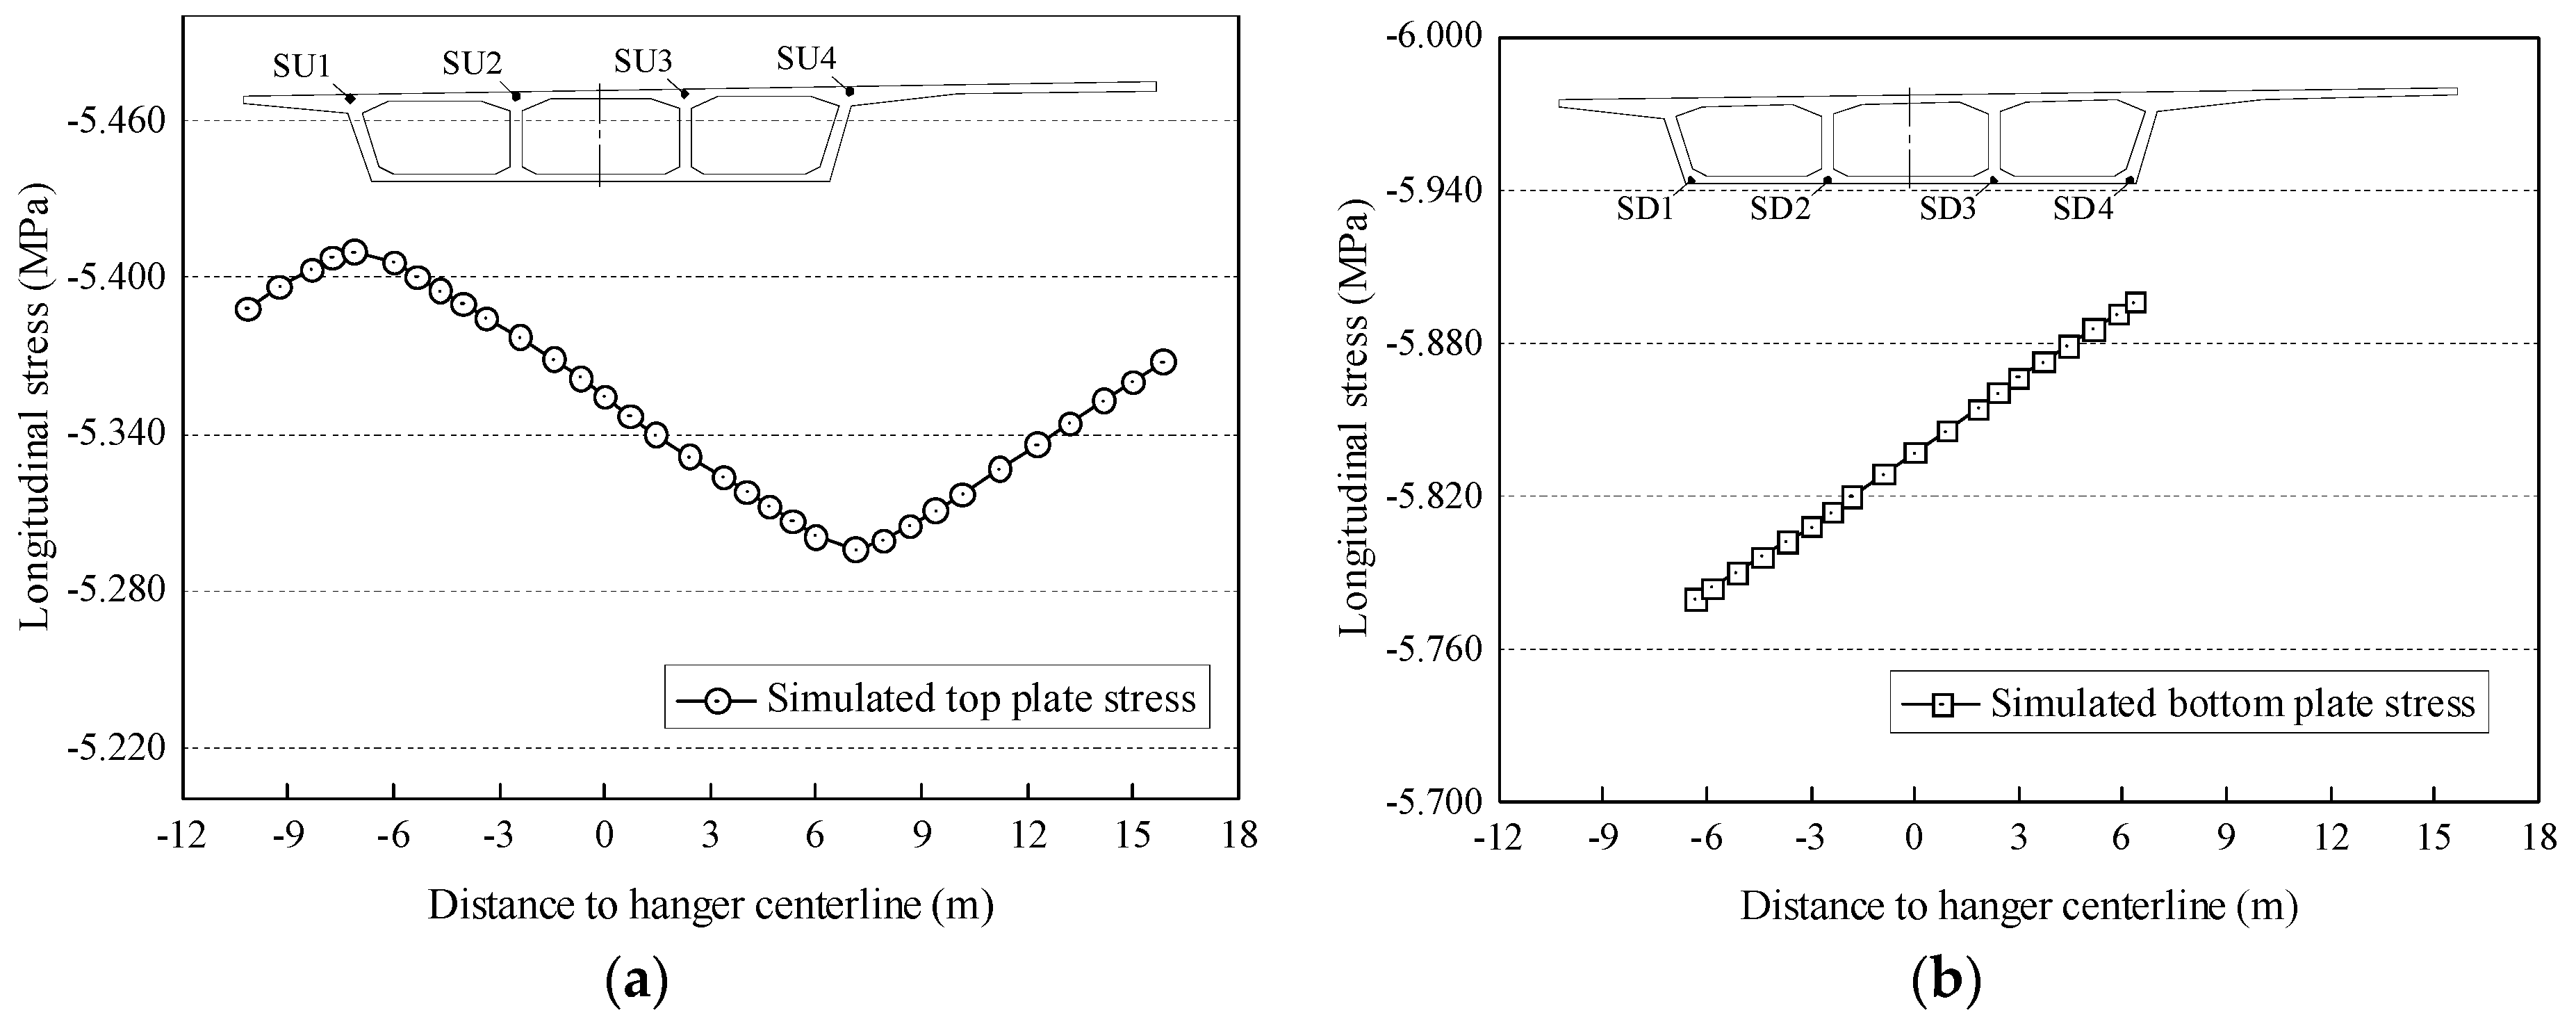
5.3.2. Transverse Distributions of Girder Stress Increments
5.3.3. Tower Root Stresses
5.4. Influences Brought by Diurnal Temperature Difference
5.5. Influences Brought by Seasonal Ambient Warming
5.6. Influences Brought by Dual Effects of Concrete S&C and Ambient Warming
6. Prediction of Concreter Shrinkage & Creep Effects
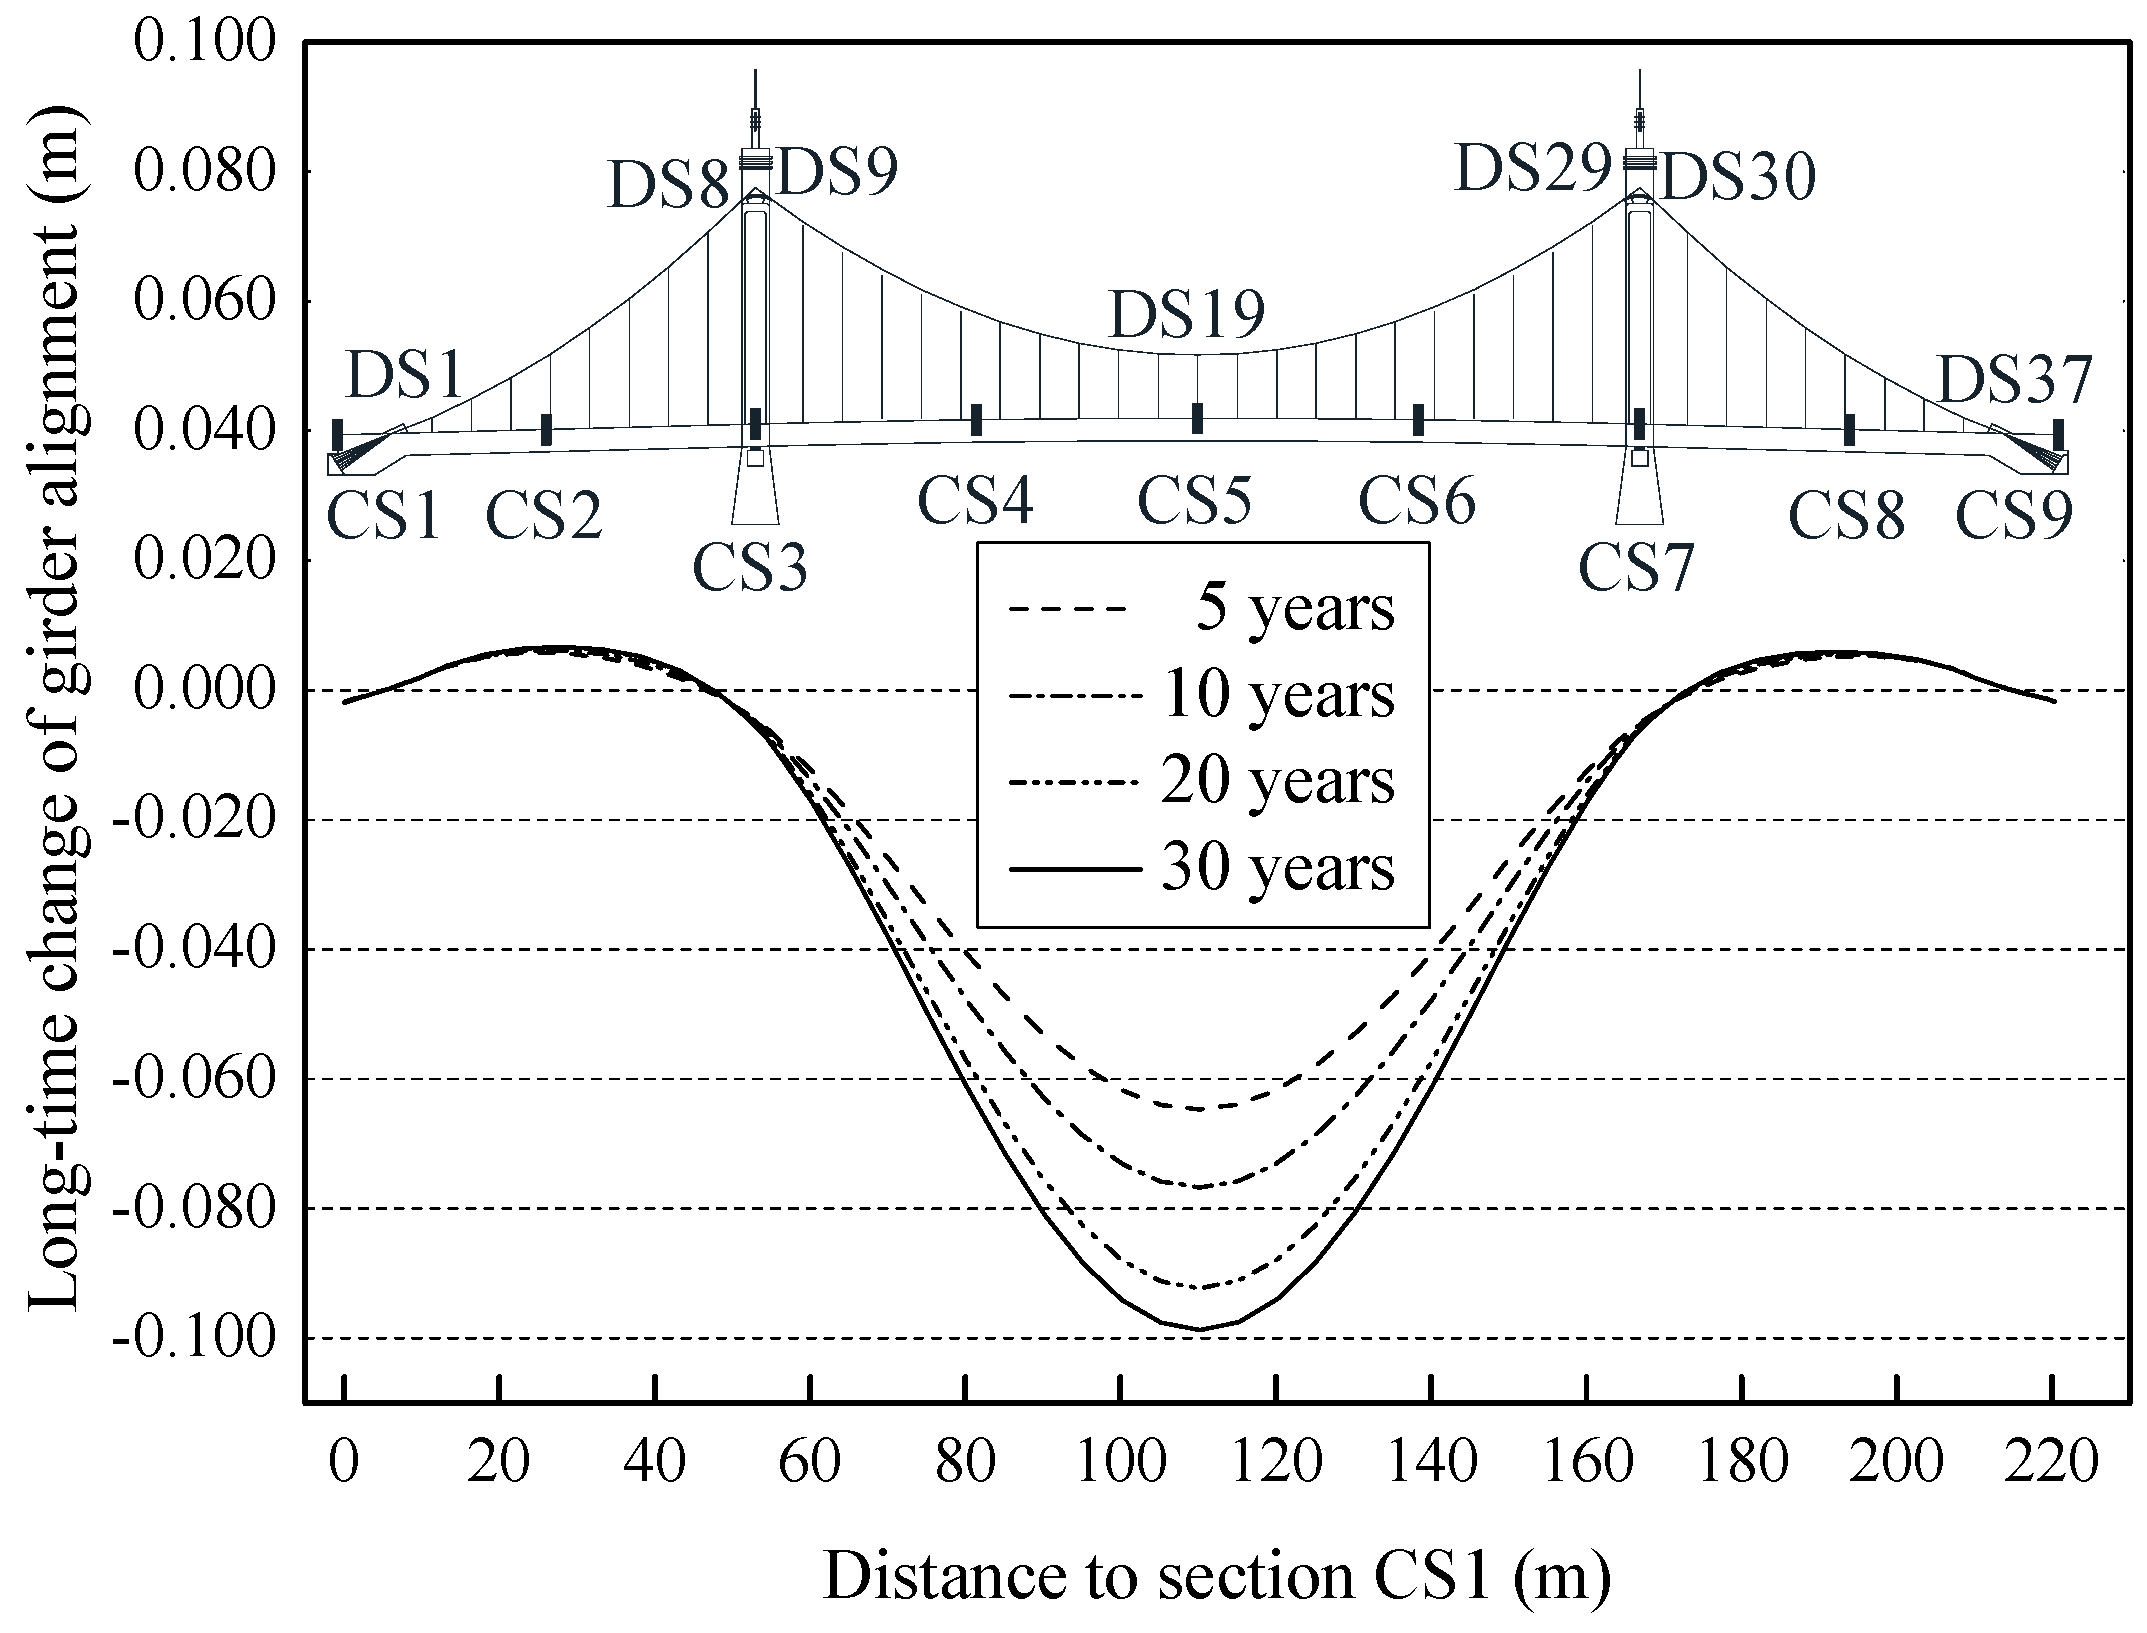
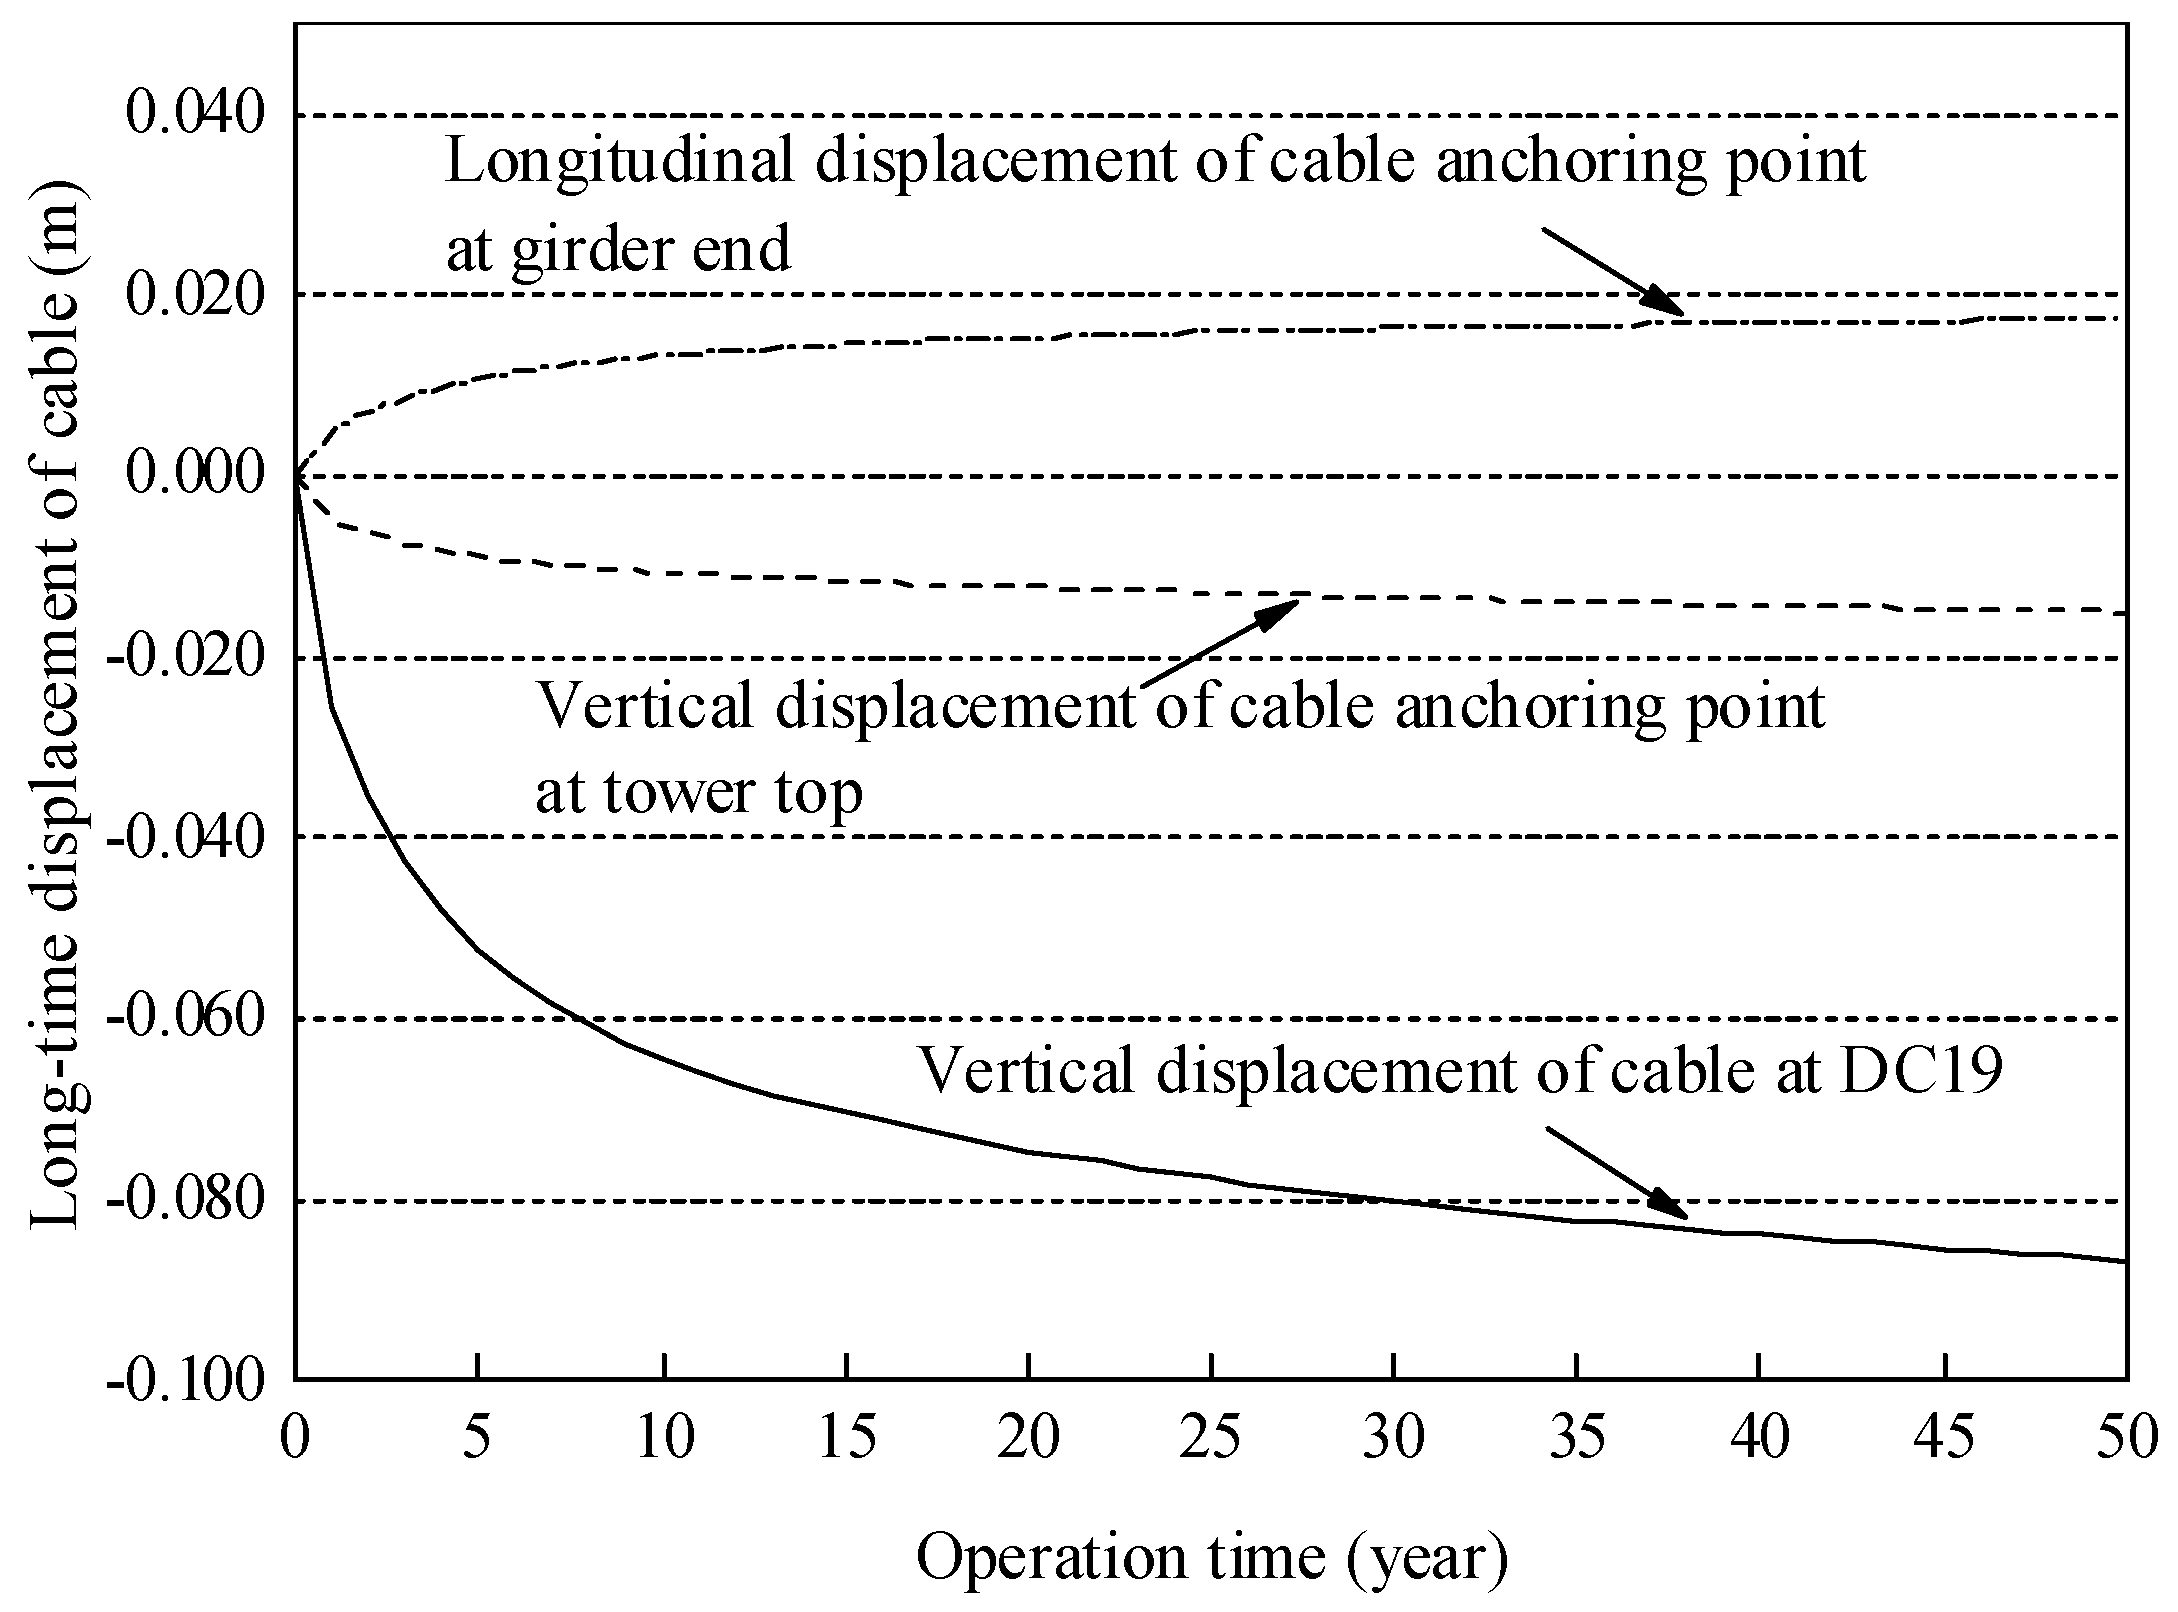
6.1. Global Deformation
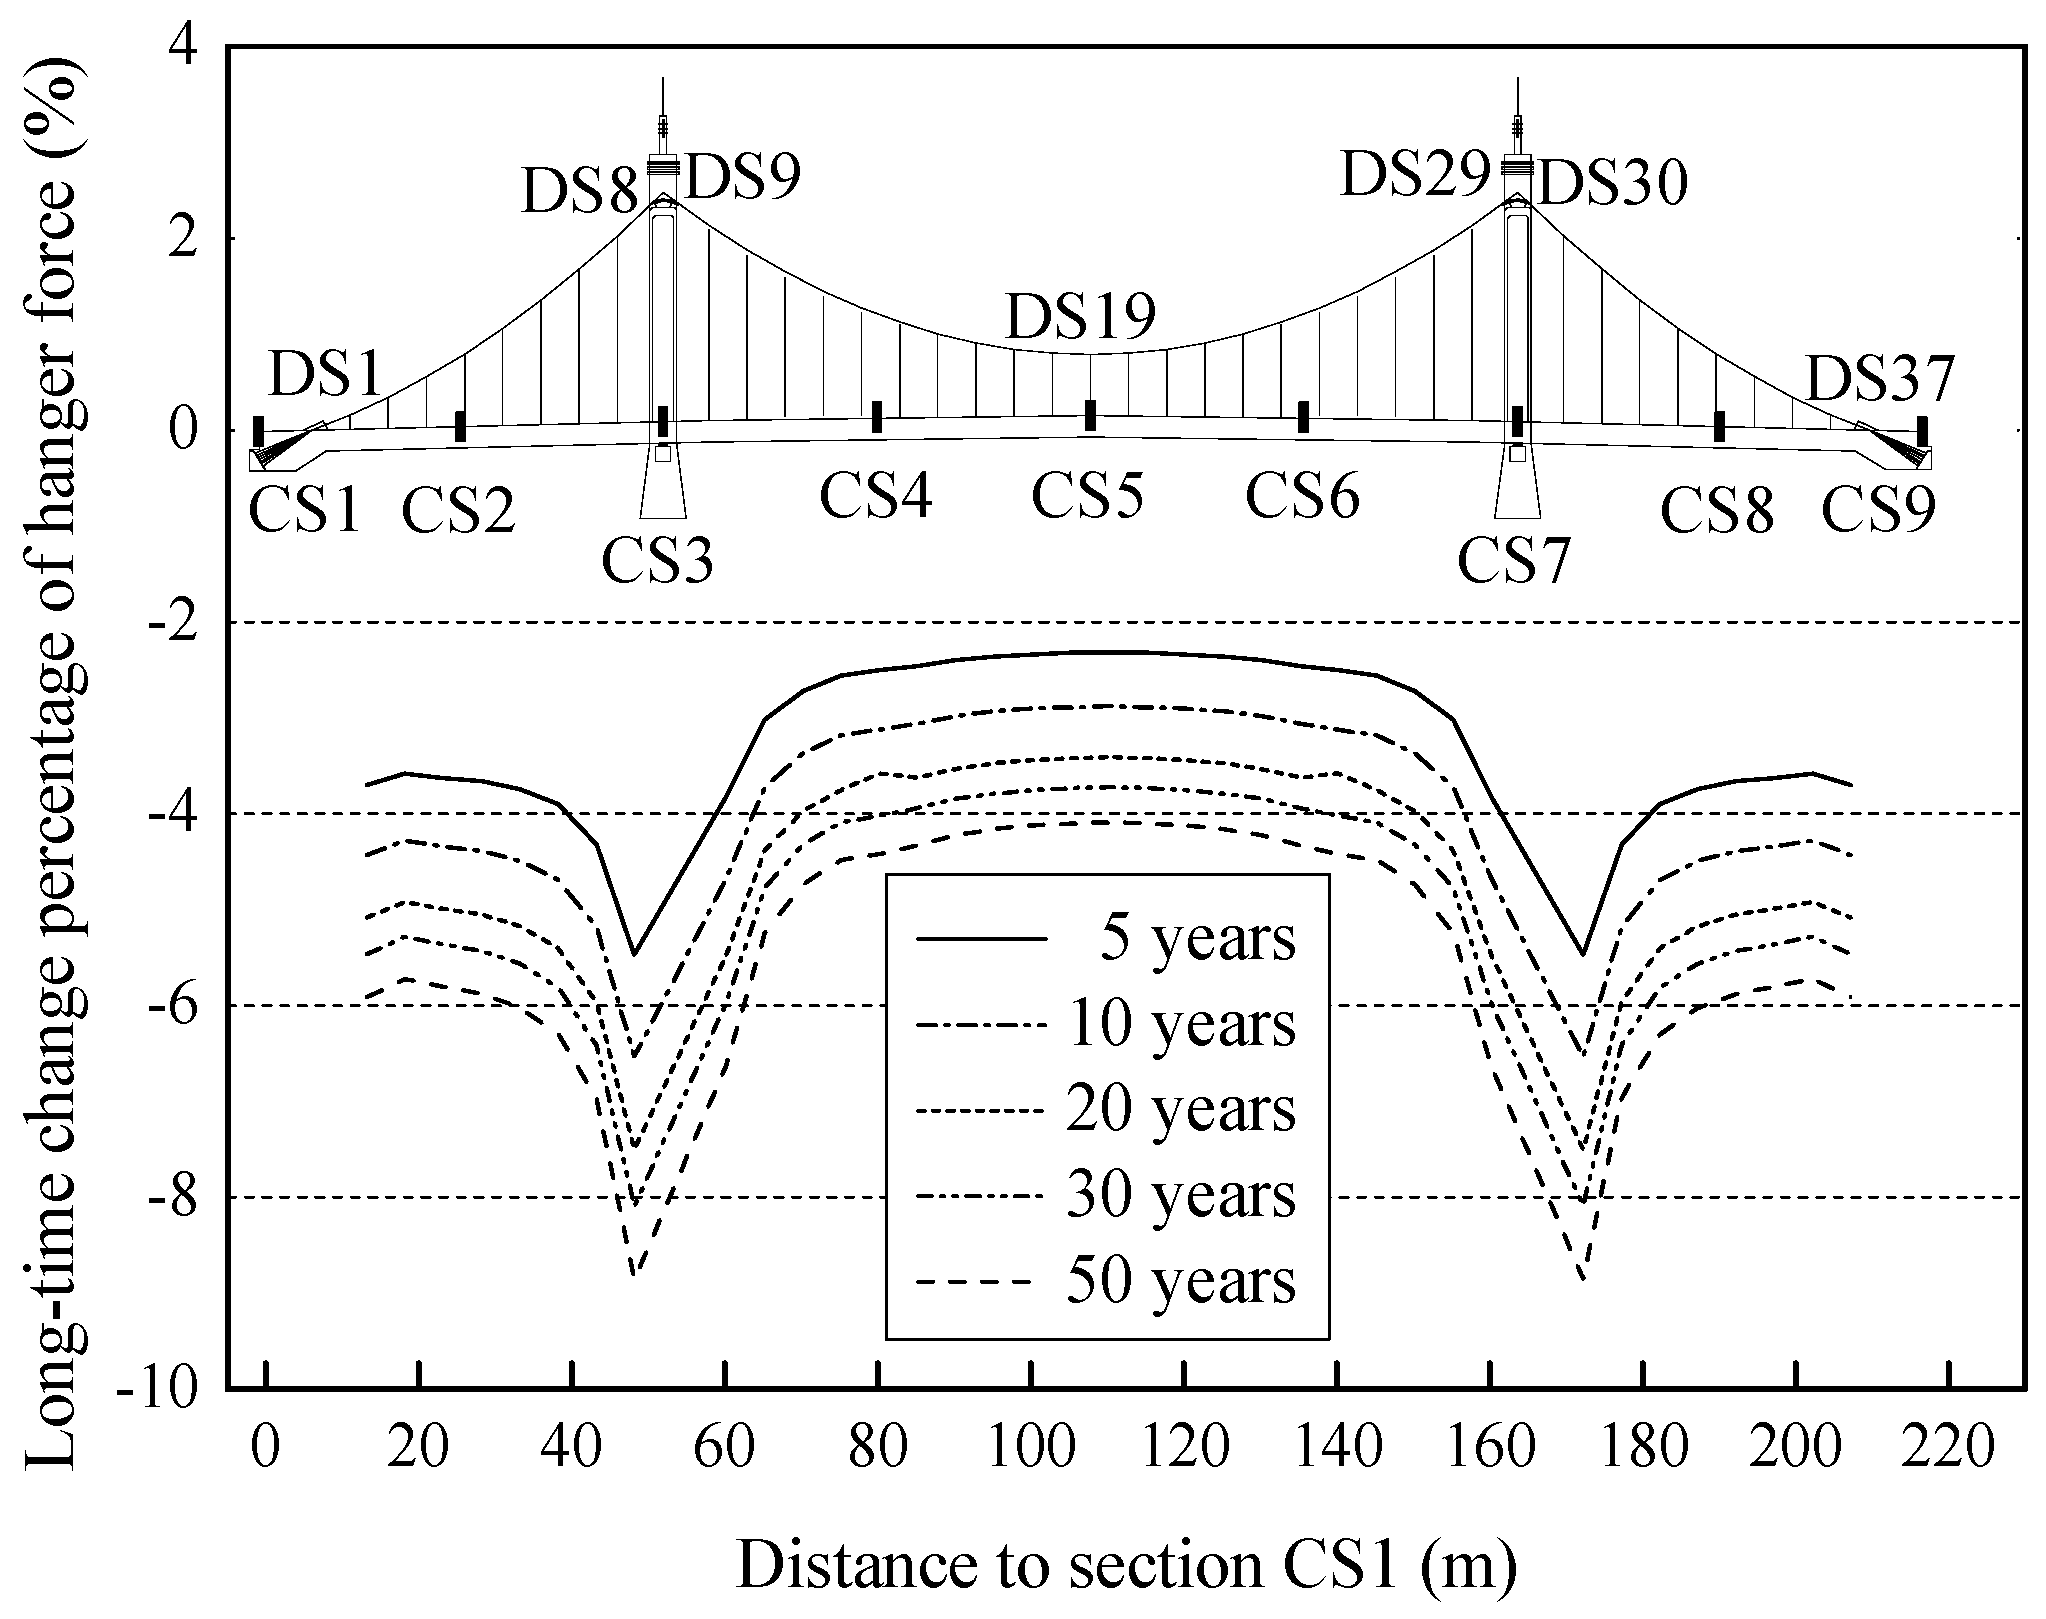
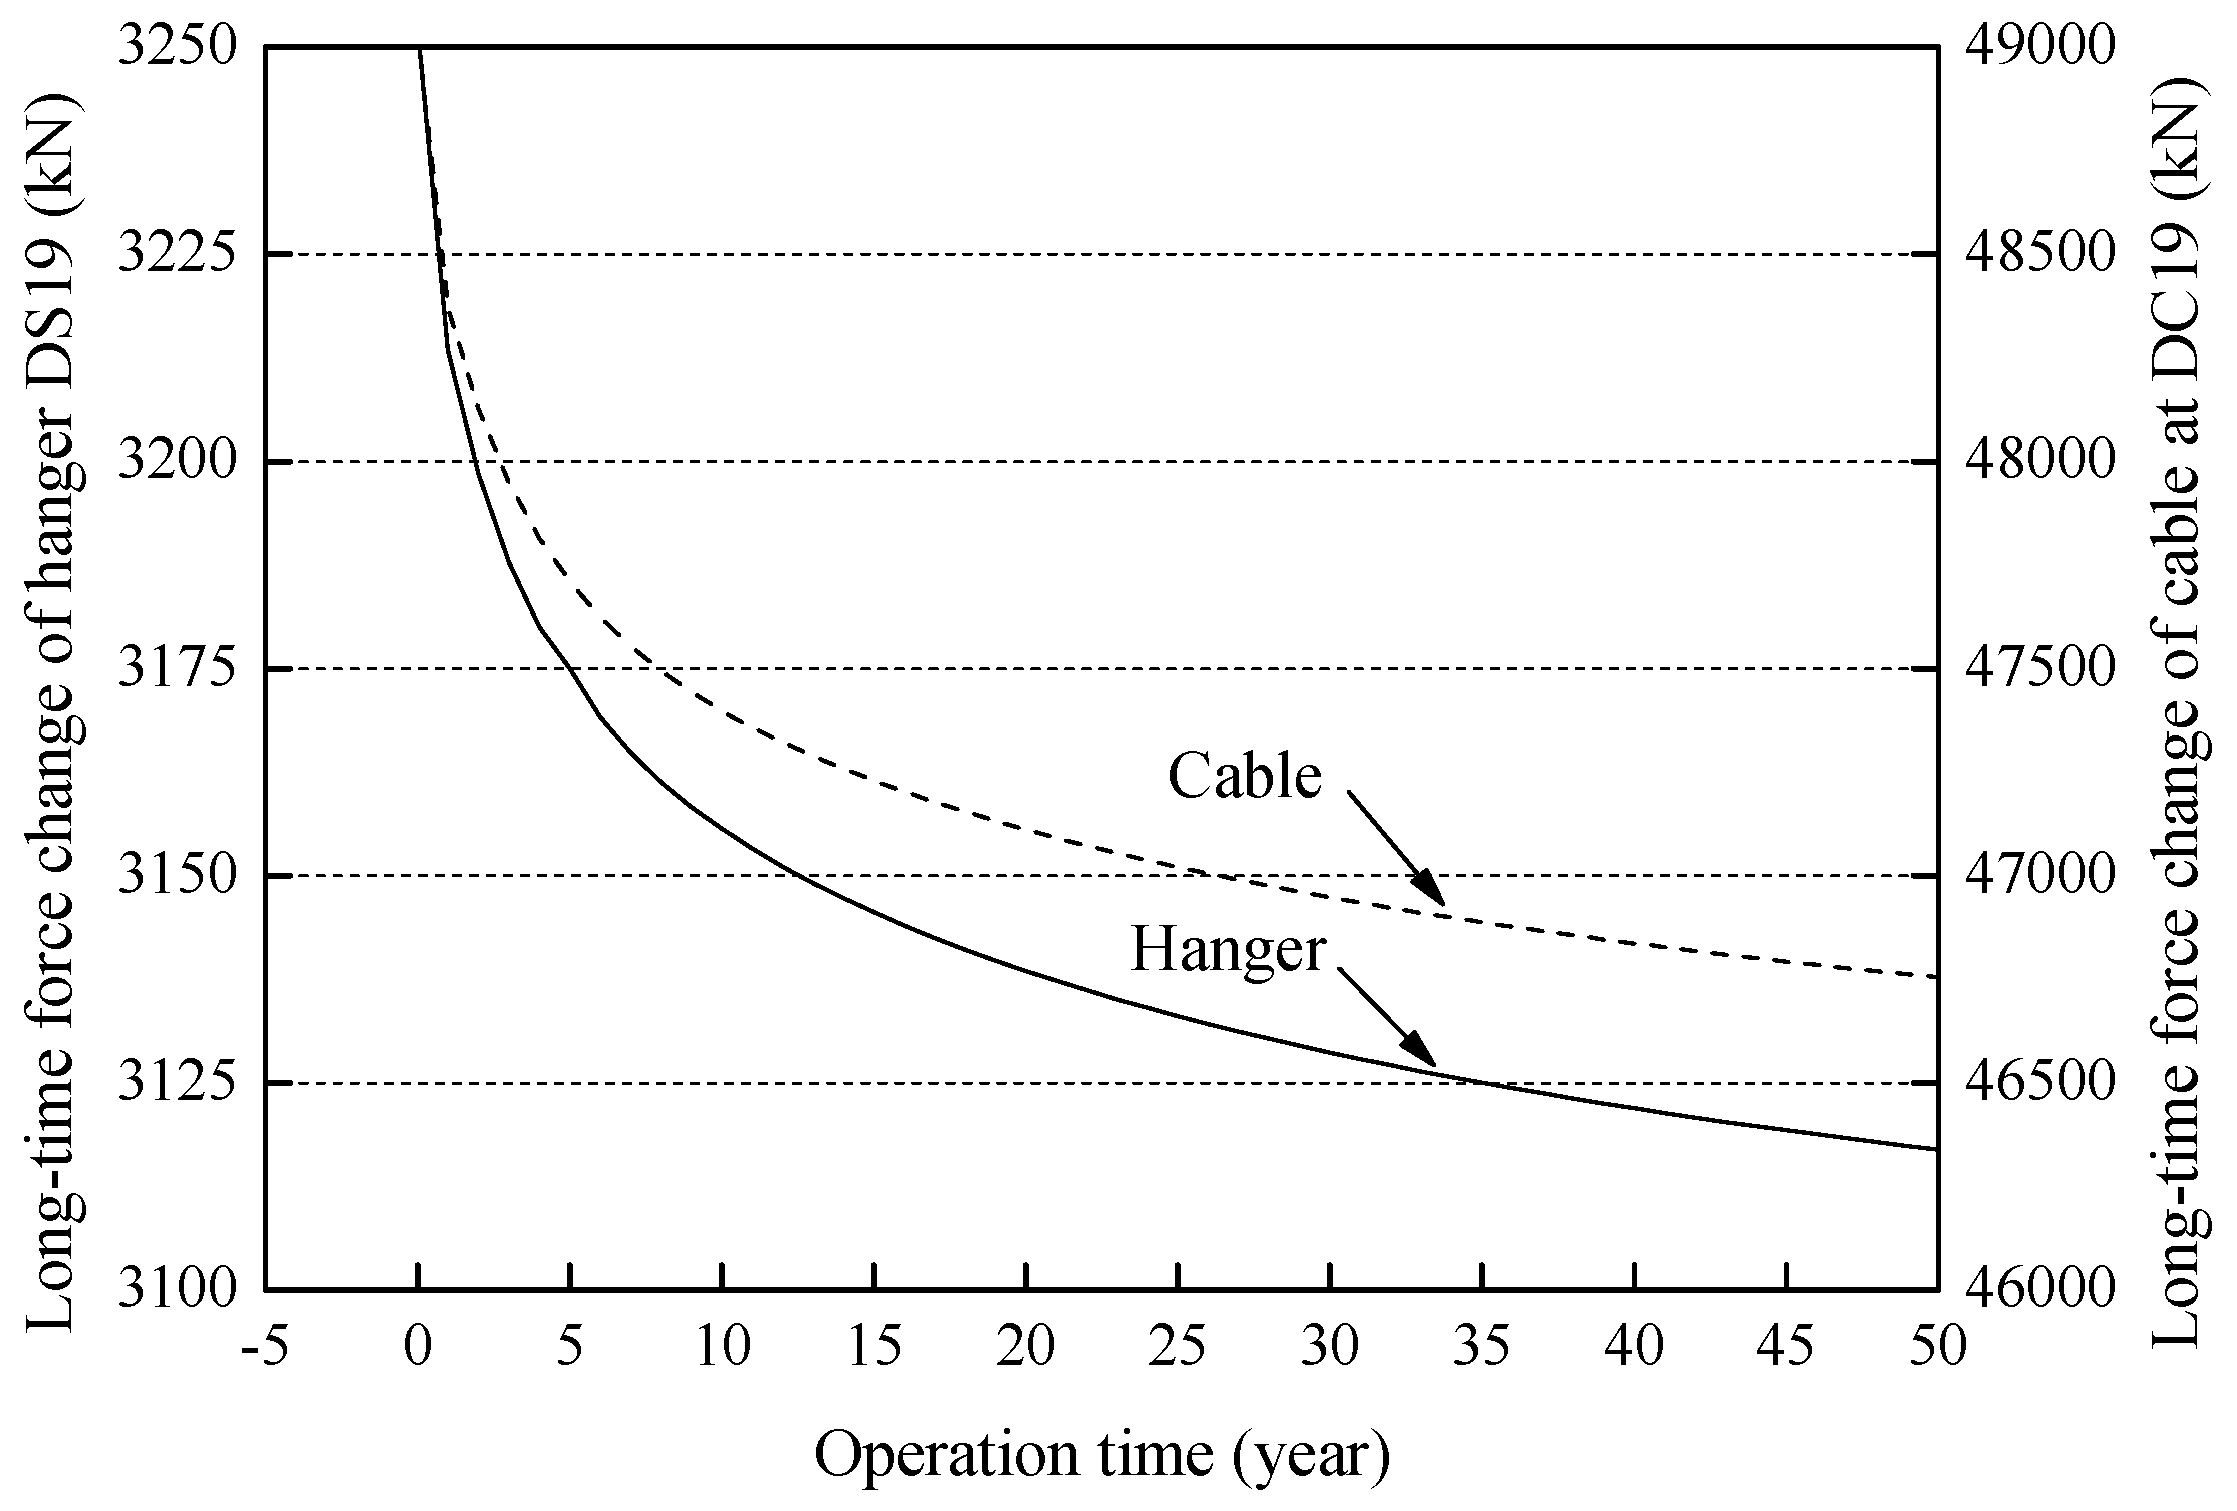
6.2. Internal Force
7. Conclusions
- The measured data reflect the stability and safety of Hunan Road Bridge. The transverse displacements of towers were more significant than the longitudinal ones. The spatial effect of the girder is significant due to the extra width, which performed as the girder longitudinal stresses changed unevenly along the transverse direction. The slight changes of girder vibration frequencies reflect the stable girder structural stiffness and mass.
- The deviations of cable anchoring positions and deflection of mid-span girder that are caused by the concrete S&C and ambient temperature changes are main factors influencing the structural alignments and internal forces of concrete self-anchored suspension bridges. Especially for the one having an extra-wide concrete girder such as Hunan Road Bridge.
- The cable anchoring positions at girder ends and tower tops moved towards the mid-span affected by the concrete S&C. The measured deflections of the girder at the middle region of mid-span were significant. Increases in the longitudinal compressive stresses of top plate and decreases in the ones of bottom plate were caused in this region. In addition, the girder compressive stresses increased generally along with the seasonal ambient warming and decreased along with cooling. The uneven distributions of girder stress variations between the side and middle webs of the same section caused by the temperature gradient effects reflect the significant spatial effect of the extra-wide girder.
- The stress increases of side-span girder bottom plate and mid-span girder top plate under extreme seasonal warming, as well as the stress decreases of side-span girder top plate and mid-span girder bottom plate under extreme cooling, are worthy of attentions when considering the long-time concrete S&C effects. Moreover, the concrete S&C effects should be taken into account during the determination of reasonable final state. The methods to offset the adverse influences of concrete S&C include the set of appropriate girder camber, pre-deviations of towers towards side-span, and pre-lift of mid-span girder through adjusting the final hanger forces in a reasonable range. A parametric study on the influence of the final girder alignment after hanger force adjustment in the stress and geometry evolution of the main girder was conducted. The hanger force adjustment can allocate the girder compressive stress reserves reasonably. The adverse influences in the safety of concrete self-anchored suspension bridge, brought by the heavy vehicle loads, concrete S&C, and extreme temperature changes, may then be reduced effectively, which are the lessons learned from this paper.
Acknowledgments
Author Contributions
Conflicts of Interest
References
- Li, J.H.; Li, A.Q. Calculation, Monitoring and Assessment of Spatial Cable Self-Anchored Suspension Bridges; China Communication Press: Beijing, China, 2011. (In Chinese) [Google Scholar]
- Sun, J.; Manzanarez, R.; Nander, M. Suspension cable design of the new San Francisco-Oakland Bay Bridge. J. Bridge Eng. 2004, 9, 101–106. [Google Scholar] [CrossRef]
- Kim, H.K.; Lee, M.J.; Chang, S.P. Determination of hanger installation procedure for a self-anchored suspension bridge. Eng. Struct. 2006, 28, 959–976. [Google Scholar] [CrossRef]
- Li, A.Q.; Miao, C.Q.; Li, Z.X. Health monitoring system for the Runyang Yangtse River Bridge. J. Southeast Univ. (Nat. Sci.) 2003, 33, 544–548. (In Chinese) [Google Scholar]
- Li, A.Q.; Wang, H. Stress analysis on steel box girders of super-long-span suspension bridges with sub model method. Eng. Mech. 2007, 24, 80–84. (In Chinese) [Google Scholar] [CrossRef]
- Wan, L.J.; Shan, W.; Yuan, J.X. Experimental study on static characteristics model of self-anchored suspension bridge. J. Highway Transp. Res. Dev. 2014, 31, 108–114. (In Chinese) [Google Scholar]
- Chou, C.C.; Uang, C.M.; Seible, F. Experimental evaluation of compressive behavior of orthotropic steel plates for the new San Francisco-Oakland Bay Bridge. J. Bridge Eng. 2006, 11, 140–150. [Google Scholar] [CrossRef]
- Kim, Y.C.; Kaloop, M.R.; Hu, J.W. Predicting the performance of high-speed railway bridge using regression neural network approach. Appl. Mech. Mater. 2017, 873, 220–224. [Google Scholar] [CrossRef]
- Kaloop, M.; Hu, J.; Bigdeli, Y. Identification of the response of a controlled building structure subjected to seismic load by using nonlinear system models. Appl. Sci. 2016, 6, 301. [Google Scholar] [CrossRef]
- Spencer, B.F.; Ruiz-Sandoval, M.; Kurata, N. Smart sensing technology: Opportunities and challenges. Struct. Control Health Monit. 2004, 11, 349–368. [Google Scholar] [CrossRef]
- Li, J.; Mechitov, K.A.; Kim, R.E.; Spencer, B.F. Efficient time synchronization for structural health monitoring using wireless smart sensor networks. Struct. Control Health Monit. 2016, 23, 470–486. [Google Scholar] [CrossRef]
- Han, L.; Newhook, J.P.; Mufti, A.A. Centralized remote structural monitoring and management of real-time data. Proc. SPIE 2004, 5393, 55–65. [Google Scholar]
- Alavi, A.H.; Hasni, H.; Jiao, P.C.; Borchani, W.; Lajnef, N. Fatigue cracking detection in steel bridge girders through a self-powered sensing concept. J. Constr. Steel Res. 2017, 128, 19–38. [Google Scholar] [CrossRef]
- Alavi, A.H.; Hasni, H.; Lajnef, N.; Chatti, K.; Faridazar, F. Damage detection using self-powered wireless sensor data: An evolutionary approach. Measurement 2016, 82, 254–283. [Google Scholar] [CrossRef]
- Alavi, A.H.; Hasni, H.; Lajnef, N.; Chatti, K.; Faridazar, F. An intelligent structural damage detection approach based on self-powered wireless sensor data. Autom. Constr. 2016, 62, 24–44. [Google Scholar] [CrossRef]
- Kaloop, M.; Hu, J.; Elbeltagi, E. Adjustment and assessment of the measurements of low and high sampling frequencies of GPS real-time monitoring of structural movement. ISPRS Int. J. Geo-Inf. 2016, 5, 222. [Google Scholar] [CrossRef]
- Kumberg, T.; Schneid, S.; Reindl, L. A wireless sensor network using GNSS receivers for a short-term assessment of the modal properties of the Neckartal Bridge. Appl. Sci. 2017, 7, 626. [Google Scholar] [CrossRef]
- Kong, Q.Z.; Robert, R.; Silva, P.; Mo, Y. Cyclic crack monitoring of a reinforced concrete column under simulated pseudo-dynamic loading using piezoceramic-based smart aggregates. Appl. Sci. 2016, 6, 341. [Google Scholar] [CrossRef]
- Jiao, P.C.; Borchani, W.; Hasni, H.; Lajnef, N. A new solution of measuring thermal response of prestressed concrete bridge girders for structural health monitoring. Meas. Sci. Technol. 2017, 28, 085005. [Google Scholar] [CrossRef]
- Hu, D.T.; Guo, Y.X.; Chen, X.F.; Zhang, C.R. Cable force health monitoring of Tongwamen Bridge based on fiber bragg grating. Appl. Sci. 2017, 7, 384. [Google Scholar] [CrossRef]
- Raeisi, F.; Mufti, A.A.; Mustapha, G.; Thomson, D.J. Crack detection in steel girders of bridges using a broken wire electronic binary sensor. J. Civ. Struct. Health Monit. 2017, 7, 233–243. [Google Scholar] [CrossRef]
- Liu, Y.; Deng, Y.; Cai, C.S. Deflection monitoring and assessment for a suspension bridge using a connected pipe system: A case study in China. Struct. Control Health Monit. 2015, 22, 1408–1425. [Google Scholar] [CrossRef]
- Tennyson, R.C.; Mufti, A.A.; Rizkalla, S.; Tadros, G.; Benmokrane, B. Structural health monitoring of innovative bridges in Canada with fiber optic sensors. Smart Mater. Struct. 2001, 10, 560. [Google Scholar] [CrossRef]
- Shehata, E.; Rizkalla, S. Intelligent sensing for innovative bridges. J. Intell. Mater. Syst. Struct. 1999, 10, 304–313. [Google Scholar] [CrossRef]
- Deng, Y.; Liu, Y.; Feng, D.M. Monitoring damage evolution of steel strand using acoustic emission technique and rate process theory. J. Cent. South Univ. 2014, 21, 3692–3697. [Google Scholar] [CrossRef]
- Mutlib, N.K.; Baharom, S.B.; El-Shafie, A.; Nuawi, M.Z. Ultrasonic health monitoring in structural engineering: Buildings and bridges. Struct. Control Health Monit. 2016, 23, 409–422. [Google Scholar] [CrossRef]
- Mufti, A.A. Structural health monitoring of innovative bridge decks. Struct. Infrastruct. E 2005, 1, 119–133. [Google Scholar] [CrossRef]
- Klowak, C.; Rivera, E.; Mufti, A.A. Implementation of civionics in a second generation steel-free bridge deck. Nondestructive Evaluation and Health Monitoring of Aerospace Materials, Composites, and Civil Infrastructure IV. Proc. SPIE 2005, 5767, 195–204. [Google Scholar]
- Rivera, E.; Mufti, A.A.; Thomson, D.J. Civionics specifications for fiber optic sensors for structural health monitoring. Proc. SPIE 2004, 5393, 161–167. [Google Scholar]
- Kaloop, M.R.; Hu, J.W.; Elbeltagi, E. Evaluation of high-speed railway bridges based on a nondestructive monitoring system. Appl. Sci. 2016, 6, 24. [Google Scholar] [CrossRef]
- Zhou, G.P.; Li, A.Q.; Li, J.H.; Duan, M.J. Test and numerical investigations on static and dynamic characteristics of extra-wide concrete self-anchored suspension bridge under vehicle loads. J. Cent. South Univ. 2017, 24, 2382–2395. [Google Scholar] [CrossRef]
- Huffman, S.; Bagchi, A.; Mufti, A.A.; Neale, K.; Sargent, D.; Rivera, E. GFRP seismic strengthening and structural heath monitoring of Portage Creek Bridge concrete columns. Arab. J. Sci. Eng. B 2006, 31, 25–42. [Google Scholar]
- McNeill, D.; Card, L. Adaptive event detection for SHM system monitoring. In Sensing Issues in Civil Structural Health Monitoring; Springer: Dordrecht, The Netherlands, 2005; pp. 311–319. [Google Scholar]
- Kim, S.H.; Choi, J.G.; Ham, S.M.; Heo, W.H. Reliability evaluation of a PSC highway bridge based on resistance capacity degradation due to a corrosive environment. Appl. Sci. 2016, 6, 423. [Google Scholar] [CrossRef]
- Deng, Y.; Ding, Y.L.; Li, A.Q.; Zhou, G.D. Fatigue reliability assessment for bridge welded details using long-term monitoring data. Sci. China Technol. Sci. 2011, 54, 3371–3381. [Google Scholar] [CrossRef]
- Kim, S.H.; Won, J.H. Structural behavior of a long-span partially earth-anchored cable-stayed bridge during installation of a key segment by thermal prestressing. Appl. Sci. 2016, 6, 231. [Google Scholar] [CrossRef]
- Iskakbayev, A.; Teltayev, B.; Oliviero Rossi, C. Steady-state creep of asphalt concrete. Appl. Sci. 2017, 7, 142. [Google Scholar] [CrossRef]
- Hedegaard, B.D.; French, C.E.W.; Shield, C.K. Time-dependent monitoring and modeling of I-35W St. Anthony Falls Bridge. I: Analysis of monitoring data. J. Bridge Eng. 2017, 22, 04017025. [Google Scholar] [CrossRef]
- Hedegaard, B.D.; French, C.E.W.; Shield, C.K. Time-dependent monitoring and modeling of I-35W St. Anthony Falls Bridge. II: Finite-element modeling. J. Bridge Eng. 2017, 22, 04017026. [Google Scholar] [CrossRef]
- Salawu, O.S. Detection of structural damage through changes in frequency: A review. Eng. Struct. 1997, 19, 718–723. [Google Scholar] [CrossRef]
- Hjelmstad, K.D.; Shin, S. Damage detection and assessment of structures from static response. J. Eng. Mech. 1997, 123, 568–576. [Google Scholar] [CrossRef]
- Code for Design of Highway Reinforced Concrete and Prestressed Concrete Bridges and Culverts; JTG D62-2004; China Communication Press: Beijing, China, 2004. (In Chinese)
- Model Code for Concrete Structures 1990; CEB-FIP 90; Comité Euro-International du Béton-Fédération International de la Précontrainte: Thomas Telford, UK, 1990.
- Bažant, Z.P. Prediction of concrete creep effects using age-adjusted effective modulus method. J. Am. Concr. Inst. 1972, 69, 212–217. [Google Scholar]
- Tang, M.L. 3D geometric Nonlinear Analysis of Long-Span Suspension Bridge and Its Software Development. Ph.D. Dissertation, Southwest Jiaotong University, Chengdu, China, 2003. (In Chinese). [Google Scholar]
- Duan, M.J.; Li, J.H.; Suo, X.C.; Zhou, G.P. Refined analysis method of saddle for self-anchored concrete suspension bridge. J. Nanjing Technol. Univ. (Nat. Sci.) 2016, 38, 112–115. (In Chinese) [Google Scholar]


| Natural Frequencies/Hz | Deflections of Girder/cm | Longitudinal Stress of CS5/MPa | |||||||||
|---|---|---|---|---|---|---|---|---|---|---|---|
| Upper Plate | Bottom Plate | ||||||||||
| Mode Shapes | Simulation | Measurement | Sections | Simulation | Measurement | Test Points | Simulation | Measurement | Test Points | Simulation | Measurement |
| V1 | 0.757 | 0.756 | CS2 | −1.02 | −0.9 | SU1 | −5.41 | −4.11 | SD1 | −5.78 | −6.14 |
| V2 | 1.274 | 1.318 | CS4 | 0.93 | 0.9 | SU2 | −5.37 | −4.01 | SD2 | −5.81 | −4.28 |
| V3 | 1.464 | 1.465 | CS5 | 1.32 | 1.2 | SU3 | −5.32 | −5.38 | SD3 | −5.87 | −4.90 |
| T1 | 1.256 | 1.245 | CS6 | 0.95 | 1.0 | SU4 | −5.27 | −4.72 | SD4 | −5.92 | −5.87 |
| T2 | 1.421 | 1.392 | CS8 | −1.05 | −0.8 | ||||||
| T3 | 1.474 | 1.489 | |||||||||
| Tower Position | First Half Year Period | One-Year Period | Construction Period | ||||||
|---|---|---|---|---|---|---|---|---|---|
| Transverse Direction | Longitudinal Direction | Vertical Direction | Transverse Direction | Longitudinal Direction | Vertical Direction | Transverse Direction | Longitudinal Direction | Vertical Direction | |
| Southwest | −0.5 | 0.4 | 0 | 0.3 | 0.4 | −0.6 | 2.7 | −0.1 | −1.0 |
| Northwest | −1.0 | 0.2 | 0 | −0.6 | 0.4 | −0.6 | −0.7 | 0 | −0.7 |
| Southeast | 0.4 | −0.1 | 0 | 0.7 | −0.3 | −0.1 | 2.1 | −0.2 | −1.6 |
| Northeast | 0.1 | −0.1 | 0 | −0.1 | −0.9 | −0.2 | −1.3 | 0.4 | −1.2 |
| Order | Calculated Initial Values | Measured Values | |
|---|---|---|---|
| 15 April 2015 | 15 April 2016 | ||
| 1 | 0.757 | 0.756 | 0.756 |
| 2 | 1.256 | 1.245 | 1.241 |
| 3 | 1.274 | 1.318 | 1.312 |
| 4 | 1.421 | 1.392 | 1.397 |
| 5 | 1.457 | 1.447 | 1.447 |
| 6 | 1.464 | 1.465 | 1.463 |
| 7 | 1.474 | 1.489 | 1.481 |
| 8 | 1.611 | 1.611 | 1.600 |
| 9 | 1.649 | 1.660 | 1.658 |
| 10 | 1.698 | 1.685 | 1.685 |
| Location of Anchoring Span | Measured Cable Force (kN) | Change Percentage (%) | |||
|---|---|---|---|---|---|
| 15 April 2015 | 15 October 2015 | 15 April 2016 | First Half Year Period | One-Year Period | |
| SC1-S (Southwest) | 53,758 | 53,545 | 53,612 | −0.40 | −0.27 |
| SC1-N(Northwest) | 51,763 | 51,328 | 51,312 | −0.84 | −0.87 |
| SC2-S (Southeast) | 50,868 | 50,848 | 50,782 | −0.04 | −0.17 |
| SC2-N (Northeast) | 49,870 | 49,812 | 49,469 | −0.12 | −0.80 |
| Tower Location | Sensor Location | Measured Tower Stress (MPa) | Variation Amount (MPa) | |||
|---|---|---|---|---|---|---|
| 15 April 2015 | 15 October 2015 | 15 April 2016 | First Half Year Period | One-Year Period | ||
| ST1-S Southwest | Northeast | −13.520 | −13.100 | −14.200 | −0.420 | 0.680 |
| Southeast | −11.635 | −12.760 | −11.760 | 1.125 | 0.125 | |
| Central south | −5.398 | −5.810 | −4.810 | 0.412 | −0.588 | |
| Southwest | −11.213 | −11.680 | −10.680 | 0.467 | −0.533 | |
| Northwest | −11.982 | −11.380 | −12.380 | −0.602 | 0.398 | |
| Central north | −9.295 | −9.670 | −10.270 | 0.375 | 0.975 | |
| ST1-N Northwest | Northeast | −9.632 | −9.740 | −10.140 | 0.108 | 0.508 |
| Southeast | −10.433 | −11.785 | −10.385 | 1.352 | −0.048 | |
| Central south | −10.010 | −10.936 | −9.336 | 0.926 | −0.674 | |
| Southwest | −9.815 | −10.730 | −9.030 | 0.915 | −0.785 | |
| Northwest | −8.353 | −8.006 | −8.606 | −0.347 | 0.253 | |
| Central north | −7.863 | −7.333 | −8.030 | −0.530 | 0.167 | |
| Increasing Percentage of Hanger Force | Bridge Completion State After Equilibrium Analysis | Girder State After 50 Years | ||||
|---|---|---|---|---|---|---|
| Girder Lifting Amount (m) | Girder Longitudinal Stress (MPa) | Girder Deflection (m) | Girder Longitudinal Stress (MPa) | |||
| Top Plate | Bottom Plate | Top Plate | Bottom Plate | |||
| 0% | 0.013 | −5.410 | −5.780 | −0.087 | −6.618 | −2.171 |
| 1% | 0.015 | −5.322 | −6.183 | −0.087 | −6.532 | −2.569 |
| 2% | 0.017 | −5.233 | −6.586 | −0.088 | −6.446 | −2.966 |
| 3% | 0.019 | −5.145 | −6.989 | −0.088 | −6.359 | −3.364 |
| 4% | 0.021 | −5.056 | −7.391 | −0.089 | −6.273 | −3.762 |
| 5% | 0.023 | −4.968 | −7.794 | −0.089 | −6.187 | −4.160 |
© 2018 by the authors. Licensee MDPI, Basel, Switzerland. This article is an open access article distributed under the terms and conditions of the Creative Commons Attribution (CC BY) license (http://creativecommons.org/licenses/by/4.0/).
Share and Cite
Zhou, G.; Li, A.; Li, J.; Duan, M. Structural Health Monitoring and Time-Dependent Effects Analysis of Self-Anchored Suspension Bridge with Extra-Wide Concrete Girder. Appl. Sci. 2018, 8, 115. https://doi.org/10.3390/app8010115
Zhou G, Li A, Li J, Duan M. Structural Health Monitoring and Time-Dependent Effects Analysis of Self-Anchored Suspension Bridge with Extra-Wide Concrete Girder. Applied Sciences. 2018; 8(1):115. https://doi.org/10.3390/app8010115
Chicago/Turabian StyleZhou, Guangpan, Aiqun Li, Jianhui Li, and Maojun Duan. 2018. "Structural Health Monitoring and Time-Dependent Effects Analysis of Self-Anchored Suspension Bridge with Extra-Wide Concrete Girder" Applied Sciences 8, no. 1: 115. https://doi.org/10.3390/app8010115
APA StyleZhou, G., Li, A., Li, J., & Duan, M. (2018). Structural Health Monitoring and Time-Dependent Effects Analysis of Self-Anchored Suspension Bridge with Extra-Wide Concrete Girder. Applied Sciences, 8(1), 115. https://doi.org/10.3390/app8010115