Article

Removal of Escherichia coli by Intermittent Operation of Saturated Sand Columns Supplemented with Hydrochar Derived from Sewage Sludge

1
UNESCO-IHE Institute for Water Education, P.O. BOX 3015, 2601 DA Delft, The Netherlands
2
Institute of Natural Resource Sciences, Zurich University of Applied Sciences, Grüental, 8820 Wädenswil, Switzerland
*
Author to whom correspondence should be addressed.
Appl. Sci. 2017, 7(8), 839; https://doi.org/10.3390/app7080839
Submission received: 19 June 2017 / Revised: 9 August 2017 / Accepted: 10 August 2017 / Published: 15 August 2017
(This article belongs to the Special Issue Wastewater Treatment and Reuse Technologies)

Abstract

:

Featured Application

Bacterial removal in water treatment using a sand column supplemented with adsorbents derived from hydrothermally treated sewage sludge.

Abstract

Hydrothermal carbonization (HTC) technology can convert various types of waste biomass into a carbon-rich product referred to as hydrochar. In order to verify the potential of hydrochar produced from stabilized sewage sludge to be an adsorbent for bacterial pathogen removal in water treatment, the Escherichia coli’s removal efficiency was determined by using 10 cm sand columns loaded with 1.5% (w/w) hydrochar. Furthermore, the removal of E. coli based on intermittent operation in larger columns of 50 cm was measured for 30 days. Since the removal of E. coli was not sufficient when the sand columns were supplemented with raw hydrochar, an additional cold-alkali activation of the hydrochar using potassium hydroxide was applied. This enabled more than 90% of E. coli removal in both the 10 cm and 50 cm column experiments. The enhancement of the E. coli removal efficiency could be attributed to the more hydrophobic surface of the KOH pre-treated hydrochar. The idle time during the intermittent flushing experiments in the sand-only columns without the hydrochar supplement had a significant effect on the E. coli removal (p < 0.05), resulting in a removal efficiency of 55.2%. This research suggested the possible utilization of hydrochar produced from sewage sludge as an adsorbent in water treatment for the removal of bacterial contaminants.

1. Introduction

Hydrothermal carbonization (HTC) is considered an emerging technology for effective waste conversion and/or treatment. In the HTC, also known as “wet pyrolysis”, process, feed stock (organic stock immersed in water) is heated in a pressure-resistant reactor. Autogenous pressure inside the reactor allows subcritical water temperatures (180–350 °C), and the feed stock is converted into a mixture of process water containing water-soluble organics and a carbonaceous solid called hydrochar [1]. Several distinctive features of HTC, such as minimal environmental impact, simplicity, cost effectiveness, low greenhouse gas emission, and energy efficiency, make the technology attractive [2].
In 1913, Bergius performed the first HTC experiment to facilitate the natural coalification process of organic feedstock under laboratory conditions [3]. Since then, extensive research has investigated HTC for the conversion of a wide range of feedstock, from pure substances (e.g., cellulose and glucose) to more complex materials, such as fruit shells and paper [4,5,6,7]. The advantage of HTC over other pyrolysis techniques is that a feedstock with high moisture content can be directly converted into a solid carbonaceous material with high yield. The additional cost for feedstock drying in other conventional dry pyrolysis methods can be saved, and this enables various continuously generated waste materials, such as animal and human faeces, municipal sewage sludge, and activated sludge from wastewater treatment plants, to be used as potential feedstock [1].
The traditional disposal methods of sewage sludge have limitations, due to potential environmental risks that could result from various pollutants, such as pathogenic micro-organisms, organic pollutants, and heavy metals [8]. Recently, HTC has been suggested as a cost-effective and eco-friendly solution for this sewage sludge management challenge [9,10,11]. Also, the carbonaceous solid output (hydrochar) from the HTC process, with a competitive pollutant adsorption capacity, could replace commercial activated carbon in water treatment [12].
The research on the use of hydrochar derived from sewage as a low-cost adsorbent in water treatment is still in its infancy. It was reported that the hydrochars derived from industrial sludge and anaerobically digested sludge removed Pb(II) (qm = 11 mg/g) in laboratory conditions [13]. Also, sewage sludge-derived hydrochar showed a comparable Pb(II) removal efficiency (qm = 15 mg/g) [14]. For the removal of pathogenic contaminants, hydrochar derived from sewage sludge was able to achieve a 2 to >3 log removal of human pathogenic rotavirus and adenovirus [15]. However, the removal of faecal bacteria has not yet been reported. Therefore, the main objective of this research is to evaluate the hydrochar derived from sewage sludge as an additive adsorbent in sand filtration setups for Escherichia coli removal during water treatment.

2. Materials and Methods

2.1. Escherichia coli Suspension

As a surrogate of enteric bacterial pathogens, a wild-type E. coli strain UCFL-94 obtained from a grazing field was provided from previous research [16]. Previous investigations reported a relatively low sticking efficiency of the strain. UCFL-94 was inoculated in 50 mL nutrient broth (OXOID, Basingstoke, Great Britain), and the culture medium was stored at 37 °C for 24 h under agitation at 150 rpm using an orbital shaker. Fresh E. coli stocks were prepared every week during the experimental period. The influent for the E. coli removal experiments was prepared by dilution of the E. coli stock into artificial groundwater (AGW). AGW was prepared by dissolving 526 mg/L CaCl2·2H2O, 184 mg/L MgSO4·7H2O, 8.5 mg/L KH2PO4, 21.75 mg/L K2HPO4, and 17.7 mg/L Na2HPO4 in demineralized (DI) water [17]. The results from pH and electrical conductivity measurements on the AGW ranged between 6.6–6.8 and 1012–1030 μS/cm, respectively.
The influent was prepared at room temperature (23 ± 2 °C), and stabilized for >24 h before its use in the experiments. Since there was no significant change in the E. coli concentration of the influent during 4 days of observation (data not shown), the natural die-off of the E. coli was not considered. The E. coli concentration of the influent was controlled to be ~106 CFU/mL or ~103 CFU/mL for small and large column experiments, respectively. In this research, the E. coli concentration was measured by using the conventional heterotrophic plate counting method [18] employing Chromocult agar plates (ChromoCult® Coliform Agar, Merck, Darmstadt, Germany). After the incubation period of 24 h at 37 °C, the colonies on the agar plates were counted using a Colony Counter (IUL, Barcelona, Spain).

2.2. Hydrochar

The Zurich University of Applied Sciences (ZHAW, Wädenswil, Switzerland) provided the hydrochar stock used in this research. Briefly, the hydrothermal conversion of stabilized sewage sludge from a wastewater treatment plant was carried out with sulphuric and acetic acid supplements for 5 h at a median temperature of ~210 °C. The autogenous pressure inside the reactor ranged between 21 and 24 bar. The output of the hydrothermal reaction had the form of thick slurry. It was chilled to 20 °C and dehydrated using a membrane filter press. The resulting filter cake was oven-dried at 105 °C overnight, and manually powdered using a mortar and pestle. Finally, the hydrochar powders were rinsed by a few rounds of suspension in DI water and successive centrifugation at 2700 g for 3 min (236 HK, Hermle, Wehingen, Germany).
In order to increase the adsorptive capacity, the raw hydrochar was activated by KOH solution [17,19,20]. Washed hydrochar powders were suspended in a 1 M KOH solution at a concentration of 5 g hydrochar (dry weight)/L and stirred for 1 h at room temperature. The hydrochar-KOH suspension was washed as described earlier until a neutral pH was observed [17]. The KOH concentration for the activation was selected based on the results from preliminary experiments (data not shown) as described previously [17]. The concentration of each hydrochar suspension was determined by measuring the dry weight (at 105 °C). All hydrochar stocks were stored at 4 °C until needed.

2.3. Material Characterization

2.3.1. Zeta Potential

The zeta potential of hydrochar and E. coli in a certain pH range (4–10 for hydrochar and 5.5–8.5 for E. coli) was measured using a Zetasizer Nano ZS (Malvern, Worcestershire, UK) equipped with an auto-titration unit MPT-2. Hydrochar and E. coli samples were conditioned in AGW by several rounds of washing prior to the experiments. All of the test samples were diluted to a certain extent in order to have an adequate attenuator selection (6–8) of the instrument.

2.3.2. Elemental Composition

Both the raw and activated hydrochar samples were analyzed by X-ray fluorescence (XRF) spectroscopy in order to assess their elemental compositions using a SPECTRO-XEPOS XRF spectrometer (SPECTRO, Kleve, Germany). The instrument was equipped with a 10 mm2 Si-Drift Detector with Peltier cooling and a spectral resolution (FWHM) at Mn Ka ≤155 eV for determination in the element range of Na–U (SPECTRO, 2014). The hydrochar samples were powdered (grain size <100 μm) using a milling instrument, MM 400 (Retsch, Haan, Germany), for 5 min at a frequency of 25 s−1. Then, sample pellets with a 32 mm diameter were prepared by mixing of 4 g hydrochar powder with 0.9 g Licowax C micro powder PM (Clariant, Muttenz, Switzerland) and successive pressing under 15 tonnes pressure. The analysis was performed using the TurboQuant-screening method. Each side of the pellet was subjected to one exposure to X-ray radiation, and the mean results of both sides (two analyses) were recorded.
Also, the carbon (C), hydrogen (H), nitrogen (N), and oxygen (O) contents were measured based on the dry combustion method using a TruSpec analyzer (LECO, St. Joseph, MI, USA). The samples for the C, H, N, and O analysis were thoroughly dried at 105 °C and powdered using the mixer mill for 5 min at a frequency of 25 s−1. Then, 100 mg of each sample was incinerated at 950 °C and recorded by a TruSpec CHN Macro Analyzer. Furthermore, the O content was assessed by combusting 3 mg of sample material at 1300 °C using the additional high-temperature pyrolysis furnace TruSpec Micro Oxygen Module. All of the samples were analyzed in duplicate, and the mean results were recorded.

2.3.3. Surface Functional Groups

The raw and activated hydrochar samples were analyzed by Photoacoustic Fourier transform Infrared Spectroscopy (FTIR-PAS) in order to investigate their surface functional groups. A Tensor 37 FTIR spectrometer (Bruker Optics, Fällanden, Switzerland) equipped with a photoacoustic optical cantilever microphone PA301 detector (Gasera, Turku, Finland) was used for recording infrared spectra in the range of 4000–400 cm−1. In order to enhance the signal-to-noise ratio, an average determination of 32 single spectra was performed after the analyses. In addition, the interference resulting from CO2 was minimized by subtracting the CO2 spectrum from the sample spectrum. Prior to the measurements, samples were desiccated by drying at 105 °C for 1 h and successive storing in an exsiccator at room temperature. For each analysis, the PA301 sample cell was refreshed with helium gas of 99.999% purity.

2.3.4. Specific Surface Area and Pore Size Distribution

In order to investigate the surface area and pore size distribution of the hydrochars, gas sorption analyses were carried out using an Autosorb-iQ (Quantochrome, Boynton Beach, FL, USA). Prior to the analysis, the residual water and organic contents of the hydrochar samples were removed by placing them in dynamic vacuum conditions at 120 °C. Gas sorption experiments were performed at 77 K (−196 °C) employing N2 gas as an adsorbing gas. The surface area was derived based on the multi-point Brunauer–Emmett–Teller (BET) method. Also, density functional theory (DFT) using the quench solid DFT (QSDFT) method was used for analyzing micro and mesoporous pore size distribution [21]. Macropores were not subjected to the analysis.

2.3.5. Surface Morphology

The surface morphology of the hydrochar variants was investigated by performing a Scanning Electron Microscopy (SEM) analysis using a Quanta 250 FEG (FEI, Hillsboro, OR, USA). The hydrochar sample was placed on an adhesive side of a carbon tape fixed on an aluminium stub. Successive flushing with nitrogen gas of 99.999% purity removed detached particles.

2.3.6. Hydrophobicity

The hydrophobic property of both hydrochar samples was investigated by measuring the static contact angle using a DSA100 (KRÜSS, Hamburg, Germany). In order to obtain a flat surface of a hydrochar sample, identical pelletizing procedures employed in XRF analysis were used (see Section 2.3.2), except for the addition of Licowax C [22]. The average results of triplicated measurements were recorded.

2.4. Column Experiments

2.4.1. Experimental Setup

A 99.1% pure-quartz sand (Kristall quartz-sand, Gebrüder Dorfner, Hirschau, Germany) was used as a packing material for the columns. A sieve analysis on the sand stock reported an effective grain size (D10) of 0.45 mm, a uniformity coefficient of 2.0, and a maximum grain size of 2.0 mm [23]. The size of the hydrochar particles was smaller than 0.425 mm. In order to remove undesirable impurities, the sand stock was immersed in 5% HCl overnight and rinsed with DI water until the pH of the washing water became stabilized. Finally, the residual water was removed by draining and successive drying at 105 °C.
A certain amount of hydrochar suspension was added to the washed sand grains to achieve a 1.5% (dry w/w) hydrochar concentration, and the mixture was then thoroughly mixed. The hydrochar–sand mixture was then loaded into two types (small or large) of columns: Omnifit borosilicate glass columns (250 mm length × 25 mm inner diameter; Diba industries, Cambridge, UK) for supporting short (10 cm) column beds, and acrylic poly vinyl chloride (PVC) pipes with an inner diameter of 5.6 cm for supporting long (50 cm) column beds. During the packing process, the columns were manually tapped and agitated in order to prevent channelling in the column bed. Also, the packing material loaded in the column was compacted carefully using either a glass rod or a steel rod to avoid possible air entrapment. Each type of column was assembled using appropriate connectors and fitting materials. Throughout the experiments, the packing materials were tightly fixed in the columns by stoppers at both ends, without under-drain media and exposure to the atmosphere. Then, the columns were washed with DI water overnight using a Masterflex pump (model 77201-60, Vernon Hills, IL, USA). During the washing process, the DI water was fed into columns at an upward flow rate of 1 mL (0.2 cm)/min for small columns, or 33.3 mL (1.35 cm)/min for large columns. Chloride tracer tests, performed on both the small and large columns (data not shown), reported a void ratio of ~40%.
The columns were vertically positioned using tripod stands or a steel frame rack. Prior to the main E. coli flushing experiment, chloride tracer tests were performed to estimate the pore volume (PV) and to verify a stable aqueous flow in the column bed. The columns were flushed with the tracer solution (0.02 M NaCl) and successively with the DI water. The tracer concentration in the effluent was measured using ion chromatography (ICS-1000, Dionex, Sunnyvale, CA, USA).

2.4.2. Small Column Experiments

The E. coli removal performance of the small columns (10 cm long filtration bed) packed with either sand, the sand–raw hydrochar mixture, or the sand–activated hydrochar mixture was investigated by column flushing experiments. For each type of column medium, a pair of columns loaded with fresh packing materials was used to generate two breakthrough curves (BTC). Each flushing consisted of a loading (feeding of 50 mL AGW seeded with E. coli) and successive deloading (feeding of 50 mL E. coli-free AGW) phase. The influent was fed into the column at an upward flow rate of 1 mL/min (0.2 cm/min). The E. coli concentration in the effluent was measured every 5 min. After the column flushing experiments, the vertical distribution of the hydrochar concentration was measured as described previously [17].

2.4.3. Large Column Experiments

Three pairs of large columns (50 cm long filtration bed) were prepared for testing the sand as well as the sand–raw and sand–activated hydrochar mixtures. The columns were subjected to intermittent daily flushings with E. coli-seeded AGW for 30 days. For each week, five consecutive daily flushings were performed, and 2 days of pause were given. This flushing regime was designed to give four sets of 24 h idle time (in the first 5 days of each week) and one set of 72 h idle time per week. For each flushing experiment, 1 L influent (~2 PV, calculated from the chloride tracer test, data not shown) was flushed into each column, and the effluent was sampled for every 100 mL.
During the flushing, the first PV of the influent expelled the residual pore water stored in the column media from the previous flushing experiment, and the second PV was stored in the column media until the next flushing. It is considered that the first five effluent samples reflect the effect of idle time in E. coli attenuation. The following five effluent samples represented the direct E. coli removal that occurred when passing through the column bed. One-way ANOVA and Tukey’s test (p < 0.05) were used to verify the statistical differences of the results from the three types of setup. The statistical analyses were carried out using IBM SPSS Statistics for Windows Version 22.0 released 2013 (Armonk, NY, USA).

3. Results

3.1. Material Characterization

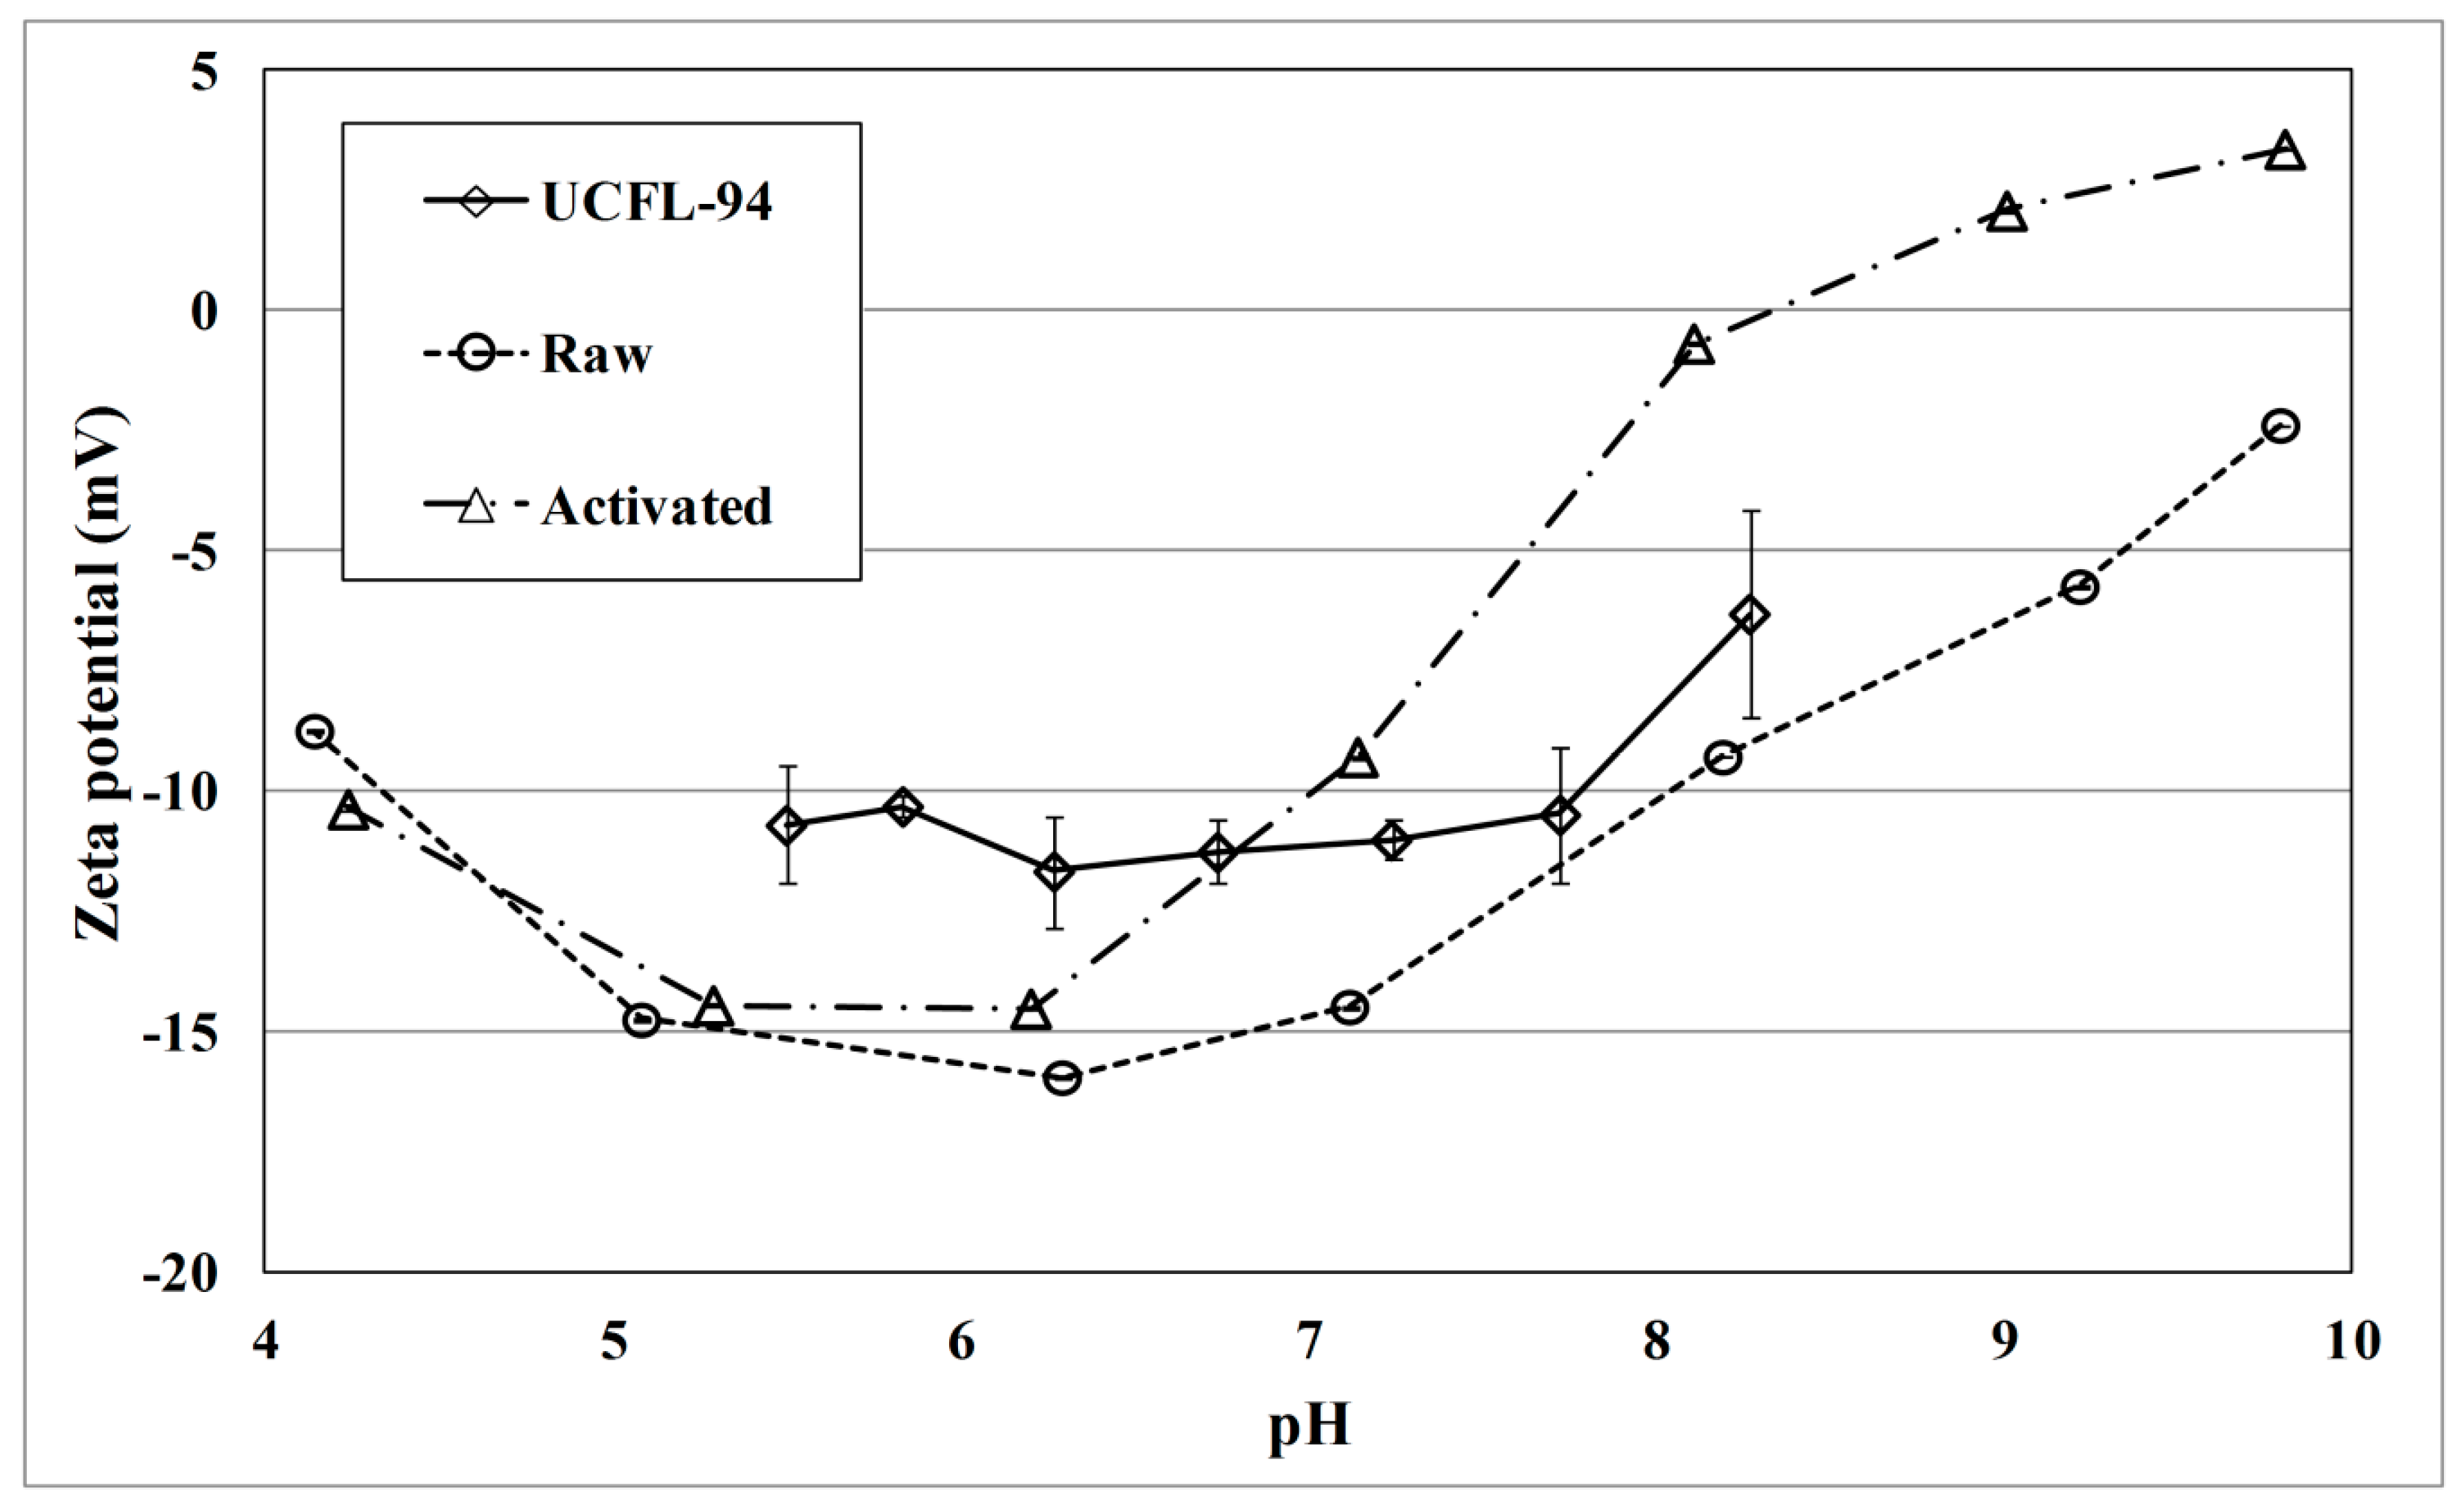
3.1.1. Zeta Potential

The zeta potential assessment performed on the test E. coli strain UCFL-94, raw, and activated hydrochar used in the column experiments showed negative values in the pH range of 6.6–6.8 (Figure 1). The zeta potential of raw hydrochar was slightly increased by KOH activation from −15 mV to −13 mV. Also, a negative zeta potential of −11 mV was measured for the E. coli UCFL-94 suspension.

3.1.2. Elemental Composition

Table 1 shows the elemental composition of both hydrochar samples obtained from the analyses using XRF and a TruSpec analyzer. The KOH activation increased the potassium (K) content by 0.4%, which supports the association of K on the surface of raw hydrochar. It was speculated that the increase in iron (Fe), Magnesium (Mg), and calcium (Ca) content was derived from impurities of the KOH reagent used for the activation, and/or due to an increase in relative concentration due to the loss of other elements. The decreases in aluminium (Al) and phosphorous (P) contents resulted from the washing out during the activation process. The alterations in the constitution of the carbon (C), hydrogen (H), Nitrogen (N), and oxygen (O) contents were considered insignificant.

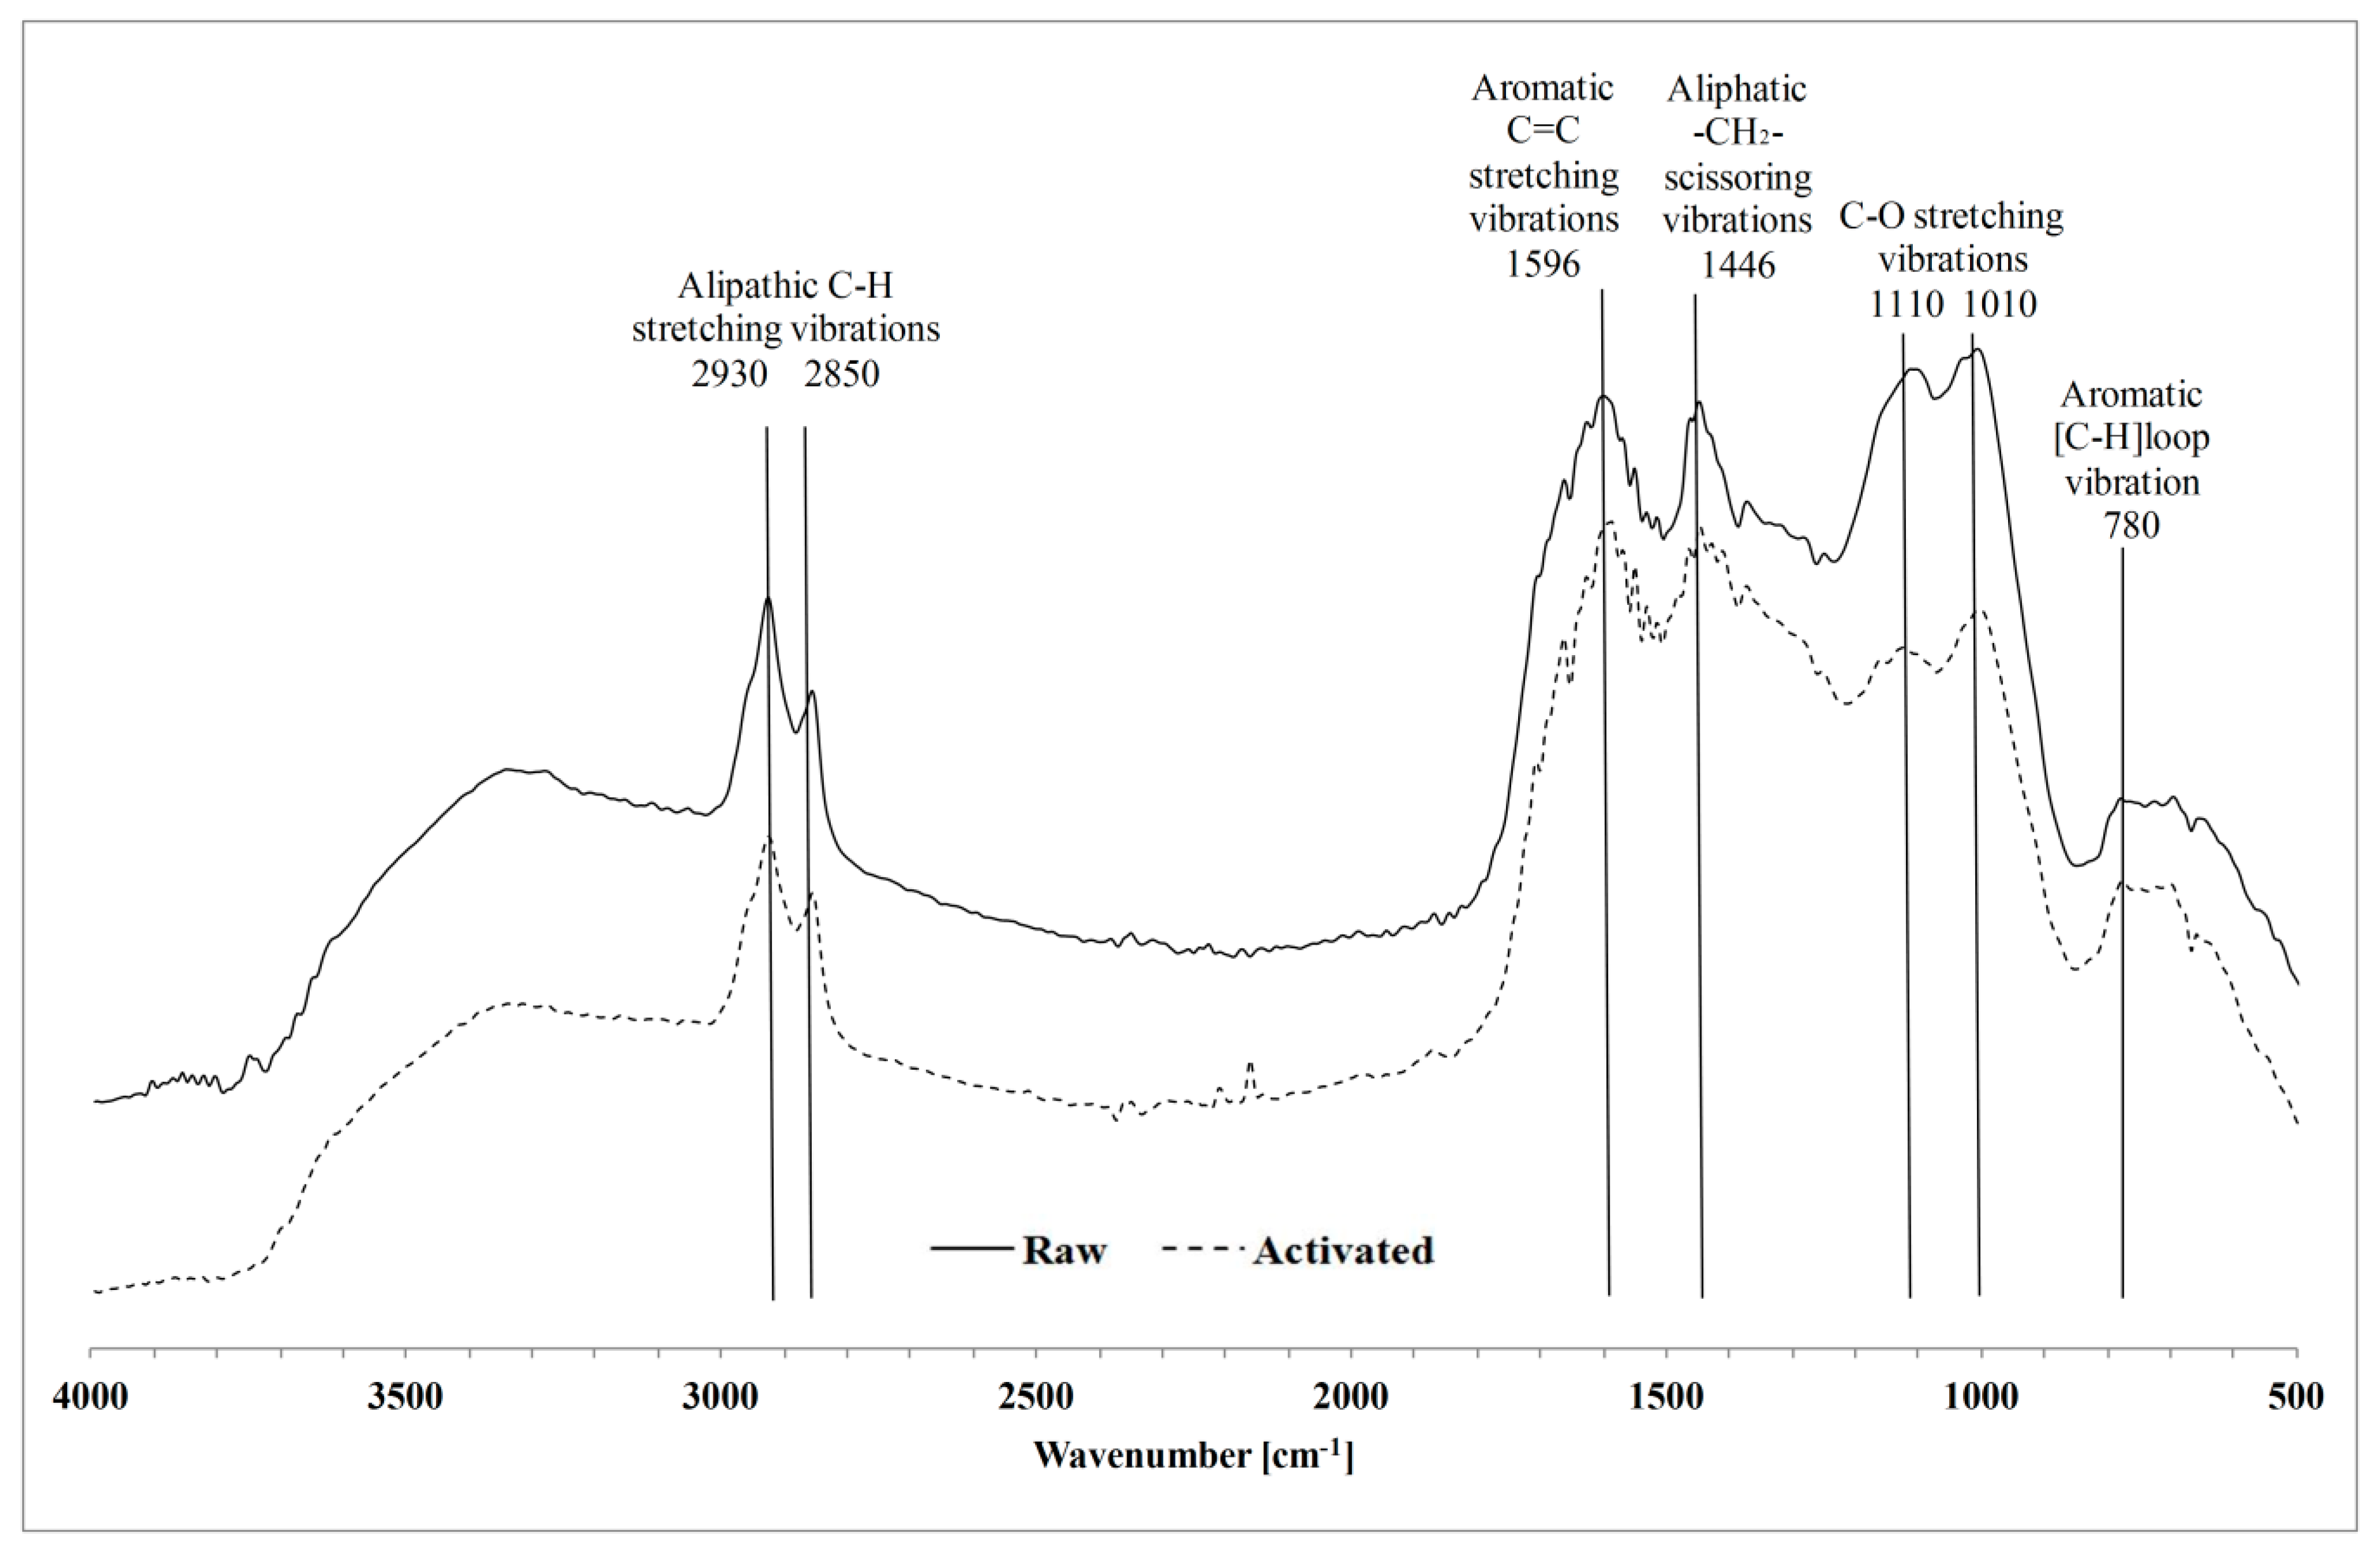
3.1.3. Surface Functional Groups

The qualitative composition of surface functional groups was not significantly altered by the KOH activation. The raw and activated hydrochar samples showed similar peaks in the FTIR-PAS analyses (Figure 2). The spectra in the region between 1700 and 1300 cm−1 and the bands at 3800 cm−1 were assigned to the residual water content in the hydrochar samples. The bands in the range of 2930–2850 cm−1 corresponded to aliphatic C-H stretching vibrations [24,25,26]. The bands at 1600 and 1446 cm−1 referred to aromatic C=C stretching vibrations [26,27] and aliphatic CH2 scissoring vibrations [28,29], respectively. A modest vibration shift was observed from the bands in the range of 1446–1400 cm−1 of the activated hydrochar samples. This referred to the deprotonation of the OH at the surface of hydrochar. Te bands in the 1110–1010 cm−1 region were derived from O stretching vibrations [25,27,28]. The bands at 780 cm−1 was derived from out-of-plane bending vibrations of aromatic C-H bonds [24,26].

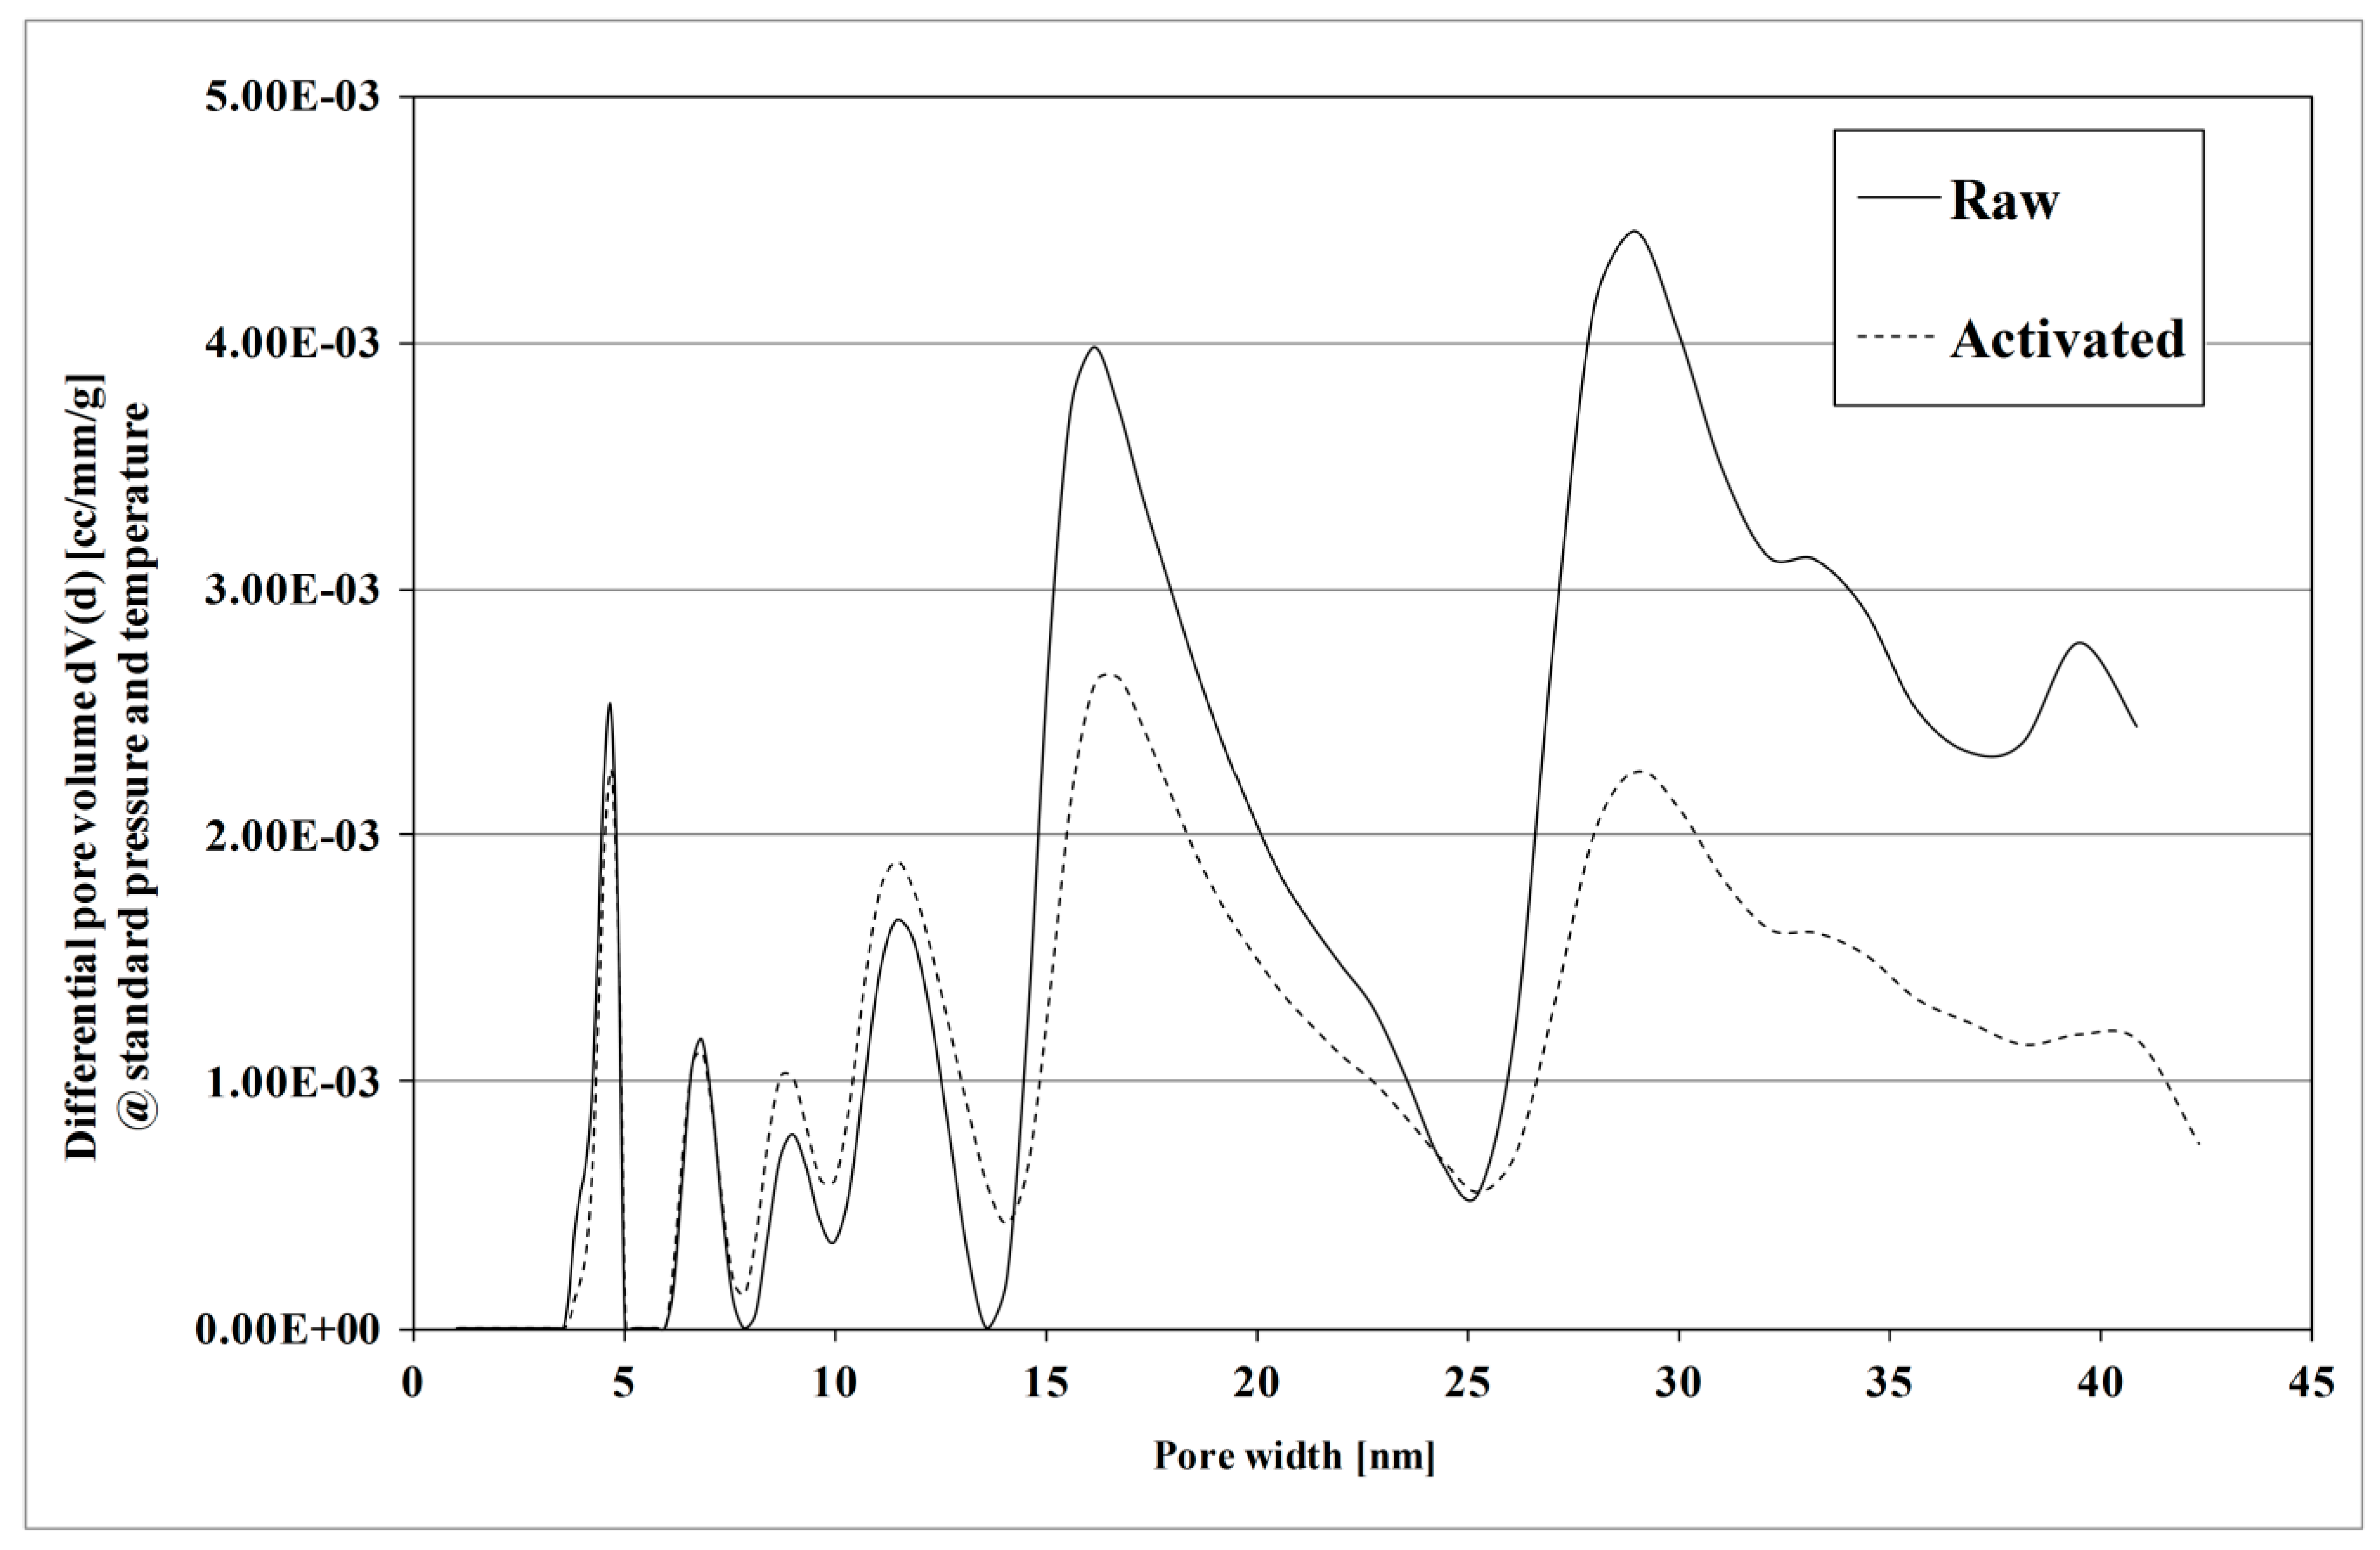
3.1.4. Specific Surface Area and Pore Size Distribution

The BET analysis performed on the raw and activated hydrochar showed a specific surface area of, respectively, 25.3 and 18.5 m2/g. Figure 3 shows the results of the QSDFT pore size (differential pore volume) distribution, which demonstrates the pore volume composition attributed to the specific pore widths. The pore volume derived from the micro and mesopore range was negligible. A clear decrease in the surface area derived from the KOH activation was observable in the pore fraction, with a size >15 nm.

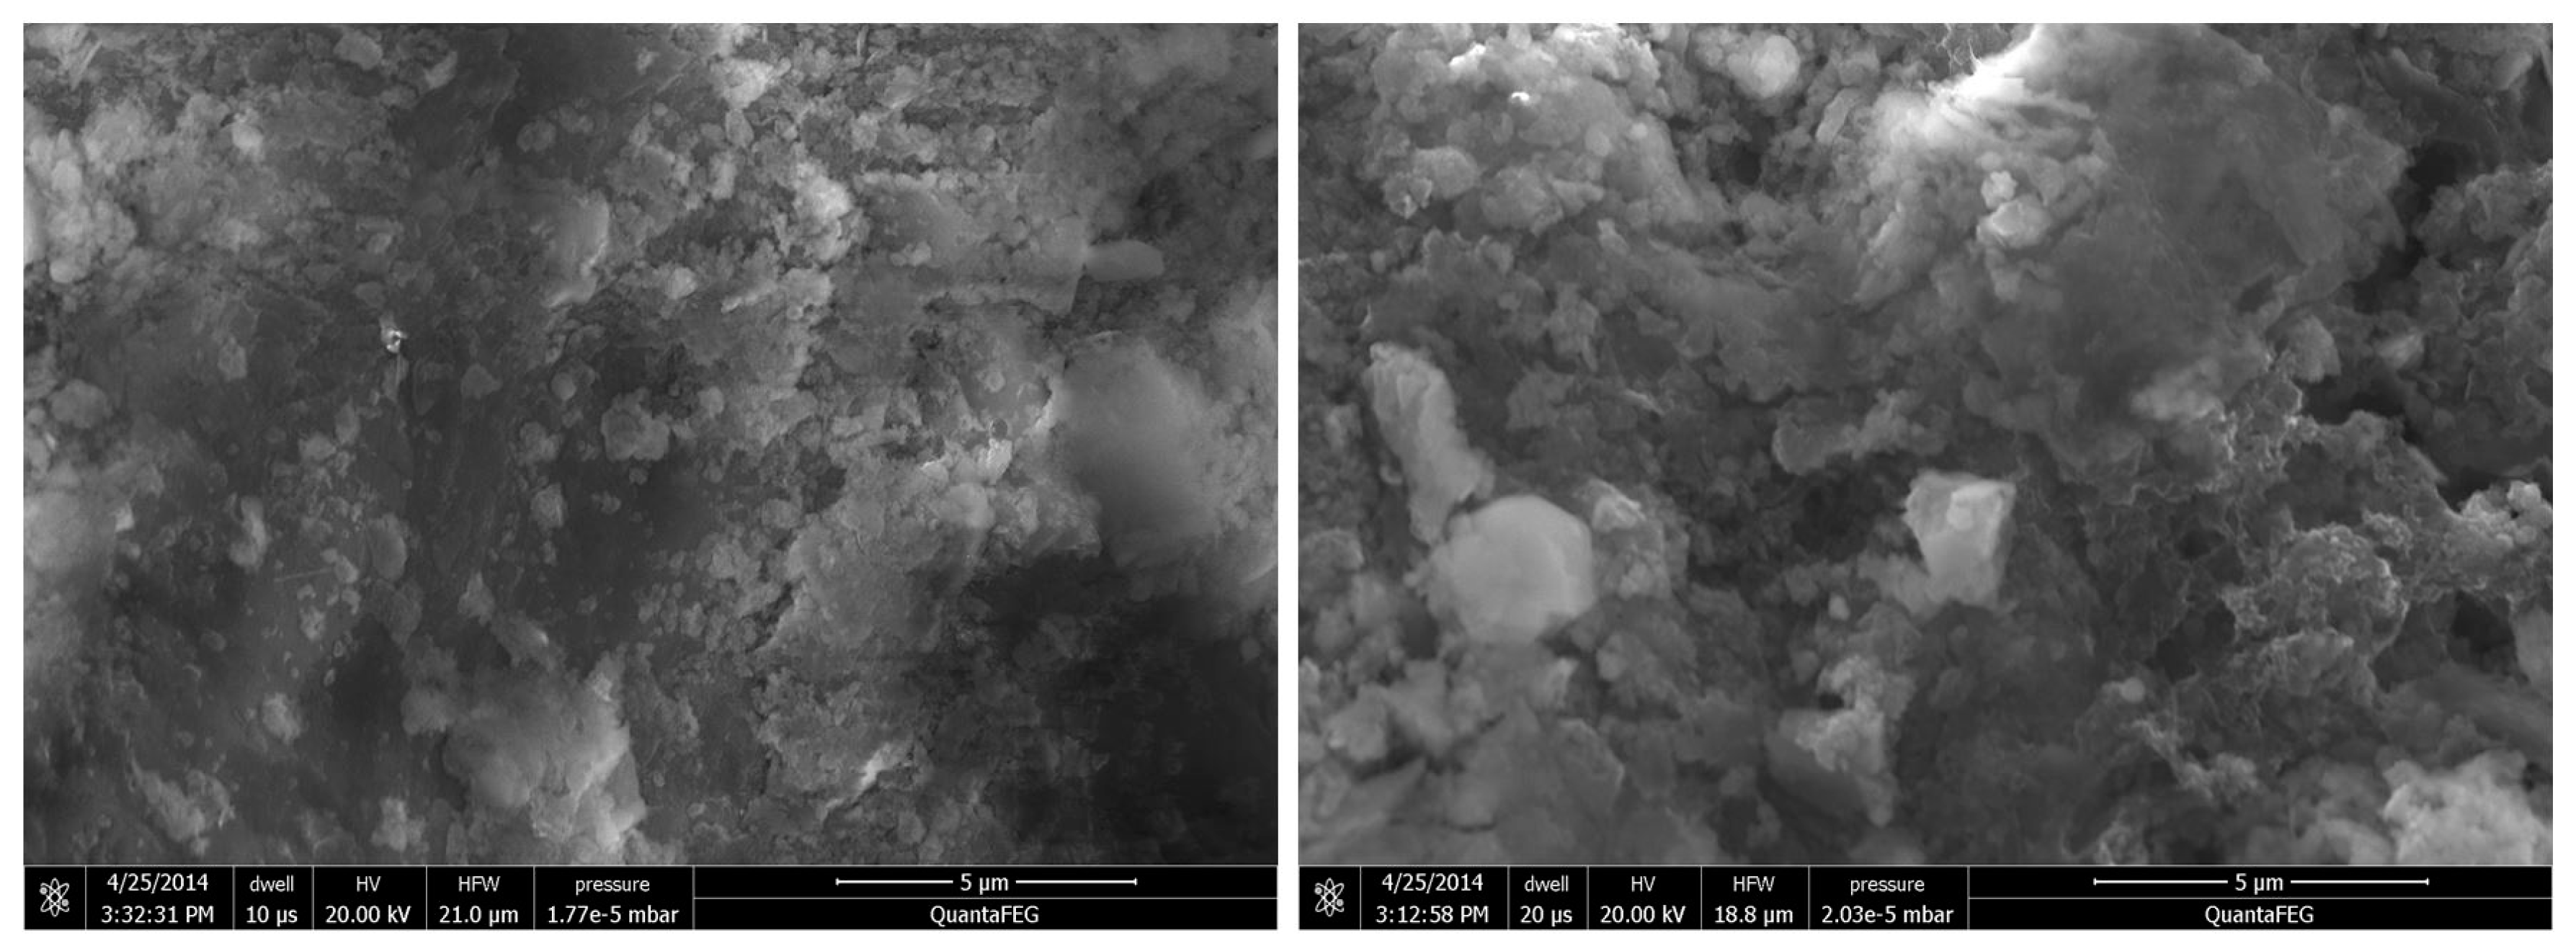
3.1.5. Surface Morphology

The SEM analyses for the raw and activated hydrochar samples were performed in order to investigate the morphological change derived from the KOH activation. The images from the SEM analyses indicated insignificant physical alterations (Figure 4). The surfaces of both types of hydrochar had a relatively rough structure, consisting of macropores (>50 nm) which could provide attachment sites for E. coli cells with a size of ~2 µm (measured by Zeta-sizer nano, Malvern, data not shown).

3.1.6. Hydrophobicity

The results from the contact angle measurements on the raw and activated hydrochar samples indicated that the surfaces of both materials had hydrophobic characteristics. The hydrophobicity of the raw hydrochar was increased by KOH activation. The contact angle values of the raw and activated hydrochar were 126.5° (±2.9) (average of triplicate ± standard deviation) and 135.4° (±4.7), respectively.

3.2. E. coli Flushing Test

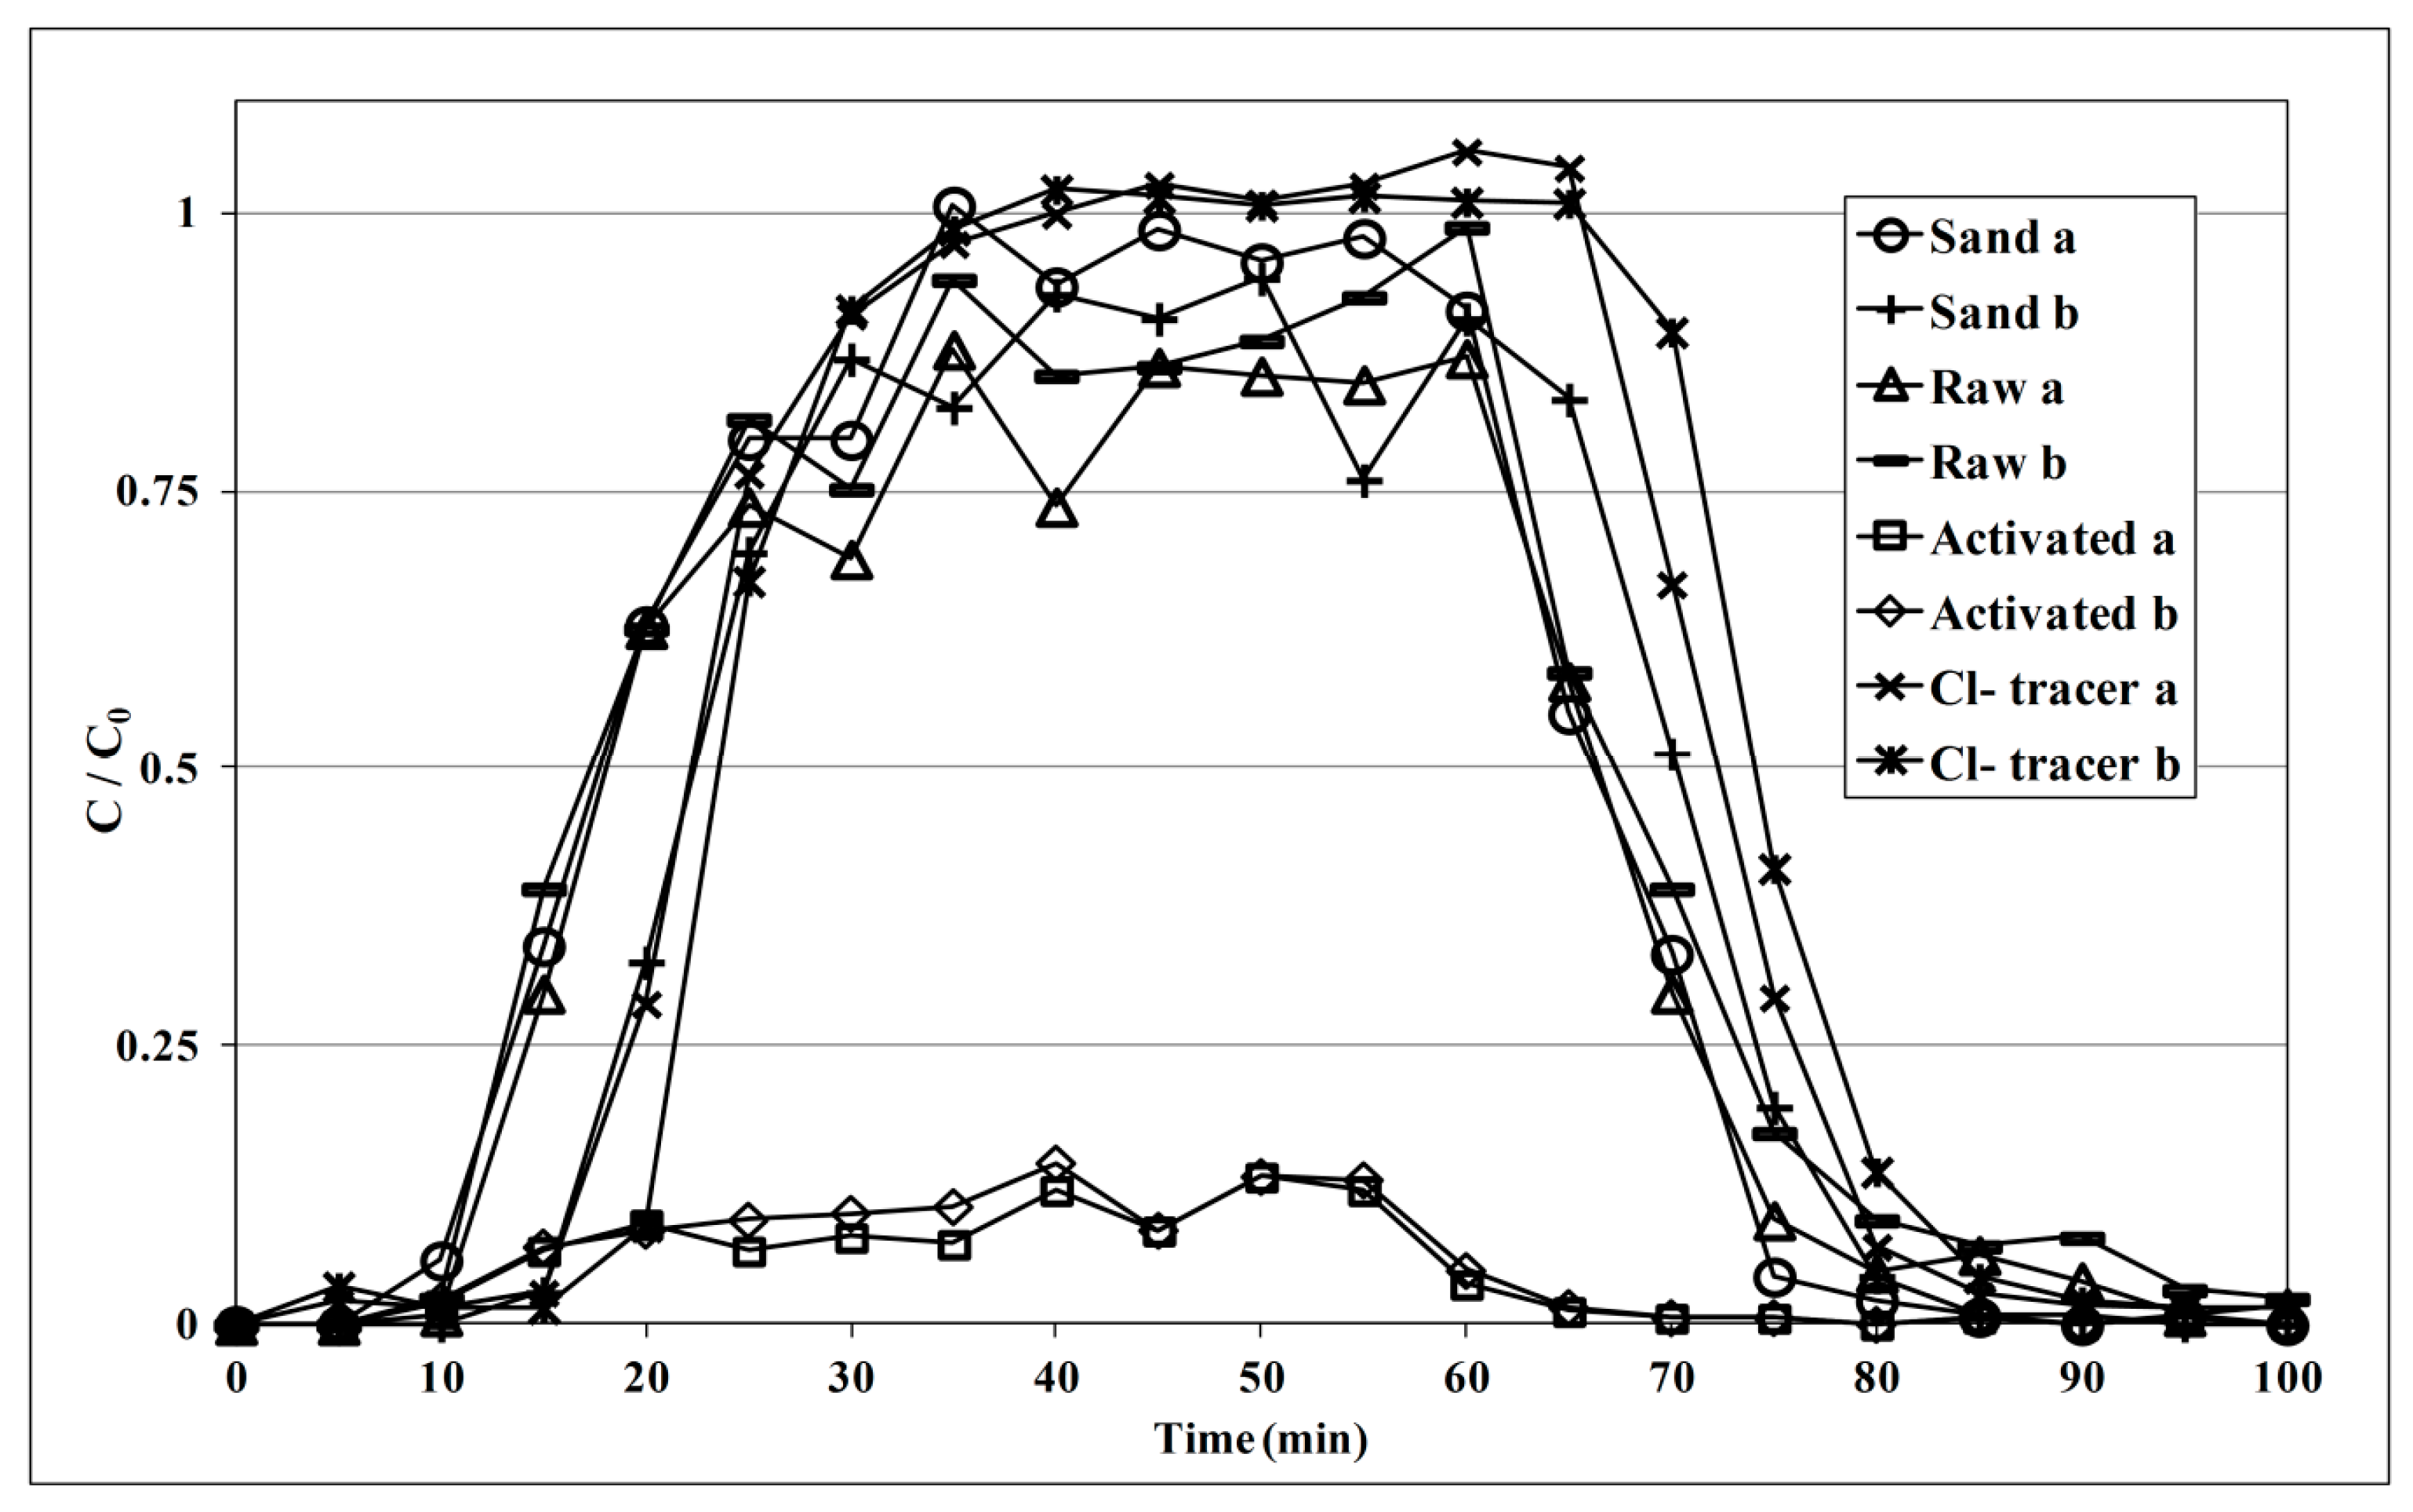
3.2.1. Breakthrough Analysis in Small Column Experiments

Figure 5 presents the BTCs obtained from the small column flushing experiments. All BTCs showed a clear pattern, consisting of a rising limb, a plateau phase, and a declining limb. The supplementation of raw hydrochar in the sand media resulted in early E. coli breakthrough. In contrast to the rising limb of the sand-only column observed after 15 min, the one from the raw hydrochar-amended column was observed already after 10 min. This was similar in the declining limbs: the one in the sand-only column started 5 min later than the column supplemented with the raw hydrochar. It was apparent that the decrease in the pore space of the sand media induced by the filling of pores by raw hydrochar amendment facilitated the E. coli transportation. While the effect of raw hydrochar addition in the sand media for the E. coli removal was insignificant, the amendments with the activated hydrochar showed an important increase in the removal efficiency. The C/C0 ratios in the plateau phase of both the sand-only and raw hydrochar-amended columns were similar at ~0.9. However, the C/C0 ratio of the sand column with the activated hydrochar supplement was only around 0.1. The average E. coli removal efficiencies of the sand and the raw and activated hydrochar-supplemented columns were 9.2%, 9.6%, and 90.1%, respectively. The measurements on the vertical hydrochar distribution in the column showed no significant migration of hydrochar particles during the flushing.

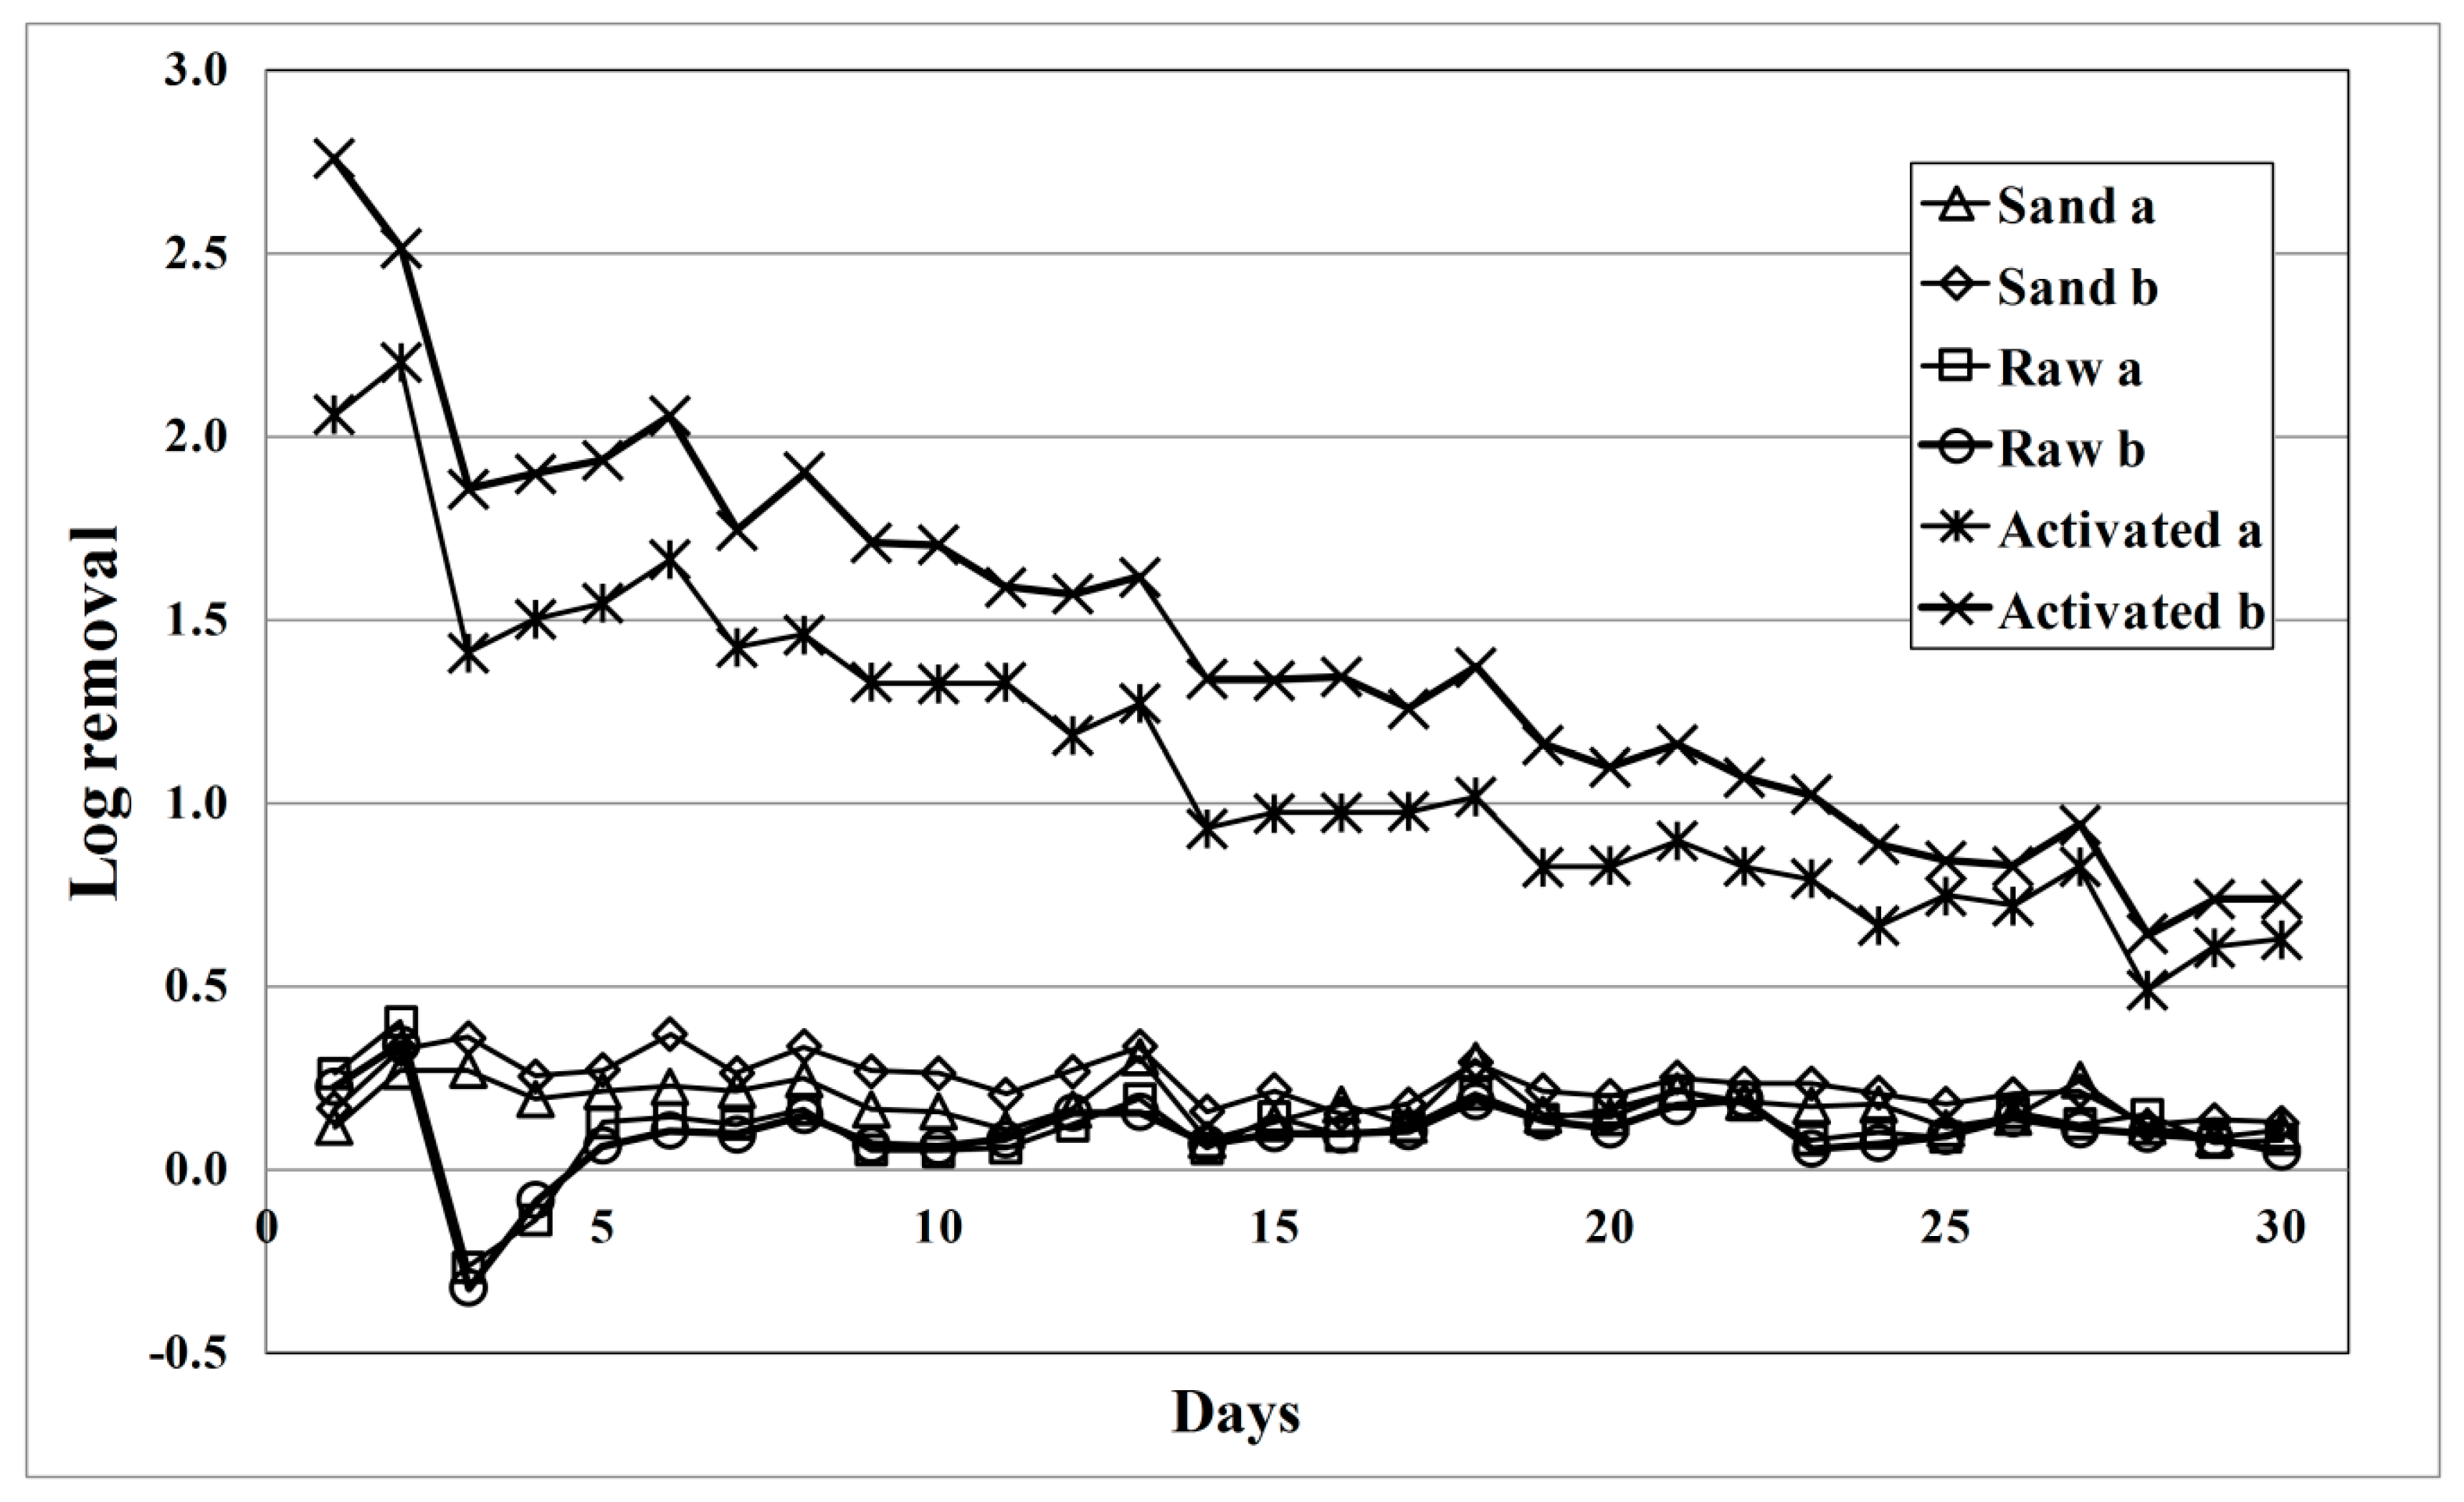
3.2.2. E. coli Removal Efficiency in Large Column Experiments

Figure 6 illustrates the E. coli removal efficiencies of the sand and raw and activated hydrochar-amended columns during the 30 days of experiments with intermittent operation. Similar to the results from the small column experiments, only the activated hydrochar amendment was effective at E. coli removal. The removal efficiency of the activated hydrochar-amended column was the highest (99.7%) on the first day, and declined gently until the last day of the experiment (78.9%). The sand-only and raw hydrochar-amended columns showed a comparable E. coli removal performance, in the range of 11.4–57.2%. Table 2 summarizes the overall E. coli removal efficiencies and the effect of the idle time during the large column experiments. Under all experimental conditions applied, the activated hydrochar-amended columns showed greater E. coli removal performances than the other columns. During 30 days of operation, the sand columns with activated hydrochar supplements showed an average total E. coli removal efficiency of 91.2%. In contrast, the sand-only and raw hydrochar-supplemented columns showed an average total E. coli removal efficiency of only 24.4% and 36.5%, respectively. The effect of the idle time on the E. coli removal was only observed in the sand-only columns; throughout the experimental period, the removal in the first PV was significantly greater than that of the second PV. The E. coli removal efficiency in the second PV, which represents the direct removal of E. coli when passing through the column media, was 17.2%. In contrast, the removal efficiencies in the first PV (stored in the sand media for 24 or 72 h and thus representing the effect of the idle time) were 52.1% and 66.9%, respectively. Throughout the experiments, the idle time had no clear effect on the E. coli removal performance of both types of hydrochar amendments, except for the 72 h idle time applied to the raw hydrochar-amended columns. Such an extended idle time increased the E. coli removal efficiency by 14.8%. The direct removal of E. coli (without idle time) was similar, at ~19% in the second PV in the sand-only and raw hydrochar-amended columns. This indicates a close correspondence with the results from the small column experiments.

4. Discussion

4.1. Effect of KOH Activation of Hydrochar on E. coli Removal

The performance of an adsorbent mainly depends on its surface, which provides internal pore structure and adsorptive sites [30]. Several attractive or repulsive forces between E. coli cells and the adsorbent surface regulate their mutual interaction [31]. Considering the characteristics of E. coli, the adsorptive removal will be facilitated when the adsorbent possesses a highly porous surface with a positive (less negative) surface charge and hydrophobic properties. It has been reported that the KOH activation of hydrochars derived from plant materials increased the surface roughness, resulting in enhanced heavy metal or E. coli removal from artificially contaminated influents [17,19]. However, the BET and SEM analyses carried out in this research could not explain the improvement in E. coli removal efficiency induced by the KOH activation. The modification in the surface morphology of the hydrochar by the KOH treatment was insignificant (Figure 4). Moreover, the specific surface area of the activated hydrochar was 27% less than that of the raw hydrochar (See Section 3.1.4).
A possible explanation for the decrease in the specific surface area derived from the KOH activation and subsequent washing processes can be the collapse of micro and mesopores, resulting in the development of a macroporous structure on the hydrochar surface. However, a large surface area of an adsorbent, mainly consisting of micro (<2 nm) and mesopores (2–50 nm), may not be a direct indicator for efficient E. coli removal, considering the size E. coli cells (~2 µm). Further investigations on the surface area and surface properties of the macropores are thus recommended in order to obtain a better understanding of the E. coli removal mechanisms by (KOH treated) biochar.
Because the investigations carried out to compare the characteristics of raw and activated hydrochar showed only minor differences, the improved E. coli removal performance obtained from the KOH activation could result from the increase in hydrophobicity of the hydrochar surface, which enforces the hydrophobic attraction. Hydrochar consists of a hydrophobic core and a hydrophilic outer surface [26,32]. The KOH activation carried out in this research would have brought more hydrophobic surfaces into contact with E. coli cells by removing the hydrophilic surface coatings formed by recondensation and repolymerization of water-soluble substances during the HTC process [27]. Another possible explanation for the advantageous effect of KOH activation can be an increase in the surface charge of the hydrochar, which would have weakened the electrostatic repulsion between E. coli cells and hydrochar surfaces.

4.2. Effect of Idling Time on E. coli Removal Efficiency

Previous research on slow-sand filtration units under intermittent operation reported a significant contribution of the idle time to the removal efficiency of bacteria [33]. The observations in this research on the effect of the idle time in the large sand column correspond well with these studies (Table 2). During the pause between daily flushing, bacterial surrogates residing in the sand bed were attenuated.
A more recent research [34] reported an important observation that the activities of the microbial community in the sand bed were more responsible for the viral attenuation than the physico-chemical processes. The attenuation of bacteriophages during the idle time increased along with the maturation of the filter bed, while the filters that operated under the suppression of microbial activities did not show any significant attenuation [34]. This may, however, not explain our results, because the bactericidal effect of the idle time observed in this research already existed from the first batch of the intermittent operation, and it was maintained at a comparable level throughout the 30 days of experiments (Table 2). This discrepancy might be due to differences in experimental conditions such as the type of influent/test micro-organisms, the size of sand grains, or the presence of standing water for oxygen infiltration into the filter bed.
Based on our observation, it could be speculated that the extended contact time between E. coli cells and sand surfaces provided more chances for bacterial attachment due to the motility of E. coli cells [35] or Brownian diffusion [36]. In contrast, the advantageous effect of the idle time on E. coli removal was negligible when either raw or activated hydrochar was supplemented in the sand bed. The provision of carbonaceous surfaces in the sand medium could have induced more desirable conditions for E. coli survival, by providing extra nutrients and more protection against external stress factors [37,38,39,40]. In order to clarify the E. coli inactivation mechanism during the idle time, more investigations on E. coli–surface interactions under static conditions are recommended.

4.3. Potential of HTC-Sand Filters for Pathogen Removal

Potable water can be provided either by centralized water treatment and supply systems or by decentralized (point-of-use) technologies that are installed on a house. Decentralized technologies have been recognized as appropriate options for poor rural communities. Biosand filters (BSF) are an example of a point-of-use technology that have been applied in developing countries [41]. Since the formation of a biofilm layer (Schmutzdecke) in a BSF plays a key role in removing microbial agents, insufficient pathogen removal during the startup (ripening) period is one of the main limitations of BSF. Previous research on BSF reported only 60–70% of E. coli removal during the ripening period, i.e., the first 3 weeks of operation [33,42]. Considering the superior E. coli removal efficiency (96.5%) in the same period, amendments of activated hydrochar to the sand bed would be an attractive option to overcome the inferior performance of BSF during the startup period. Since the experimental conditions employed in this research differed from the general BSF design and operational parameters, extrapolation of the results of this research to supplementation of BSF setups with hydrochar needs to be done carefully. Accordingly, it is recommended to perform more experiments employing (i) smaller sand grain sizes (<0.7mm), (ii) standing heads for ensuring sufficient oxygen supplementation, and (iii) influents with a higher microbial heterogeneity than that of the AGW used in this study, e.g., surface water from lakes, rivers, or canals [43,44].
Though it is reported that hydrothermal treatment decreased the environmental risk of abiotic contaminants, such as heavy metals and pharmaceuticals embedded in sewage sludge [45,46], the release of these contaminants from hydrochar has not yet been investigated. In case the hydrochar contains considerable amounts of these undesirable compounds, long-term monitoring on the effluent quality is recommended prior to the practical implementation of BSF supplemented with the hydrochar adsorbent. The properties of hydrochar are largely determined by parameters such as reaction temperature, time, and pressure, as well as catalyst and feedstock composition [1]. Further research on the optimization of these parameters can improve the stability of heavy metals in the hydrochar [45], and completely degrade the pharmaceutical residues during the hydrothermal treatment [46].

5. Conclusions

This research evaluated the use of hydrochar derived from stabilized sewage sludge as a low-cost adsorbent for pathogen removal in water treatment. The activation of hydrochar carried out at ambient temperatures using a strong alkaline solution increased the adsorptive performance of hydrochar by removing hydrophilic substances from the hydrochar surface, resulting in an increase in hydrophobicity of the biochar particles. Supplementation of activated hydrochar in a sand filtration unit (1.5%, w/w) with a 50 cm bed height yielded an E. coli removal efficiency exceeding 90% during 30 days of intermittent operation. Pathogen removal based on the use of hydrochar is a new concept which has not been extensively studied. Its practical implementation in developing countries still requires follow up investigations on the optimization of the process parameters and the durability of the filtration unit.

Acknowledgments

This research was funded by the Korean Church of Brussels, Mangu Jeja Church (Seoul, Korea), and the Netherlands Ministry of Development Cooperation (DGIS) through the UNESCO-IHE Partnership Research Fund. It was carried out in the framework of the research project ‘Addressing the Sanitation Crisis in Unsewered Slum Areas of African Mega-cities’ (SCUSA).

Author Contributions

Jae Wook Chung, Jan Willem Foppen, and Piet Nicolaas Luc Lens conceived and designed the experiments; Oghosa Charles Edewi performed the experiments; Jae Wook Chung and Oghosa Charles Edewi analyzed the data; Gabriel Gerner and Rolf Krebs contributed materials and analysis tools; Jae Wook Chung put together the initial drafts and finalized the paper.

Conflicts of Interest

The authors declare no conflict of interest.

References

  1. Libra, J.A.; Ro, K.S.; Kammann, C.; Funke, A.; Berge, N.D.; Neubauer, Y.; Titirici, M.M.; Fühner, C.; Bens, O.; Kern, J.; et al. Hydrothermal carbonization of biomass residuals: A comparative review of the chemistry, processes and applications of wet and dry pyrolysis. Biofuels 2011, 2, 71–106. [Google Scholar] [CrossRef]
  2. Titirici, M.-M.; White, R.J.; Falco, C.; Sevilla, M. Black perspectives for a green future: Hydrothermal carbons for environment protection and energy storage. Energy Environ. Sci. 2012, 5, 6796–6822. [Google Scholar] [CrossRef]
  3. Funke, A.; Ziegler, F. Hydrothermal carbonization of biomass: A summary and discussion of chemical mechanisms for process engineering. Biofuels Bioprod. Biorefin. 2010, 4, 160–177. [Google Scholar] [CrossRef]
  4. Lu, X.; Jordan, B.; Berge, N.D. Thermal conversion of municipal solid waste via hydrothermal carbonization: Comparison of carbonization products to products from current waste management techniques. Waste Manag. 2012, 32, 1353–1365. [Google Scholar] [CrossRef] [PubMed]
  5. Nizamuddin, S.; Jayakumar, N.S.; Sahu, J.N.; Ganesan, P.; Bhutto, A.W.; Mubarak, N.M. Hydrothermal carbonization of oil palm shell. Korean J. Chem. Eng. 2015, 32, 1789–1797. [Google Scholar] [CrossRef]
  6. Erdogan, E.; Atila, B.; Mumme, J.; Reza, M.T.; Toptas, A.; Elibol, M.; Yanik, J. Characterization of products from hydrothermal carbonization of orange pomace including anaerobic digestibility of process liquor. Bioresour. Technol. 2015, 196, 35–42. [Google Scholar] [CrossRef] [PubMed]
  7. Islam, M.A.; Tan, I.A.W.; Benhouria, A.; Asif, M.; Hameed, B.H. Mesoporous and adsorptive properties of palm date seed activated carbon prepared via sequential hydrothermal carbonization and sodium hydroxide activation. Chem. Eng. J. 2015, 270, 187–195. [Google Scholar] [CrossRef]
  8. Fytili, D.; Zabaniotou, A. Utilization of sewage sludge in eu application of old and new methods—A review. Renew. Sustain. Energy Rev. 2008, 12, 116–140. [Google Scholar] [CrossRef]
  9. Escala, M.; Zumbuhl, T.; Koller, C.; Junge, R.; Krebs, R. Hydrothermal carbonization as an energy-efficient alternative to established drying technologies for sewage sludge: A feasibility study on a laboratory scale. Energy Fuels 2013, 27, 454–460. [Google Scholar] [CrossRef]
  10. Danso-Boateng, E.; Shama, G.; Wheatley, A.D.; Martin, S.J.; Holdich, R.G. Hydrothermal carbonisation of sewage sludge: Effect of process conditions on product characteristics and methane production. Bioresour. Technol. 2015, 177, 318–327. [Google Scholar] [CrossRef] [PubMed]
  11. Wirth, B.; Reza, T.; Mumme, J. Influence of digestion temperature and organic loading rate on the continuous anaerobic treatment of process liquor from hydrothermal carbonization of sewage sludge. Bioresour. Technol. 2015, 198, 215–222. [Google Scholar] [CrossRef] [PubMed]
  12. Smith, K.M.; Fowler, G.D.; Pullket, S.; Graham, N.J.D. Sewage sludge-based adsorbents: A review of their production, properties and use in water treatment applications. Water Res. 2009, 43, 2569–2594. [Google Scholar] [CrossRef] [PubMed]
  13. Alatalo, S.M.; Repo, E.; Makila, E.; Salonen, J.; Vakkilainen, E.; Sillanpaa, M. Adsorption behavior of hydrothermally treated municipal sludge & pulp and paper industry sludge. Bioresour. Technol. 2013, 147, 71–76. [Google Scholar] [PubMed]
  14. Spataru, A. The Use of Hydrochar as a Low Cost Adsorbent for Heavy Metal and Phosphate Removal from Wastewater. Master’s Thesis, UNESCO-IHE, Delft, The Netherlands, 2014. [Google Scholar]
  15. Chung, J.W.; Foppen, J.W.; Gerner, G.; Krebs, R.; Lens, P.N.L. Removal of rotavirus and adenovirus from artificial ground water using hydrochar derived from sewage sludge. J. Appl. Microbiol. 2015, 119, 876–884. [Google Scholar] [CrossRef] [PubMed]
  16. Lutterodt, G.; Basnet, M.; Foppen, J.W.A.; Uhlenbrook, S. Determining minimum sticking efficiencies of six environmental Escherichia coli isolates. J. Contam. Hydrol. 2009, 110, 110–117. [Google Scholar] [CrossRef] [PubMed]
  17. Chung, J.W.; Foppen, J.W.; Izquierdo, M.; Lens, P.N.L. Removal of Escherichia coli from saturated sand columns supplemented with hydrochar produced from maize. J. Environ. Qual. 2014, 43, 2096–2103. [Google Scholar] [CrossRef] [PubMed]
  18. APHA. Standard Methods for the Examination of Water and Wastewater, 20th ed.; American Public Health Association: Washington, DC, USA, 1998. [Google Scholar]
  19. Regmi, P.; Moscoso, J.L.G.; Kumar, S.; Cao, X.Y.; Mao, J.D.; Schafran, G. Removal of copper and cadmium from aqueous solution using switchgrass biochar produced via hydrothermal carbonization process. J. Environ. Manag. 2012, 109, 61–69. [Google Scholar] [CrossRef] [PubMed]
  20. Sun, K.J.; Tang, J.C.; Gong, Y.Y.; Zhang, H.R. Characterization of potassium hydroxide (koh) modified hydrochars from different feedstocks for enhanced removal of heavy metals from water. Environ. Sci. Pollut. Res. 2015, 22, 16640–16651. [Google Scholar] [CrossRef] [PubMed]
  21. Neimark, A.V.; Lin, Y.; Ravikovitch, P.I.; Thommes, M. Quenched solid density functional theory and pore size analysis of micro-mesoporous carbons. Carbon 2009, 47, 1617–1628. [Google Scholar] [CrossRef]
  22. Jeong, S.-B.; Yang, Y.-C.; Chae, Y.-B.; Kim, B.-G. Characteristics of the treated ground calcium carbonate powder with stearic acid using the dry process coating system. Mater. Trans. 2009, 50, 409–414. [Google Scholar] [CrossRef]
  23. Matthess, G.; Bedbur, E.; Gundermann, K.O.; Loof, M.; Peters, D. Investigation on filtration mechanisms of bacteria and organic particles in porous-media. I. Background and methods. Zentralblatt Fuer Hygiene Und Umweltmed. 1991, 191, 53–97. [Google Scholar]
  24. Baccile, N.; Weber, J.; Falco, C.; Titirici, M.-M. Characterization of hydrothermal carbonization materials. In Sustainable Carbon Materials from Hydrothermal Processes; John Wiley & Sons, Ltd.: Hoboken, NJ, USA, 2013; pp. 151–211. [Google Scholar]
  25. Parshetti, G.K.; Liu, Z.G.; Jain, A.; Srinivasan, M.P.; Balasubramanian, R. Hydrothermal carbonization of sewage sludge for energy production with coal. Fuel 2013, 111, 201–210. [Google Scholar] [CrossRef]
  26. Sevilla, M.; Fuertes, A.B. Chemical and structural properties of carbonaceous products obtained by hydrothermal carbonization of saccharides. Chem. Eur. J. 2009, 15, 4195–4203. [Google Scholar] [CrossRef] [PubMed]
  27. Kumar, S.; Loganathan, V.A.; Gupta, R.B.; Barnett, M.O. An assessment of u(vi) removal from groundwater using biochar produced from hydrothermal carbonization. J. Environ. Manag. 2011, 92, 2504–2512. [Google Scholar] [CrossRef] [PubMed]
  28. Bansal, R.C.; Goyal, M. Activated Carbon Adsorption; CRC Press, Taylor & Francis Group: Boca Raton, FL, USA, 2005; Volume 33487-2742, p. 33. [Google Scholar]
  29. Silverstein, R.M.; Webster, F.X.; Kiemle, D.J. Spectrometric Identification of Organic Compounds, 7th ed.; John Wiley & Sons: Hoboken, NJ, USA, 2005; Volume 07030-577, pp. 82–88. [Google Scholar]
  30. Unur, E. Functional nanoporous carbons from hydrothermally treated biomass for environmental purification. Microporous Mesoporous Mater. 2013, 168, 92–101. [Google Scholar] [CrossRef]
  31. Foppen, J.W.A.; Schijven, J.F. Evaluation of data from the literature on the transport and survival of Escherichia coli and thermotolerant coliforms in aquifers under saturated conditions. Water Res. 2006, 40, 401–426. [Google Scholar] [CrossRef] [PubMed]
  32. Jarrah, N.; van Ommen, J.G.; Lefferts, L. Development of monolith with a carbon-nanofiber-washcoat as a structured catalyst support in liquid phase. Catal. Today 2003, 79, 29–33. [Google Scholar] [CrossRef]
  33. Elliott, M.; Stauber, C.; Koksal, F.; DiGiano, F.; Sobsey, M. Reductions of E. Coli, echovirus type 12 and bacteriophages in an intermittently operated household-scale slow sand filter. Water Res. 2008, 42, 2662–2670. [Google Scholar] [CrossRef] [PubMed]
  34. Elliott, M.A.; DiGiano, F.A.; Sobsey, M.D. Virus attenuation by microbial mechanisms during the idle time of a household slow sand filter. Water Res. 2011, 45, 4092–4102. [Google Scholar] [CrossRef] [PubMed]
  35. Maeda, K.; Imae, Y.; Shioi, J.I.; Oosawa, F. Effect of temperature on motility and chemotaxis of Escherichia coli. J. Bacteriol. 1976, 127, 1039–1046. [Google Scholar] [PubMed]
  36. Li, G.; Tam, L.K.; Tang, J.X. Amplified effect of brownian motion in bacterial near-surface swimming. Proc. Natl. Acad. Sci. USA 2008, 105, 18355–18359. [Google Scholar] [CrossRef] [PubMed]
  37. Gerba, C.P.; Schaiberger, G.E. Effect of particulates on virus survival in seawater. J. Water Pollut. Control Federation 1975, 47, 93–103. [Google Scholar]
  38. Burton, G.A., Jr.; Gunnison, D.; Lanza, G.R. Survival of pathogenic bacteria in various freshwater sediments. Appl. Environ. Microbiol. 1987, 53, 633–638. [Google Scholar] [PubMed]
  39. Sherer, B.M.; Miner, J.R.; Moore, J.A.; Buckhouse, J.C. Indicator bacterial survival in stream sediments. J. Environ. Qual. 1992, 21, 591–595. [Google Scholar] [CrossRef]
  40. Howell, J.M.; Coyne, M.S.; Cornelius, P.L. Effect of sediment particle size and temperature on fecal bacteria mortality rates and the fecal coliform/fecal streptococci ratio. J. Environ. Qual. 1996, 25, 1216–1220. [Google Scholar] [CrossRef]
  41. Sobsey, M.D.; Stauber, C.E.; Casanova, L.M.; Brown, J.M.; Elliott, M.A. Point of use household drinking water filtration: A practical, effective solution for providing sustained access to safe drinking water in the developing world. Environ. Sci. Technol. 2008, 42, 4261–4267. [Google Scholar] [CrossRef] [PubMed]
  42. Stauber, C.E.; Elliott, M.A.; Koksal, F.; Ortiz, G.M.; DiGiano, F.A.; Sobsey, M.D. Characterisation of the biosand filter for E. coli reductions from household drinking water under controlled laboratory and field use conditions. Water Sci. Technol. 2006, 54, 1–7. [Google Scholar] [CrossRef] [PubMed]
  43. Chan, C.C.V.; Neufeld, K.; Cusworth, D.; Gavrilovic, S.; Ngai, T. Investigation of the effect of grain size, flow rate and diffuser design on the cawst biosand filter performance. Int. J. Serv. Learn. Eng. Humanit. Eng. Soc. Entrep. 2015, 10, 1–23. [Google Scholar]
  44. Buzunis, B.J. Intermittently operated slow sand filtration: A new water treatment process. In Civil Engineering; University of Calgary: Calgary, AB, Canada, 1995. [Google Scholar]
  45. Huang, H.J.; Yuan, X.Z. The migration and transformation behaviors of heavy metals during the hydrothermal treatment of sewage sludge. Bioresour. Technol. 2016, 200, 991–998. [Google Scholar] [CrossRef] [PubMed]
  46. vom Eyser, C.; Palmu, K.; Schmidt, T.C.; Tuerk, J. Pharmaceutical load in sewage sludge and biochar produced by hydrothermal carbonization. Sci. Total Environ. 2015, 537, 180–186. [Google Scholar] [CrossRef] [PubMed]
Figure 1. Zeta potential of the hydrochar and Escherichia coli strain over a function of pH. The lines represent the mean zeta potential value and error bars indicate the standard deviation.
Applsci 07 00839 g001
Figure 2. FTIR-PAS spectra of raw and activated hydrochar.
Applsci 07 00839 g002
Figure 3. Pore size distribution curves obtained from quench solid density functional theory (QSDFT) analysis.
Applsci 07 00839 g003
Figure 4. SEM images of raw (left) and activated (right) hydrochar.
Applsci 07 00839 g004
Figure 5. Breakthrough curves of E. coli from small column experiments carried out at a flow rate of 1 mL (0.20 cm)/min.
Applsci 07 00839 g005
Figure 6. E. coli removal efficiencies from large columns during 30 days of flushing with a flow rate of 33.3 mL (1.35 cm)/min.
Applsci 07 00839 g006
Table 1. Elemental composition (%) of hydrochar variants used in this study.
CHNOCaMgAlKFeP
Raw28.63.62.022.35.10.92.60.55.04.5
Activated29.43.71.921.15.81.02.00.95.52.6
Obtained from TruSpec analyzer (C, H, N, and O) or XRF (Ca, Mg, Al, K, Fe, and P).
Table 2. Removal efficiency (average% ± standard deviation) of E. coli in large column experiments during 30 days of intermittent flushing in duplicate columns of each treatment.
ContentPore VolumeTotal
FirstSecond
24 h idle72 h idle
Sand52.1 ± 13.3 (n = 46)66.9 ± 14.7 (n = 12)17.2 ± 8.64 § (n = 60)36.5 ± 10.1 (n = 60)
Raw23.0 ± 17.3 (n = 44)35.1 ± 12.9 (n = 10)20.0 ± 12.5 § † (n = 56)24.4 ± 10.5 (n = 56)
Activated92.8 ± 5.0 (n = 46)92.6 ± 8.0 (n = 12)90.0 ± 9.1 (n = 60)± 7.5 (n = 60)
Within each column, values followed by the symbol § are not significantly different using Tukey’s test at p < 0.05. Within each row, values followed by the same symbol or are not significantly different using Tukey’s test at p < 0.05.

