Article

Double-Sided Terahertz Imaging of Multilayered Glass Fiber-Reinforced Polymer

by
Przemyslaw Lopato
Department of Electrical and Computer Engineering, Faculty of Electrical Engineering, West Pomeranian University of Technology, 70-310 Szczecin, Poland
Appl. Sci. 2017, 7(7), 661; https://doi.org/10.3390/app7070661
Submission received: 8 June 2017 / Revised: 20 June 2017 / Accepted: 21 June 2017 / Published: 27 June 2017
(This article belongs to the Section Materials Science and Engineering)

Abstract

:
Polymer matrix composites (PMC) play important roles in modern industry. Increasing the number of such structures in aerospace, construction, and automotive applications enforces continuous monitoring of their condition. Nondestructive inspection of layered composite materials is much more complicated process than evaluation of homogenous, (mostly metallic) structures. Several nondestructive methods are utilized in this case (ultrasonics, shearography, tap testing, acoustic emission, digital radiography, infrared imaging) but none of them gives full description of evaluated structures. Thus, further development of NDT techniques should be studied. A pulsed terahertz method seems to be a good candidate for layered PMC inspection. It is based on picosecond electromagnetic pulses interacting with the evaluated structure. Differences of dielectric parameters enables detection of a particular layer in a layered material. In the case of multilayered structures, only layers close to surface can be detected. The response of deeper ones is averaged because of multiple reflections. In this paper a novel inspection procedure with a data processing algorithm is introduced. It is based on a double-sided measurement, acquired signal deconvolution, and data combining. In order to verify the application of the algorithm stress-subjected glass fiber-reinforced polymer (GFRP) was evaluated. The obtained results enabled detection and detailed analysis of delaminations introduced by stress treatment and proved the applicability of the proposed algorithm.

1. Introduction

A composite is a structure made of materials with different physical properties. When combined, a material with characteristics different from the individual components is obtained. The properties of the composite structure depend on the matrix and the reinforcement materials and their setups. Polymer matrix composites (PMC) play important roles in modern industry because of their high stiffness, corrosion resistance, and strength to weight ratio [1]. Increasing the number of such structures in aerospace, construction, and automotive applications, as well as in lightweight structures in the wind energy industry, enforces continuous monitoring of their condition. Due to high anisotropy, nondestructive inspection of layered composite materials is a much more complicated process than the evaluation of homogenous, (mostly metallic) structures [2,3,4,5,6,7,8]. Several nondestructive methods are utilized in this case (ultrasonics, shearography, tap testing, acoustic emission, digital radiography, infrared thermography) but none of them gives a full description of the evaluated structures. Thus, further development of NDT techniques should be studied.
The use of terahertz inspection of dielectric or semiconductive structures is attracting increasing attention in the research community and industry. Recently, various applications have been demonstrated by many research groups. Continuous-wave imaging (CW), frequency domain measurement using a vector network analyzer (VNA), and pulsed time domain spectroscopy (TDS) are utilized in this frequency range [9,10,11,12,13,14,15,16,17,18]. The first group of applications refers to spectroscopic evaluation of materials or potential inclusions compositions, i.e., polymer evaluation [16], drugs identification [19,20], explosives detection [19], biological tissue identification in the case of biotechnological and medical applications [21,22], hydration/moisture level determination [23,24], polymerization state monitoring [25], chemical mixtures evaluation [26], and determination of tea geographical origin [27]. The second group of applications refers to observations of the inner structure of an object under test (OUT), similar to ultrasonic testing or the pulsed ground penetrating radar (GPR) technique. In this case homogenous or layered dielectric materials are examined in order to detect irregularities or defects [14,15,28,29,30]. Non-conductive coatings of dielectric or conductive materials, as well, as layers thicknesses can be also evaluated [28]. In the case of integrated circuits the inner structure is monitored [31]. TDS is also utilized in order to evaluate the integrity of layered tablet structures. Another group of applications refers to terahertz tomographic imaging [32,33,34,35,36]. Tomography refers to the cross-sectional imaging of an object by measuring transmitted or/and reflected waves (ray). There are various terahertz imaging options: time of flight reflection tomography (THz ToFRT), diffraction tomography (THz DT), computed tomography (THz CT), tomography with a binary lens, and digital holography.
Continuous wave terahertz imaging [37,38,39] is a generally faster and less complicated technique compared to TDS. In this case the source (typically horn antenna, photoconductive antenna or far infrared laser) illuminates object under test and detector (photoconductive, pyroelectric, or bolometric) or a matrix of detectors receive the electromagnetic wave. In most cases this technique provides power or intensity information and phase data is not available. Higher power of sources and utilization of detector matrices enables inspection of thicker and bigger structures in comparison to TDS.
Main advantages associated with terahertz imaging technique are:
  • non-contact measurement in reflection and transmission arrangement;
  • non-ionizing nature;
  • inner structure and spectral information is obtainable; and
  • fraction of a millimeter resolution.
The main disadvantages of terahertz inspection are:
  • low power of THz emitters;
  • low speed of examination (need of raster scanning in case of VNA and TDS solutions);
  • restriction to nonconductive materials (because of high frequency and skin effect); and
  • high cost of VNA and TDS solutions.
A pulsed terahertz method seems to be a good candidate for layered PMC inspection. It is based on picosecond electromagnetic pulses interacting with evaluated structure. Differences of dielectric parameters enables the detection of particular layers in a layered material and any defect which disturbs the distribution of the refractive index, e.g., inclusion, delamination, void, material inhomogeneities (fiber/matrix distribution), and internal interfaces between layers (in layered structures).
In the case of multilayered structures, only layers close to the surface can be effectively detected. The response of deeper layers is averaged because of multiple reflections. In this paper a new inspection algorithm based on double-sided measurement, acquired signal deconvolution, and data combining based on weighting functions is proposed. In order to verify the application of algorithm stress subjected glass fiber reinforced polymer (GFRP) was evaluated. Obtained results enabled detection and detailed analysis of delaminations introduced by stress treatment and proved the applicability of the proposed algorithm.

2. Materials and Methods

2.1. Pulsed Terahertz Measuring System

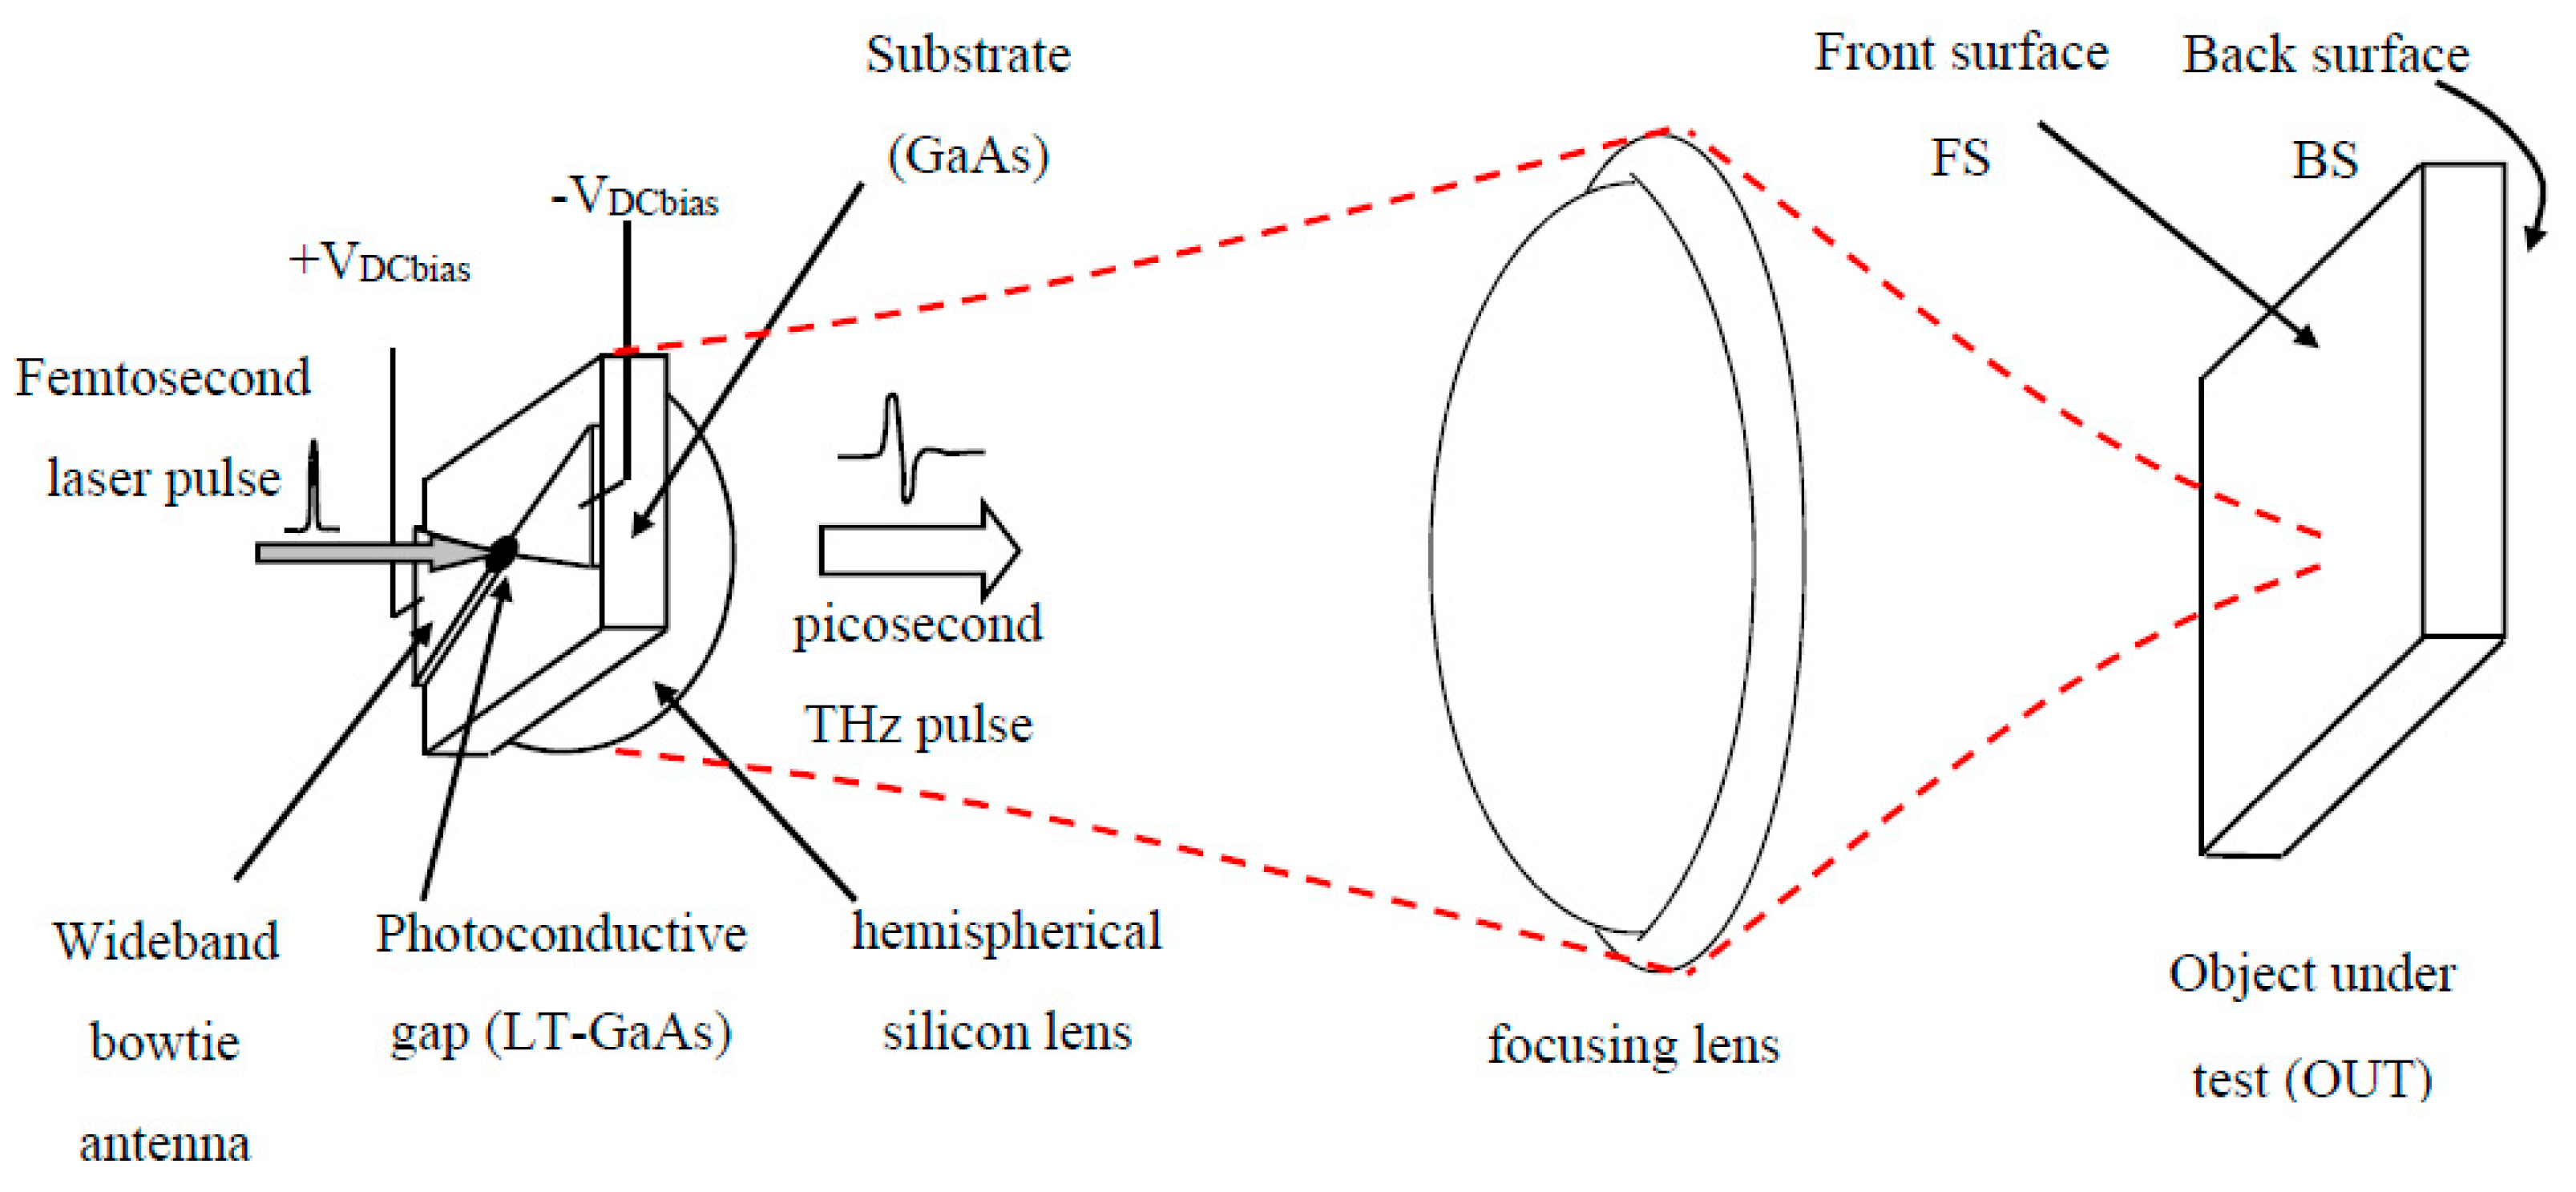
The imaging device utilized in this work is presented in Figure 1. It is a pulsed terahertz system (TDS) based on Tray-4000 spectroscope of Picometrix (Ann Arbor, MI, USA). The main elements of the system are: a photoconductive transmitter and receiver, optical delay line, and femtosecond laser. As shown in Figure 1 and Figure 2, measuring heads operate in reflection mode. The THz transmitter (based on a bowtie antenna with photoconductive gap, Figure 2) is excited by the femtosecond laser pulses. This causes a pulsed flow of antenna current resulting in electromagnetic wave induction. The terahertz wave generated by the bowtie antenna is collimated by a hemispherical silicon lens and focused in the vicinity of the imaged structure surface by a plano-convex dielectric lens. This electromagnetic pulse is partly transmitted through the examined object and partly reflected. In the presented setup the reflected field is detected by the receiving antenna. Based on the measured time domain response it is possible to gain information about the internal structure of the object under test (similar to ultrasonic testing or sonar/radar applications).
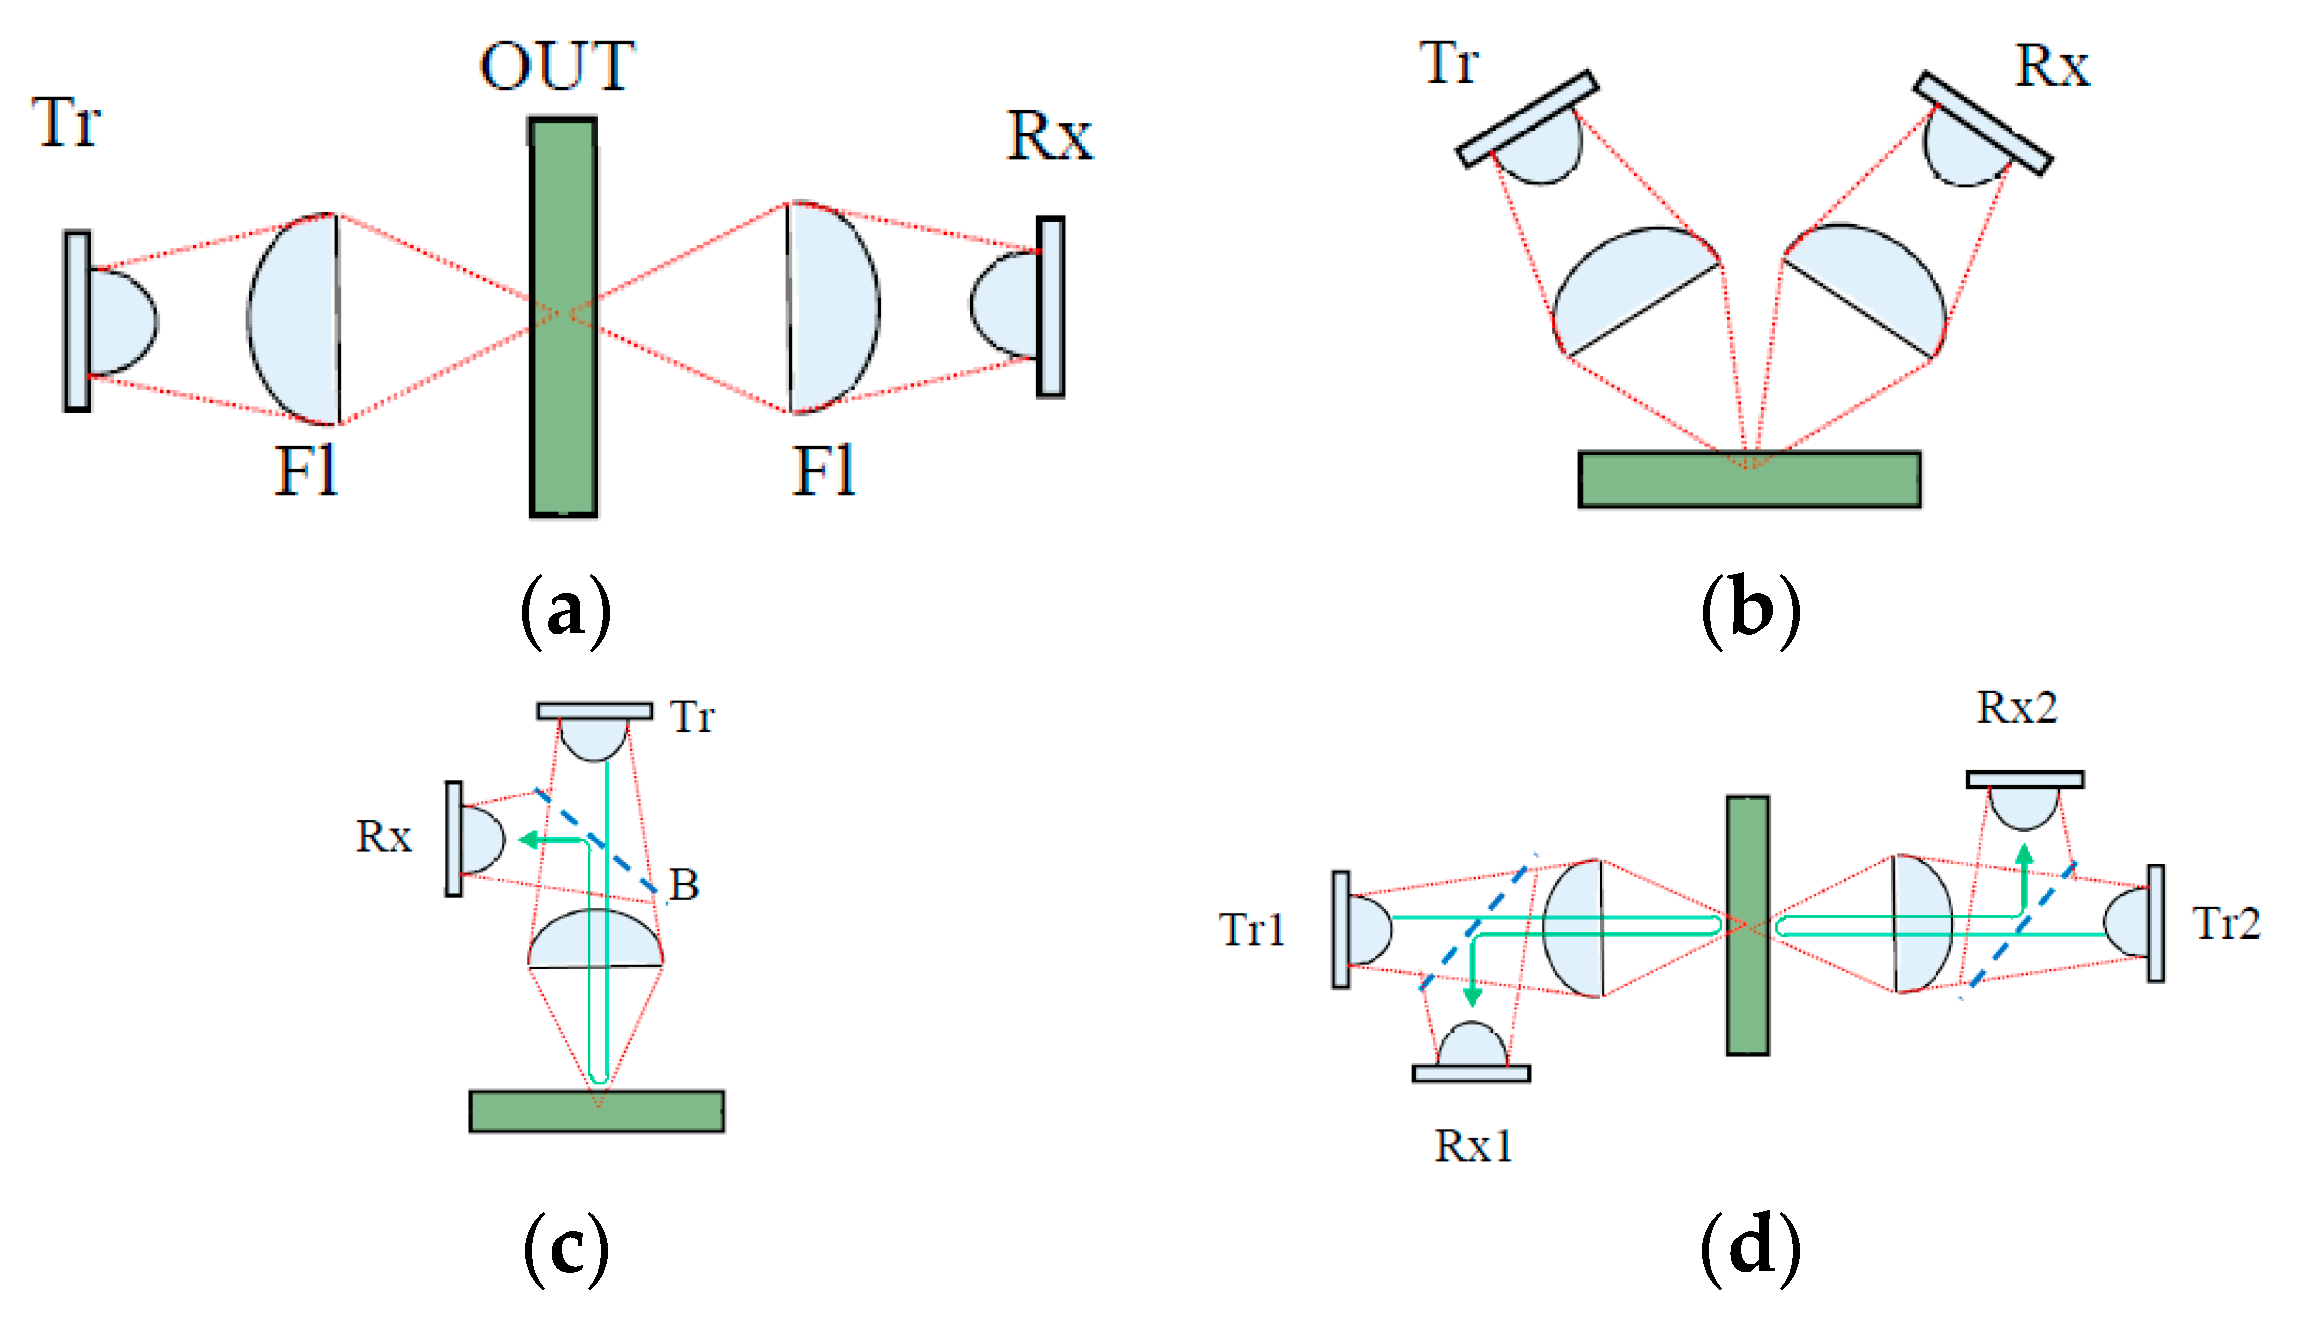
The transmission setup shown in Figure 3a is utilized if there is an access to both sides of evaluated structure. This restriction is no longer valid in case of reflection arrangements presented in Figure 3b,c. The “V” setup provides a relatively high signal to noise ratio (SNR), but because of the high number of degrees of freedom, accurate arrangement can be problematic, especially for long focal lengths of focusing lenses and significant changes of lift-off distance within a single imaging procedure. The reflection setup with the beam splitter enables a less complex setup and the direction of THz pulse propagation is perpendicular to OUT’s front surface. An important disadvantage of this setup is significant reduction of SNR caused by non-ideal behavior of beam splitter. In case of proposed double-sided imaging algorithm the setup presented in Figure 3d is utilized. This is an extension of arrangement shown in Figure 3c and similarly just reflected signals are acquired. This application is possible using a two-channel Tray 4000 spectroscope. A more time consuming equivalent of the proposed system is the measurement using the reflection setup from both sides of OUT separately. The algorithm presented in the next paragraph can be utilized in both cases.

2.2. Proposed Algorithm

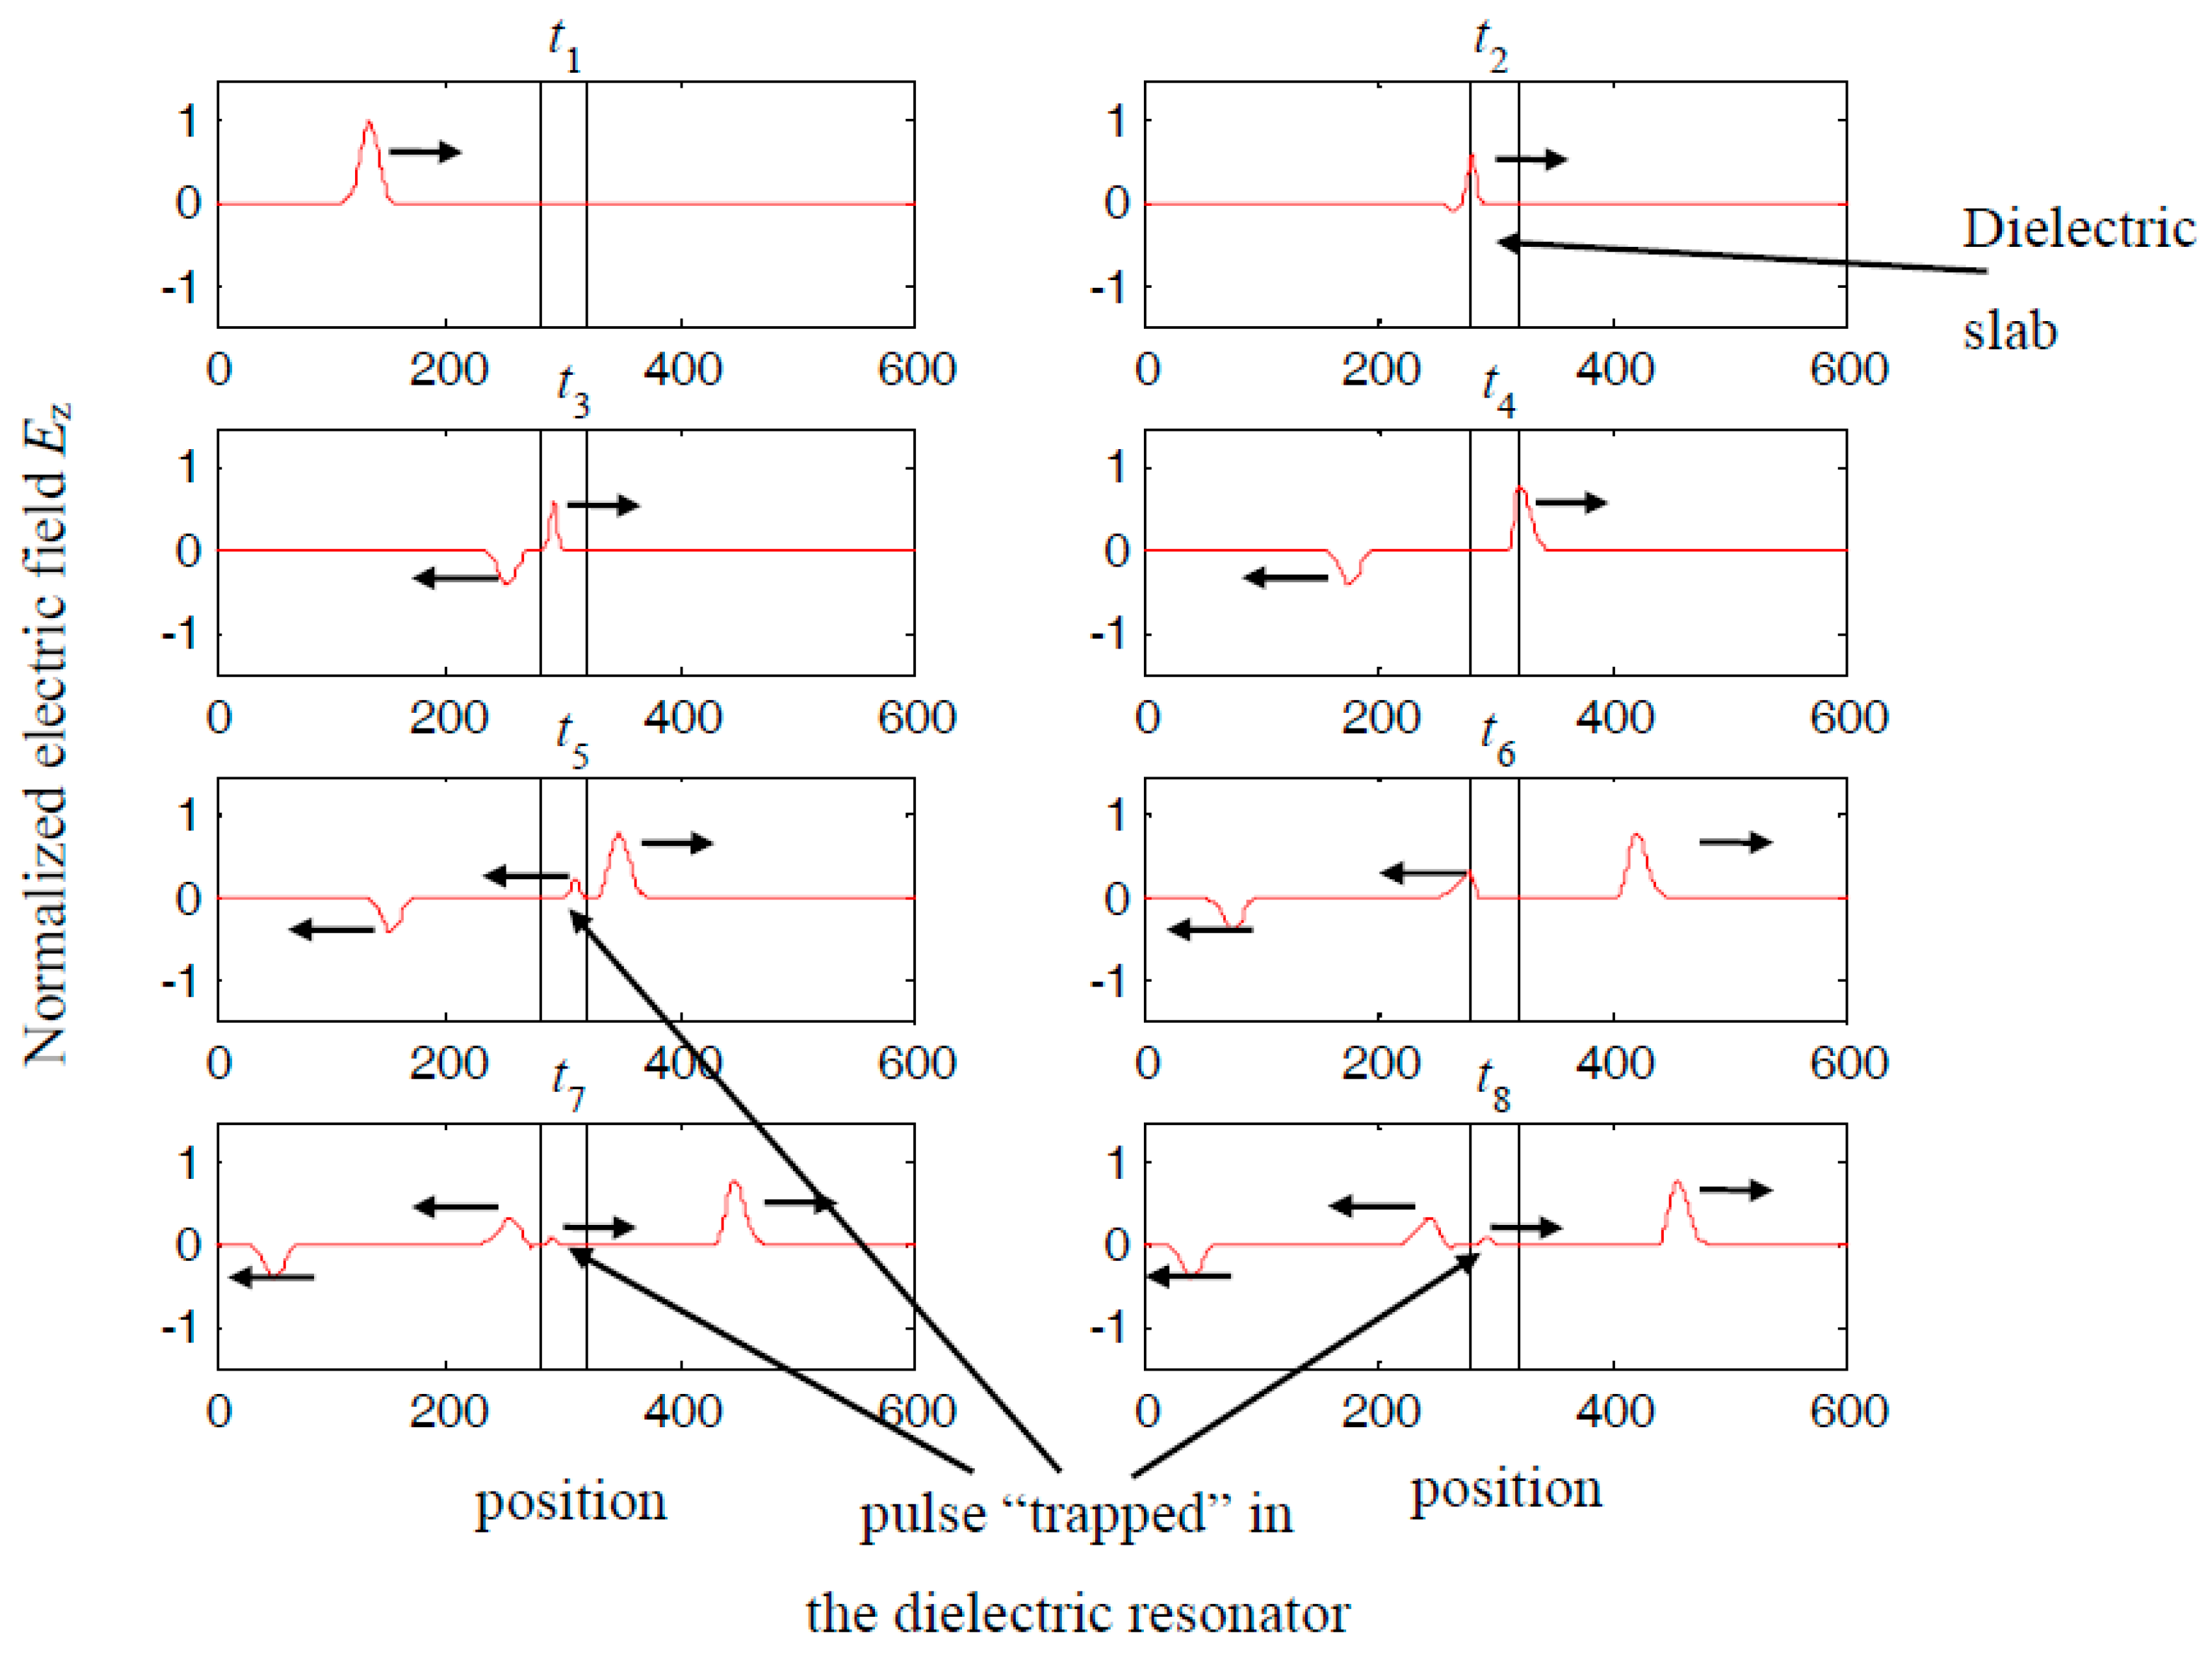
Inspection of multilayered structures using the pulsed terahertz technique enables detection and monitoring of separate layers. If there exists any noticeable difference between the dielectric parameters of the utilized polymer resin and fabric, the reflection of the excitation pulse will be observed. The behavior of a single-layer material is presented in Figure 4. The pulse is reflected and transmitted through air-material and material-air interfaces. One can observe some part of the energy in the form of the electromagnetic pulse becoming trapped in the considered layer (resonator). This pulse is repeatedly reflecting off the layer boundaries and, simultaneously, a part of the energy is transmitted out of the layer. Thus, depending on the layer thickness and dielectric parameters, each excited layer can be considered as a source of delayed and attenuated copies of an excitation pulse in both directions (forward-incident and backward-reflected). This effect, in the case of multilayered structure imaging, causes more problematic analysis of the results. Based on this mechanism we can analyze the response of multilayered structures.
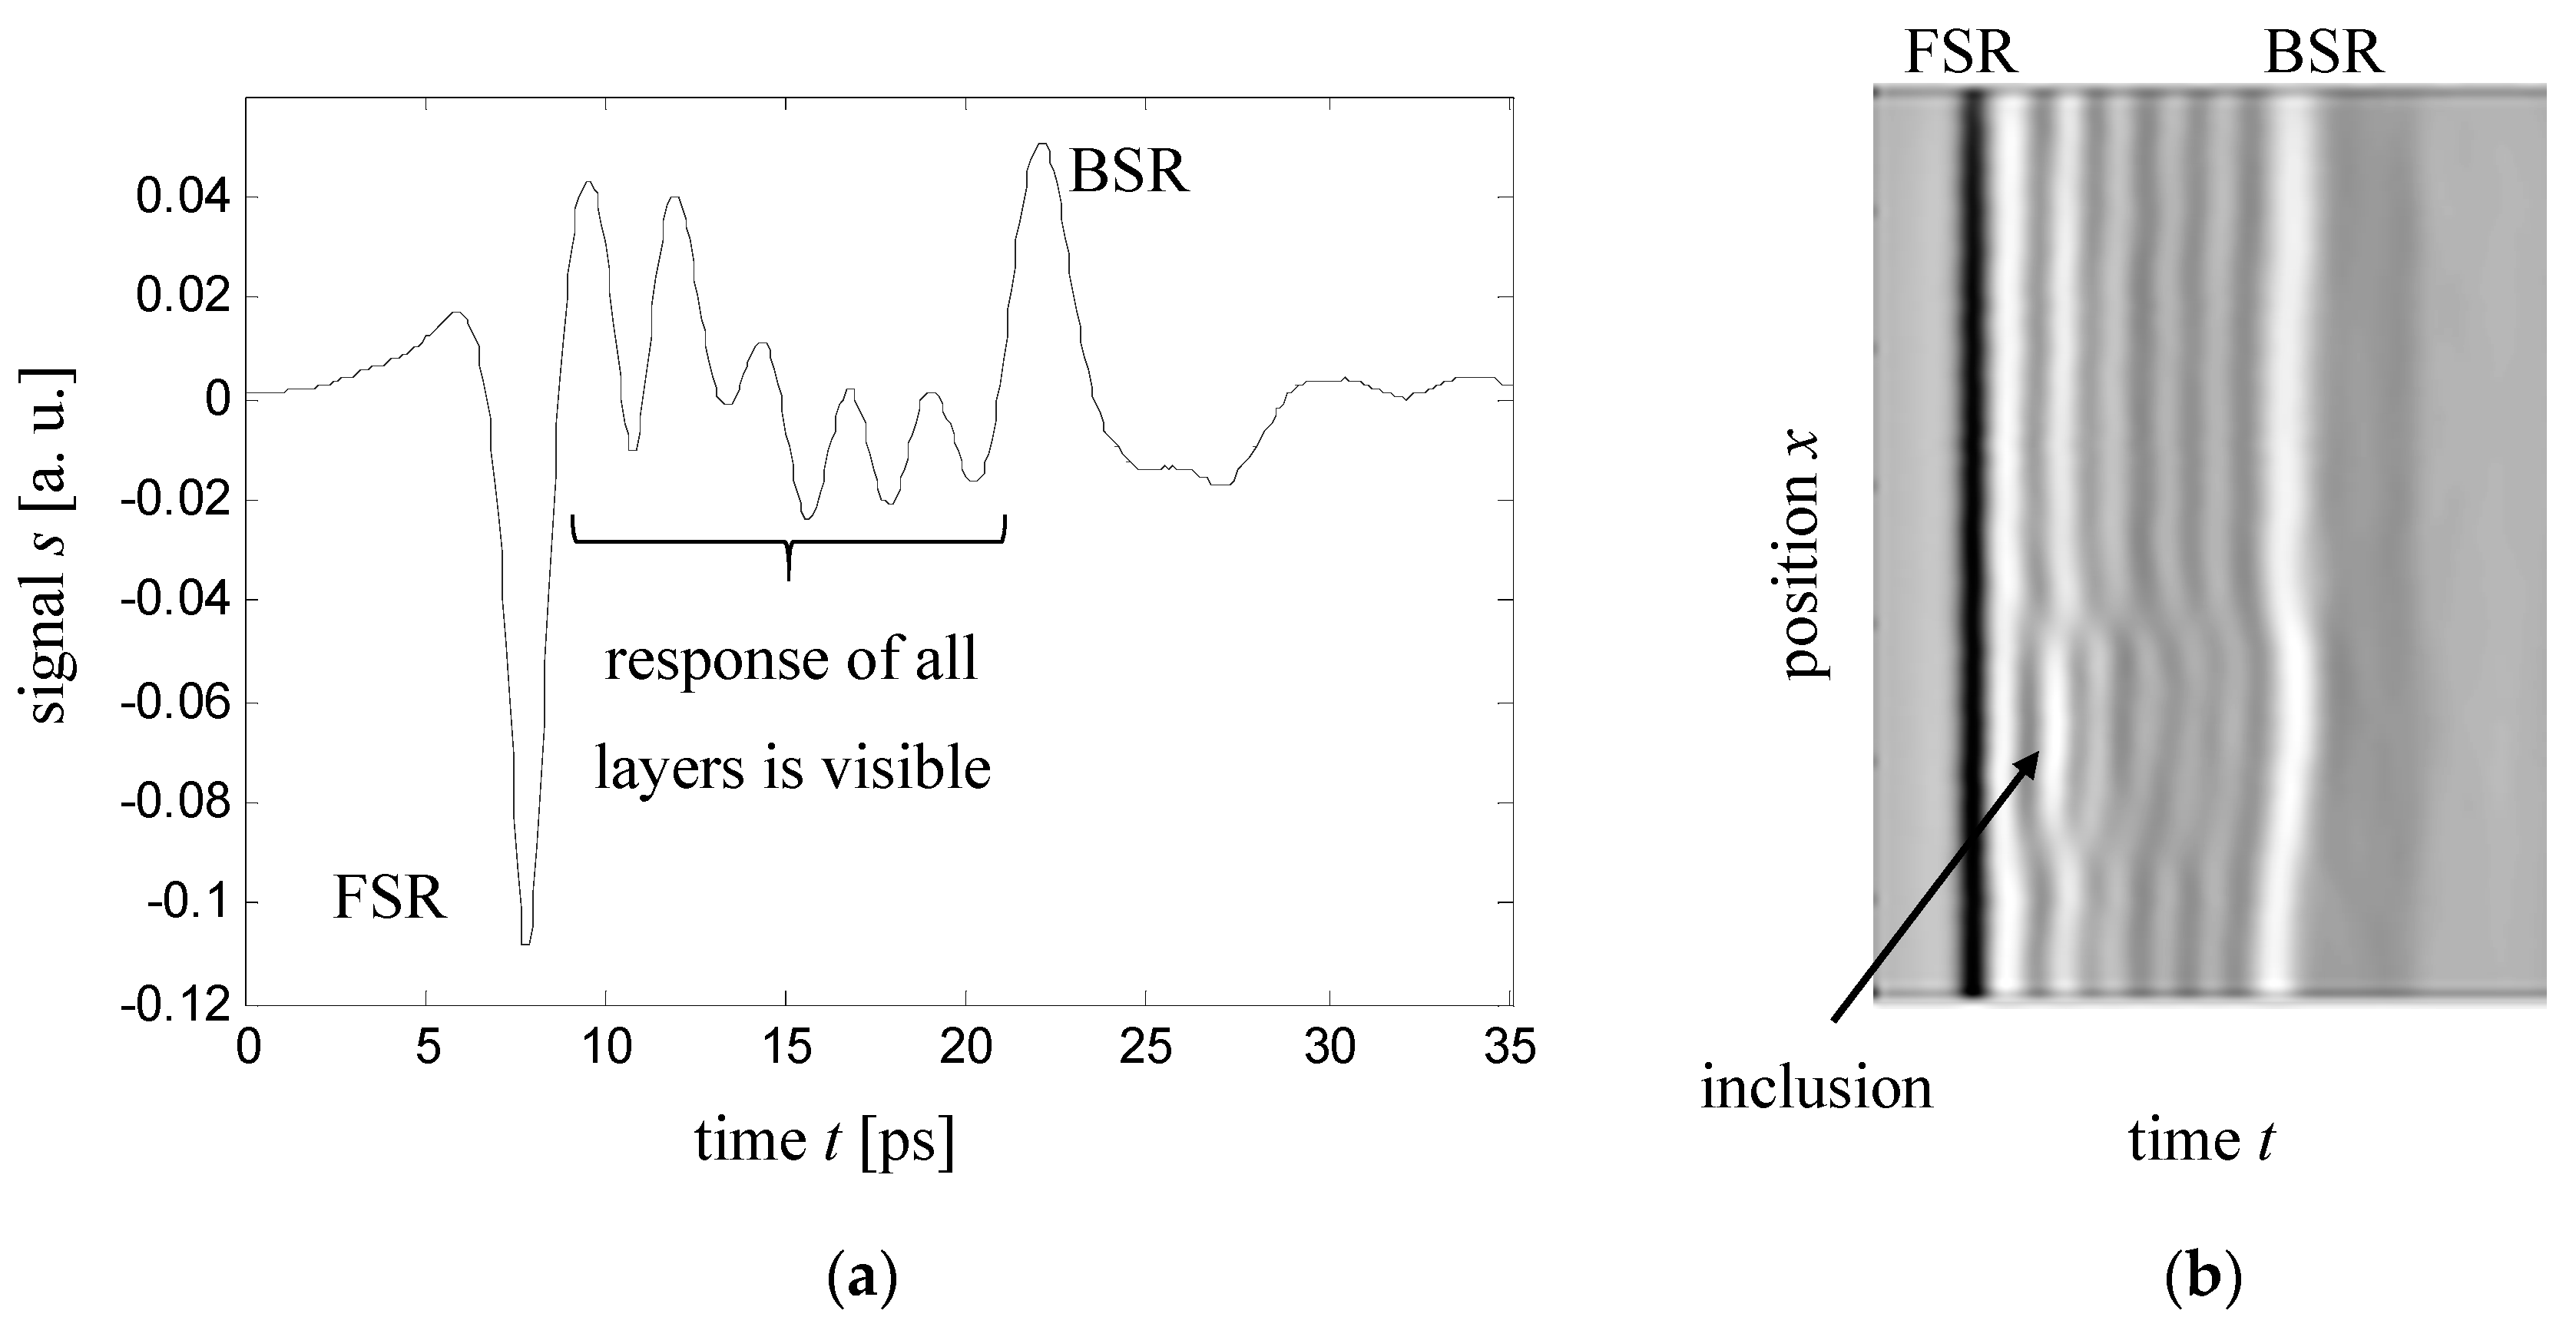
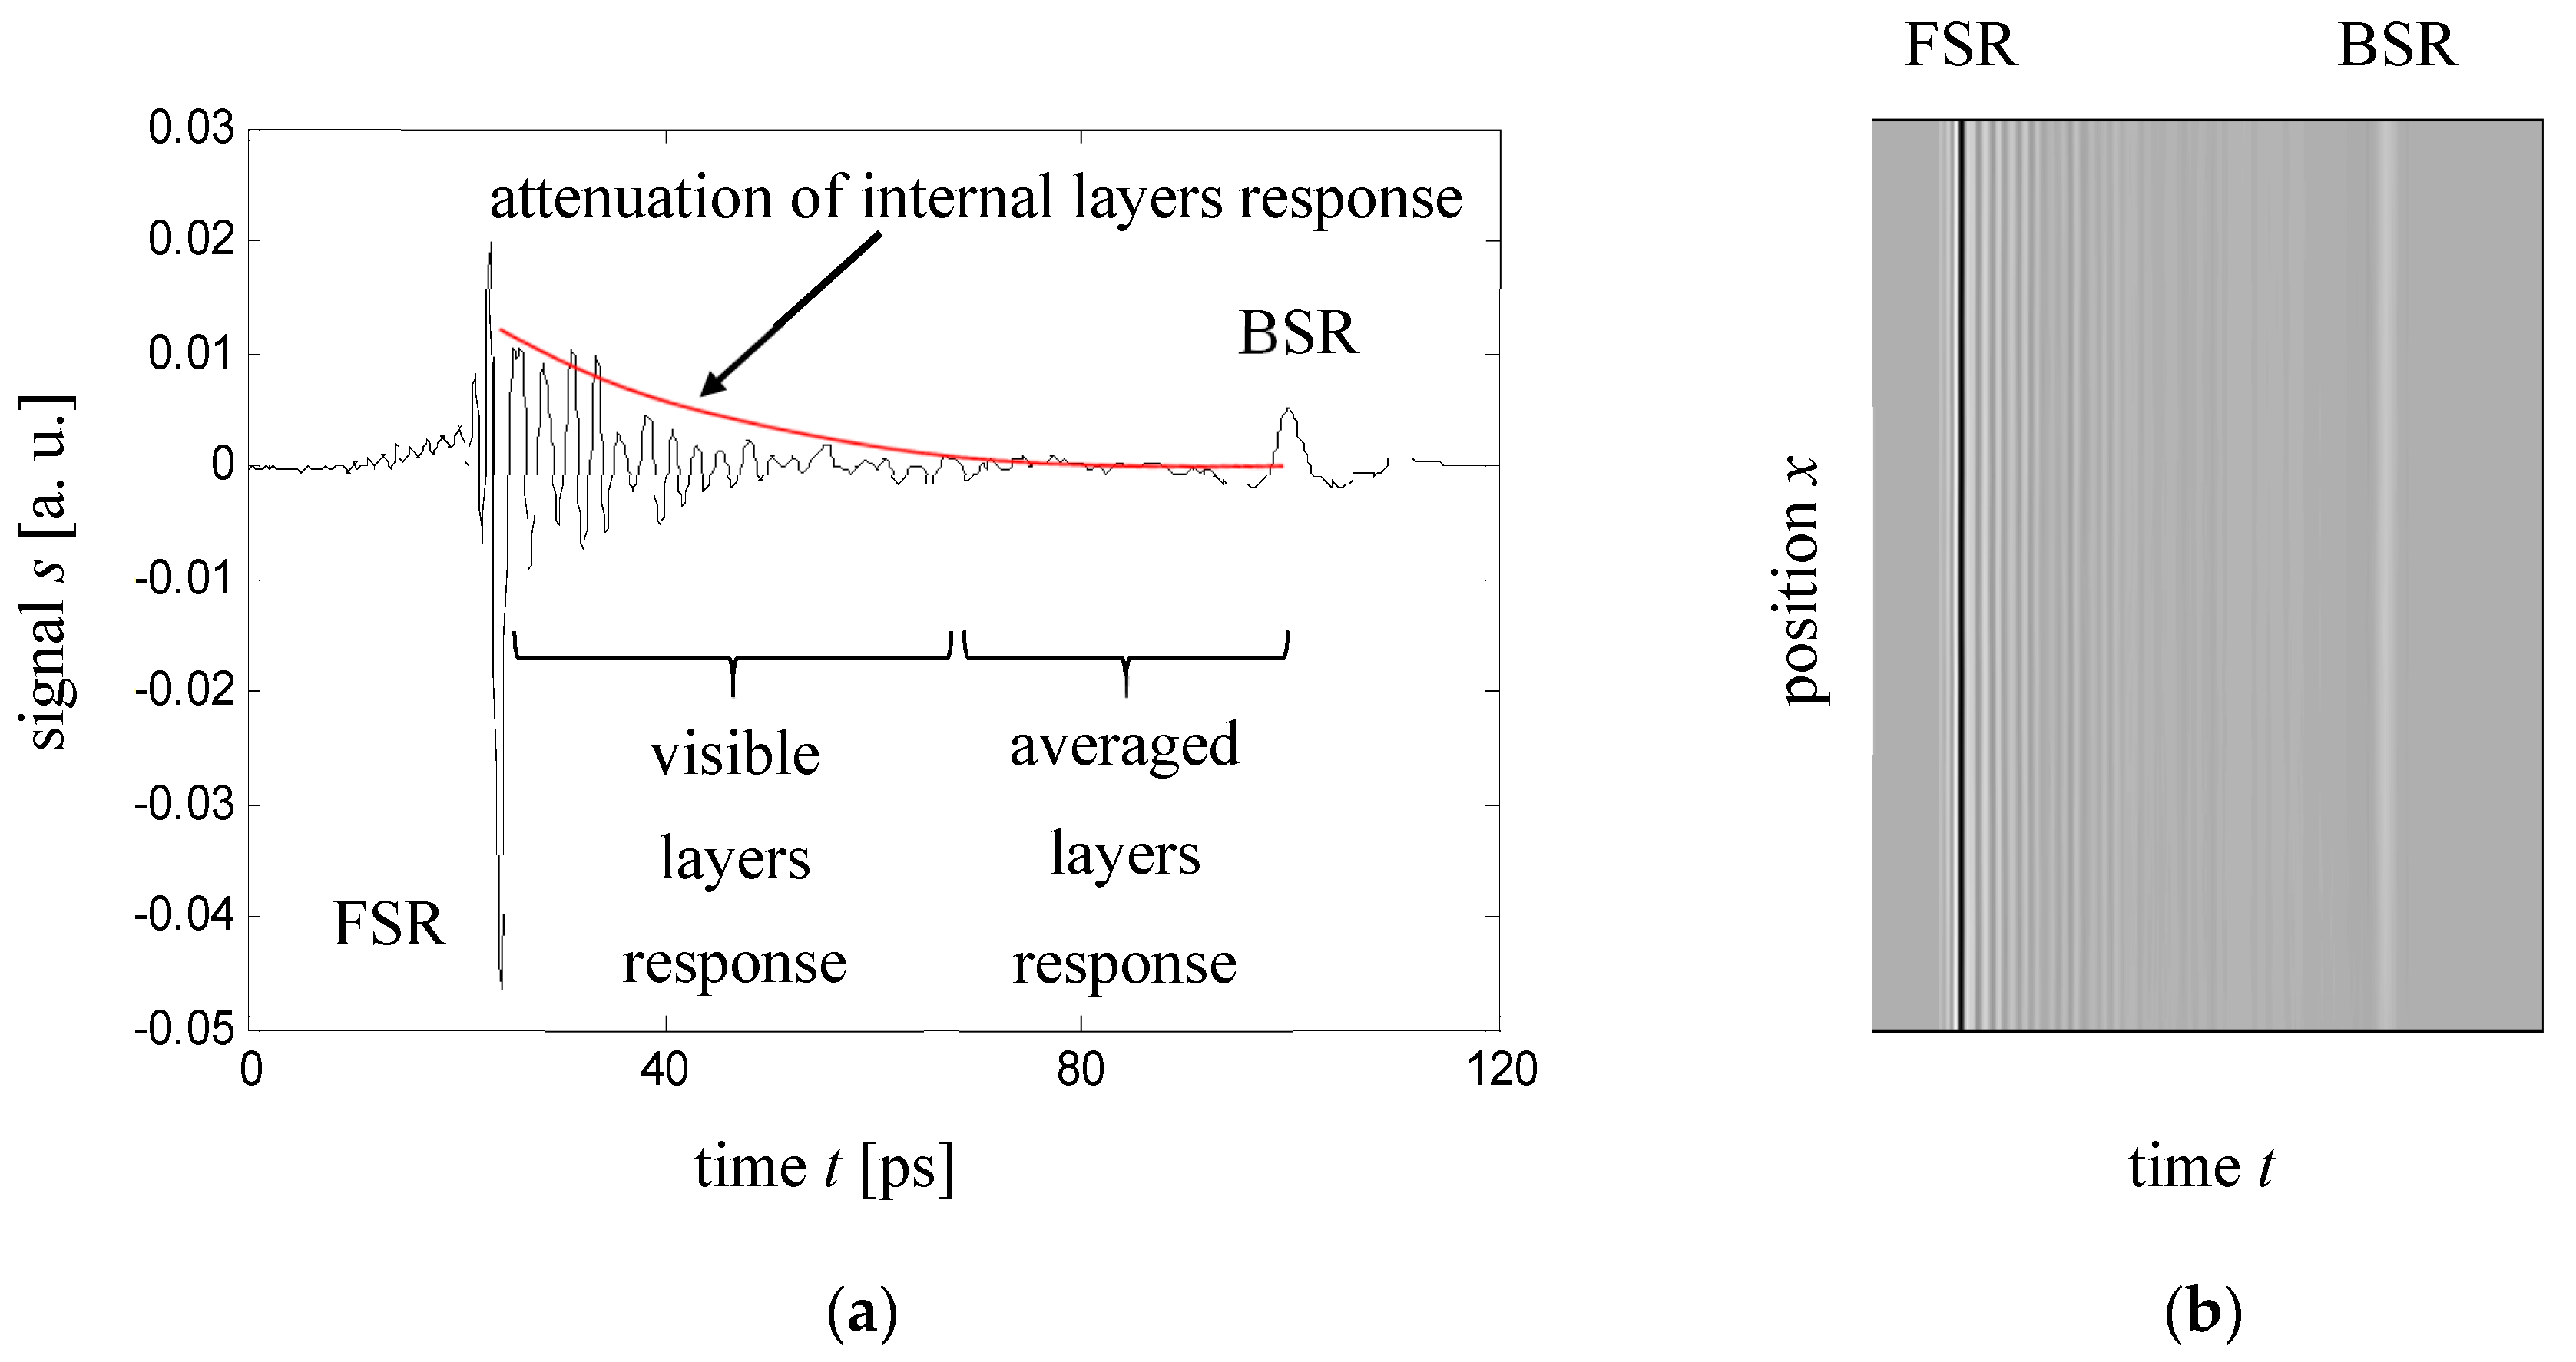
Each layer in the material acts as resonator, thus the recorded response consists of air-material (FSR), layer-layer and material-air (BSR) interfaces reflections as well as huge amount of delayed and attenuated additional pulses. If the number of layers is rather low (e.g., 3–6), the pulses caused by layer interfaces are clearly visible in the measured signal and the resonators causing additional pulses can be neglected (direct reflection of the layer-layer interface is stronger than the attenuated copy). The exemplary signal acquired in the case of a six-layer material is shown in Figure 5. If the number of layers is higher (e.g., 20) the energy of the main pulse after propagation through many layers is low (because of reflections of previous layers), becoming comparable with the energy of the resonator effect caused pulses received by the PCA detector. Thus, just reflections from the layers situated close to front surface can be observed with an acceptable signal to noise ratio (SNR). An example of such a situation is presented in Figure 6. Information about the layers situated close to the back surface is not available in this case—it is not possible to measure the layer thickness. Fortunately, the detection of defects like delamination, voids, and inclusions is still possible because of their noticeable difference of permittivity compared with fibers and polymer resin.
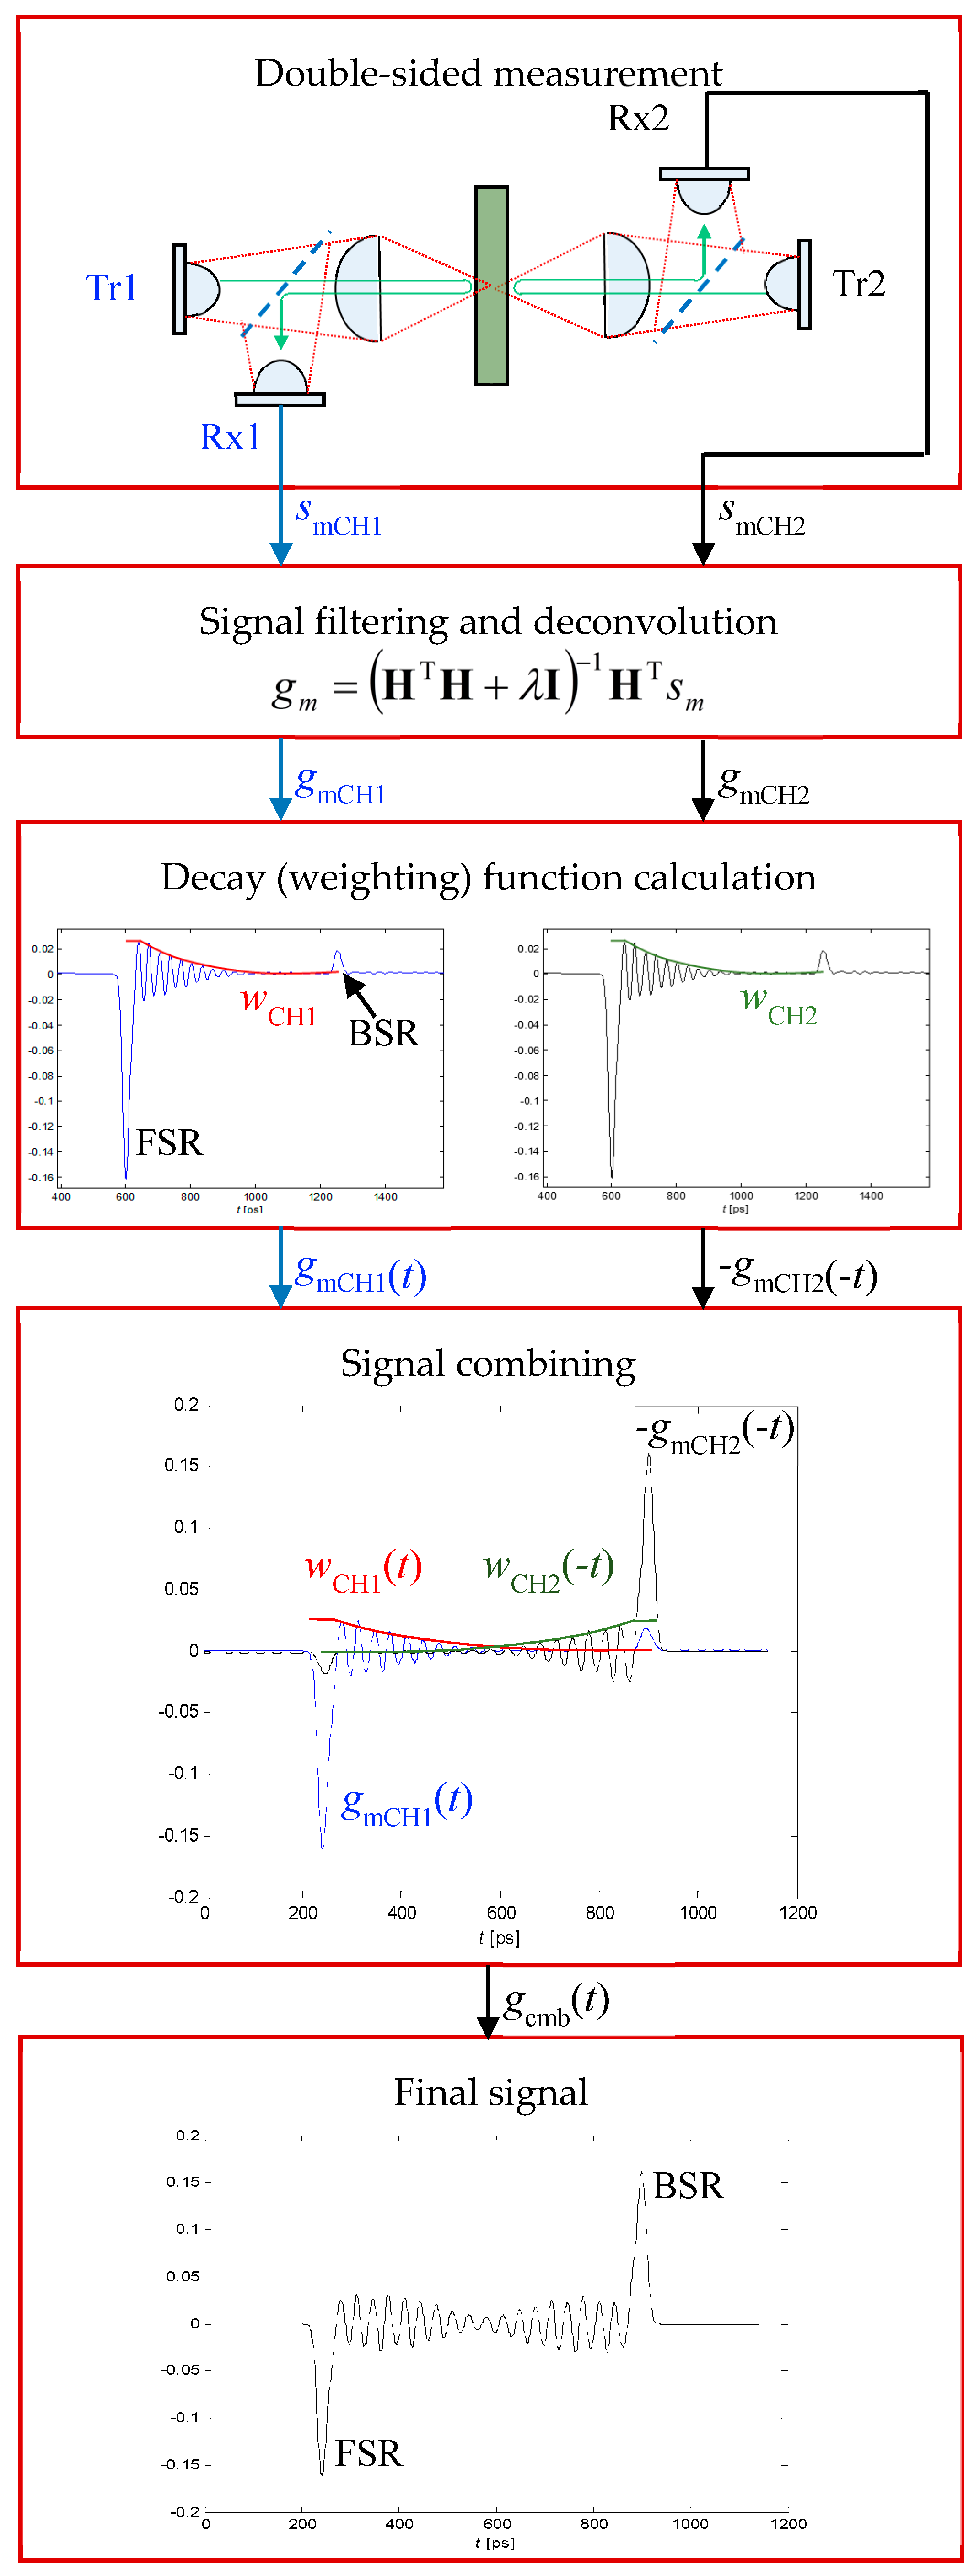
In order to obtain detailed information about the layers close to back surface of examined material the algorithm of double–sided terahertz inspection is proposed. It is presented in Figure 7. First, a double-sided measurement arrangement, shown in Figure 3d, is performed. The application of this setup is possible using a two-channel terahertz spectroscope (e.g., Tray 4000 from Picometrix). A more time consuming equivalent of the proposed arrangement is a separate measurement using a reflection setup (Figure 3c) from both sides of the evaluated material. This method of inspection needs an additional data registration process in order to match the obtained results to the same (x,y) position. The proposed algorithm can be utilized in both cases.
In order to increase the ability of separate layers distinguishing, a deconvolution operation was performed. Such processing is utilized in the case of THz imaging for noise cancelation and spatial resolution improvement [24,31]. The basic deconvolution process is very sensitive to noise and can result in considerable errors in the case of experimental results (if noise is present). In this work an improved, least squares deconvolution method was utilized [40], according to a following equation:
g m = ( H T H + λ I ) 1 H T s m
where: H is the convolution matrix, I is the identity matrix, λ is the regularization parameter, sm is the measured signal, and gm is the deconvolved signal—reflectivity profile of material.
In the next step, weighting functions wCH1 and wCH2 were calculated as an envelope based on the signal obtained using the analytical model (presented in Section 2.3). This step is shown in Figure 7. The utilized model enabled the calculation of the waveform reflected from a given multi-layered structure if an incident wave is in the form of a wideband Gaussian pulse. In order to obtain analytical form of weighting function the following approximation was utilized:
w CHk ( t ) = i = 1 I p i e q i t
where wCHk(t) is the weighting function of given channel k = 1 or 2, and pi, qi are the approximation coefficients.
The sum of two exponential functions (I = 2) is sufficient to obtain acceptable level of approximation. In the next step both signals are combined using weighted sum:
g c m b ( t ) = w n C H 1 ( t ) g m C H 1 ( t ) w n C H 2 ( t ) g m C H 2 ( t ) w n C H 1 ( t ) + w n C H 2 ( t )
where gcmb(t) is the combined signal, wnCH1(t) and wnCH2(t) are the weighting functions normalized to the 〈0;1〉 range, associated with channel one and two, respectively, and gmCH1(t) and gmCH2(t) are the deconvolved signal of channel one and two, respectively. The reconstructed signal gcmb(t) in the vicinity of the FSR pulse is calculated mainly based on gmCH1(t), and close to the BSR pulse based on gmCH2(t). The signal from channel two was multiplied by −1 and time-reversed (−gmCH2(−t)). This operation enabled obtaining the same polarization of FSR, BSR, and defect-caused pulses, thus, constructive interference is possible. The combined signal in case of measurements will be presented in Section 3. Finally, the obtained signal contains high amplitude pulses caused by material-air interfaces (FSR and BSR). The signal caused by layers reflections is symmetrical—the highest values are close to FSR/BSR. Even in the center of whole material response—where the signal is weakest—its amplitude is noticeably higher than in the case of the raw signal (obtained for single-side inspection).

2.3. Analytical Model

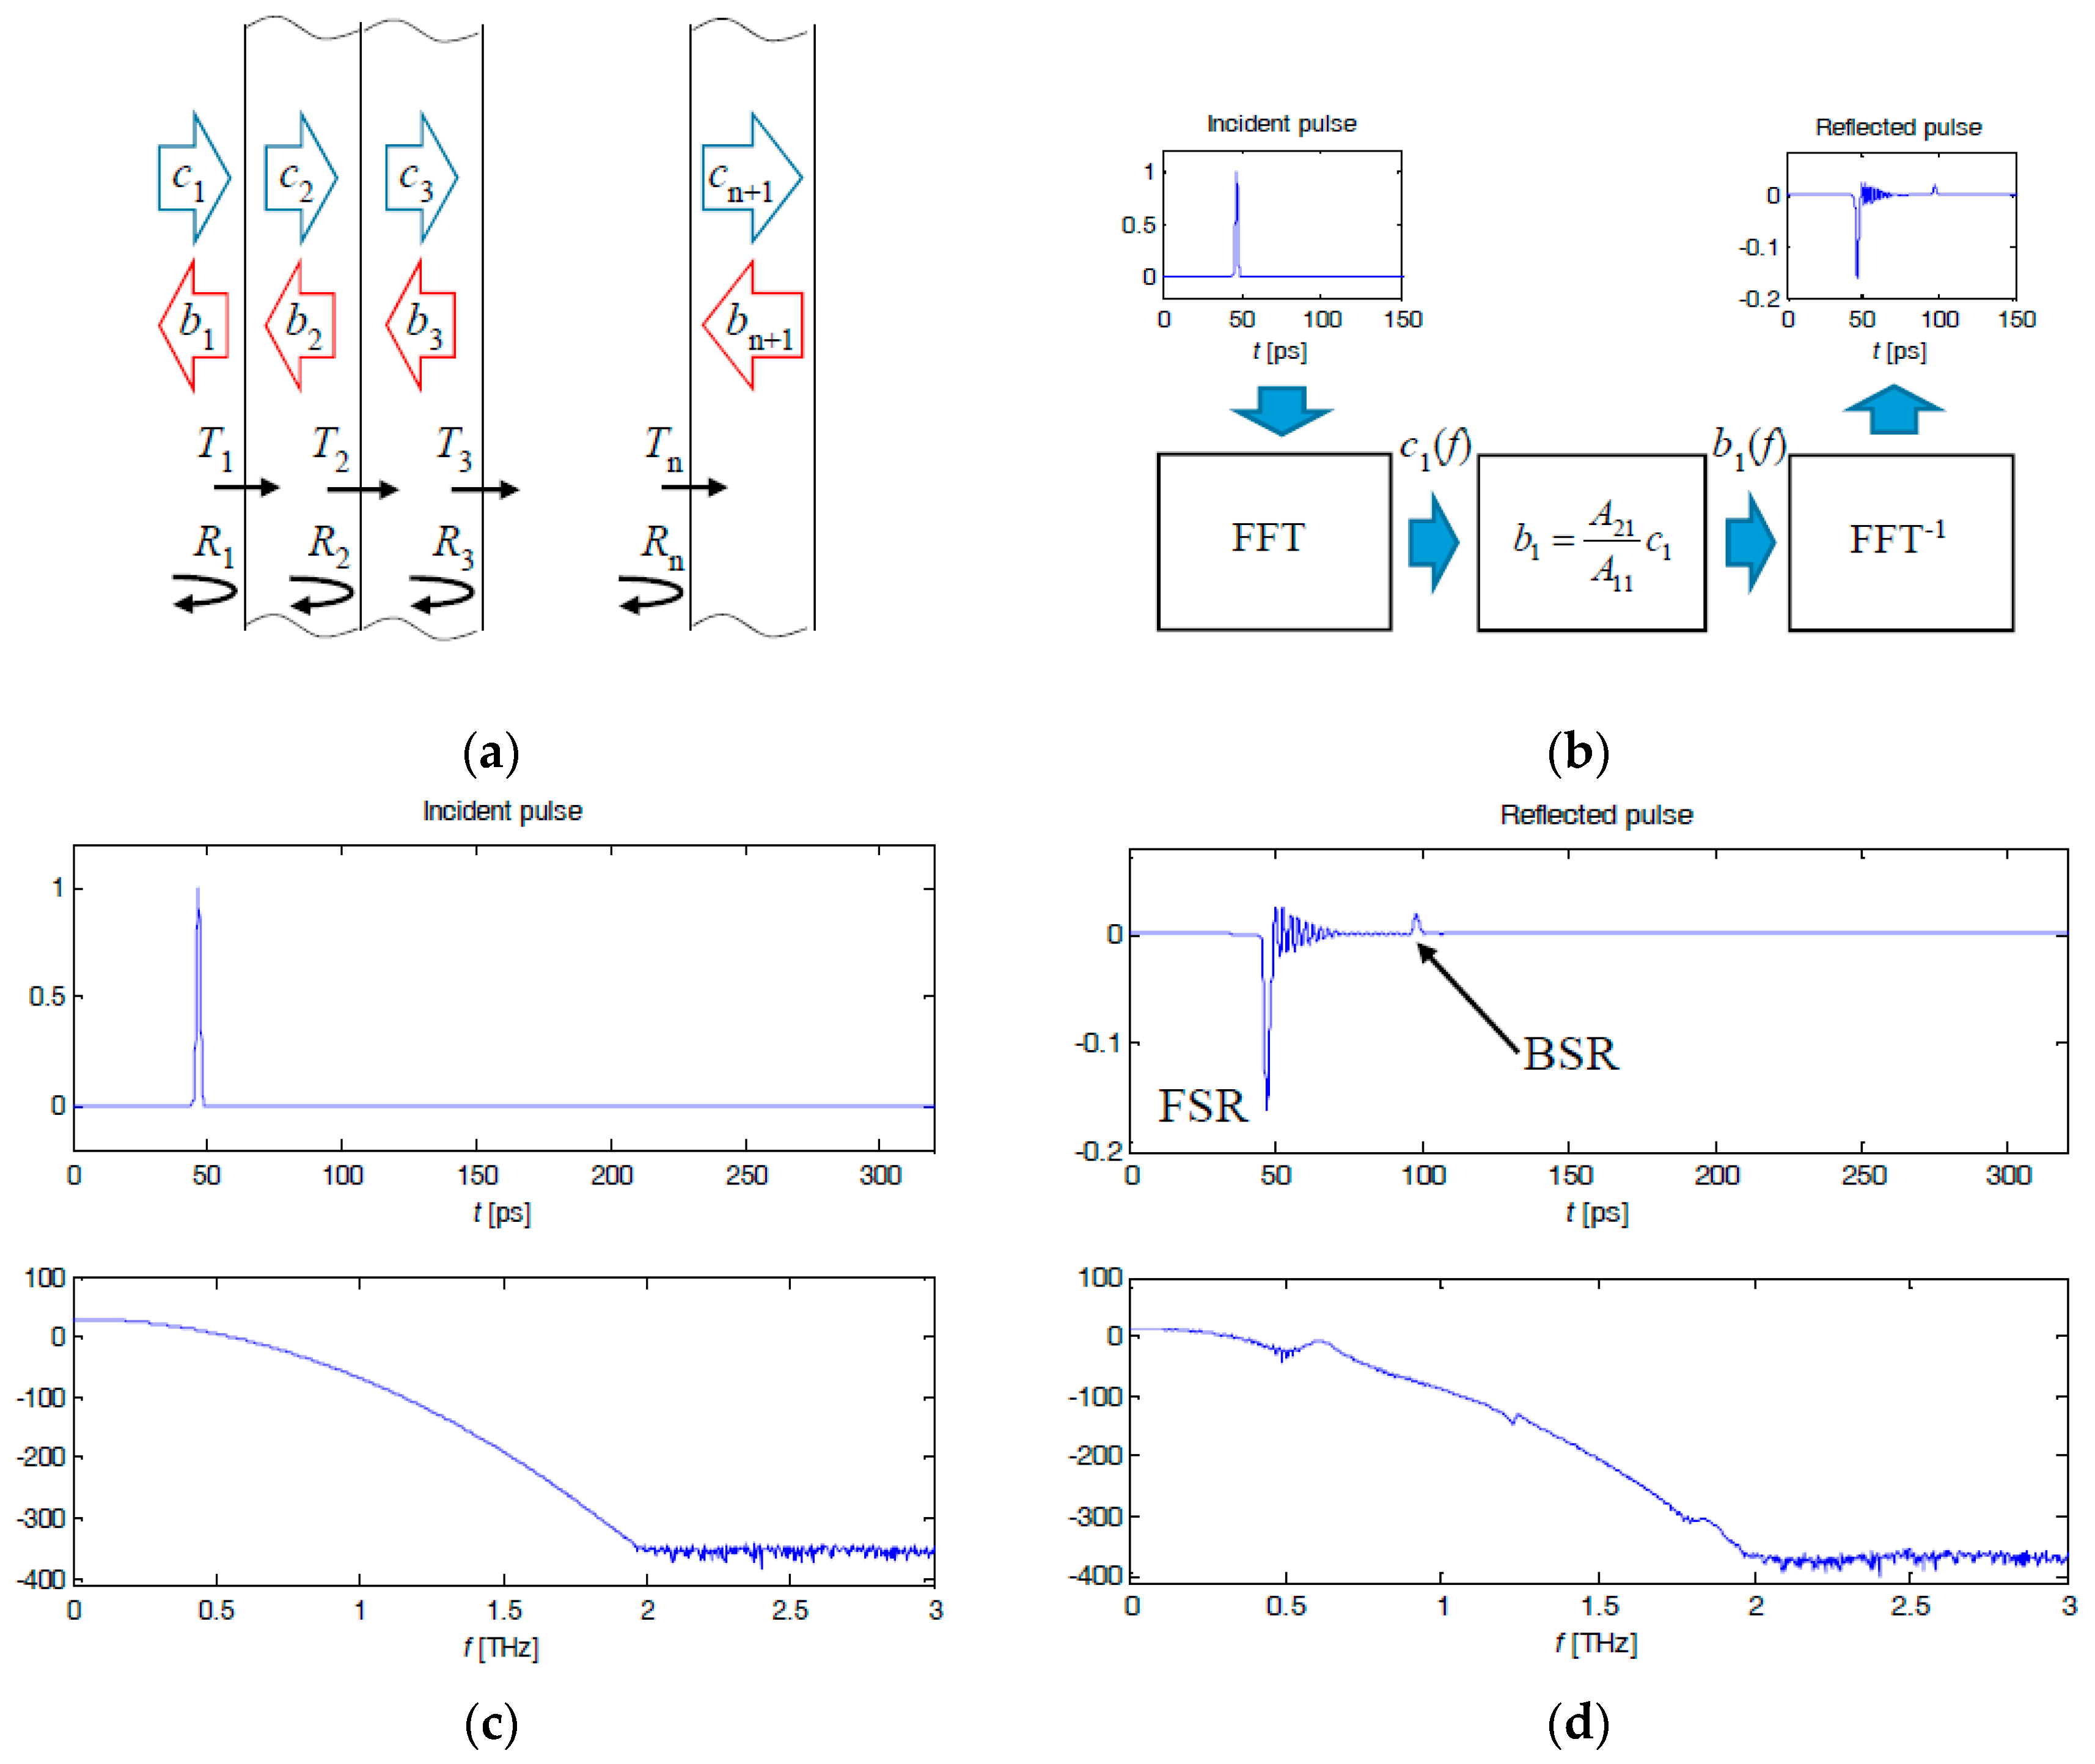
Analytical model is utilised in order to obtain envelope based layers reflection attenuation function, which is used in proposed algorithm as a source of time delay dependent weight value in weighted summing of both signals. A chain matrix-based model of harmonic electromagnetic wave propagation in cascade connection of n non-lossy sections in the case of normal incidence will be considered [41,42]. This situation is schematically presented in Figure 8a. ci and bi are forward- and backward-traveling wave amplitudes in each layer in the case of the considered frequency. For cascade connections of n sections (layers) we have the following equation [41,42]:
[ c 1 b 1 ] = i = 1 n 1 T i [ e j ϕ i R i e j ϕ i R i e j ϕ i e j ϕ i ] [ c n + 1 b n + 1 ] = [ A 11 A 12 A 21 A 22 ] [ c n + 1 b n + 1 ] ,
where ϕ i = k i d i is the electrical length, d i is the layer thickness, k i = k 0 ε r i is the propagation constant, R i = Z i Z i 1 Z i + Z i 1 is the reflection coefficient, Z i is the wave impedance, T i = 1 + R i is the transmission coefficient, and A k l are the elements of the chain matrix.
Assuming only one direction of excitation pulse—there is no electromagnetic wave incident from back side of examined material (bn+1 = 0)—we have:
b 1 = A 21 A 11 c 1 .
Equation (5) enables calculation of the reflected wave amplitude b1 for a given frequency f based on the incident field amplitude c1 and the selected chain matrix elements. A block scheme of the reflected pulse calculation algorithm is presented in Figure 8b. Incident Gaussian pulse is transformed to frequency domain, where the analytical model (Equation (5)) is applied for each harmonics. After calculation of reflected wave b1(f), the result is transformed back to the time domain. The incident pulse and its spectrum, as well as the reflected pulse, are presented in Figure 8c,d, respectively. One can observe the similarity of the obtained signal with the measured one presented in Figure 6. It consists of FSR and BSR pulses, as well as the exponentially-attenuated layer reflection pulse.

3. Results and Discussion

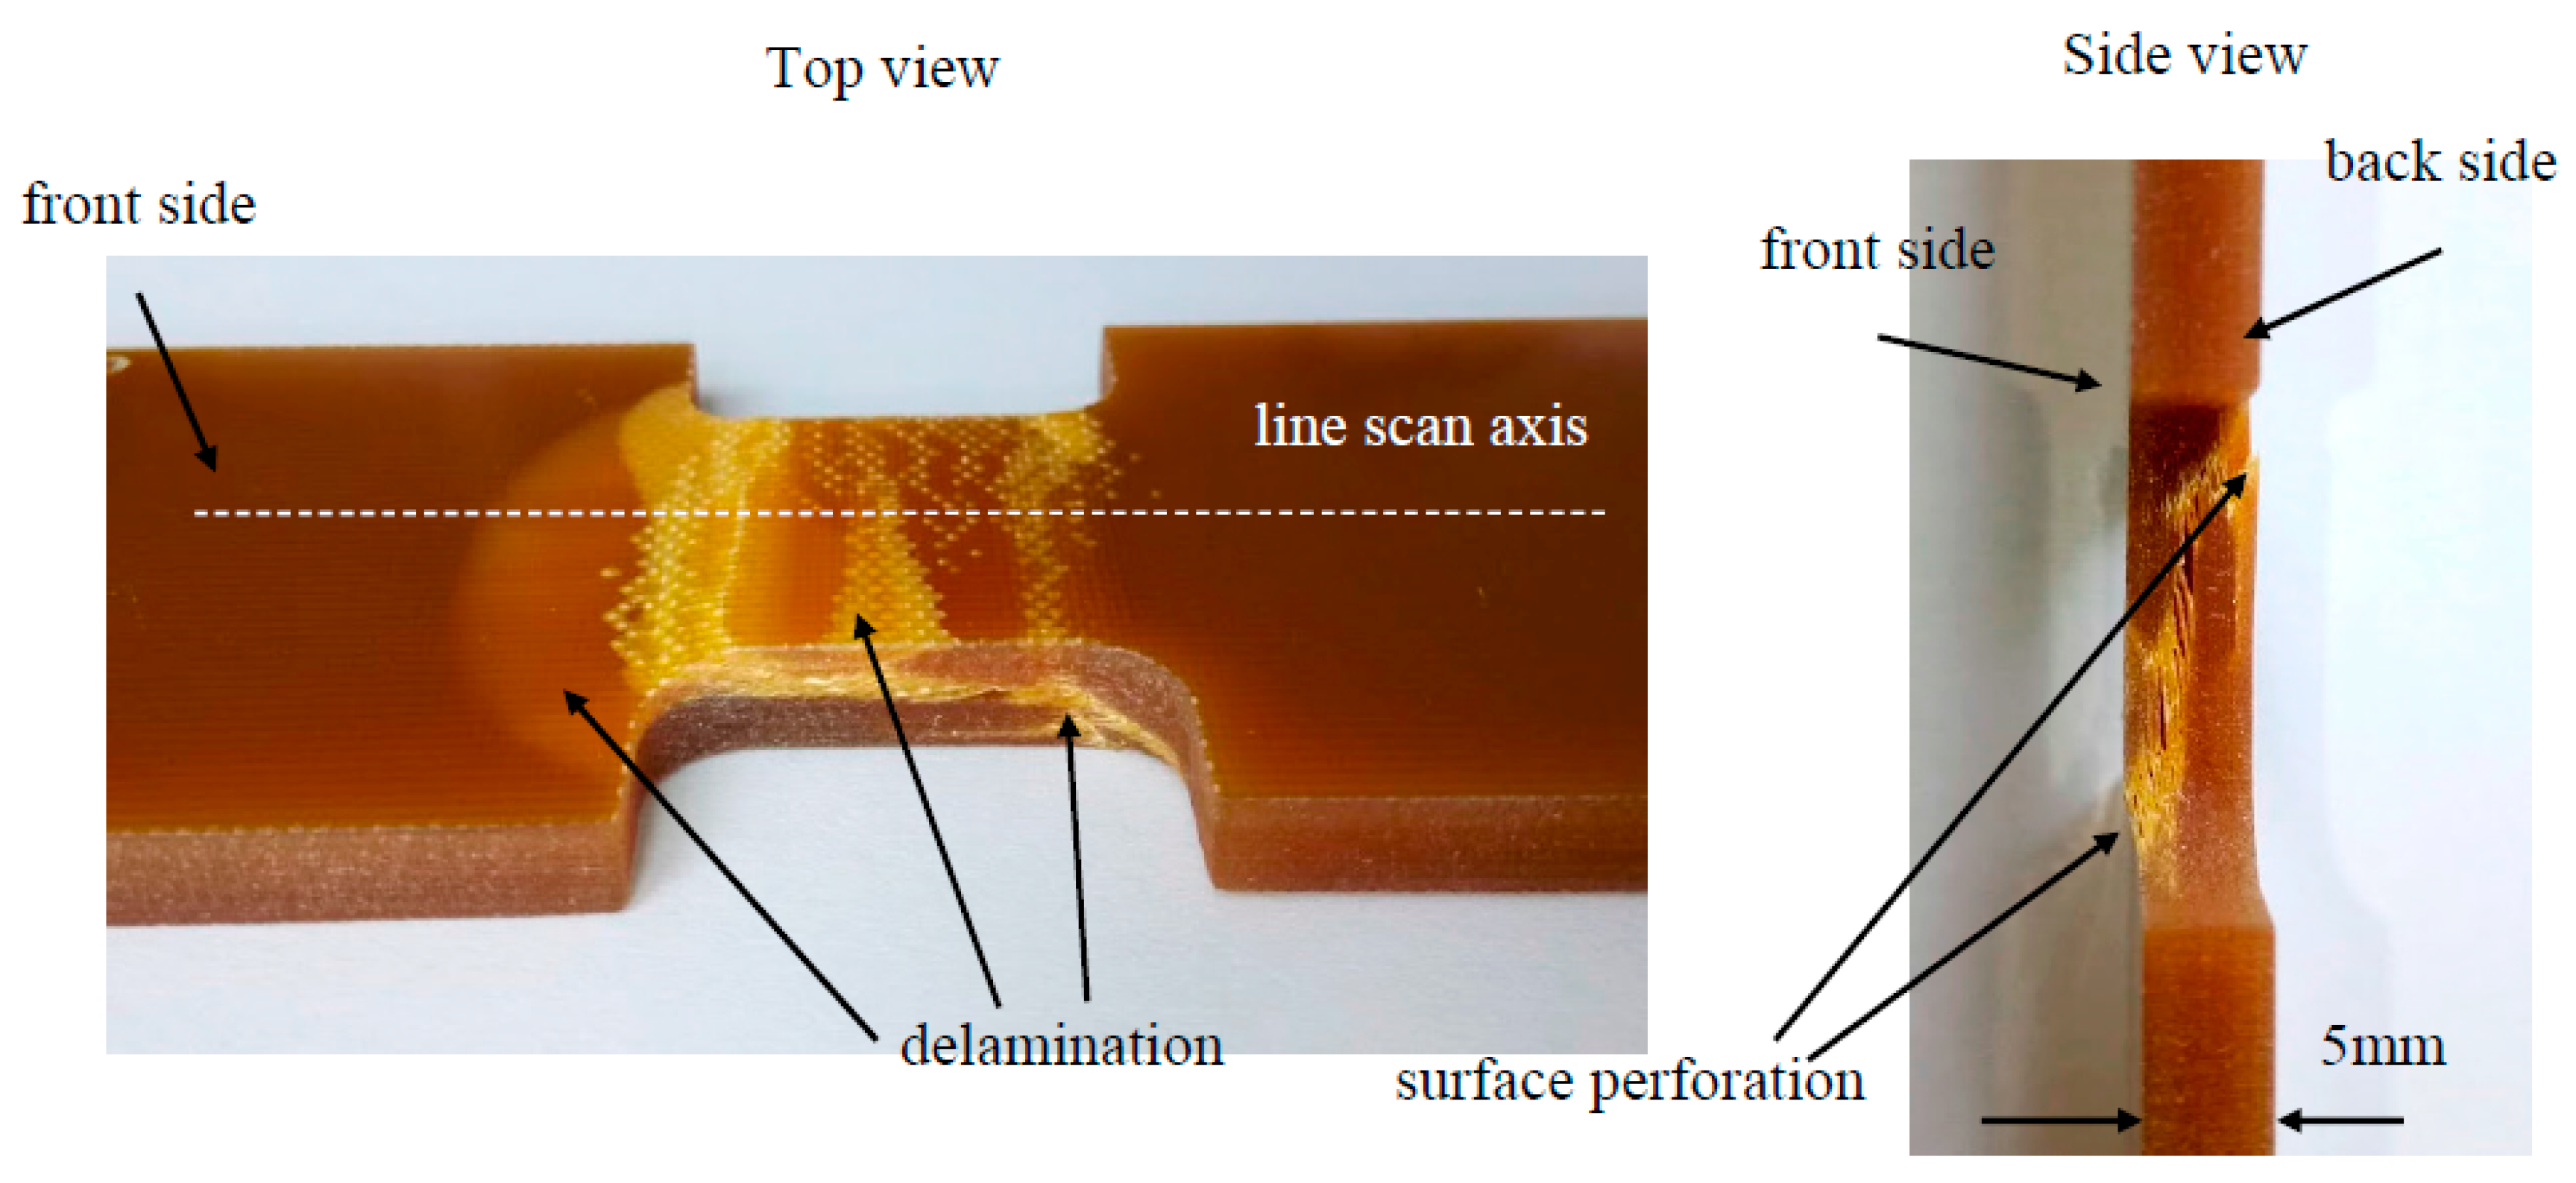
The proposed algorithm was experimentally validated. A double-sided inspection of a polymer composite was carried out. During the measurements a commercially-available material which consists of 30 plies of glass fiber fabric with regularly-oriented fibers subjected to stress forces below 140 MPa was utilized. The photography of the exemplary specimen is presented in Figure 9. After applying mechanical excitation, several delaminations were created on various depths of the layered structure and both surfaces were perforated. Material in this condition has significantly worse mechanical properties.
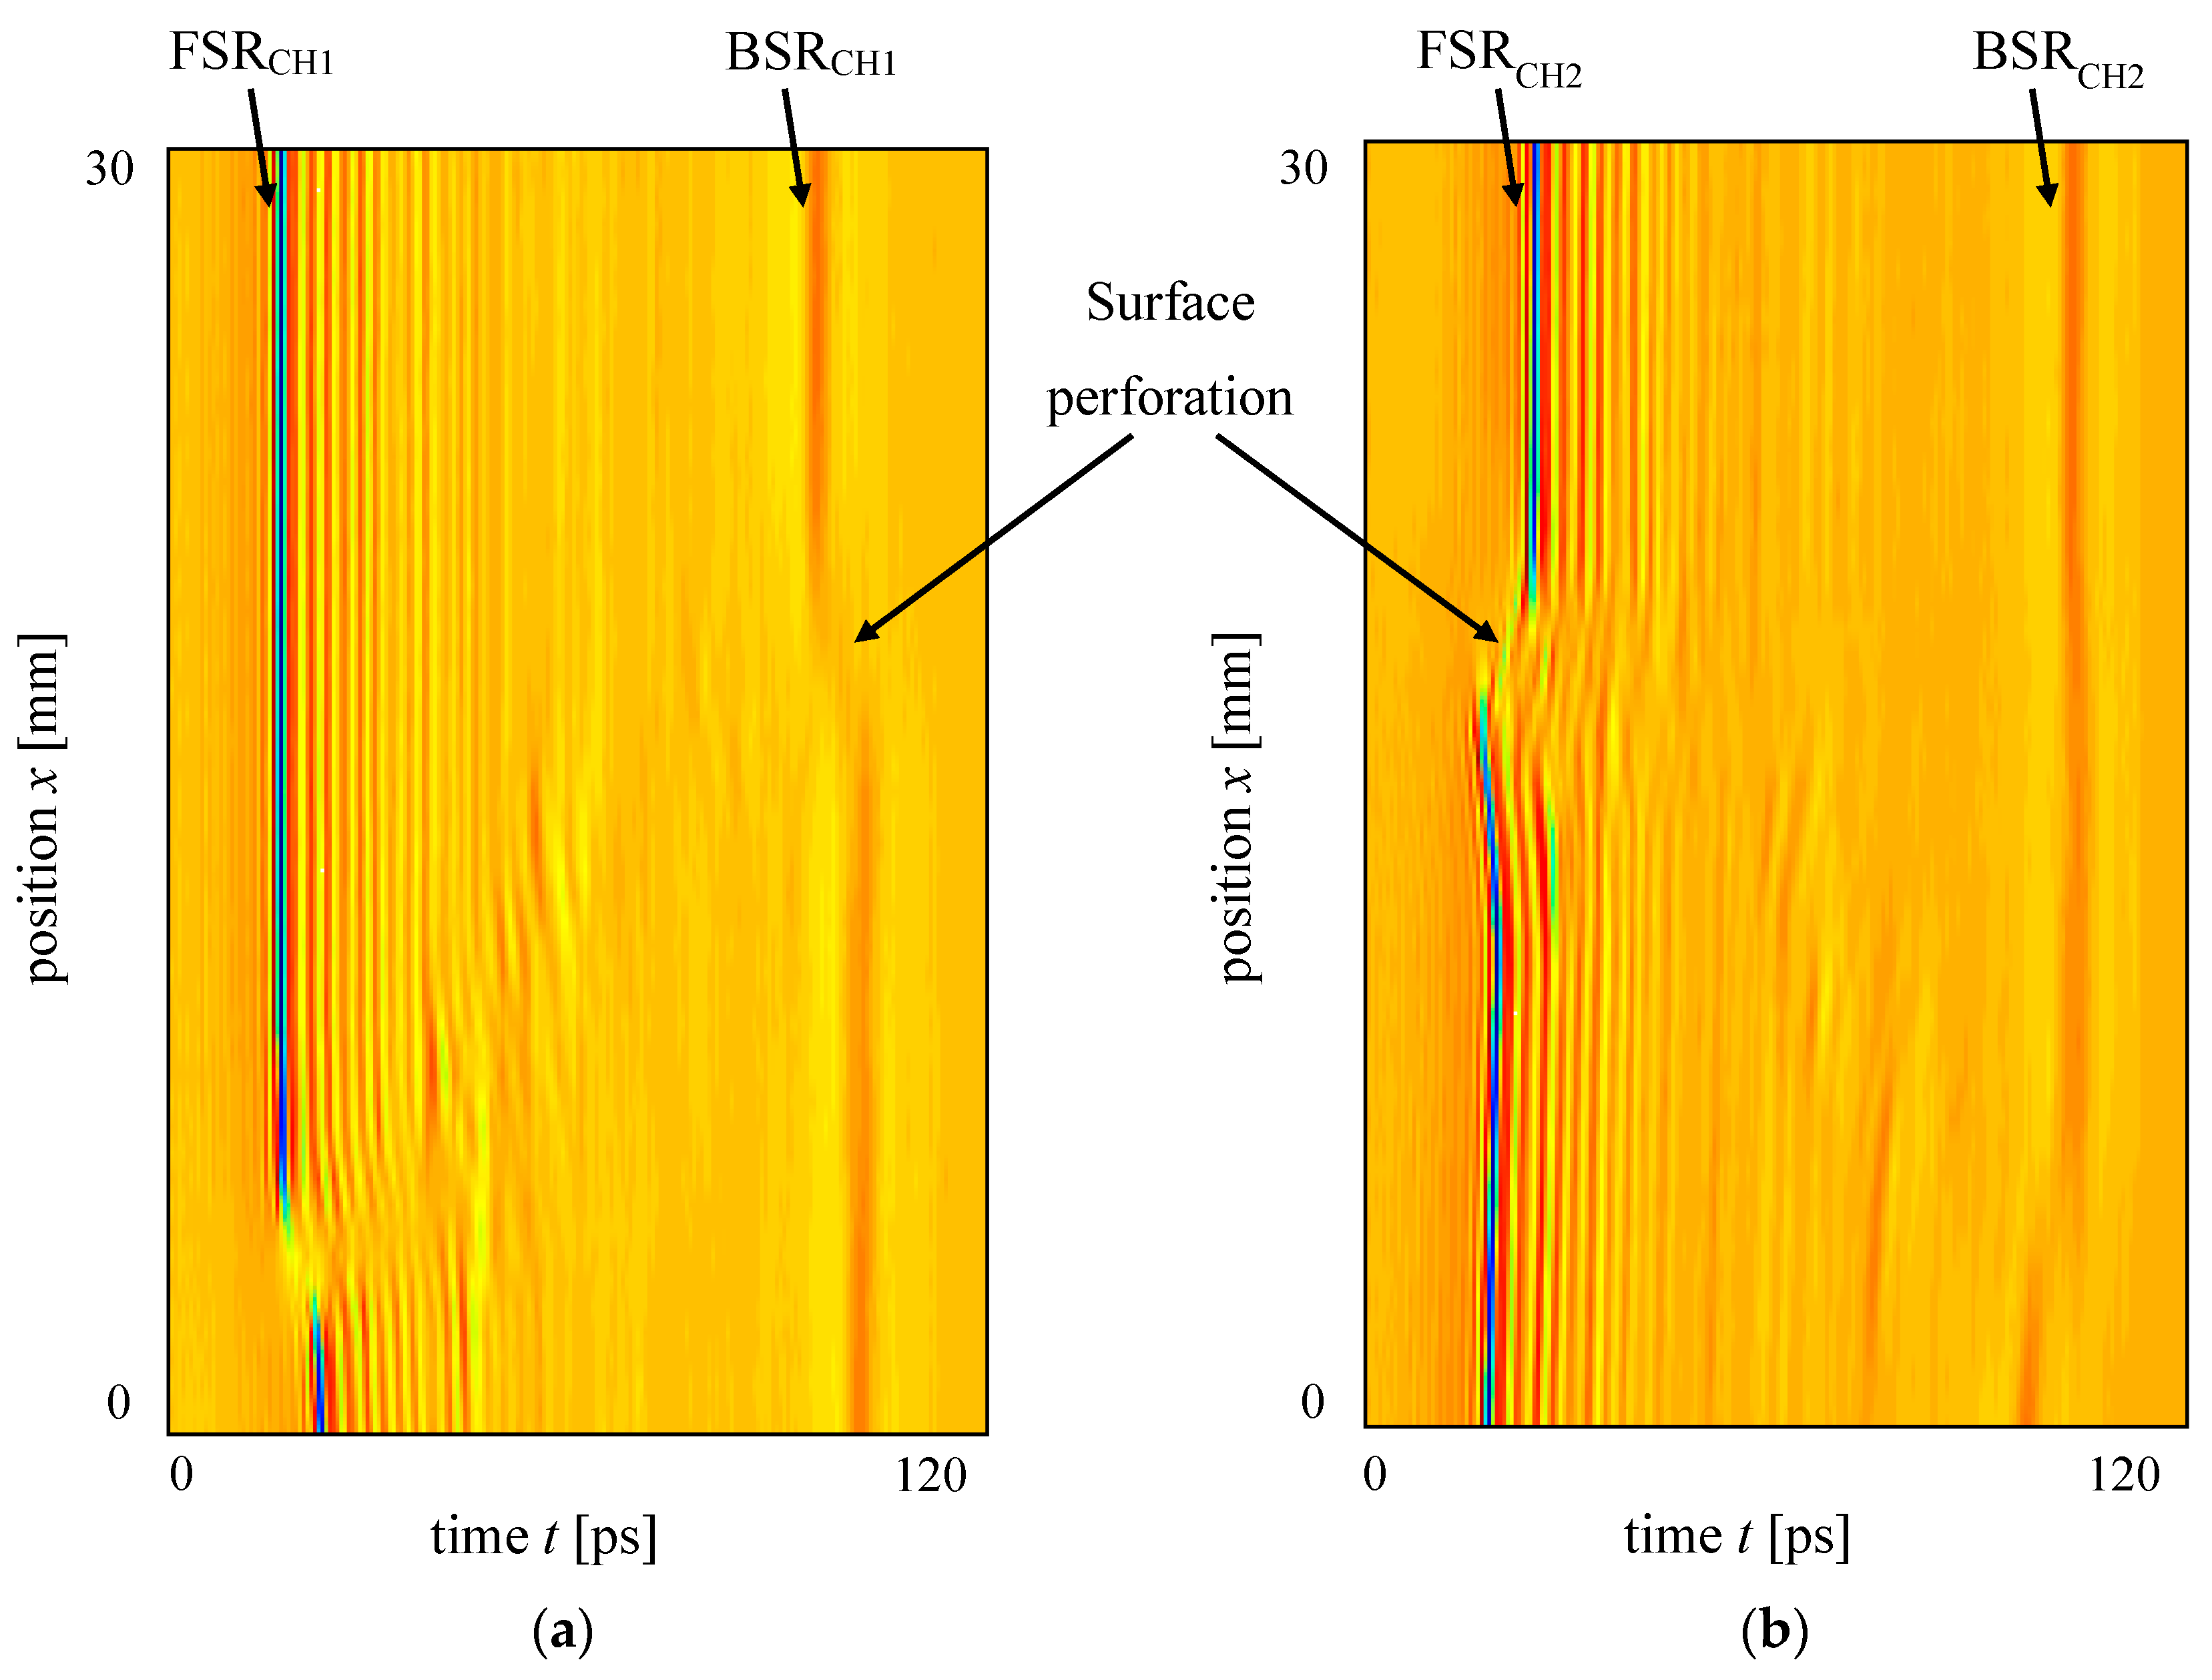
The exemplary A-scan signals gmCH1(t) and −gmCH2(−t) obtained using the proposed double-sided inspection and signal processing are presented in Figure 10. One can observe constructive interference of FSRCH1–BSRCH2, FSRCH2–BSRCH1 and defect/layer reflection pulses, respectively. Similarly, B-scan signals obtained during a single line scan along the sample are presented in Figure 11 (deconvolved) and Figure 12 (channel 2 signal time-reversed). In each case BSR pulse has smaller amplitude and frequency content in comparison with FSR pulse. This is caused by attenuation of the pulse energy during propagation through multilayered structures and defocusing. As mentioned before, layers’ reflection pulses (in the case of layers close to back surfaces) are blurred, as well. Based on Figure 12, one can see that gmCH1(t) and gmCH2(−t) signals contain complementary information about the layers.
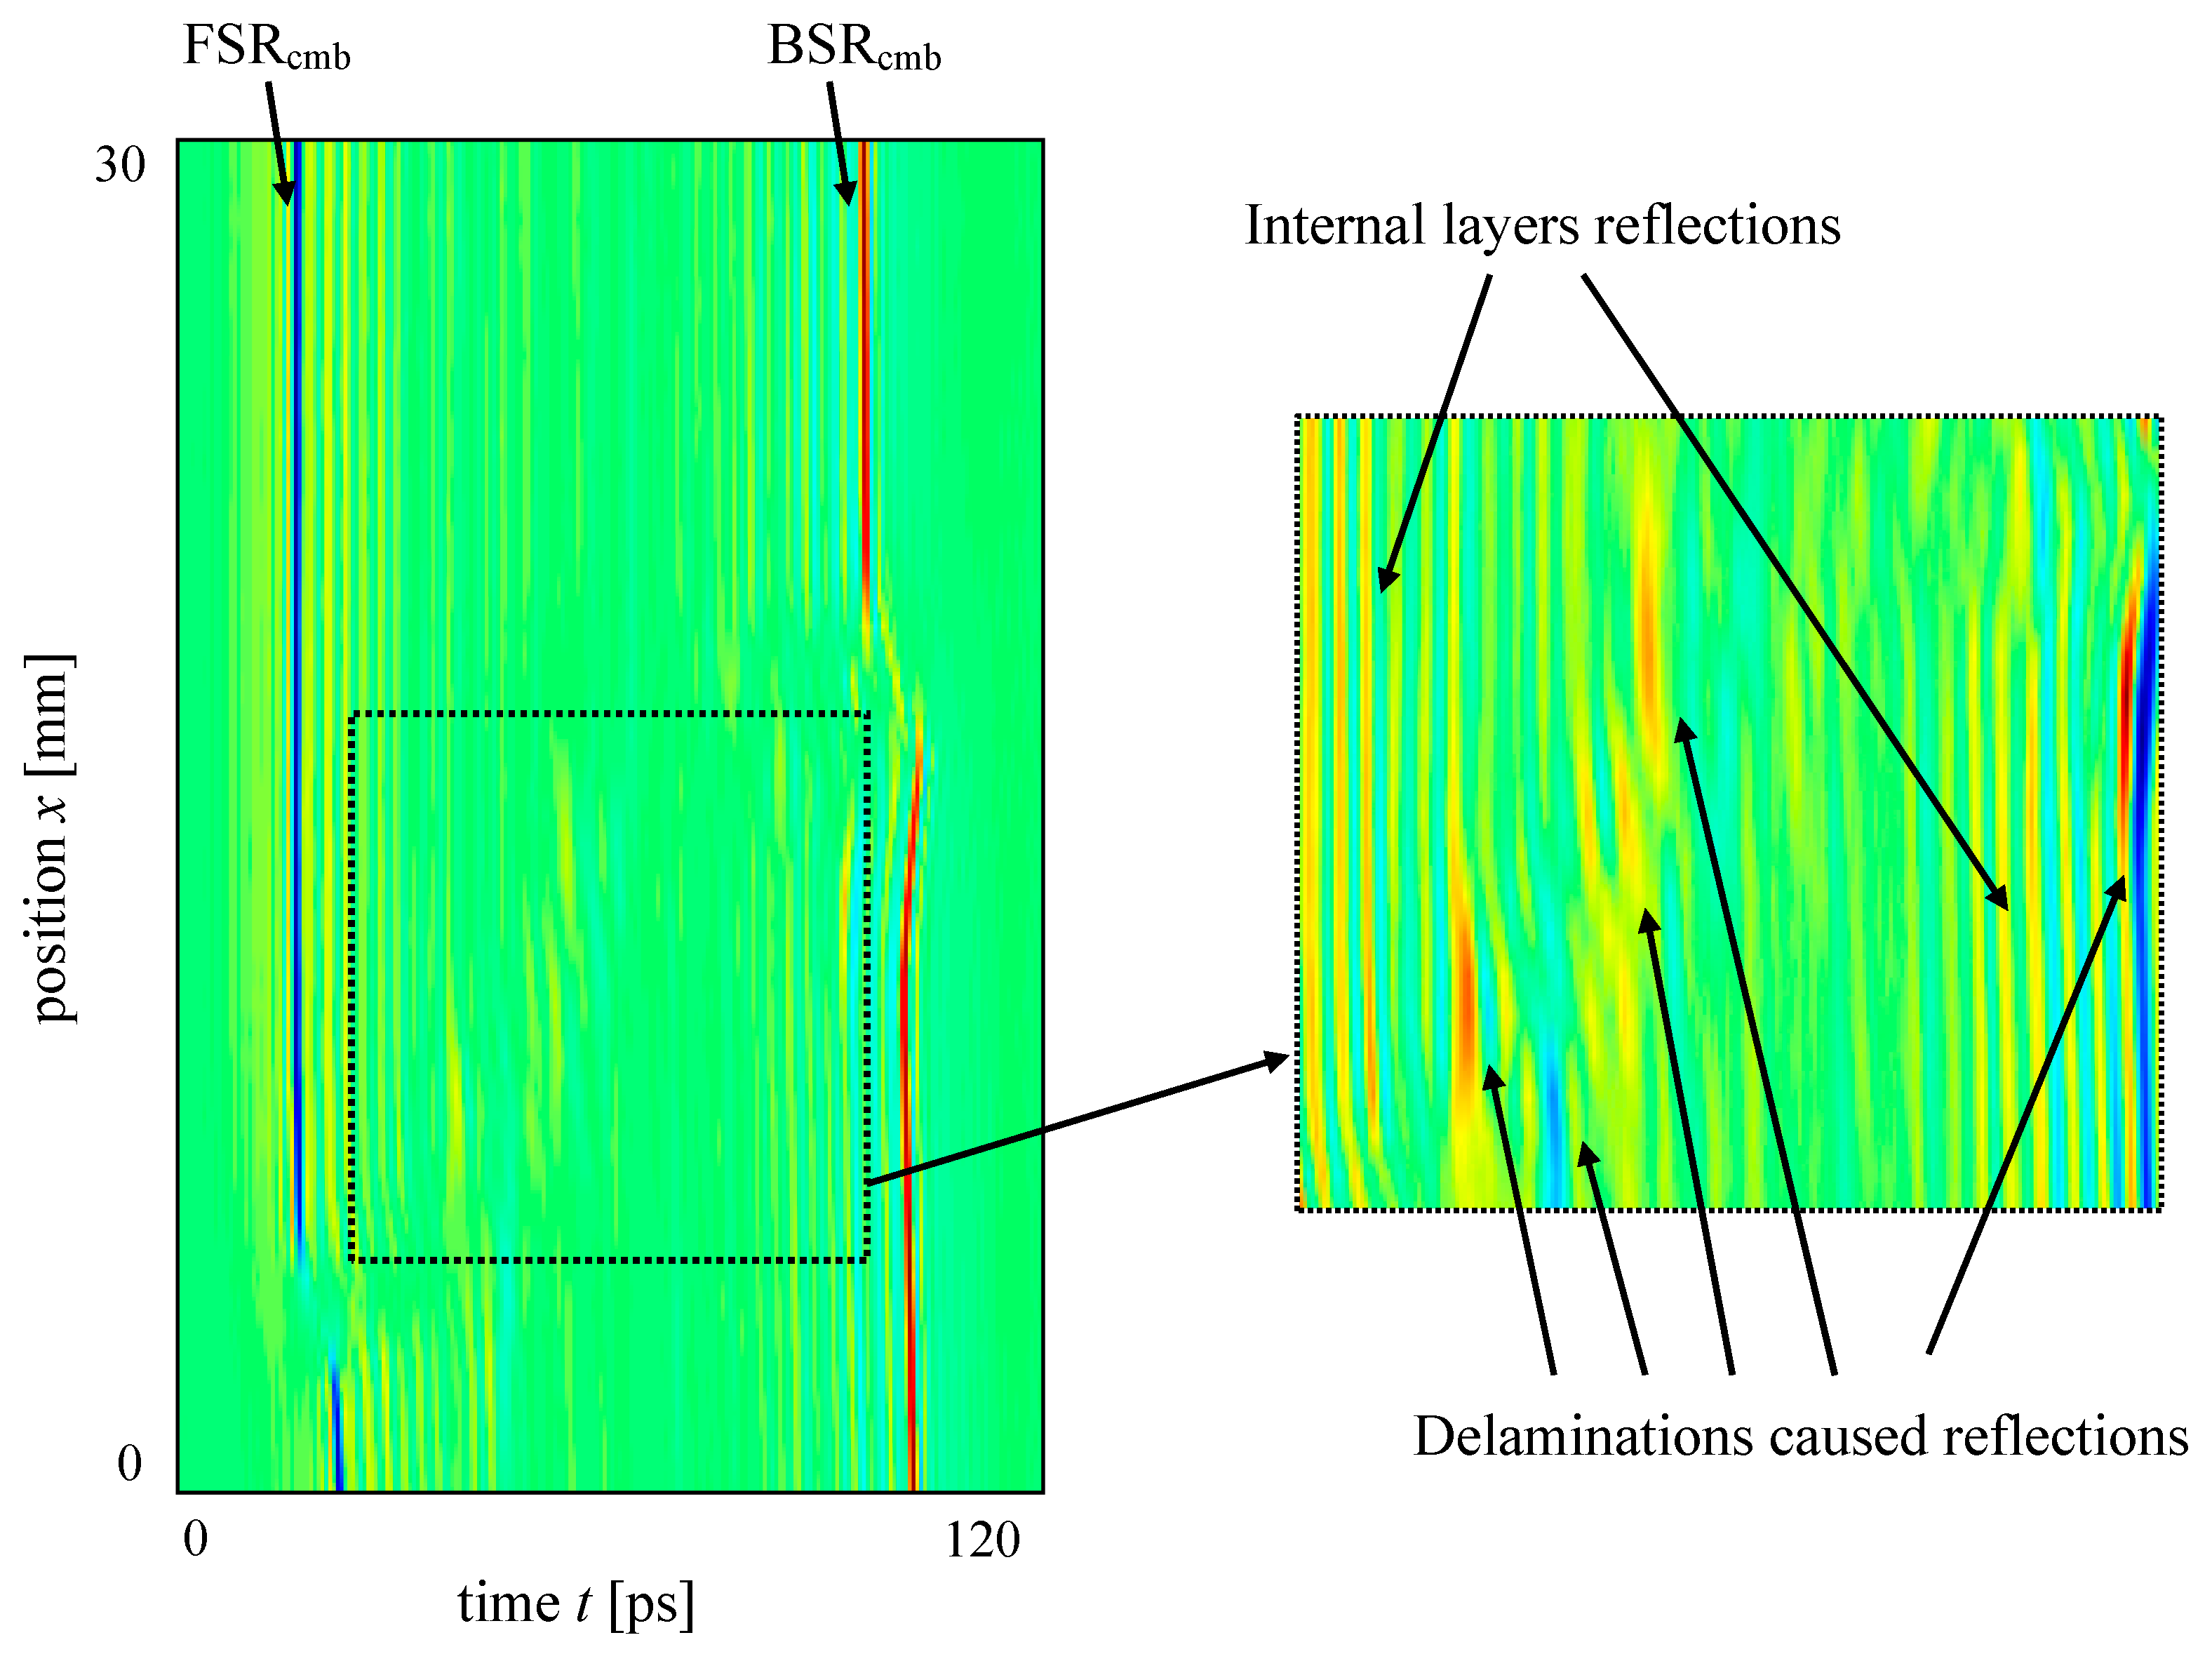
The B-scan signal combined using the proposed algorithm is presented in Figure 13. In comparison to the results of standard, single-side inspection (shown in Figure 11), here both material-air interfaces have “sharp” indications and the layers’ response is noticeable over the whole cross-section of the examined structure (with maximum values in the vicinity of material boundaries). Moreover, the pulses caused by reflection from defects (mainly delaminations) are detectable even on the background of the layers’ responses.

4. Conclusions

In this work an improvement of a relatively new nondestructive testing technique—pulsed terahertz inspection—is presented. An algorithm of double-sided inspection and obtained data treatment was proposed in order to preserve information about the layer arrangement in a multilayered composite structures. The reasons for the loss of this information in the case of the standard pulsed THz inspection technique were briefly characterized. The proposed algorithm is based on double-sided reflection measurement, deconvolution, and weighted summing. The weighting functions were obtained as envelopes of analytically-calculated signals. In this step some knowledge about examined structure is needed (material type—permittivity, thickness, number of layers), but even if not all of this information is available—a normalized weighting functions wnCH1(t) and wnCH2(t) can be calculated based on approximation Equation (2) and measured signal, without application of analytical model. It is possible, because the character of the layer reflection response (exponential decay) is similar in the case of all multilayered materials as long as there is one type of layer within the whole thickness.
The algorithm was validated using glass fiber-reinforced composite consisting of 30 layers and subjected to stress. As was expected, the application of the proposed algorithm enabled the preservation of weak signals of layer reflections in the case of layers situated over opposite sides of the examined structure. Retaining the layers’ reflection response has no negative influence on defects’ responses and detection. In the case of very thick or lossy samples, the problem with BSR pulse detection may appear, which can prevent proper matching of gmCH1 and gmCH2 signals. Additionally visible layer response (Figure 6) can be attenuated before reaching the central area of the material cross-section. In this case, in the center of the combined signal gcmb(t) the amplitude and SNR are very low.
An application of proposed technique is possible only if there is an access to both sides of examined structure (restriction as in case of transmission inspection) and two channel measurements are available. If the latter condition is not fulfilled, inspection can be performed with two separate single-side measurements, but it doubles the examination time. Moreover, the proposed technique can be utilized for nonconductive materials, like polymer composites reinforced with glass, basalt, Kevlar, and natural fibers. Thus, polymer, ceramic or composite coatings of metallic objects cannot be examined using the proposed algorithm.

Acknowledgments

The work was funded by the Rector's Scholarship Fund and Research Fund of Faculty of Electrical Engineering (West Pomeranian University of Technology, Szczecin, Poland).

Conflicts of Interest

The author declares no conflict of interest.

References

  1. Wang, R.M.; Zheng, S.R.; Zheng, Y. Polymer Matrix Composites and Technology, 1st ed.; Woodhead Publishing: Cambridge, UK, 2011. [Google Scholar]
  2. Lopato, P.; Szymanik, B.; Psuj, G. Nondestructive inspection of thin basalt fiber reinforced composites using combined terahertz imaging and infrared thermography. Adv. Mater. Sci. Eng. 2016. [Google Scholar] [CrossRef]
  3. Raj, B.; Jayakumar, T.; Thavasimuthu, M. Practical Non-Destructive Testing, 2nd ed.; Woodhead Publishing: Sawston, UK, 2002. [Google Scholar]
  4. Szymanik, B.; Psuj, G. Infrared and electromagnetic inspection of steel structures under load. Quant. InfraRed Thermogr. J. 2016, 13, 232–241. [Google Scholar] [CrossRef]
  5. Cheng, L.; Tian, G.Y. Comparison of Nondestructive Testing Methods on Detection of Delaminations in Composites. J. Sens. 2012, 2012, 408437. [Google Scholar] [CrossRef]
  6. Maldague, X. Theory and Practice of Infrared Technology for Nondestructive Testing; John Wiley and Sons: Hoboken, NJ, USA, 2001. [Google Scholar]
  7. Balageas, D.; Maldague, X.; Burleigh, D.; Vavilov, V.P.; Oswald-Tranta, B.; Roche, J.M.; Pradere, C.; Carlomagno, G.M. Thermal (IR) and other NDT techniques for improved material inspection. J. Nondestruct. Eval. 2016, 35, 18. [Google Scholar] [CrossRef]
  8. Chady, T.; Psuj, G. Data Fusion From Multidirectional Remanent Flux Leakage Transducers for Nondestructive Testing of Stress-and Fatigue-Loaded Steel Samples. IEEE Trans. Magn. 2008, 44, 3285–3288. [Google Scholar] [CrossRef]
  9. Naftaly, M.; Clake, R.G.; Humphreys, D.A.; Ridler, N.M. Metrology State-of-the-Art and Challenges in Broadband Phase-Sensitive Terahertz Measurements. Proc. IEEE 2017, 105, 1151–1165. [Google Scholar] [CrossRef]
  10. Naito, K.; Kagawa, Y.; Utsuno, S.; Naganuma, T.; Kurihara, K. Dielectric properties of woven fabric glass fiber reinforced polymer-matrix composites in the THz frequency range. Compos. Sci. Technol. 2009, 69, 2027–2029. [Google Scholar] [CrossRef]
  11. Wallace, V.P.; Macpherson, E.; Zeitler, J.A.; Reid, C. Three-dimensional imaging of optically opaque materials using nonionizing terahertz radiation. J. Opt. Soc. Am. 2008, 25, 3120–3133. [Google Scholar] [CrossRef]
  12. Parrott, E.P.; Sy, S.M.; Blu, T.; Wallace, V.P.; Pickwell-MacPherson, E. Terahertz pulsed imaging in vivo: Measurements and processing methods. J. Biomed. Opt. 2011, 16, 106010. [Google Scholar] [CrossRef] [PubMed]
  13. Mittleman, D.M.; Gupta, M.; Neelamani, R.; Baraniuk, R.G.; Rudd, J.V.; Koch, M. Recent advances in terahertz imaging. Appl. Phys. B 1999, 68, 1085–1094. [Google Scholar] [CrossRef]
  14. Mittelman, D. Sensing with Terahertz Radiation; Springer: Berlin, Germany, 2010. [Google Scholar]
  15. Palka, N.; Miedzińska, D. Detailed non-destructive evaluation of UHMWPE composites in the terahertz range. Opt. Quantum Electron. 2014, 46, 515–525. [Google Scholar] [CrossRef]
  16. Jin, Y.S.; Kim, G.J.; Jeon, S.G. Terahertz dielectric properties of polymers. J. Korean Phys. Soc. 2006, 49, 513–517. [Google Scholar]
  17. Dolganova, I.; Zaytsev, K.; Metelkina, A.; Yakovlev, E.; Karasik, V.; Yurchenko, S. Combined terahertz imaging system for enhanced imaging quality. Opt. Quant. Electron. 2016, 48, 325. [Google Scholar] [CrossRef]
  18. Chang, T.; Zhang, X.; Zhang, X.; Cui, H.-L. Accurate determination of dielectric permittivity of polymers from 75 GHz to 1.6 THz using both S-parameters and transmission spectroscopy. Appl. Opt. 2017, 56, 3287–3292. [Google Scholar] [CrossRef] [PubMed]
  19. Jassim, H.; Abdullah, I.; Shaban, A. THz spectra identification and classification of explosives, illicit drugs, based on BP-ANN and PSO-ANN algorithms. Eur. J. Sci. Res. 2012, 74, 487–494. [Google Scholar]
  20. Liang, M.; Shen, J.; Wang, G. Identification of illicit drugs by using SOM neural networks. J. Phys. D Appl. Phys. 2008, 41, 135306. [Google Scholar] [CrossRef]
  21. Ferguson, B.; Wang, S.; Gray, D.; Abbott, D.; Zhang, X. Identification of biological tissue using chirped probe THz imaging. Microelectron. J. 2002, 33, 1043–1051. [Google Scholar] [CrossRef]
  22. Grootendorst, M.R.; Fitzgerald, A.J.; de Koning, S.G.B.; Santaolalla, A.; Portieri, A.; Van Hemelrijck, M.; Young, M.R.; Owen, J.; Cariati, M.; Pepper, M.; et al. Use of a handheld terahertz pulsed imaging device to differentiate benign and malignant breast tissue. Biomed. Opt. Express 2017, 8, 2932–2945. [Google Scholar] [CrossRef]
  23. Malinowski, P.; Palka, N.; Opoka, S.; Wandowski, T.; Ostachowicz, W. Moisture detection in composites by terahertz spectroscopy. J. Phys. Conf. Ser. 2015, 628, 012100. [Google Scholar] [CrossRef]
  24. Zeitler, J.A.; Shen, Y.C. Industrial applications of terahertz imaging. In Terahertz Spectroscopy and Imaging, Springer Series in Optical Sciences; Peiponen, K.E., Zeitler, A., Kuwata-Gonokami, M., Eds.; Springer: Berlin, Germany, 2013; Volume 171, pp. 451–489. [Google Scholar]
  25. Yakovlev, E.; Zaytsev, K.; Dolganova, I.; Yurchenko, S. Non-destructive evaluation of polymer composite materials at the manufacturing stage using terahertz pulsed spectroscopy. IEEE Trans. Terahertz Sci. Technol. 2015, 5, 810–816. [Google Scholar] [CrossRef]
  26. El Haddad, J.; Bousquet, B.; Canioni, L.; Mounaix, P. Review in terahertz spectral analysis. Trends Anal. Chem. 2013, 44, 98–105. [Google Scholar] [CrossRef]
  27. Li, M.; Dai, G.; Chang, T.; Shi, C.; Wei, D.; Du, C.; Cui, H.L. Accurate determination of geographical origin of tea based on terahertz spectroscopy. Appl. Sci. 2017, 7, 172. [Google Scholar] [CrossRef]
  28. Lopato, P.; Chady, T. Terahertz detection and identification of defects in layered polymer composites and composite coatings. Nondestruct. Test. Eval. 2013, 28, 28–43. [Google Scholar] [CrossRef]
  29. Yakovlev, E.; Zaytsev, K.; Chernomyrdin, N.; Gavdush, A.; Zotov, A.; Nikonovich, M.; Yurchenko, S. Non-destructive testing of composite materials using terahertz time-domain spectroscopy. Proc. SPIE 2016. [Google Scholar] [CrossRef]
  30. Ahi, K.; Anwar, M. Advanced terahertz techniques for quality control and counterfeit detection. Proc. SPIE 2016. [Google Scholar] [CrossRef]
  31. Ahi, K.; Anwar, M. Developing terahertz imaging equation and enhancement of the resolution of terahertz images using deconvolution. Proc. SPIE 2016. [Google Scholar] [CrossRef]
  32. Ferguson, B.; Wang, S.; Gray, D.; Abbott, D.; Zhang, X.C. Towards functional 3D T-ray imaging. Phys. Med. Biol. 2002, 47, 3735–3742. [Google Scholar] [CrossRef] [PubMed]
  33. Wang, S.; Zhang, X.C. Pulsed terahertz tomography. J. Phys. D Appl. Phys. 2004, 37, R1–R36. [Google Scholar] [CrossRef]
  34. Zimdars, D.; Fichter, G.; Chemovski, A. Time domain terahertz computed axial tomography for nondestructive evaluation. Rev. Quant. Nondestruct. Eval. 2009, 28, 426–433. [Google Scholar]
  35. Choi, H.; Son, J.H. Terahertz imaging and tomography techniques. In Terahertz Biomedical Science and Technology; Son, J.H., Ed.; CRC Press: Boca Raton, FL, USA, 2014; pp. 47–66. [Google Scholar]
  36. Guillet, J.P.; Recur, B.; Frederique, L.; Bousquet, B.; Canioni, L.; Manek-Honninger, I.; Desbarats, P.; Mounaix, P. Review of terahertz tomography techniques. J. Infrared Millim. Terahertz Waves 2014, 35, 382–411. [Google Scholar] [CrossRef]
  37. Hack, E.; Valzania, L.; Gäumann, G.; Shalaby, M.; Hauri, C.P.; Zolliker, P. Comparison of Thermal Detector Arrays for Off-Axis THz Holography and Real-Time THz Imaging. Sensors 2016, 16, 221. [Google Scholar] [CrossRef] [PubMed]
  38. Yang, J.R.; Lee, W.J.; Han, S.T. Signal-Conditioning Block of a 1x200 CMOS Detector Array for a Terahertz Real-Time Imaging System. Sensors 2016, 16, 319. [Google Scholar] [CrossRef] [PubMed]
  39. Boukhayma, A.; Dupret, A.; Rostaing, J.P.; Enz, C. A Low-Noise CMOS THz Imager Based on Source Modulation and an In-Pixel High-Q Passive Switched-Capacitor N-Path Filter. Sensors 2016, 16, 325. [Google Scholar] [CrossRef] [PubMed]
  40. Santamarina, J.; Fratta, D. Discrete Signals and Inverse Problems: An Introduction for Engineers and Scientists; John Wiley & Sons: Chichester, UK, 2005; pp. 249–284. [Google Scholar]
  41. Collin, R.E. Field Theory of Guided Waves; Wiley-IEEE Press: New York, NY, USA, 1990. [Google Scholar]
  42. Lopato, P. Estimation of layered materials dielectric parameters using pulsed terahertz technique. Int. J. Appl. Electromagn. Mech. 2013, 43, 161–168. [Google Scholar]
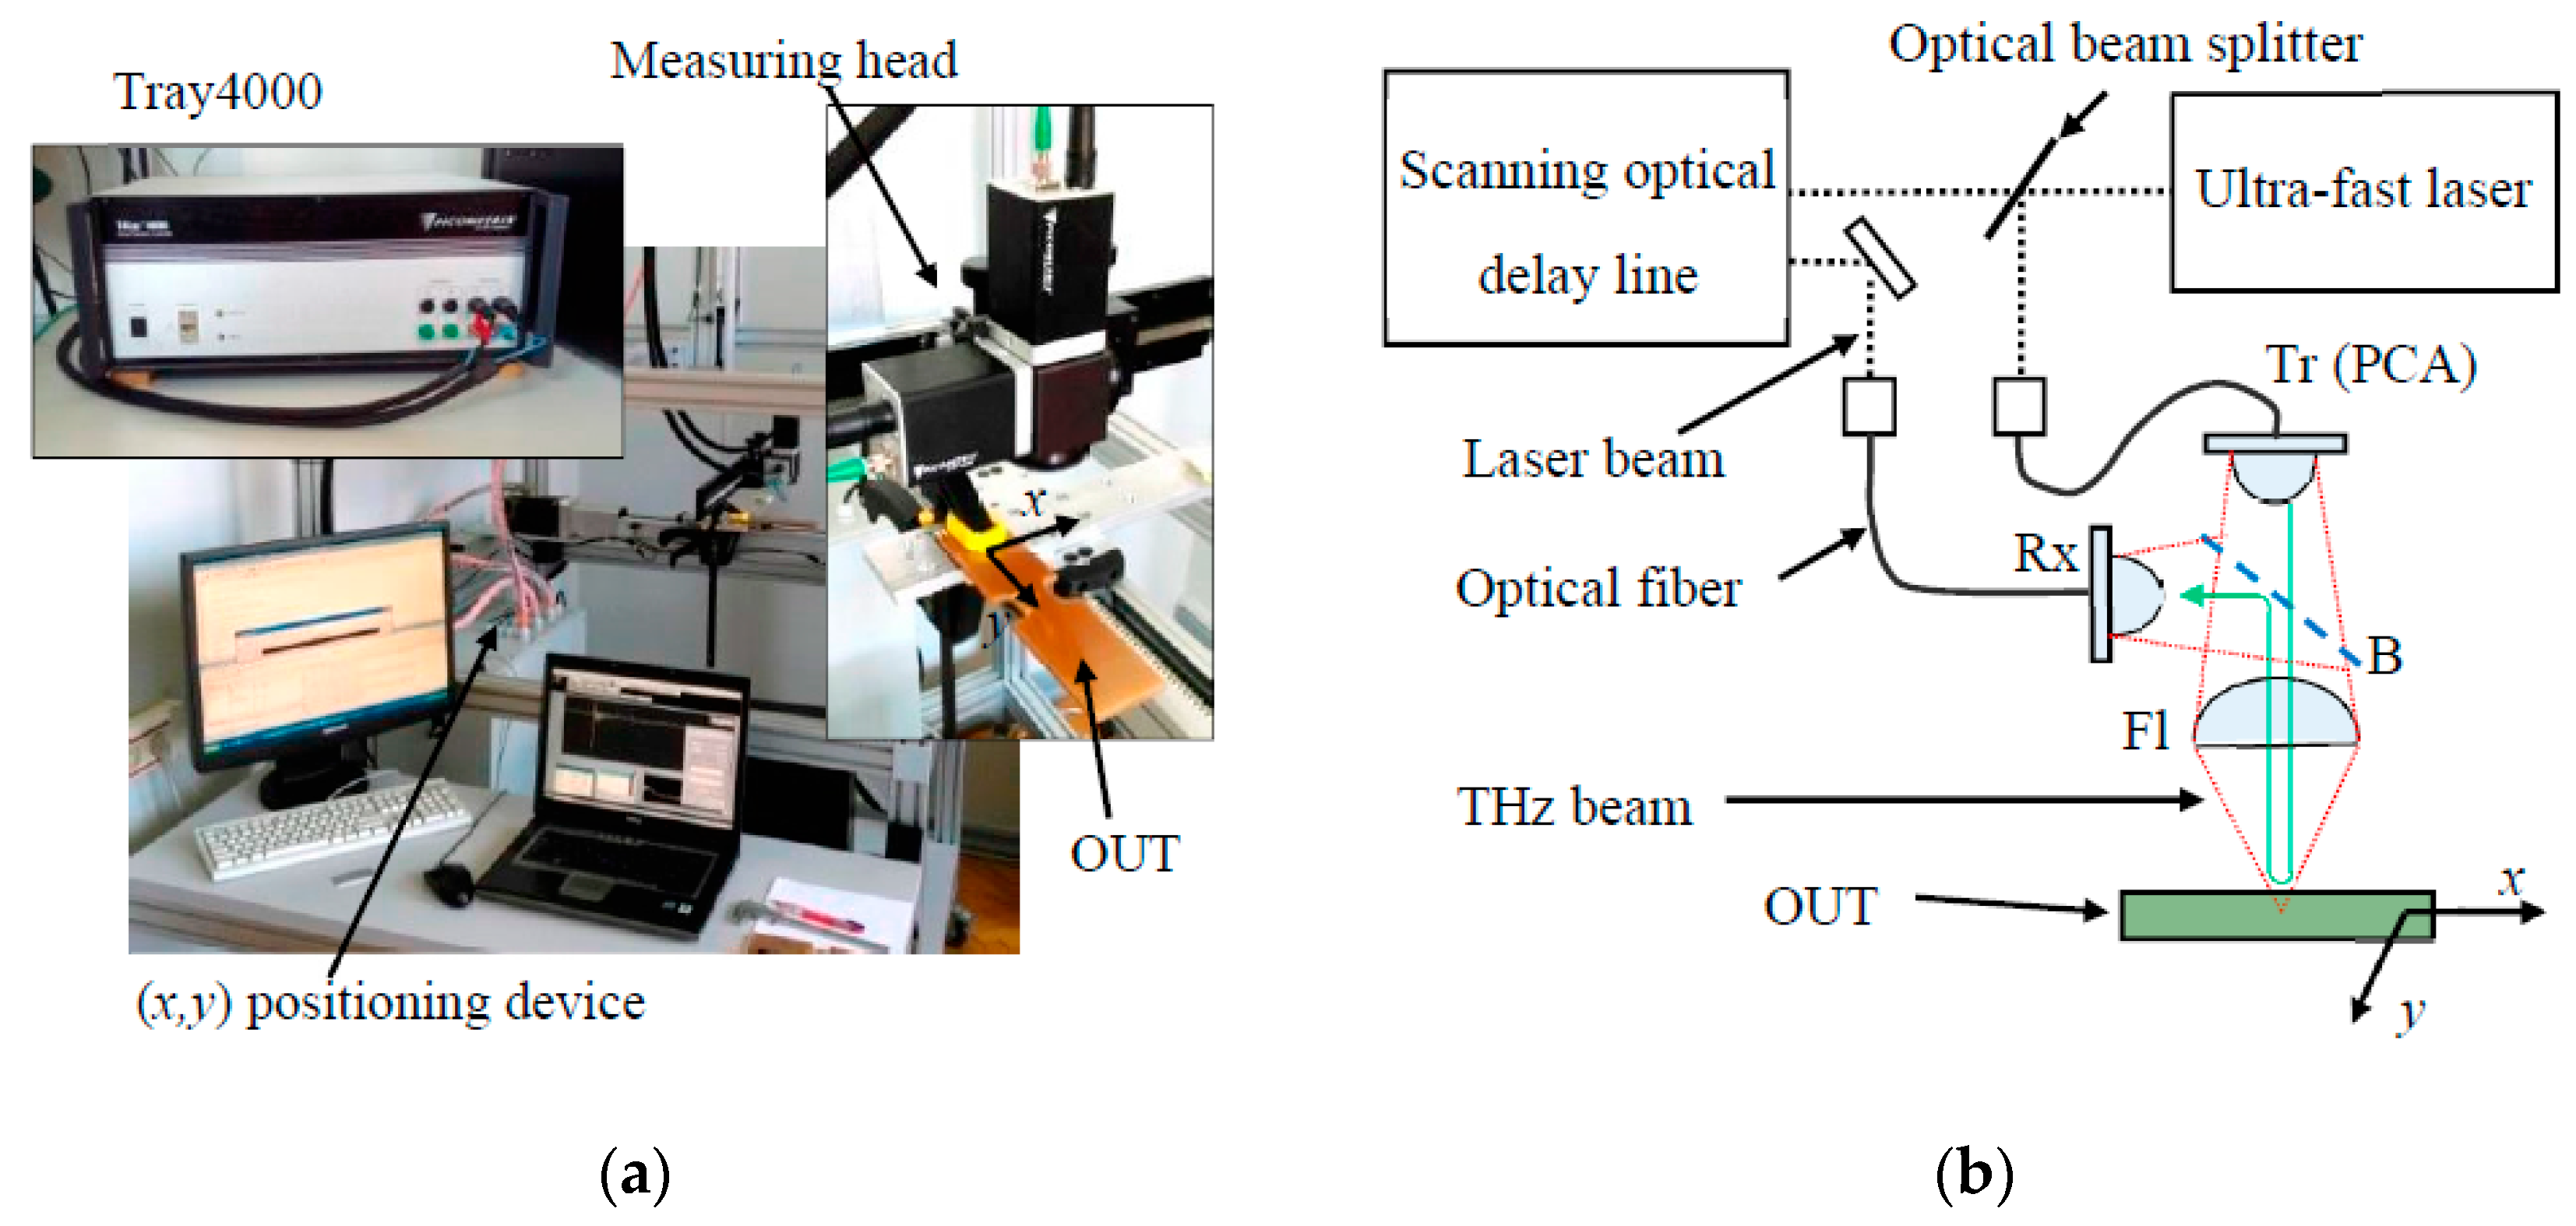
Figure 1. Utilized pulsed terahertz imaging system: (a) photo; and (b) simplified scheme; Tr—photoconductive transmitter, Rx—photoconductive receiver, OUT—object under test, Fl—focusing lens, B—beam splitter, PCA—photoconductive antenna.
Applsci 07 00661 g001
Figure 2. Structure of the photoconductive antenna and the basic measuring setup.
Applsci 07 00661 g002
Figure 3. Geometries utilized in composite materials evaluation using pulsed terahertz imaging: (a) transmission setup; (b) reflection “V” setup; (c) reflection setup with beam splitter; and (d) proposed geometry-double-sided measurement using reflection setup.
Applsci 07 00661 g003
Figure 4. Interaction of the Gaussian pulse with single dielectric layer; results of the 1D FDTD simulation for various time instances.
Applsci 07 00661 g004
Figure 5. Signals acquired in case of inspection of layered composite material (basalt fiber-reinforced) consisting of six layers: (a) A-scan; and (b) B-scan; FSR-front surface reflection, BSR—back surface reflection.
Applsci 07 00661 g005
Figure 6. Signals acquired in the case of the inspection of the layered composite material (glass fiber-reinforced) consisting of 30 layers: (a) A-scan; and (b) B-scan.
Applsci 07 00661 g006
Figure 7. An algorithm of double-sided terahertz inspection of a layered structures.
Applsci 07 00661 g007
Figure 8. Analytical model: (a) cascade connection of multiple layers; (b) block scheme of reflected signal calculation; (c) time domain excitation signal (and its spectrum) in the form of a wideband Gaussian pulse; and (d) the signal obtained using the analytical model for reflection arrangement (and its spectrum).
Applsci 07 00661 g008
Figure 9. Photo of the multilayered polymer composite structure subjected to stress resulting in multiple delaminations.
Applsci 07 00661 g009
Figure 10. Exemplary results of double-sided pulsed THz measurements for given (x,y) position (signal from channel 2 was multiplied by −1 and time-reversed according to the proposed algorithm).
Applsci 07 00661 g010
Figure 11. Exemplary B-scan signals obtained using double-sided inspection of a composite sample subjected to stress: (a) deconvolved channel 1 signal gmCH1(t,x); and (b) deconvolved channel 2 signal gmCH2(t,x).
Applsci 07 00661 g011
Figure 12. B-scan signals prepared for weighted summing: (a) deconvolved channel 1 signal gmCH1(t,x); and (b) time reversed channel 2 signal gmCH2(−t,x).
Applsci 07 00661 g012
Figure 13. Combined B-scan signal gcmb(t,x) using the proposed algorithm.
Applsci 07 00661 g013