1. Introduction
Highway bridge expansion joints (BEJ) allow vehicles to move between two uncoupled, but even, adjacent road sections. Generally, a road built on a structure needs a longitudinal break to reduce the effects of hygrothermal and/or seismic deformations and tangential stresses due to the traffic. Sometimes, complex structure configurations of a bridge (e.g., arch bridge) permit avoiding BEJs, in addition assuring aesthetic results for the artwork [
1]. BEJ should absorb possible displacements of the two parts, ensure bending and shear transmission and guarantee safe traffic circulation in every condition (dry, wet, warm, freeze, etc.) during the service life [
2]. Moreover, they should absorb all actions induced by the relative displacements of coupled structures: thermal variations, wheel dynamic vertical loads, braking and other horizontal forces [
3].
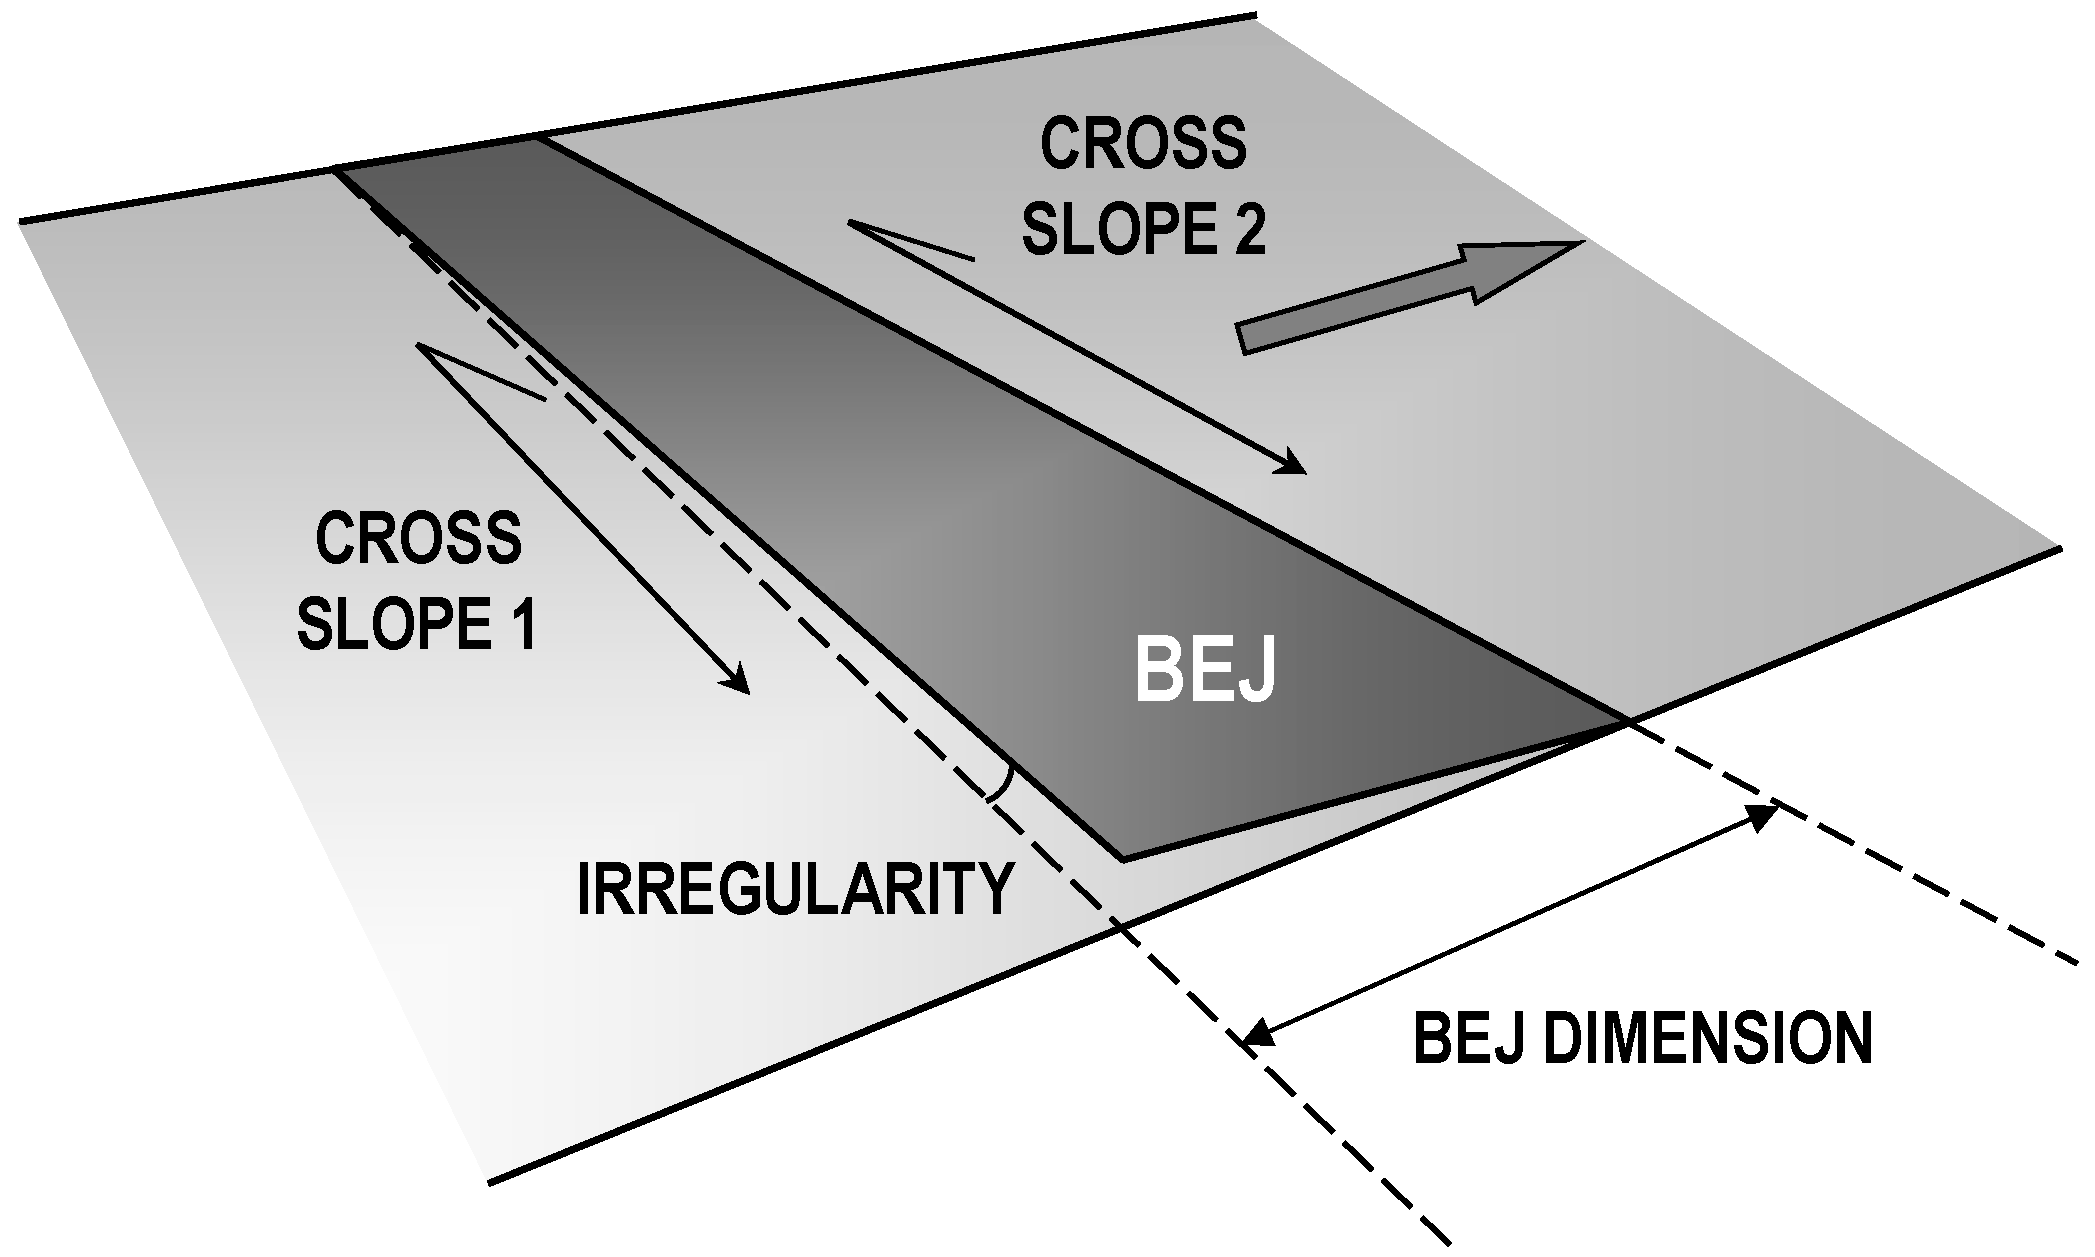
BEJ presents a planarity problem when the joint is located in a transaction section of the road (transition curve-clothoid) between two consequent road elements with different curvatures. In fact, in this section, the road transversal slope is changing between the values necessary in two adjacent elements with different horizontal curvatures. Consequently, in this transitional area, the road pavement is characterized by a skew or slanted surface (
Figure 1) and, if the joint is large (e.g., a highway seismic joint), the vertical irregularity between road and joint can reach values of some centimeters.
This undesirable local irregularity in addition to the construction unevenness can cause important dynamic actions on running vehicles, the bridge structure and joints [
4,
5].
In this case, dynamic actions induced by vehicle tires stress BEJ. Traffic running on bridges produces a stress spectrum, which may cause fatigue. The stress spectrum depends on various parameters: the geometry of the vehicles, the axle loads, the vehicle spacing, superficial characteristics of the pavement (unevenness) [
6], the composition of the traffic and its dynamic effects. Several repetitions of these dynamic loads during the design life of the pavement can cause a rapid and general decay of the structure or local breaks in correspondence with the BEJ, although well-constructed [
7]. A BEJ is anyhow a discontinuity of the pavement, and dynamic actions caused by heavy vehicles running on it cannot be overlooked. For this reason, in Eurocode 1 [
8], where traffic loads on bridges are described, it is specified that in the proximity of expansion joints, an additional dynamic amplification factor should be applied. In this sense, the same Eurocode also suggests a conservative simplification consisting of adopting an amplification factor of 1.3 for any cross section within 6 m from the expansion joint.
Following specific recommendations for the fatigue design of modular bridge expansion joints [
7], it is possible to avoid BEJs’ durability problems. In any case, the unevenness induced by the presence of a BEJ still remains, and in certain conditions (i.e., BEJ located in road transition curve), it can worsen.
In particular, this paper focuses on the analysis of the detrimental effects induced by BEJ unevenness in terms of road safety, dynamic increment of wheel loads transmitted to the pavement and vehicle components’ stress.
2. Heavy Vehicle-Bridge Interaction: The Expansion Joint Role
Moving heavy vehicles apply to roads and bridges wheel (dynamic) loads, which are higher than nominal (static) loads. Static loads depend on the total weight of the vehicle and its geometric axle configuration, whereas dynamic wheel forces depend on the road pavement profile, functional characteristics of the vehicle (e.g., geometry, mass and stiffness distribution, tire and suspension type, operative speed) and structural characteristics of the bridge superstructure (i.e., span length, geometry, static scheme, natural frequencies and damping).
Unevennesses due to a road BEJ can produce important dynamic load increments: this depends on the interaction between running vehicles and the bridge superstructure, as well as the interactions between structural components and vehicles [
9].
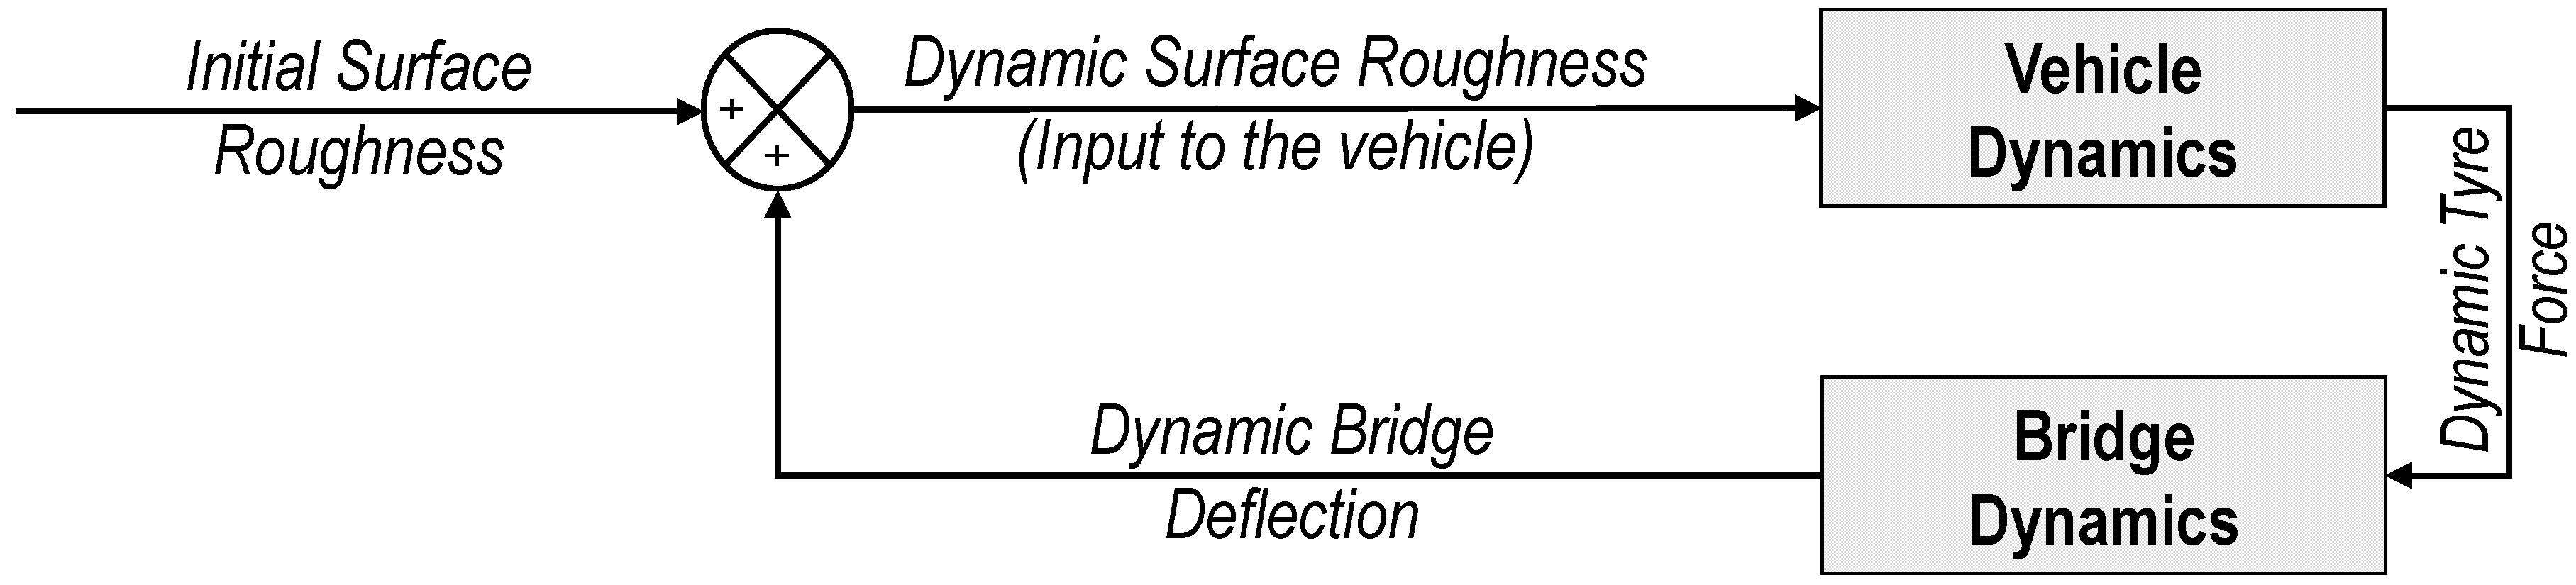
Figure 2 shows the dynamic interaction (coupling) between vehicle and bridge [
10].
The roughness input to the vehicle is the sum of the initial surface profile of the pavement and the dynamic deflection of the bridge. This input excites the vehicle and results in dynamic tire forces. Finally, these forces are in turn applied to the bridge and cause larger dynamic displacements of the bridge [
11].
The largest bridge vibration occurs when the bridge’s and vehicle’s natural frequencies are similar [
12]. It is not clear, however, if large bridge responses are mainly due to excitation of the vehicle caused by the initial roughness profile, or by the dynamic deflection of the bridge. There was little systematic study concerning the conditions when dynamic interaction is important and when the two systems may be regarded as essentially uncoupled.
According to Cantieni [
13], bridges with a fundamental natural frequency
f 2.5–4 Hz (maximum span
L 25–40 m) are more susceptible to the dynamic actions of heavy commercial vehicles (equipped with steel leaf suspensions) than bridges with a fundamental frequency lying outside this range. This difference is because the wheel loads of such vehicles have a predominant frequency content in the same range [
13]. This effect is known as “frequency-matching”: it leads to dynamic amplification of the corresponding strong dynamic bridge response, a phenomenon also known as “quasi-resonance”.
The DIVINE (Dynamic Interaction between Vehicles and Infrastructure Experiment) research [
14] correlated the dynamic bridge response under traffic to the length-span bridge:
Long-span element of bridges (L > 100 m): The type of vehicle suspension is not very significant unless the road profile is poor. Furthermore, the fundamental frequency of bridges is less than that of heavy vehicles, and thus, these bridges tend to attenuate the dynamic components of wheel forces.
Medium-span bridges (L 30–100 m): Frequency-matching with the truck body bounce frequencies occurs in medium-span bridges. The experimental dynamic responses were well within code recommendations for high-quality road profiles.
Short to medium-span bridges (
L 15–30 m): Bridges with natural frequencies within the range 4–8 Hz tend not to dynamically couple with vehicles at either body bounce or axle-hop frequencies, respectively characterized by frequency within the range of 1.5–4.0 and 8.0–15.0 Hz [
15].
Short-span bridges (L 8–15 m): “Quasi-resonance”, but with minimal amplification, occurs between short-span bridges and the axle-hop vibrations of heavy vehicles. The effects of body bounce are also transmitted to short-span bridges with minimal amplification. The dynamic response of short span bridges can be much larger than expected for dynamic effects.
The DIVINE research has shown that road profile, bridge natural frequency and bridge damping are important elements to be controlled. Road profile measurement is now routine, and signal processing technologies are relatively straightforward. The DIVINE project also demonstrated that dynamic vehicle models can accurately reproduce dynamic wheel forces, and many researchers have demonstrated that the bridge/vehicle interaction problem can be analytically solved [
12]. Some tools permit developing and validating bridge models including both road profile and bridge natural frequency [
16].
The model proposed by Green and Cebon [
10] consists of a single degree of freedom vehicle on a simply-supported bridge. It does not detail the nonlinearities of vehicle suspensions and the complexities of sprung mass motion, but it ensures a good representation of the problem.
Cantieni [
13] and Tan et al. [
17] elaborated multiple-degree-of-freedom models to describe dynamic bridge-vehicle interaction and found good agreement with experiments carried out on highway bridges. In these approaches, road unevenness is modeled by artificial profiles that simulate the desired roughness level [
18].
Green and Cebon [
10] performed a parametric study based on previously literature works [
19,
20,
21] and using the model proposed by Cantieni [
13]. The results of this study permit ascertaining when coupling is important and when it can be ignored. For highway bridges, the most important parameters are speed, frequency and initial vehicle excitation. Moreover, vehicle suspensions are important in determining the dynamic response of bridges under a single vehicle, as demonstrated both by the DIVINE results and by Woodrooffe et al. [
22]. Different suspension systems induce different dynamic loads on roads (i.e., amplitude and frequency content). For example, for roads in fair condition and at a speed of 80 km/h, the dynamic load induced by a truck fitted with airbag suspension is about 60% of the dynamic load induced by the same truck, but fitted with steel multi-leaf suspension [
22].
This paper presents a case study of a highway BEJ with a big unevenness due to the torsion of the cross-section along a transition curve. After five years of service life, it had partial breaks and superficial cracks in the head cross beam where it was located. Asphalt pavement before and after the BEJ was affected by severe distresses (e.g., cracking and rutting). Indeed, the impulsive vibrating actions of the heaviest and quickest vehicles produced a surface wear of the joint so important that its service condition was very unsafe. The geometric configuration of the road section is such that the allowable vehicle speed is quite high, and the concomitant presence of the joint determined the cause of many accidents, even serious ones, which have affected both light and heavy vehicles [
23]. The irregular circulation induced by the BEJ was causing hard braking and acceleration, which have environmental effects [
24]. Moreover, the condition of the BEJ had required several maintenance works during its even short service life.
The present work focuses on the geometric characterization of the BEJ and on the assessment of the effects on road traffic, with particular attention to heavy vehicles running on it. Specifically, safety and comfort analyses were carried out, evaluating also the dynamic increment of loads transmitted to the pavement (and then to the bridge) and the stress magnitude on vehicles’ mechanical components. The importance of these analyses is that the interpretation of their results is useful to identify strategies and procedures for policies to guarantee minimum safety levels at roads.
3. Methodology and Case of Study
The study of the bridge-vehicle interaction requires measuring and analytical treatment of the road profile and the dynamic wheel forces applied to the investigated BEJ.
The profile analysis allows evaluating general ride characteristics referring to standards, comfort and safety [
25] and choosing pavement sections where the warning values of the previous evaluation are reached and maintenance works needed [
26,
27,
28,
29].
The evenness properties of the road pavement profile can be measured using three different methodologies:
The acceleration analysis permits measuring dynamic tire forces and ride quality at different speeds. Moreover, it permits determining the main vehicle oscillation and vibration components in the frequency domain and comparing them to the first bridge’s natural frequency. This kind of analysis can be performed by means of in situ measurements [
31] and simulation models [
32]: both approaches were used in the present study.
3.1. Case Study: An Unevenness Bridge Joint
The case study refers to a steel girder bridge characterized by a 50 m-long span (medium-span bridge). According to experimental results published by Kim et al. [
12] for a span equal to 40.4 m, for this type of bridge, the fundamental natural frequencies of the first bending and torsion modes (respectively 2.33 and 3.86 Hz) are within the characteristic frequency range of heavy vehicles’ body bounce (1.5–4.0 Hz). For this reason, it is important to avoid the presence of localized irregularities that could increase the loads transmitted to the bridge structure during the passages of heavy vehicles on the bridge structure. Furthermore, the examined highway carries a high percentage of daily heavy vehicle traffic (
Table 1), whose effective traveling speed was found to be within the range of 80–120 km/h.
In the last five years, an accident rate higher than the national average value [
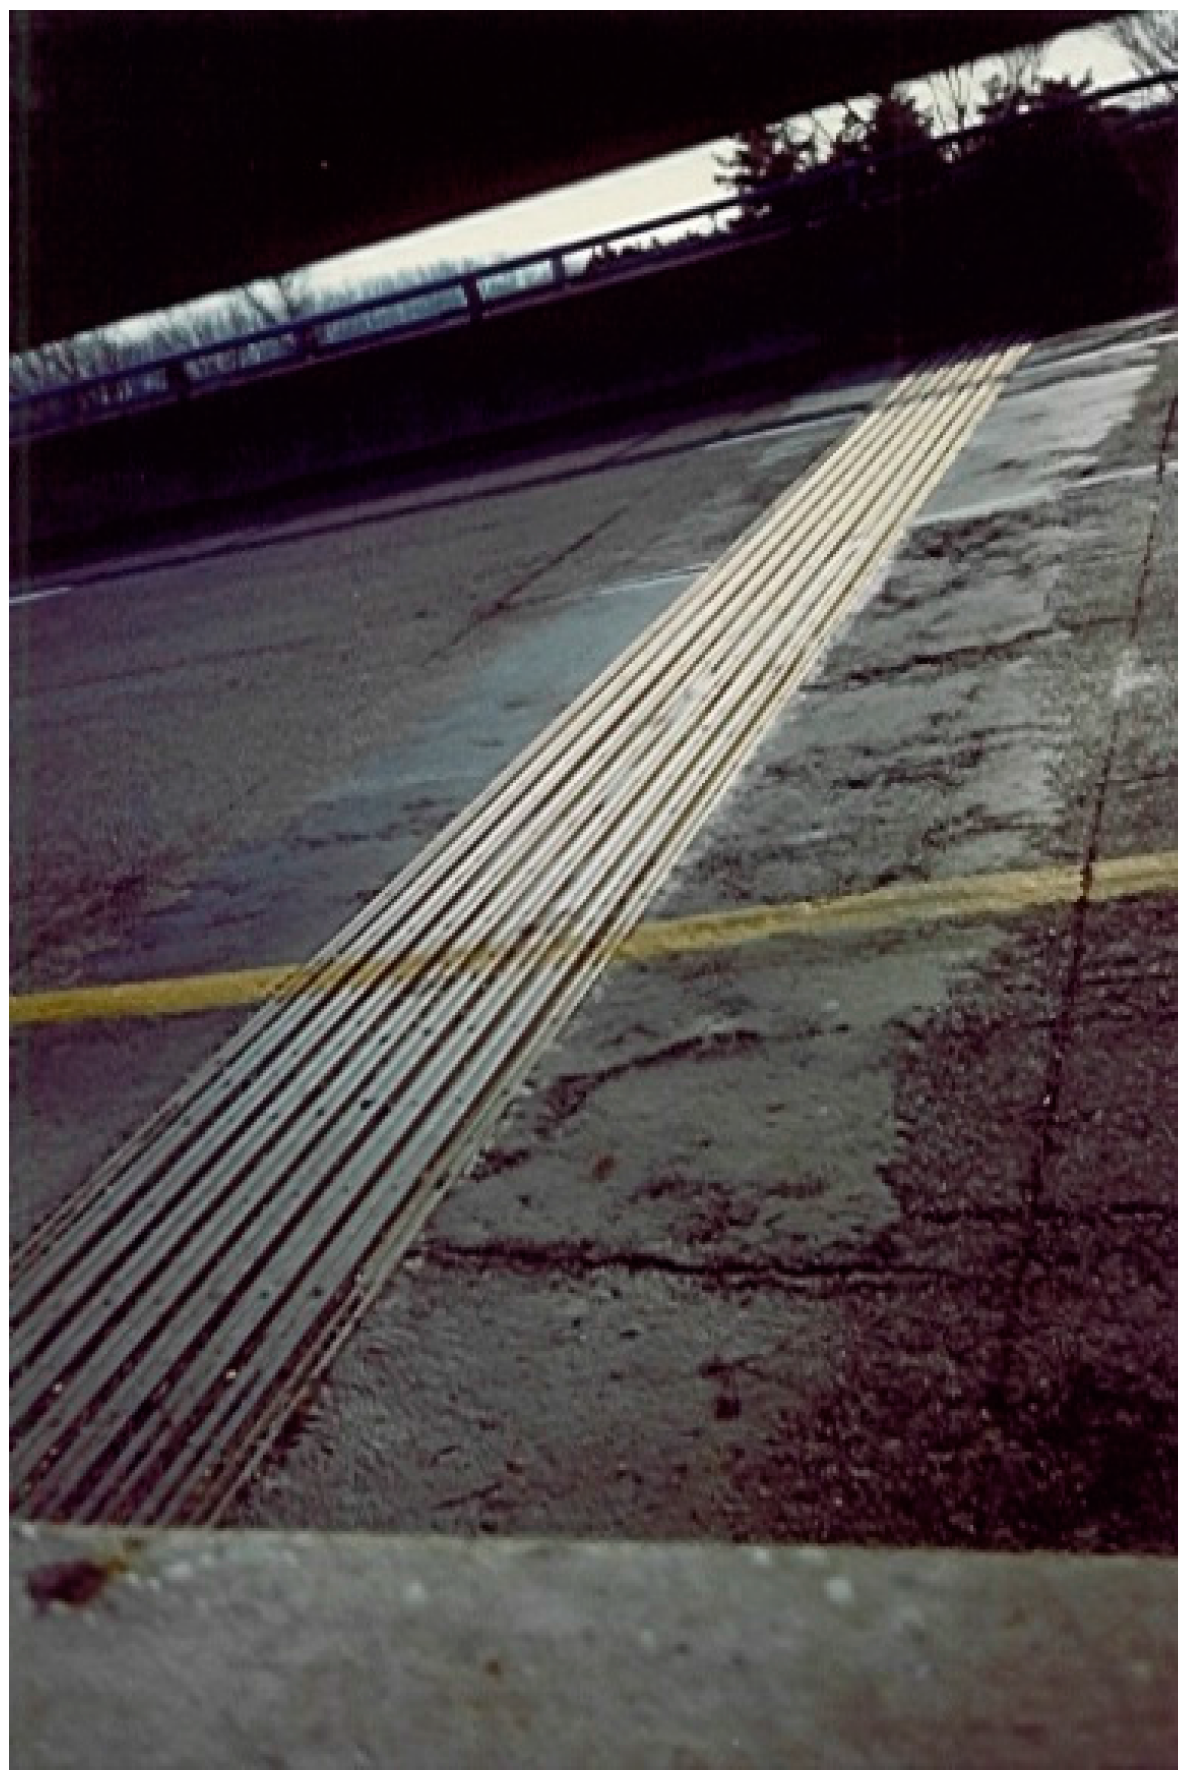
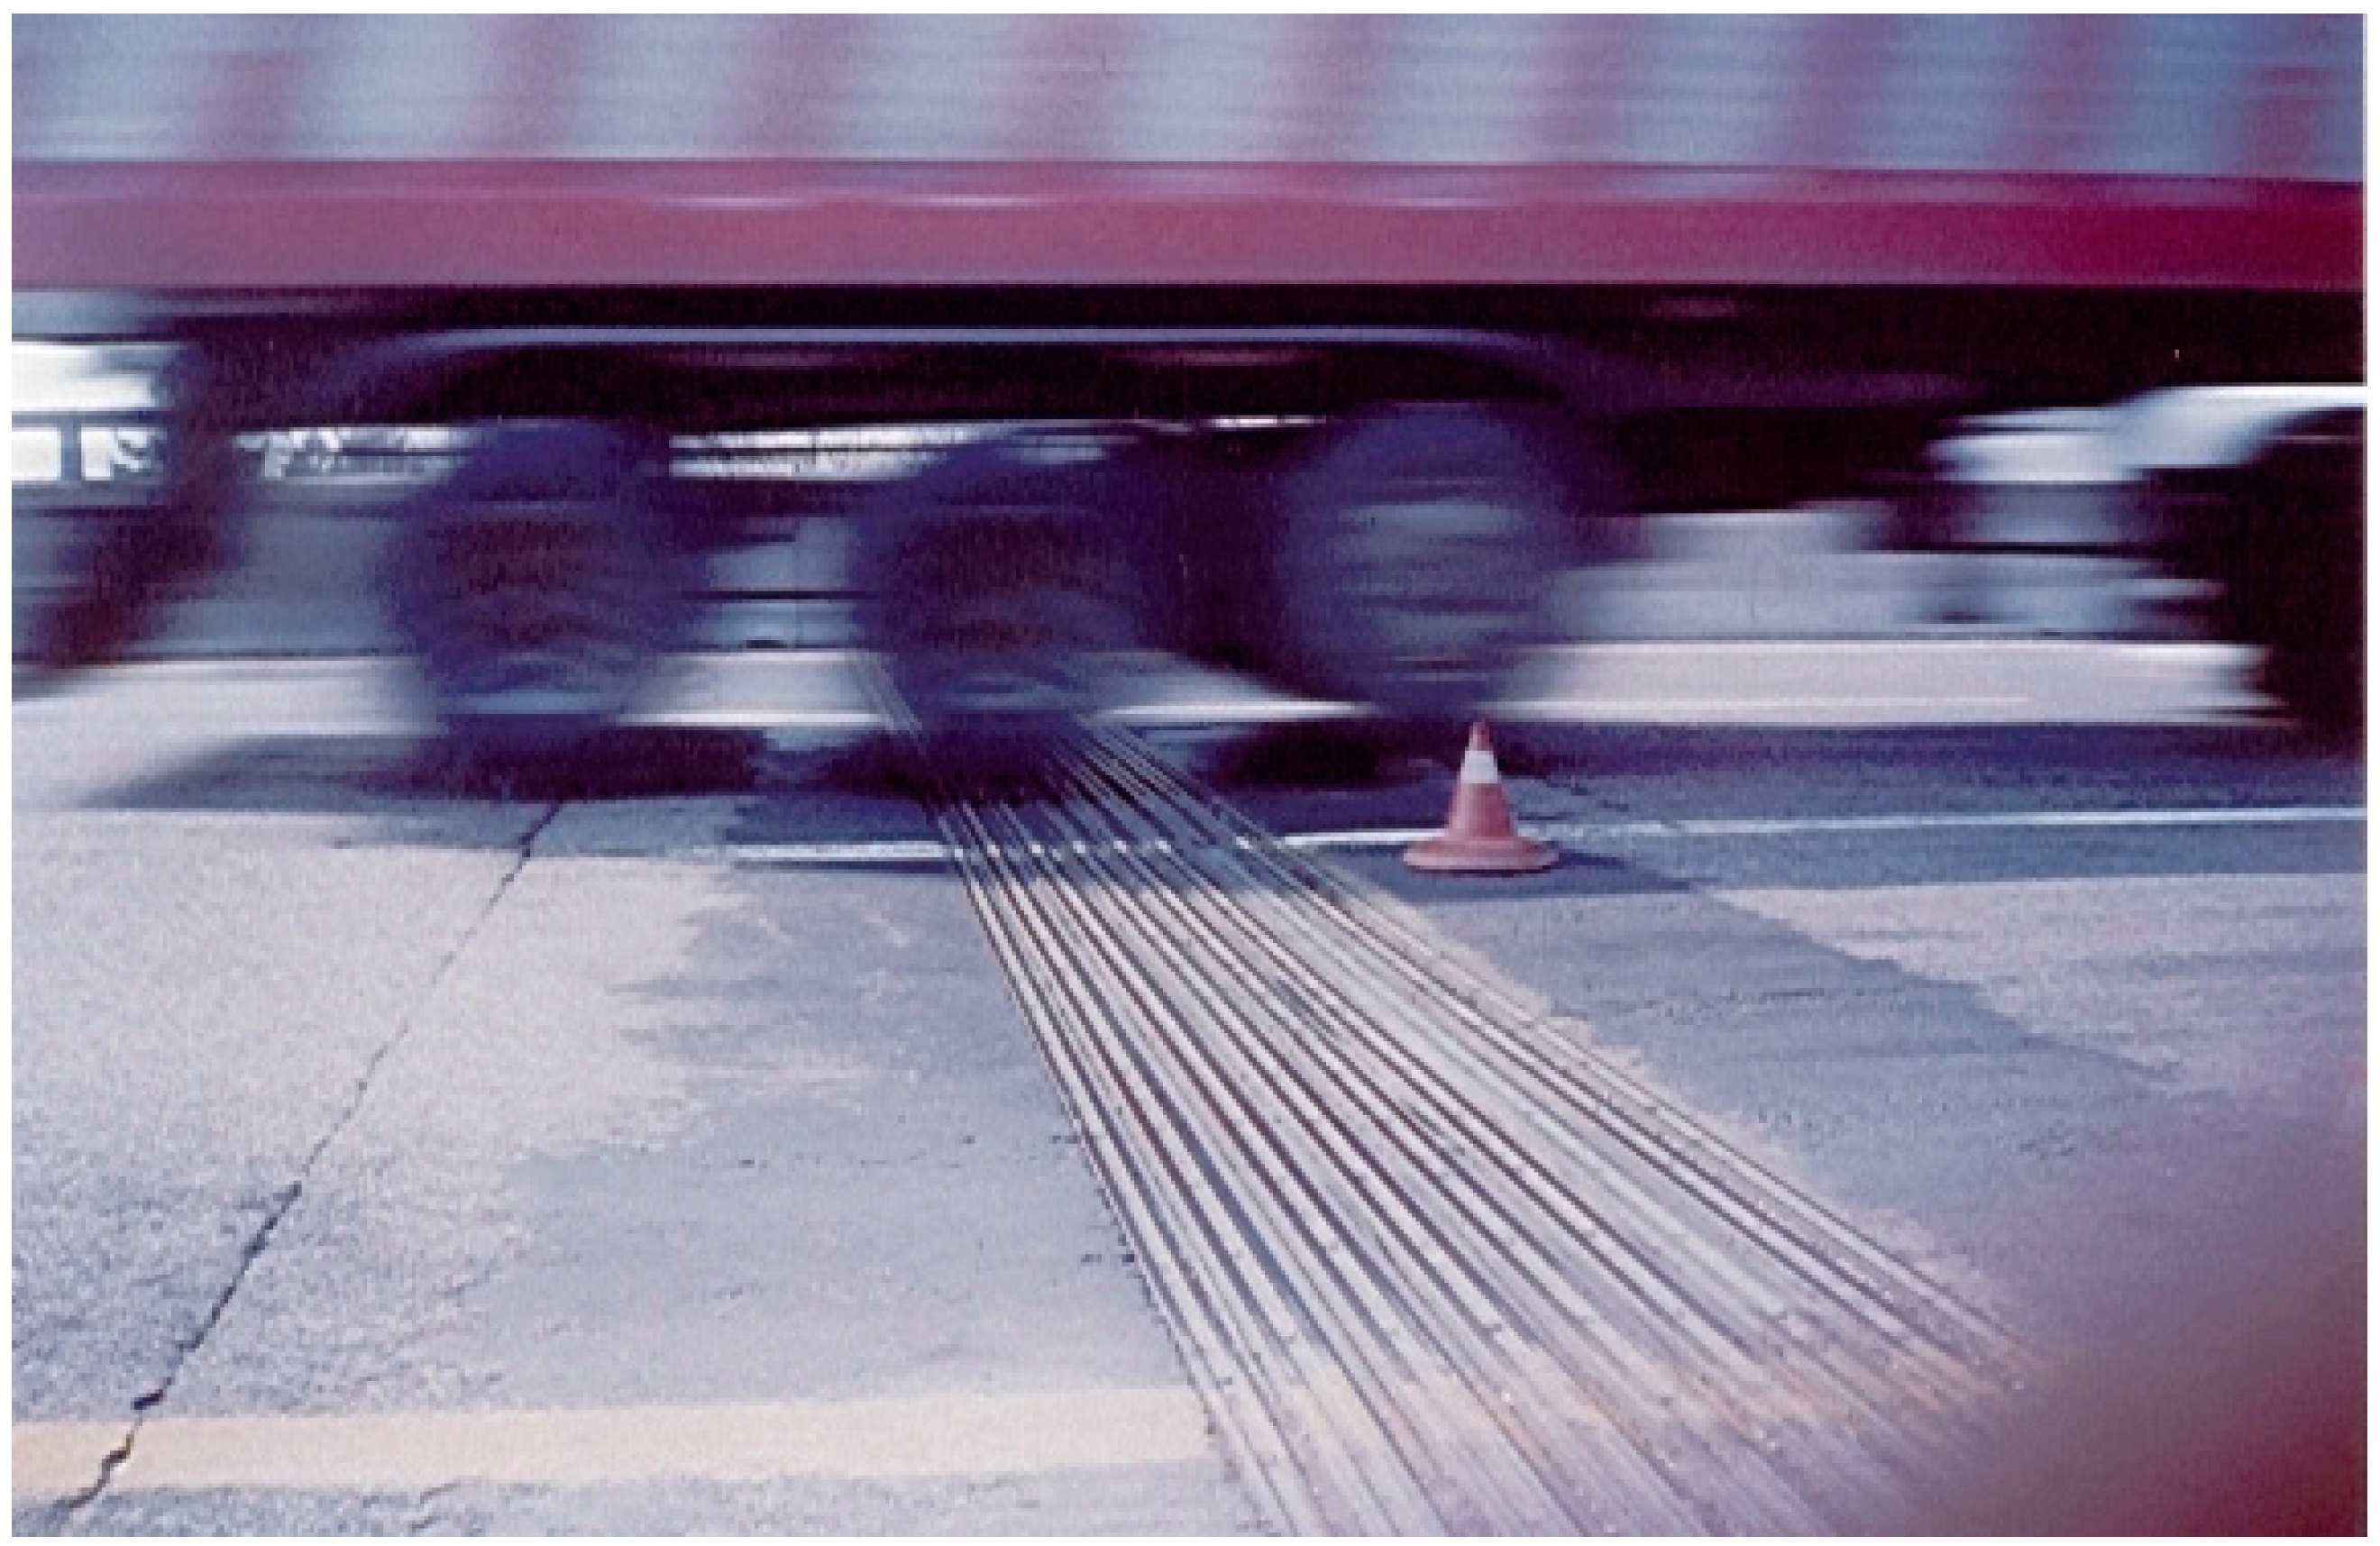
33] was found for the examined Italian highway. Many accidents were localized in correspondence to a bridge and, in particular, near one of the BEJs present in this area. After a brief in situ inspection, it was found that a reduction of the contact area between vehicles’ tires and pavement took place in many cases during the passage on this BEJ, and sometimes, there was a complete loss of contact, as shown in
Figure 3.
As a consequence of these issues, additional in situ measurements were carried out to evaluate the detrimental effects on the bridge structure, pavement, passengers and vehicles induced by the peculiar geometry of the BEJ.
Furthermore, the surface pavement surrounding the BEJ presented several distresses, caused by the dynamic load increment of road vehicles (
Figure 4).
3.2. In Situ Test and Equipment
The following tests were performed on the highway section including the joint:
Precision geometric-topographic measurements, along with about 500 m-long branch: The survey was made using a precision theodolite (total station) and a rod, assuming the carriageway markings as the edges of the surveying area. The coordinate reference system was relative; just the elevations were linked to the absolute system. In the area closest to the joint, a 1 × 1 m mesh size was considered, while in the other distant zones, 3 m × 3 m and 10 m × 10 m meshes were created. This discretization allowed performing the global layout of the platform and, particularly, the carriageway markings and the road edges.
Evaluation of dynamic action due to the joint, with accelerometers installed on a heavy vehicle test: The measured accelerations were analyzed in the time and frequency domains. In particular, the equipment used was composed of:
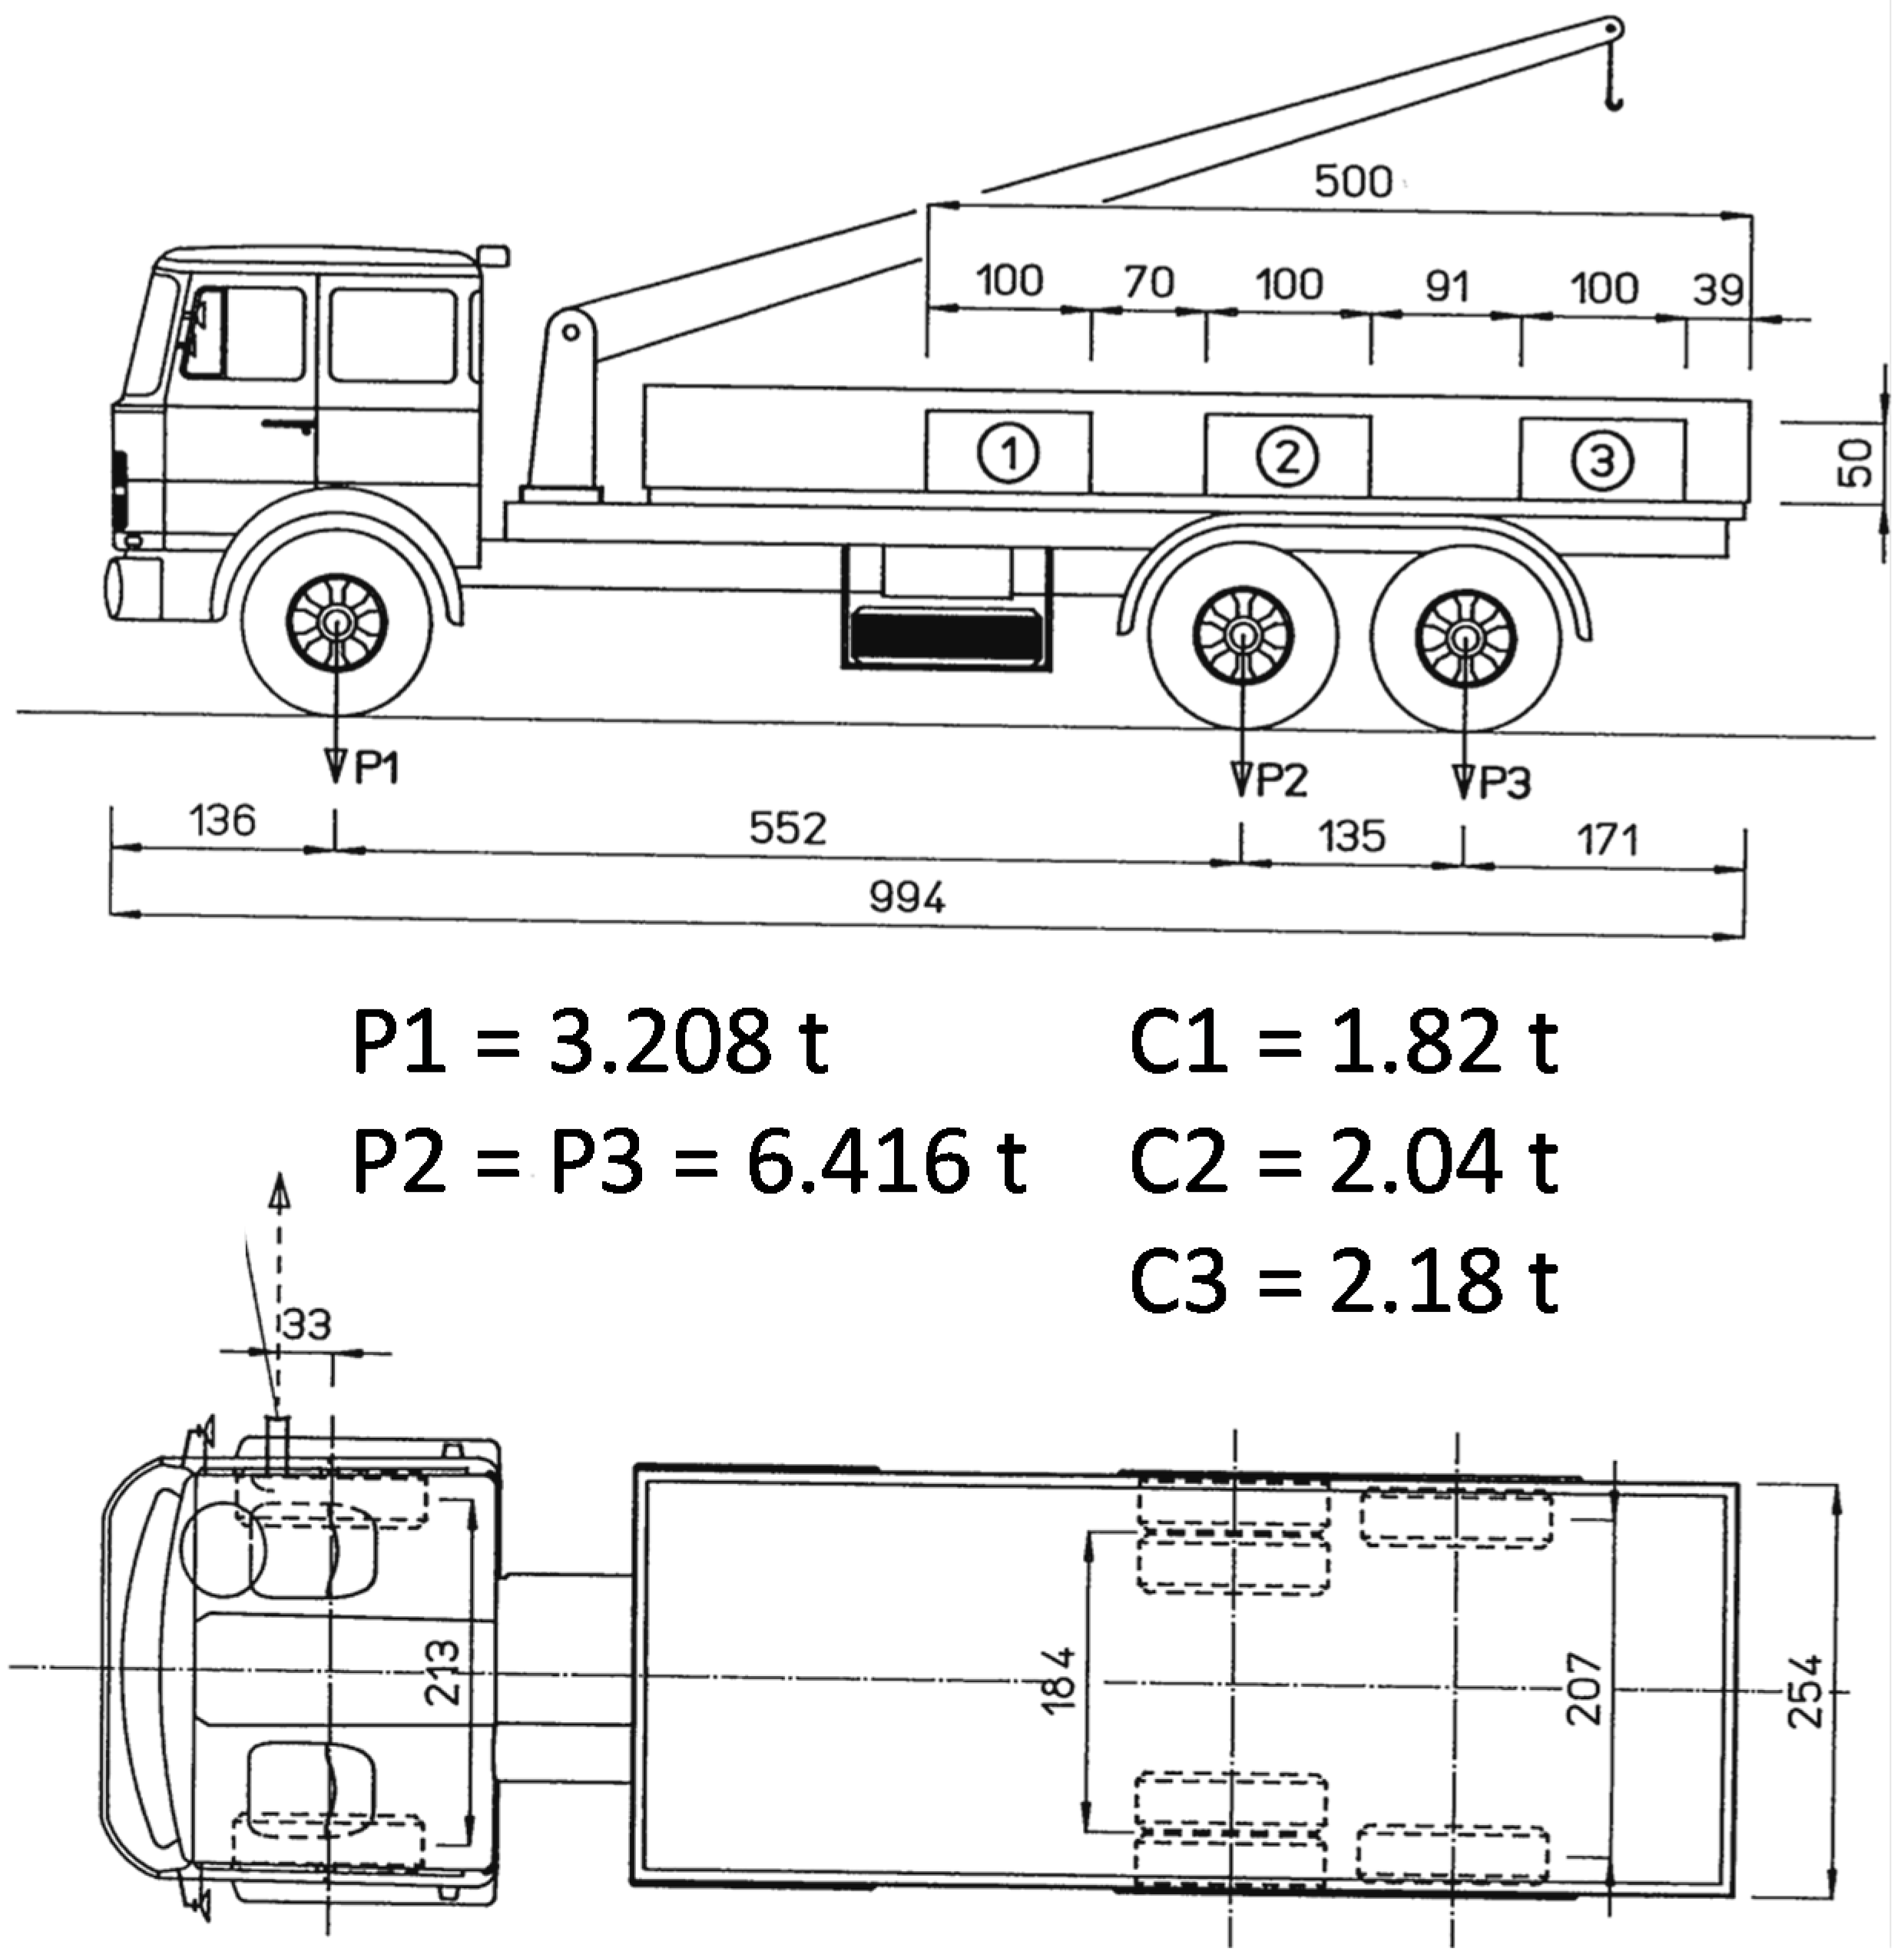
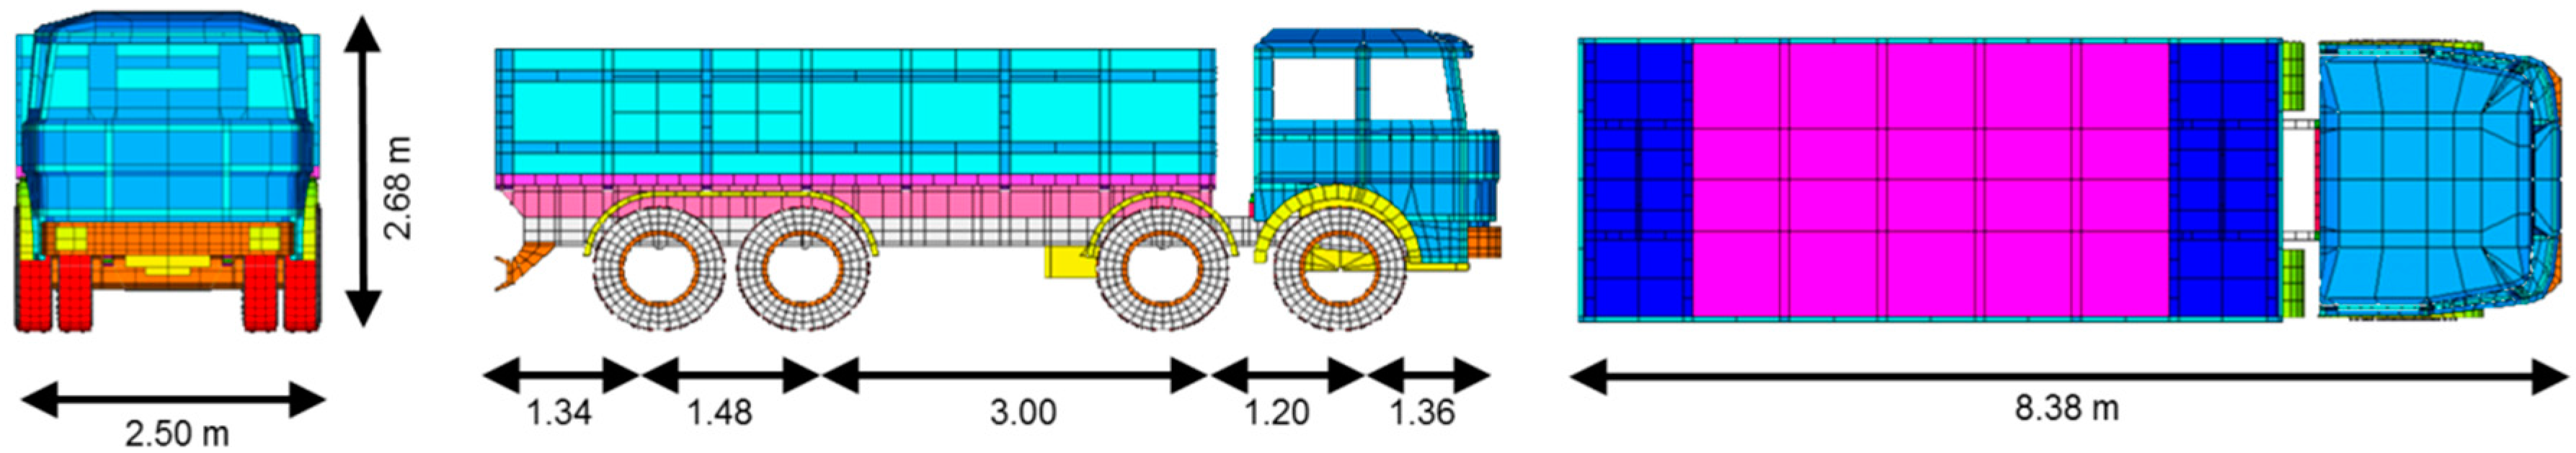
Three-axle heavy vehicle, with an overall empty load equal to 16.04 t (P1 = 3.208 t; P2 = P3 = 6.416 t; see
Figure 5);
Three concrete blocks whose weights were, respectively, 1.82 (C1), 2.04 (C2) and 2.18 t (C3);
Seven piezoelectric accelerometers: 4 accelerometers with a bottom scale ±50 g (Type A) and 3 with a minimum full-scale range of ±20 g (Type B). The Type B accelerometers were located on the right end of the axles connected to the vehicle frame, while three of the four Type A accelerometers were placed one on each vehicle axle. The last Type A accelerometer was located on the left side of the front axle to control the possible asymmetry of the transversal acceleration distribution.
Inside the vehicle cab, a signal control exchange and a PC were located to record and verify collected data and to re-calibrate the equipment if necessary.
Four different loading conditions were considered to examine the phenomenon. They represent various heavy vehicle configurations (
Table 2) and various dynamic increments, because the phenomenon is sensitive to both the speed and load condition of heavy vehicles, as reported by Lu et al. [
34]. The considered speed and load combinations gave to the BEJ energy values comparable to those reached on the structure under real service conditions.
3.3. 3D Finite Element Model
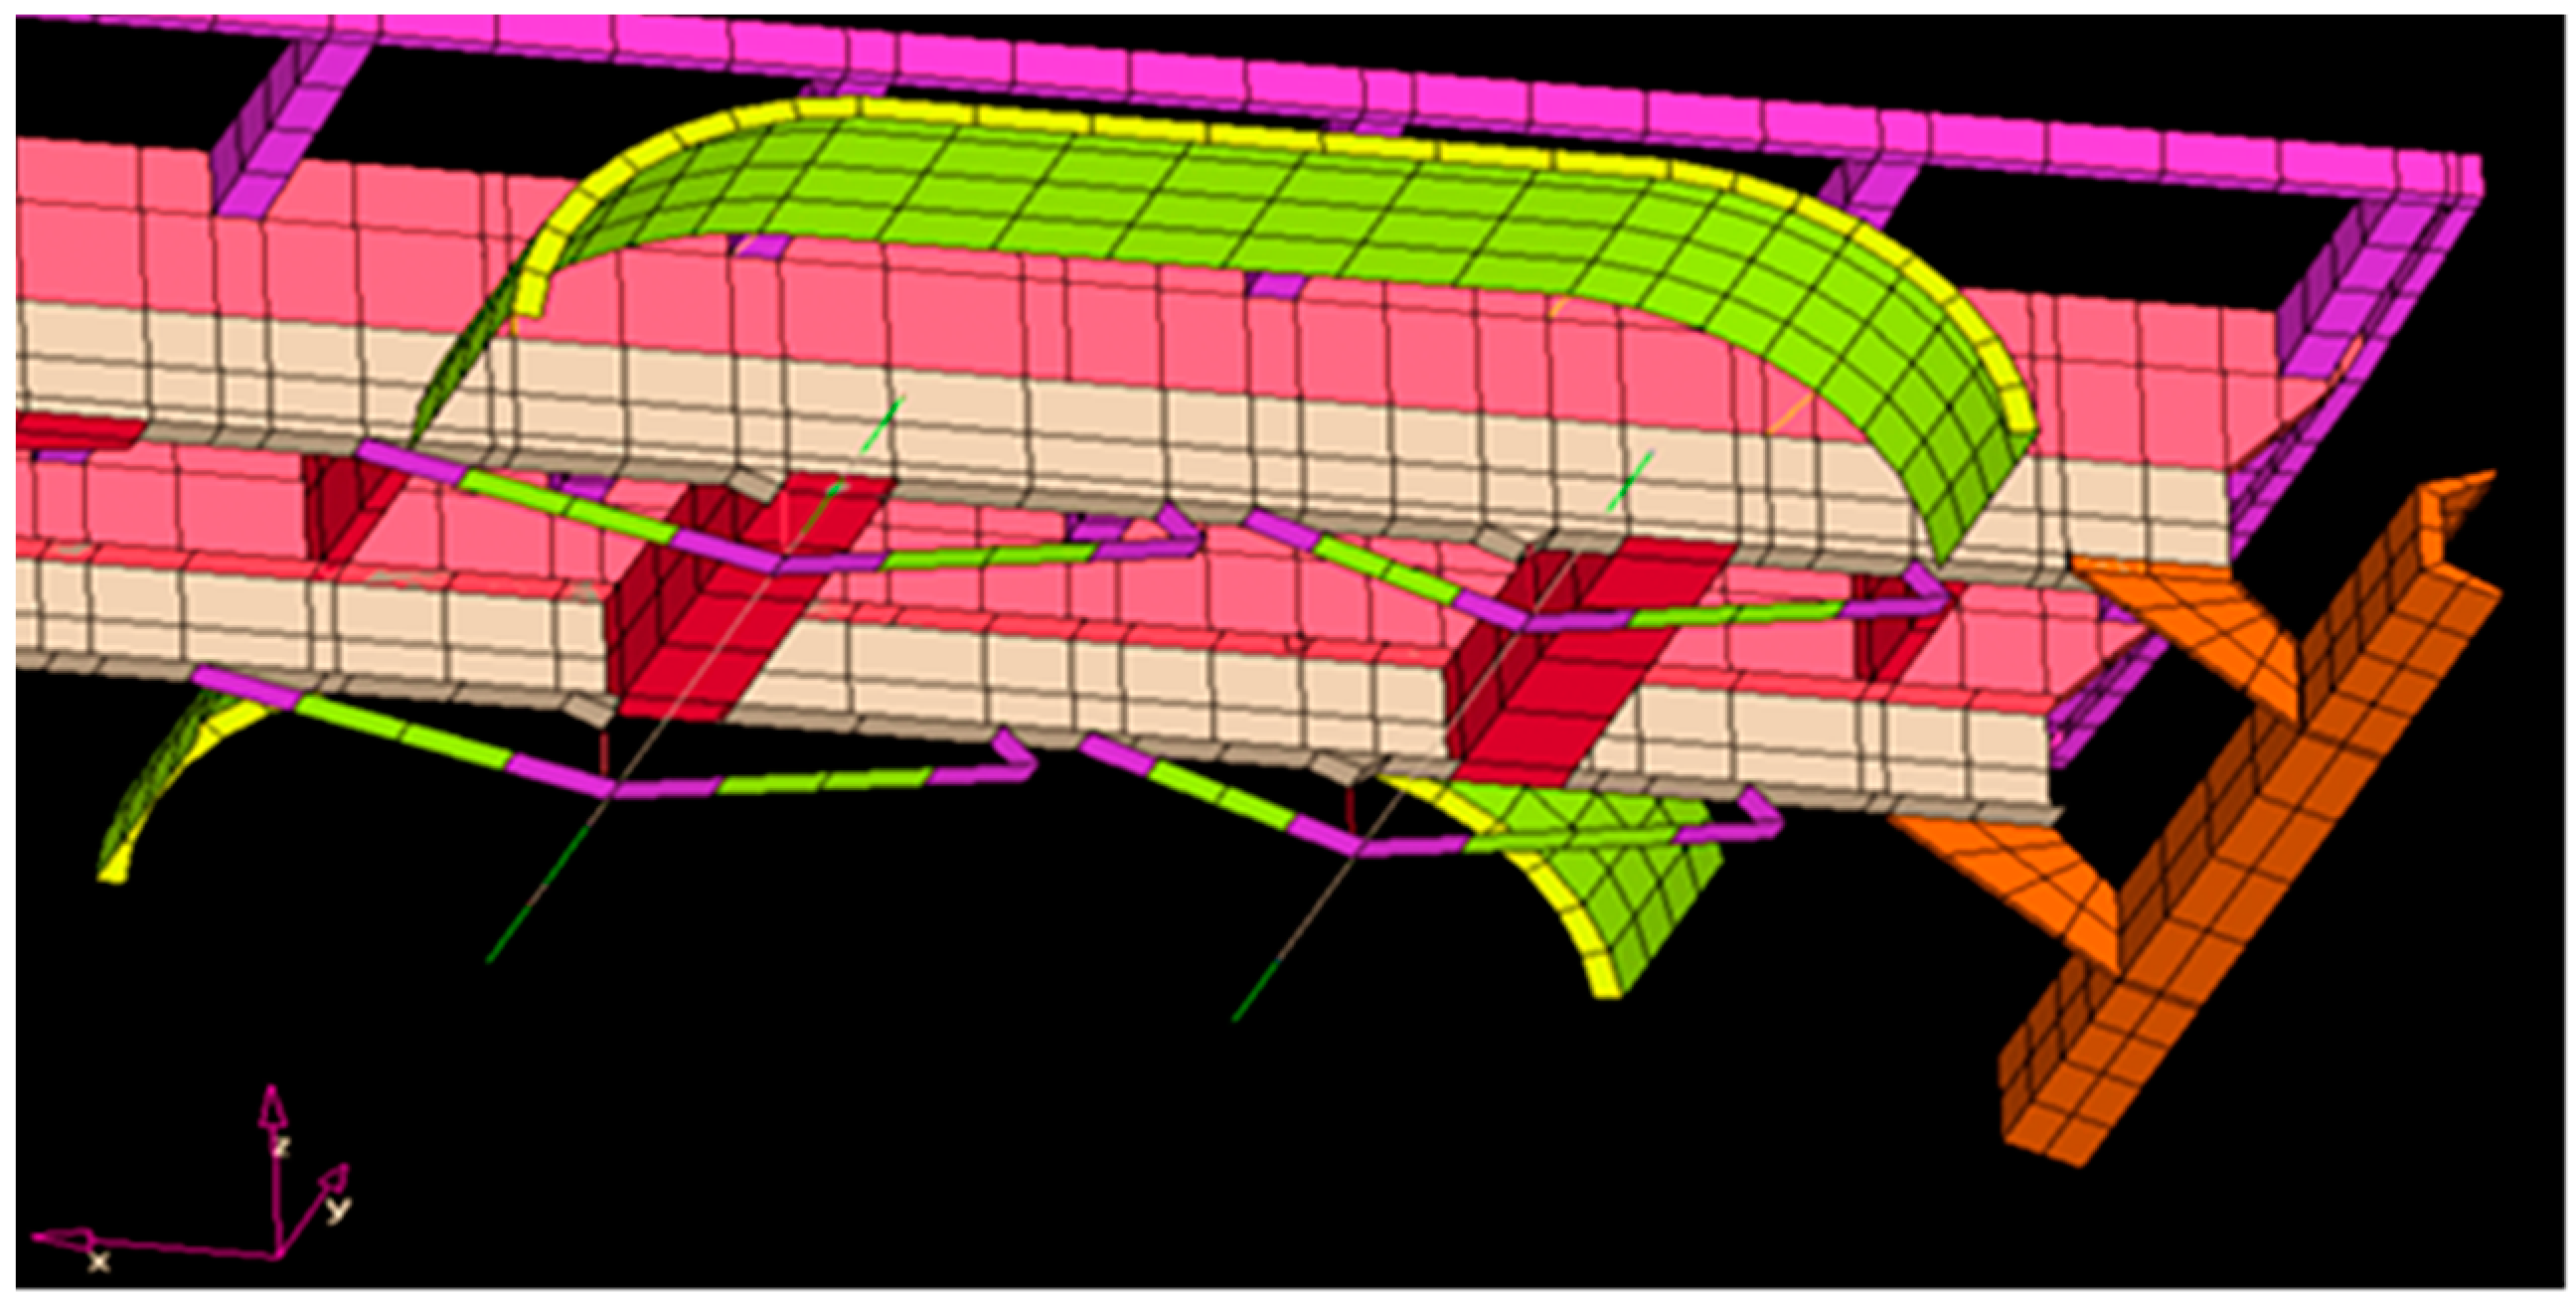
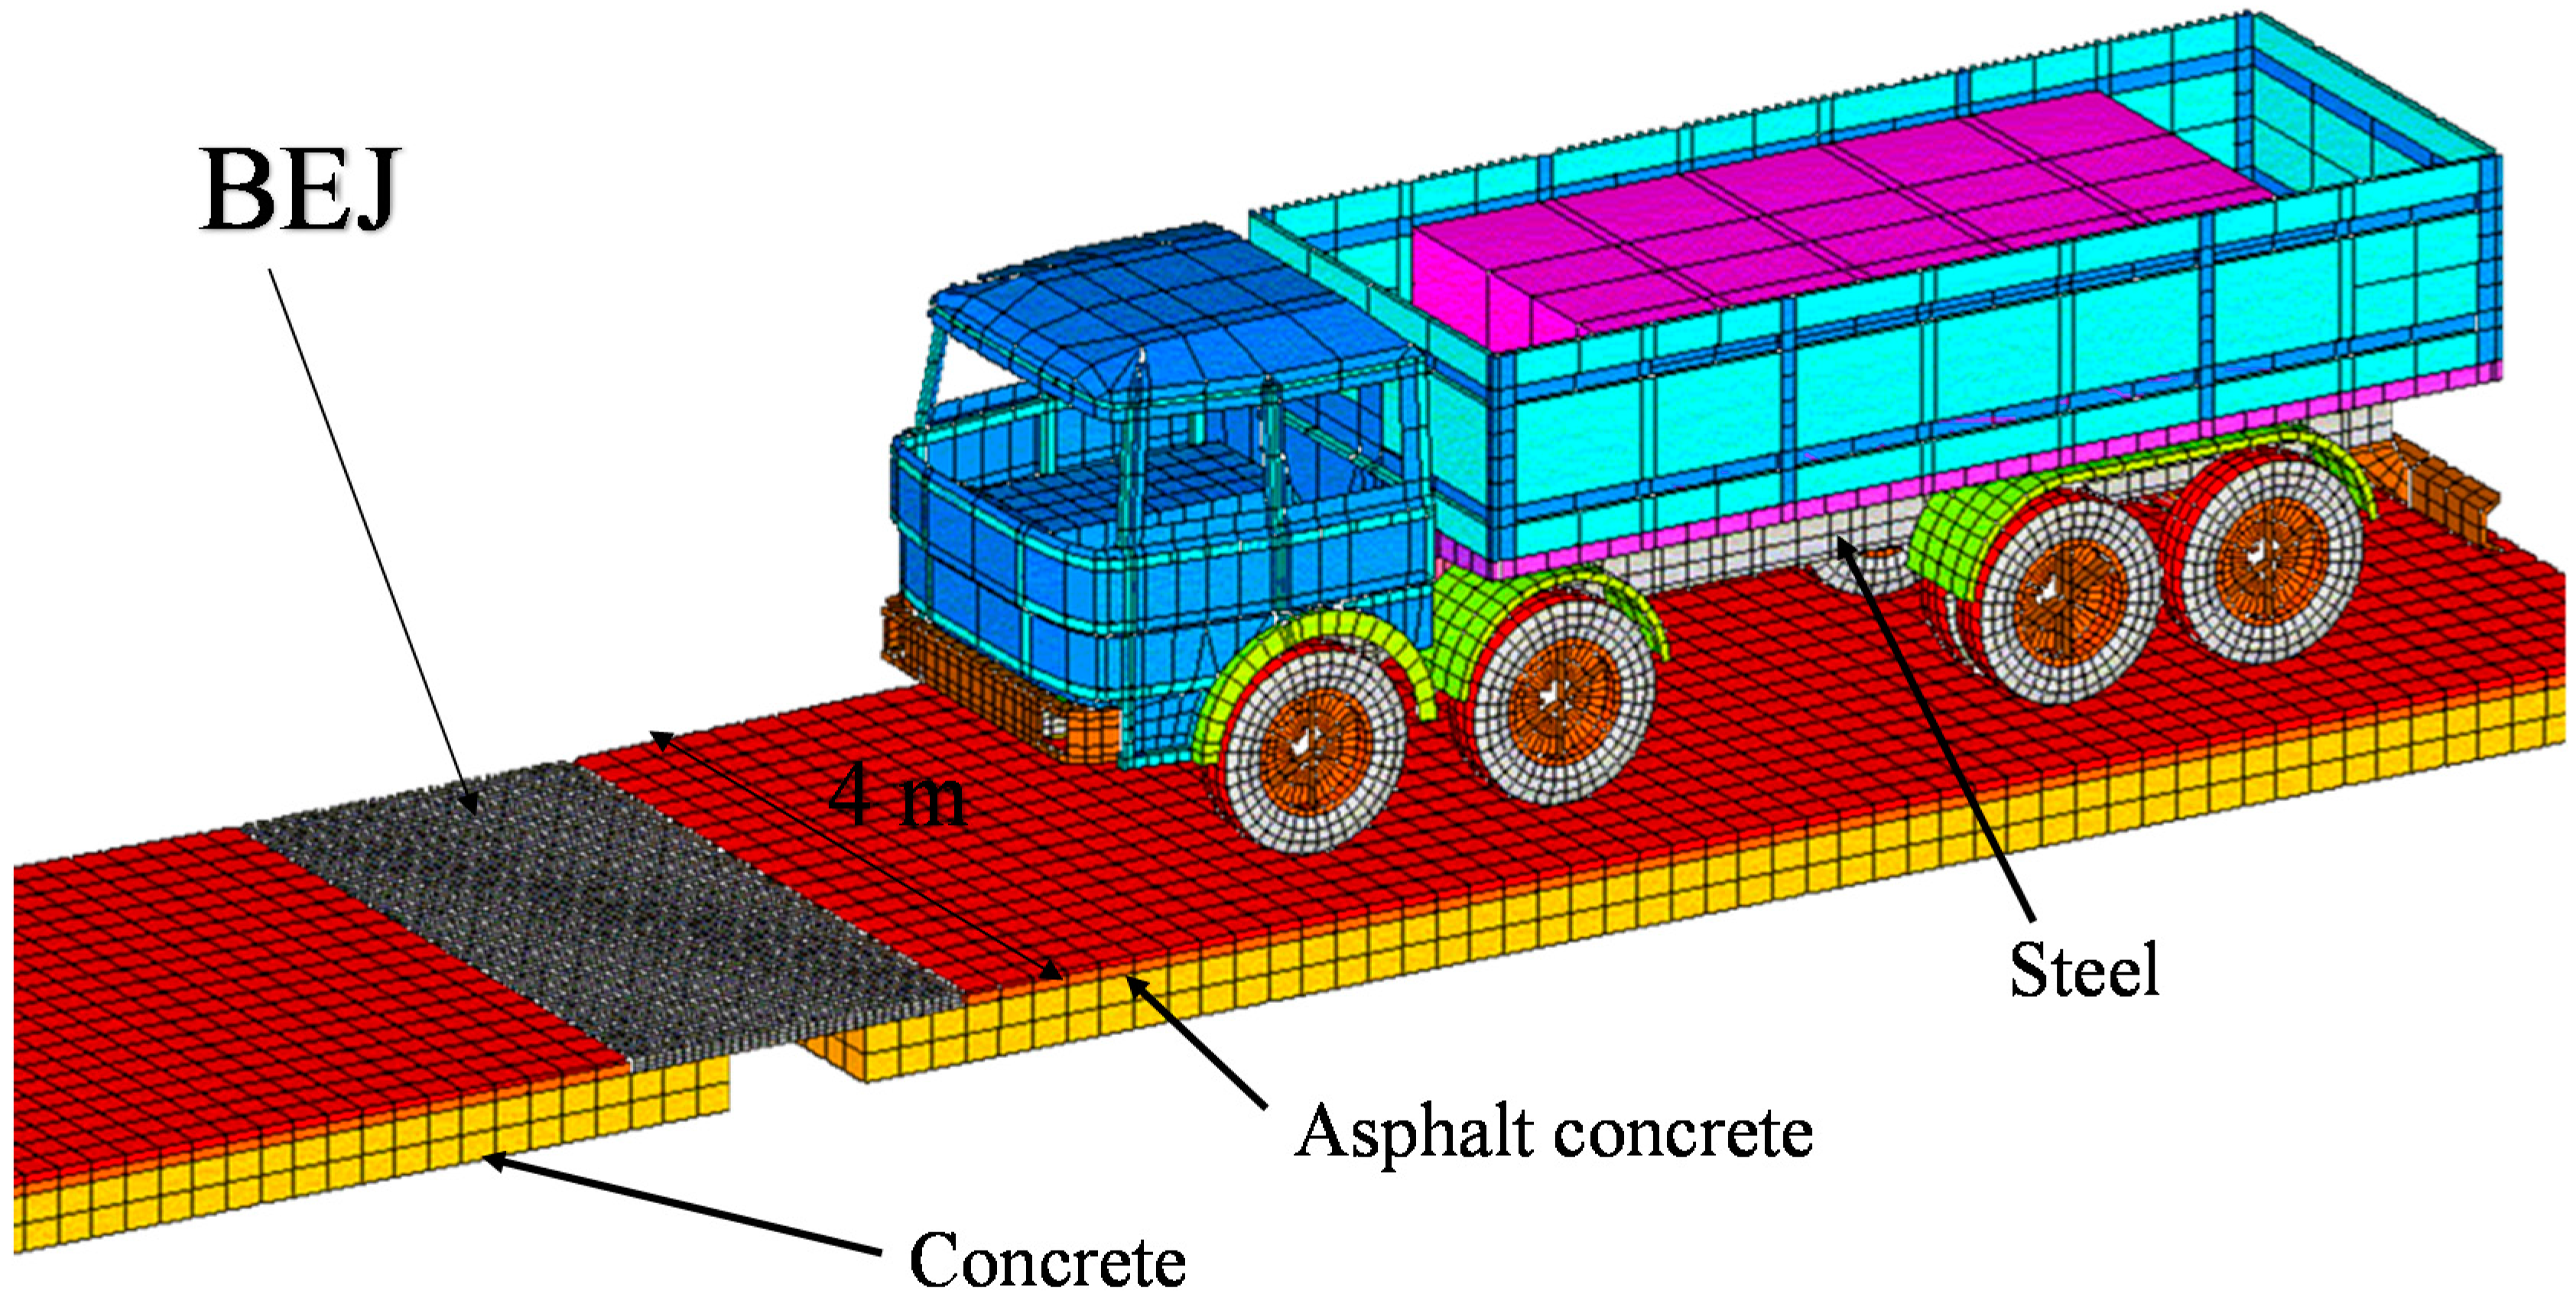
In addition to the in situ measurements, a simulation model was implemented. In particular, a 3D model of the asphalt concrete pavement and the seismic BEJ was developed using LS-DYNA. It allowed evaluating the stress magnitude on the test heavy vehicle mechanical components (
Figure 6) due to the vertical irregularity that characterizes the BEJ. For this reason, the vehicle is modeled in detail, while for the BEJ, a simple geometry, able to describe the unevenness, was considered. In addition, only the concrete slab was modeled to reduce the computational burden, its bottom surface being fully constrained.
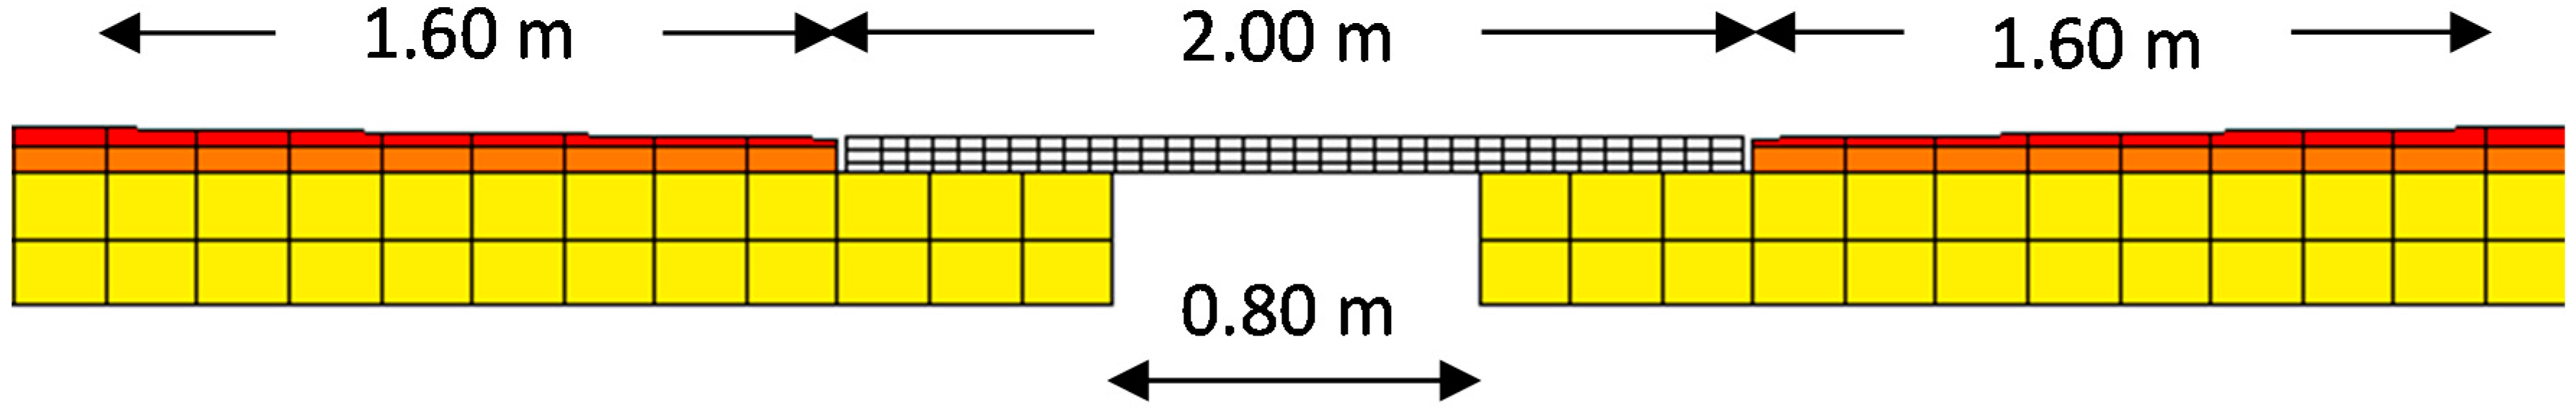
The pavement is a three-layer (two asphalt concrete and one cement concrete) 22.4 m long and 4 m-wide model. The BEJ is located at the middle of the strip (
Figure 7), where there is a 0.8-m hole in the lower layer, while the two upper layers are interrupted by the BEJ (2.00 m long). The joint surface is 3 cm lower than the rolling surface, thus the upper pavement layers have a transition zone of 1.60 m before and after the joint to reach the appropriate height. The pavement/joint model consists of 15,540 8-node brick (solid) elements. Mechanical characteristics of the materials are linear-elastic for the bottom layer (concrete slab-structure) and viscoelastic for the two upper layers.
With respect to the boundary conditions adopted in the model, the horizontal displacements on the sides of the model were restrained to represent the confinement due to the presence of the surrounding portion of pavement.
The test vehicle model (
Figure 8) was initially built to perform roadside hardware crash test simulations [
35,
36,
37]. It is the IVECO FIAT 180 NC, IVECO (Group CNH Industrial), Torino, Italy, 4-axle heavy goods vehicle, with a net mass of 10,560 kg and a total mass of about 30,000 kg. Its model consists of about 12,000 shell, 150 solid and 100 beam elements (in total, about 15,000 elements).
The whole suspension system of the vehicle test was modeled to reproduce the dynamic effects and the vehicle behavior during the test, as shown in
Figure 9. The reference truck has an old type of suspension (leaf springs), with elastic steel beams packed over each axle, and hydraulic dampers.
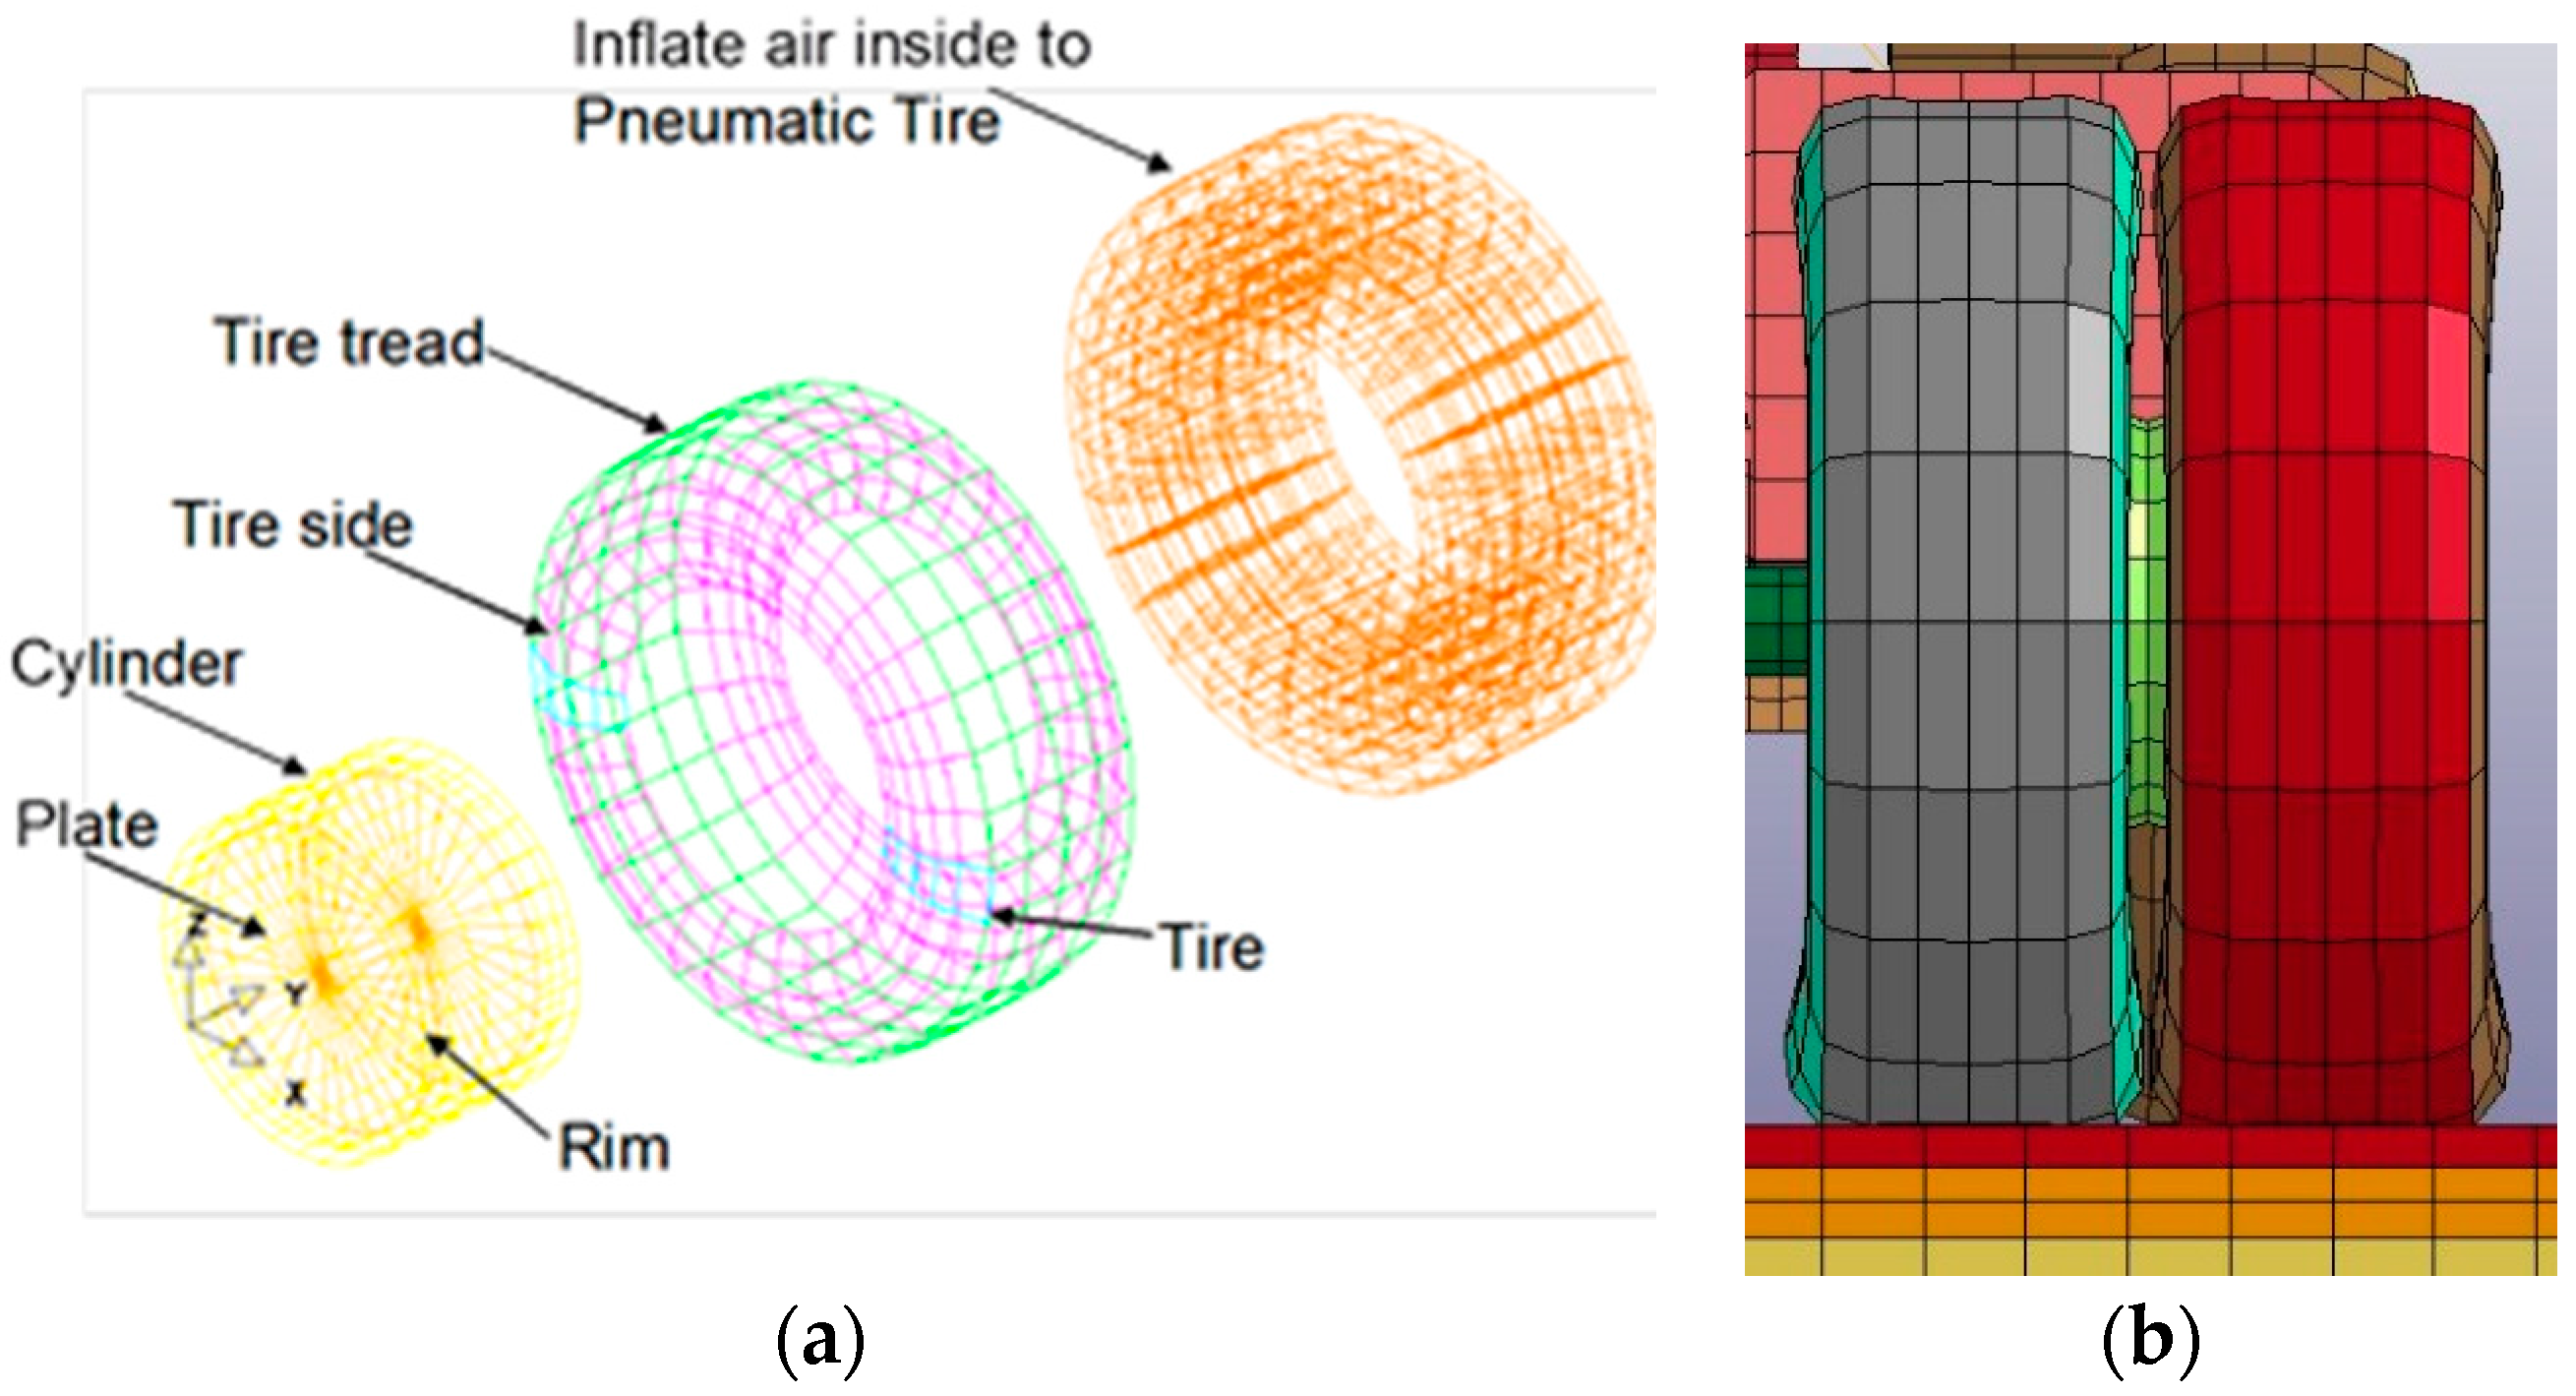
These elements were reproduced with a variable thickness shell beam, while the axles are steel beams. The main parts of the vehicle’s structure have an elastic-plastic behavior. The loads are accurately transferred to the pavement because this vehicle is equipped with inflated tires and rolling wheels, as shown in
Figure 10. A contact surface with a Coulomb-like friction ensures the interface between the two bodies (tire-rubber and pavement).
The model was validated and then used to calculate the stress, strain and acceleration of each element of the pavement, joint and vehicle. These data are useful, for example, to verify the fatigue damage of the vehicle structure, estimating the effects of an uneven surface as the BEJ examined.
3.4. Front and Rear Axle Quarter Car Model
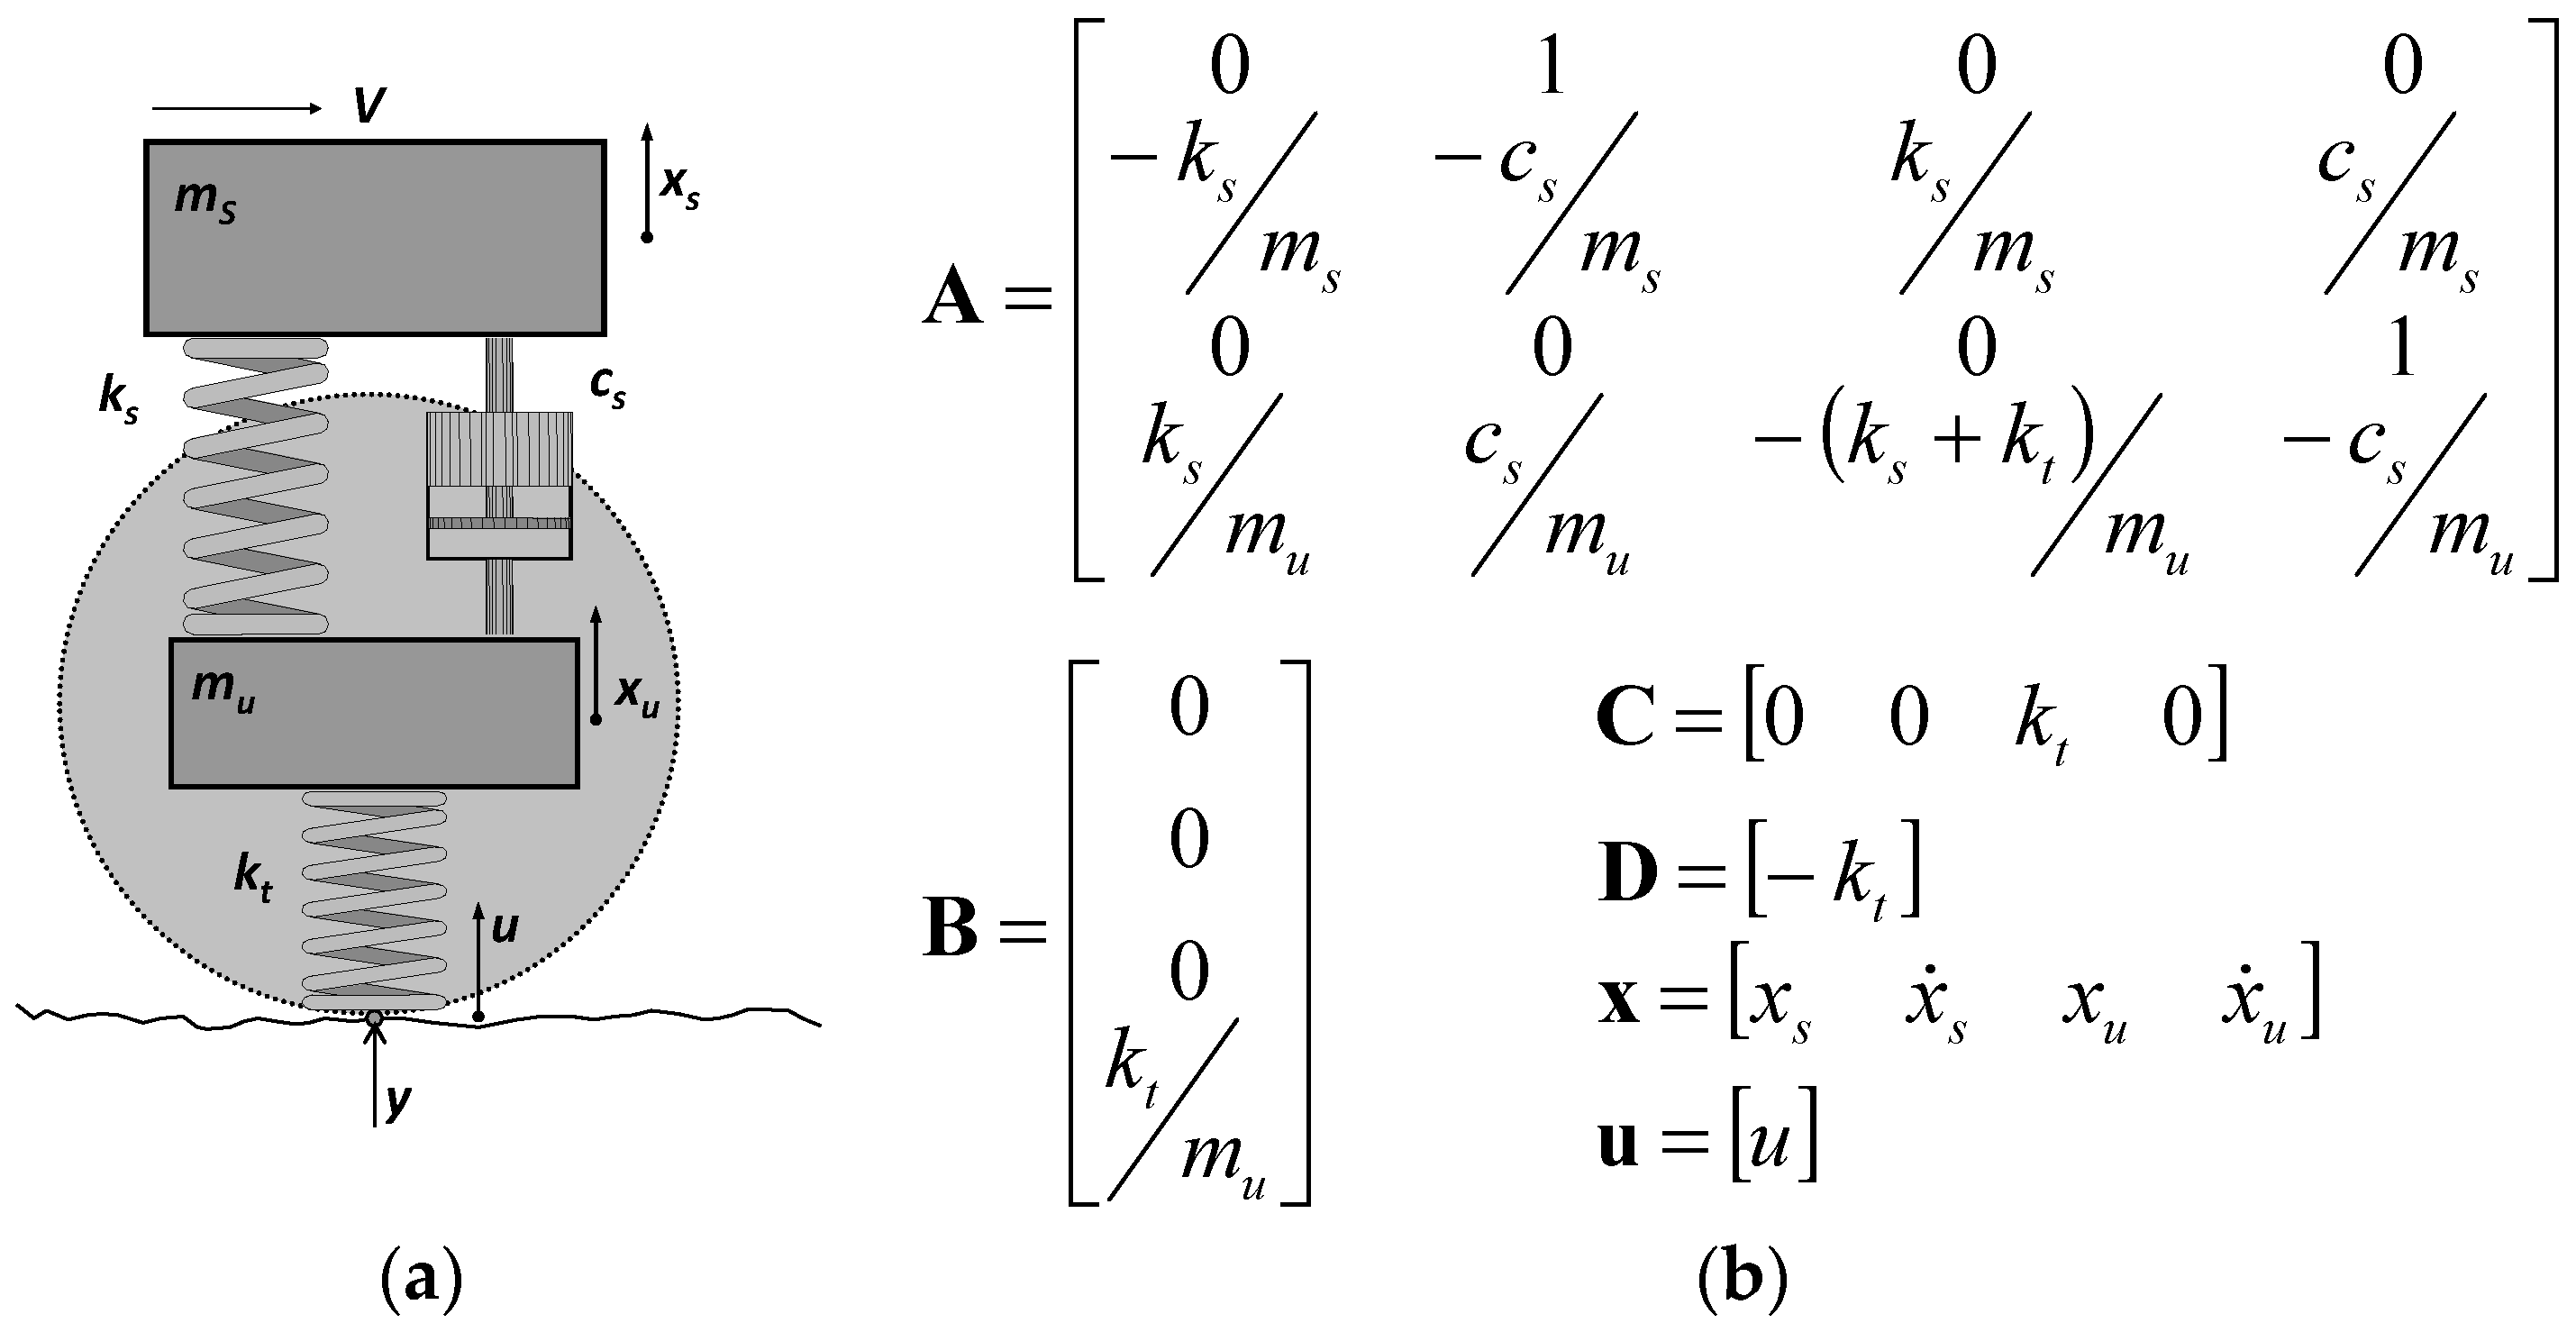
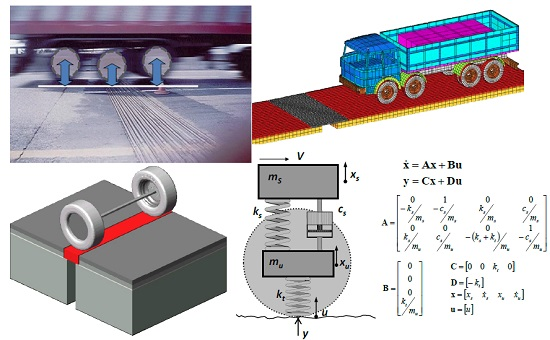
The linear quarter-truck model (
Figure 11a) described in [
32] was implemented in MATLAB to estimate the dynamic load increment induced by the BEJ at several speeds. The basic equations of motion for the examined model are (1) and (2):
where
is the unsprung mass,
is the sprung mass,
is the suspension spring constant,
is the tire spring constant,
is the suspension viscous damping constant,
is the vertical displacement of the unsprung mass,
is the vertical displacement of the sprung mass,
is the time derivative of vertical displacement of the sprung mass in m,
is the time derivative of vertical displacement of the unsprung mass,
is the acceleration of the sprung mass,
is the acceleration of the unsprung mass and
is the road profile elevations.
This mathematical model was formulated in the form of state equations. The general form of the state model for a linear dynamic system is reported in Equations (3) and (4):
where
A is the state matrix,
B the input matrix,
C the output matrix,
D the direct transmission matrix,
x is the state vector and
u and
y are, respectively, the input (profile elevations) and the output (reaction forces) vectors (
Figure 11b).
The mechanical parameters of the front and rear axles used in the model are consistent with the data provided in [
30] (
Table 3).
According to Equation (5), the dynamic load coefficient (DLC) was calculated to characterize the magnitude of dynamic tire forces [
9]:
where
RMS is the root mean square of the dynamic tire force signal calculated along the road profile, often indicated using the σ notation. The
RMS tire force (
σ) can be calculated by means of Equation (6):
where
fk is the dynamic tire force
f(t) at time
t = k × Δ
t, Δ
t is the simulation output time step and
T is the total simulation time (
T = N × Δ
t).
4. Test Results and Discussion
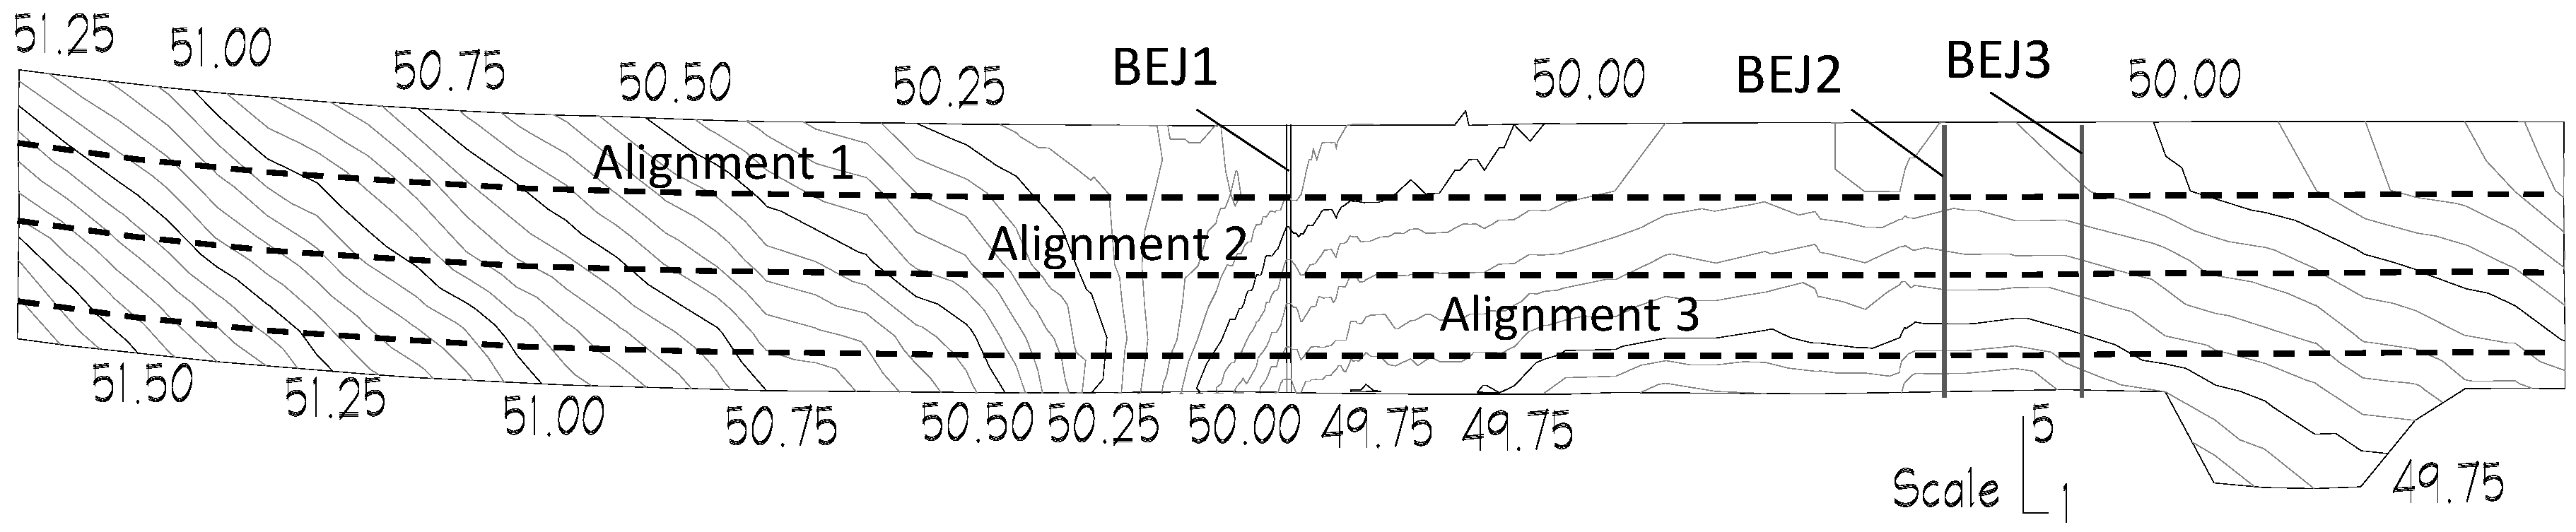
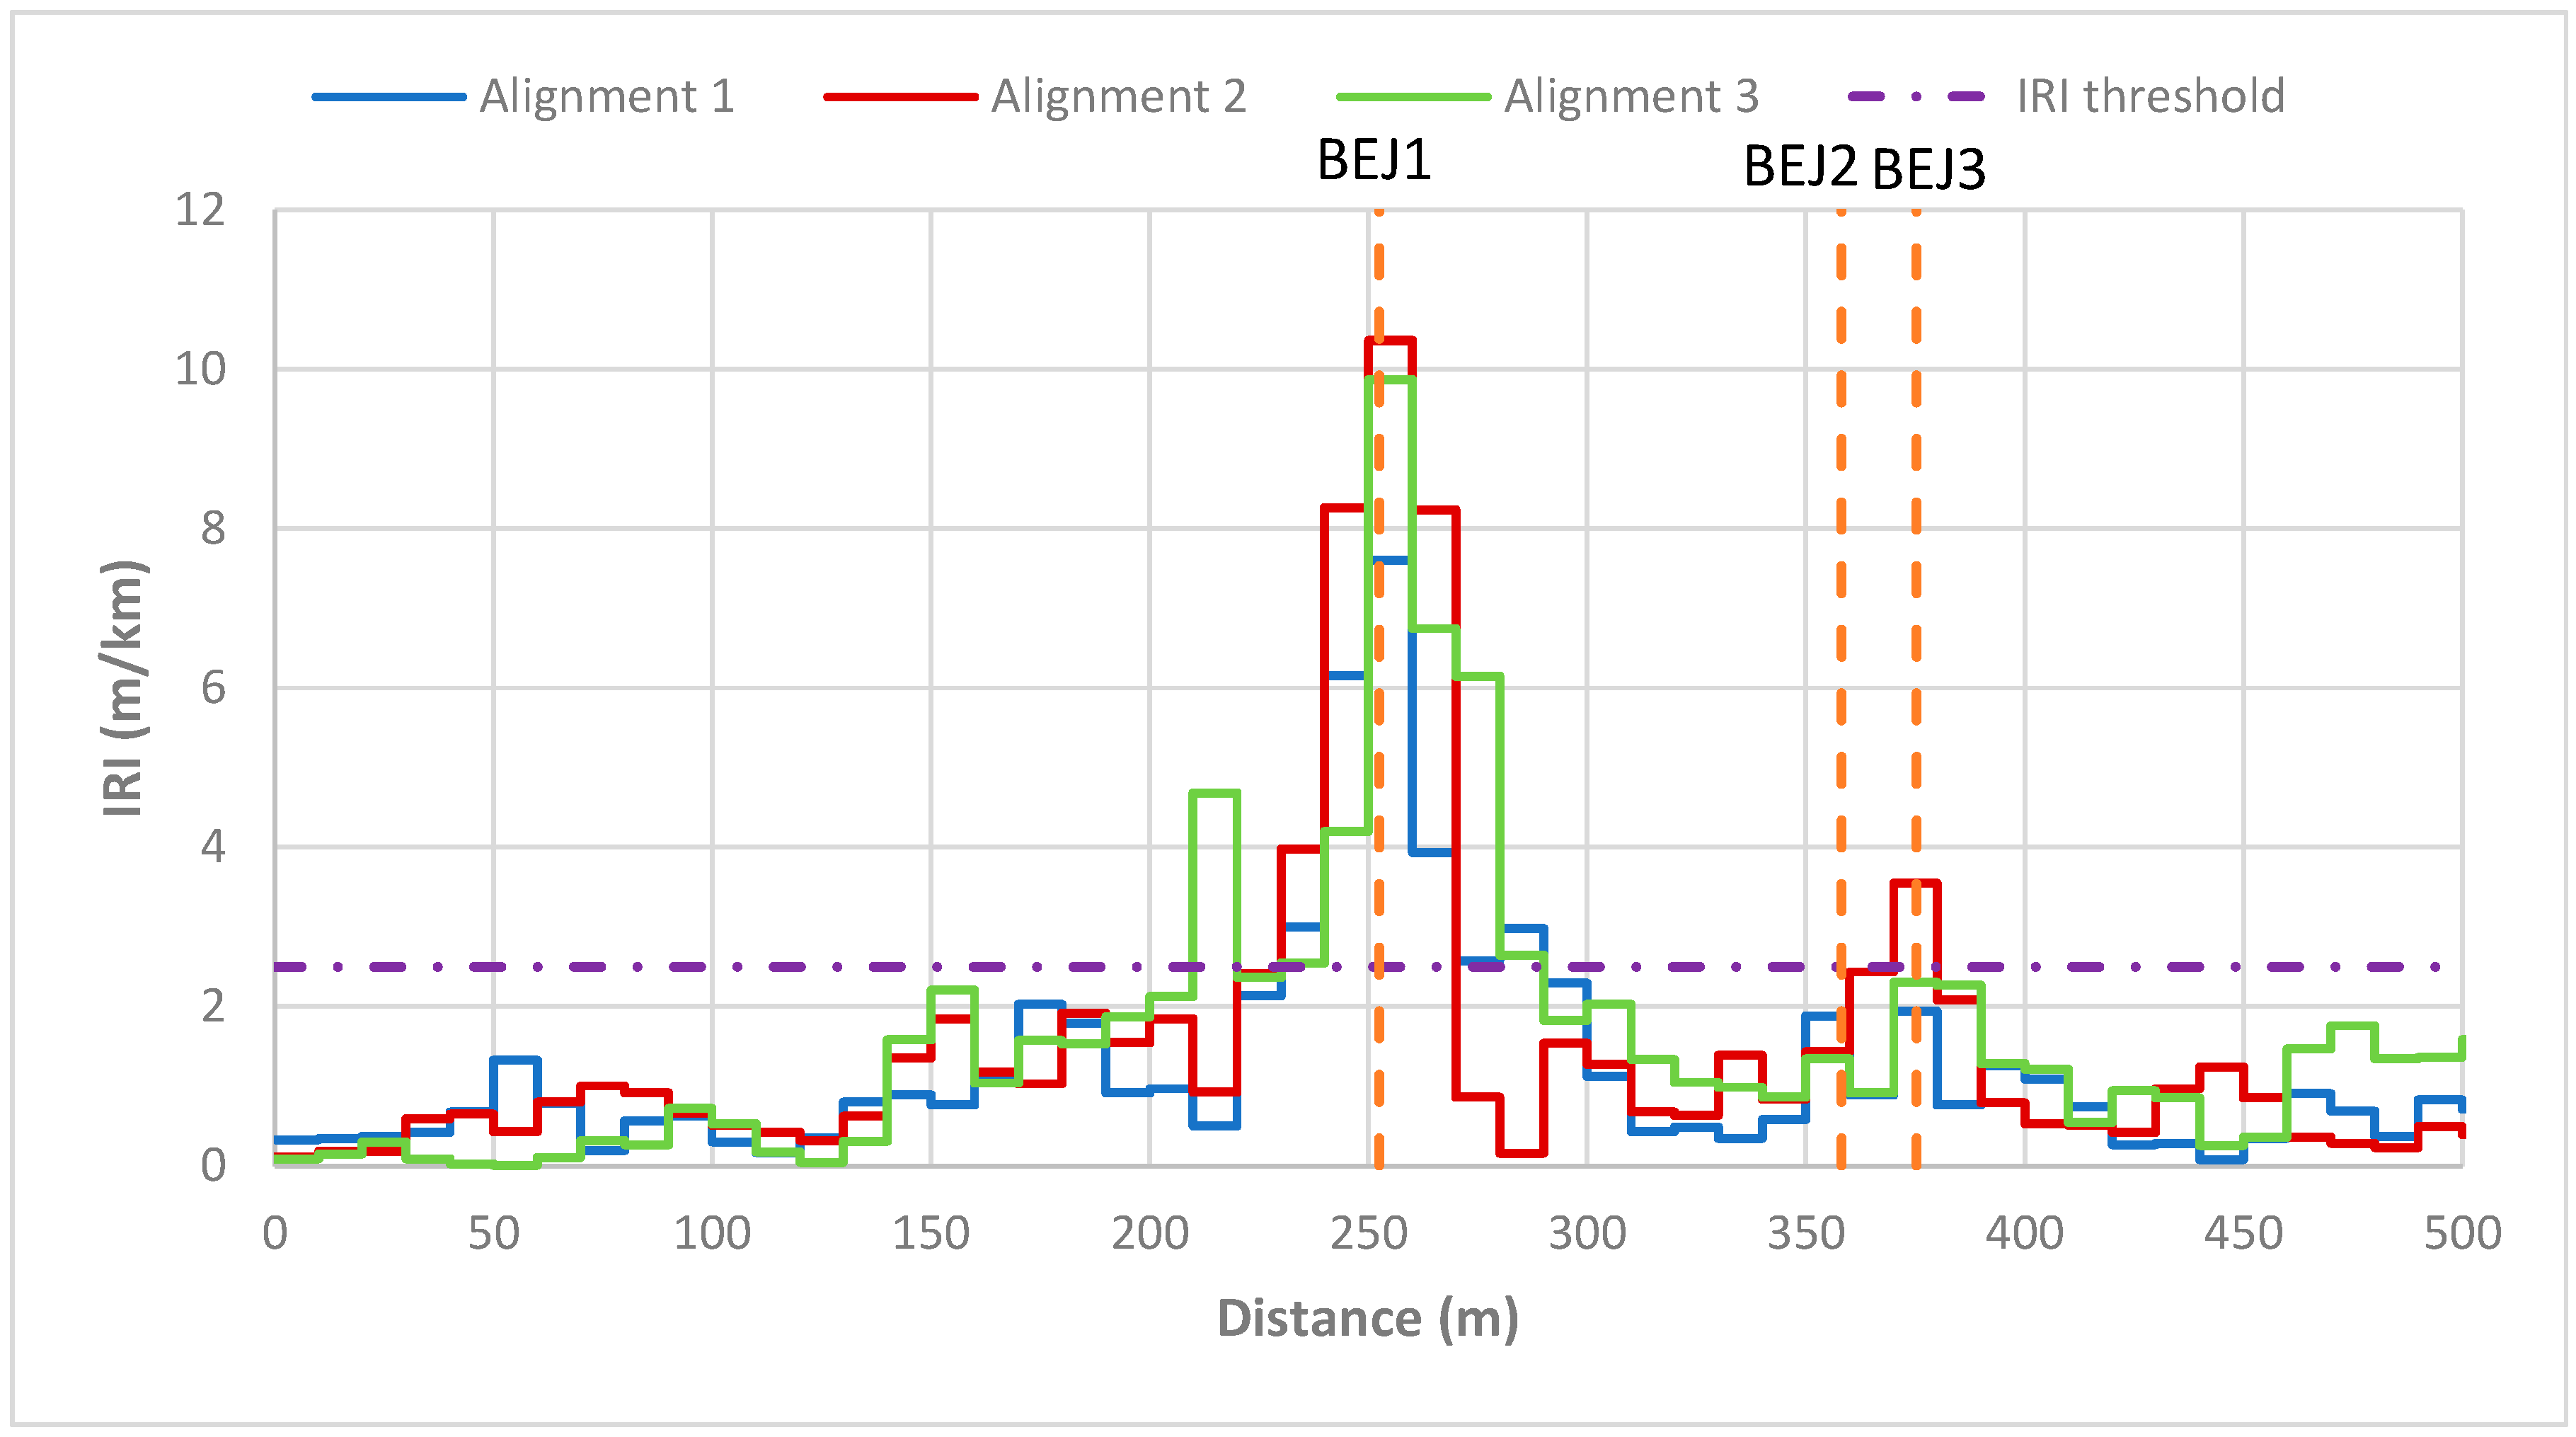
The geometric-topographic measurements permitted plotting the level curves of the surveyed pavement area, which is characterized by the presence of three BEJs marked as BEJ1, BEJ2 and BEJ3 (
Figure 12). In particular, three different longitudinal alignments, highlighted in
Figure 12, were examined.
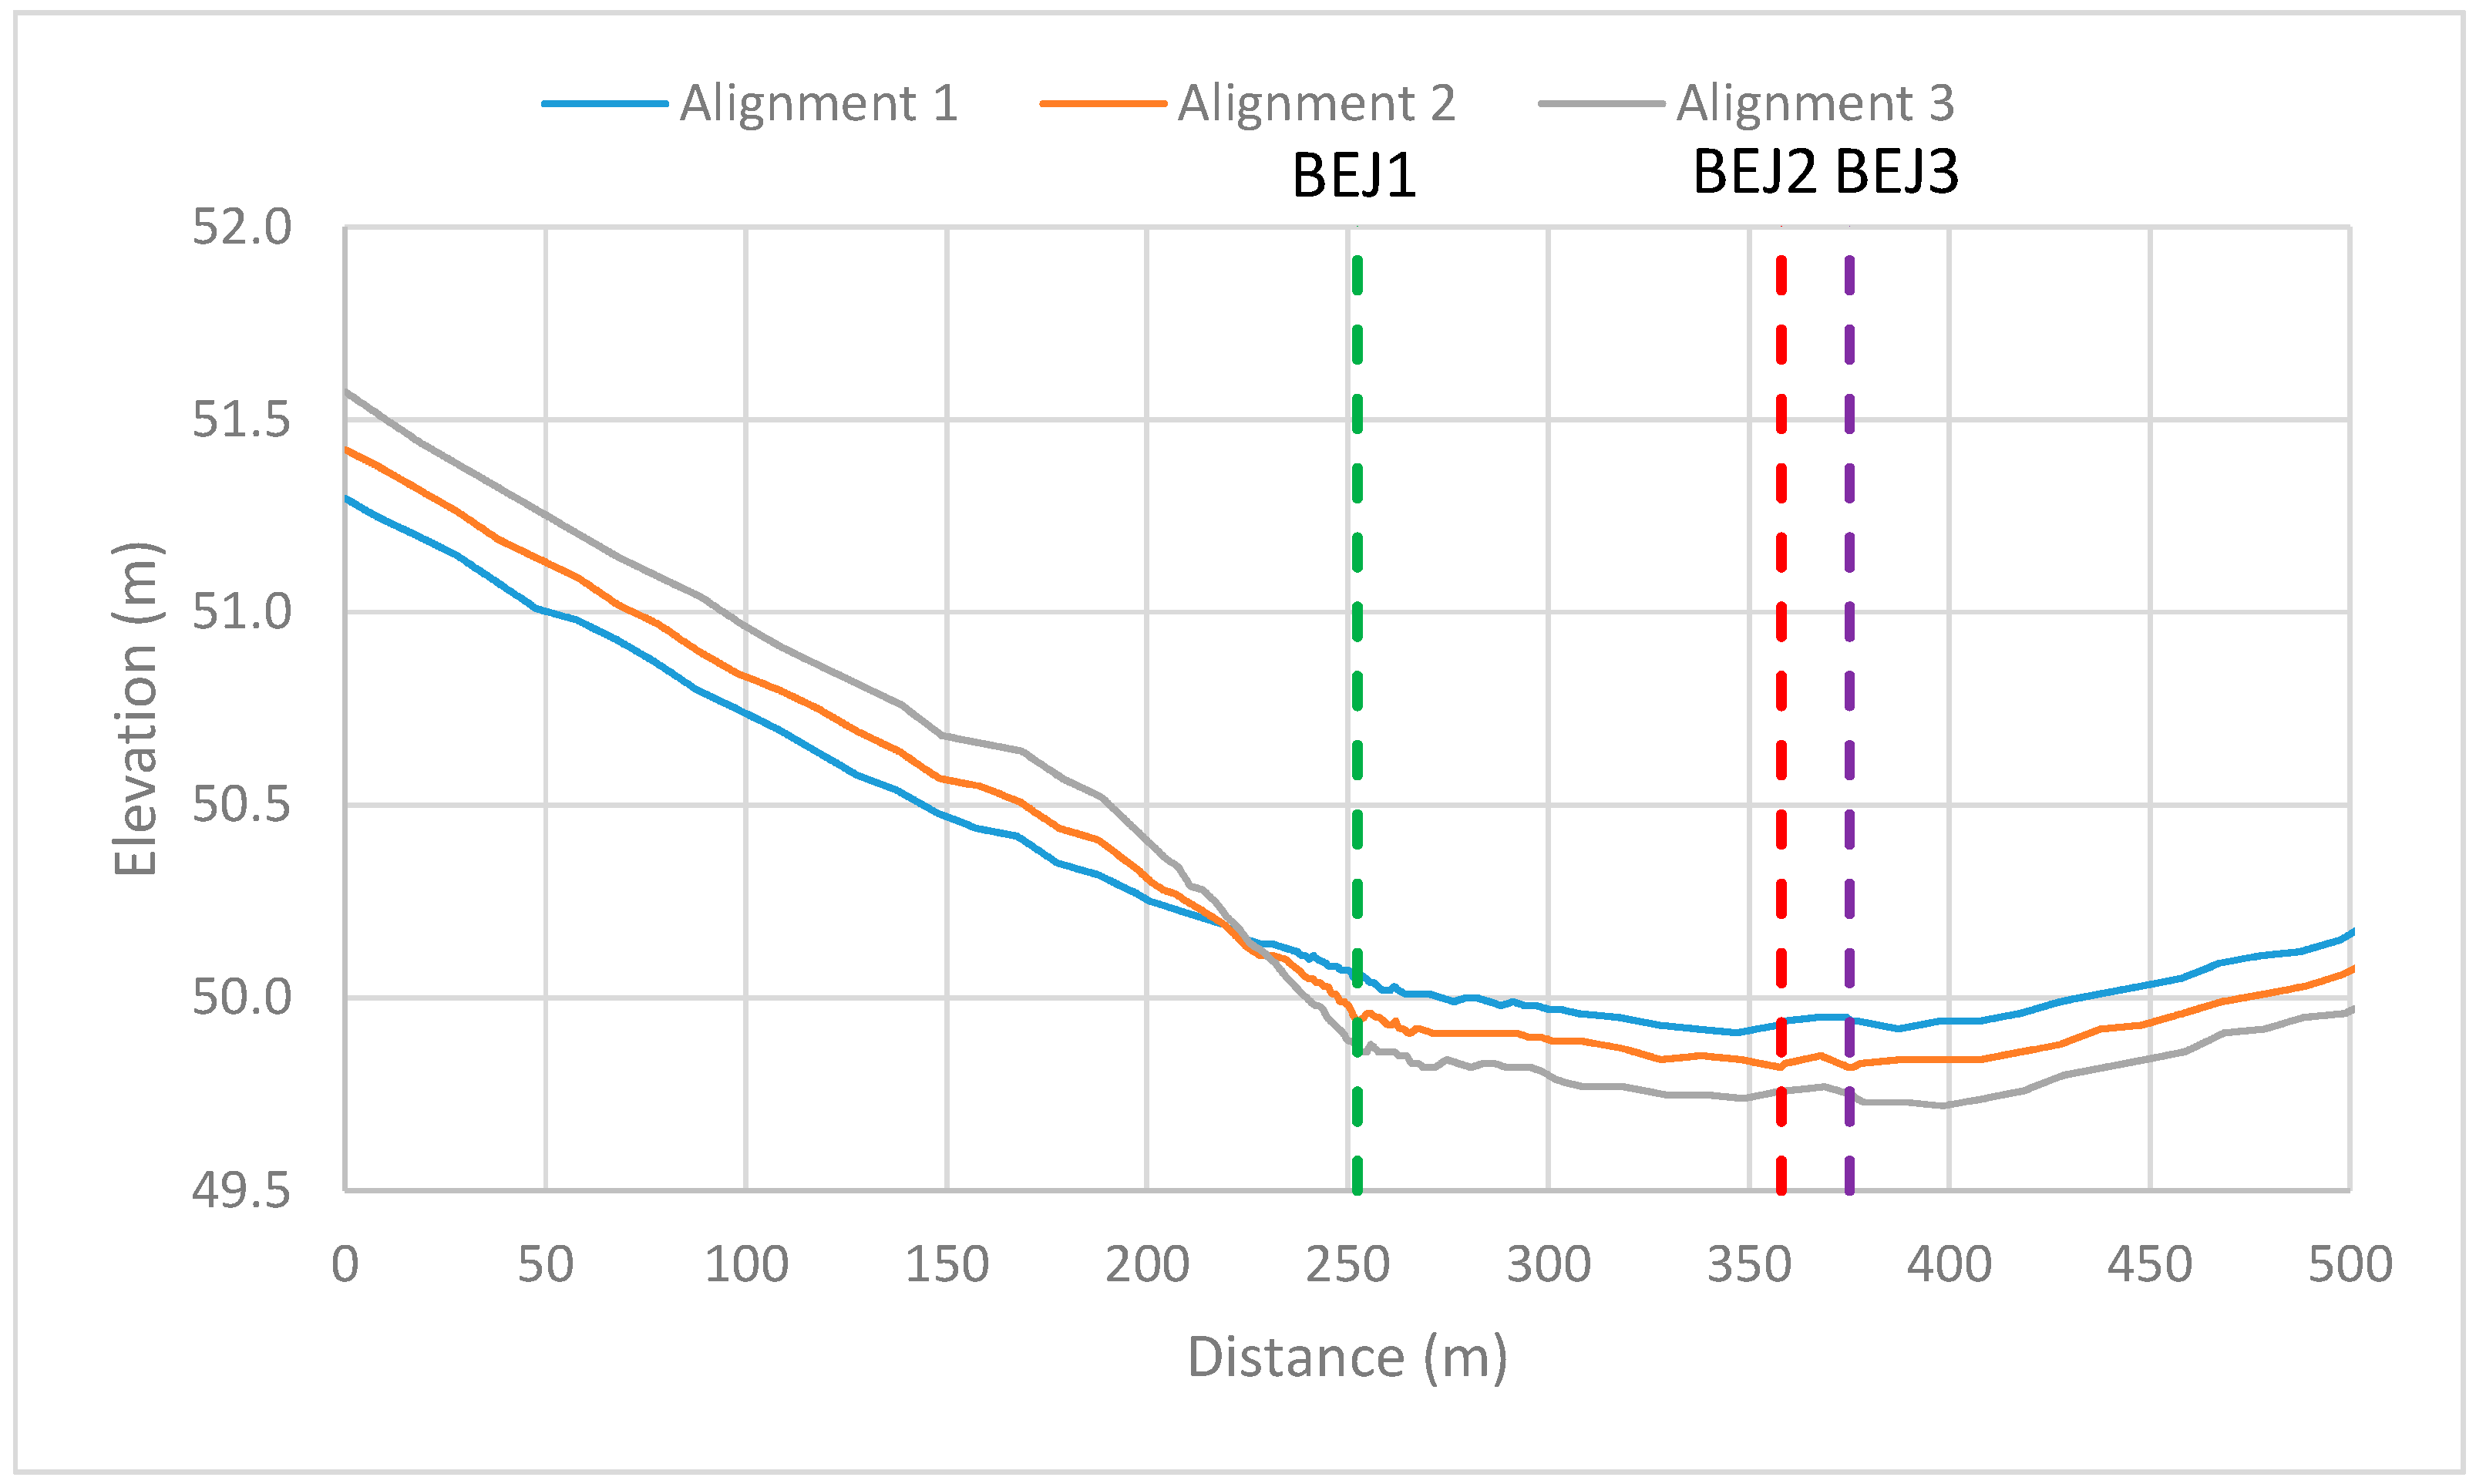
In
Figure 13, the location of all three examined BEJs along the alignments is depicted. The most critical BEJ, close to which many accidents were localized, is BEJ1, which is in a sag section (
Figure 13).
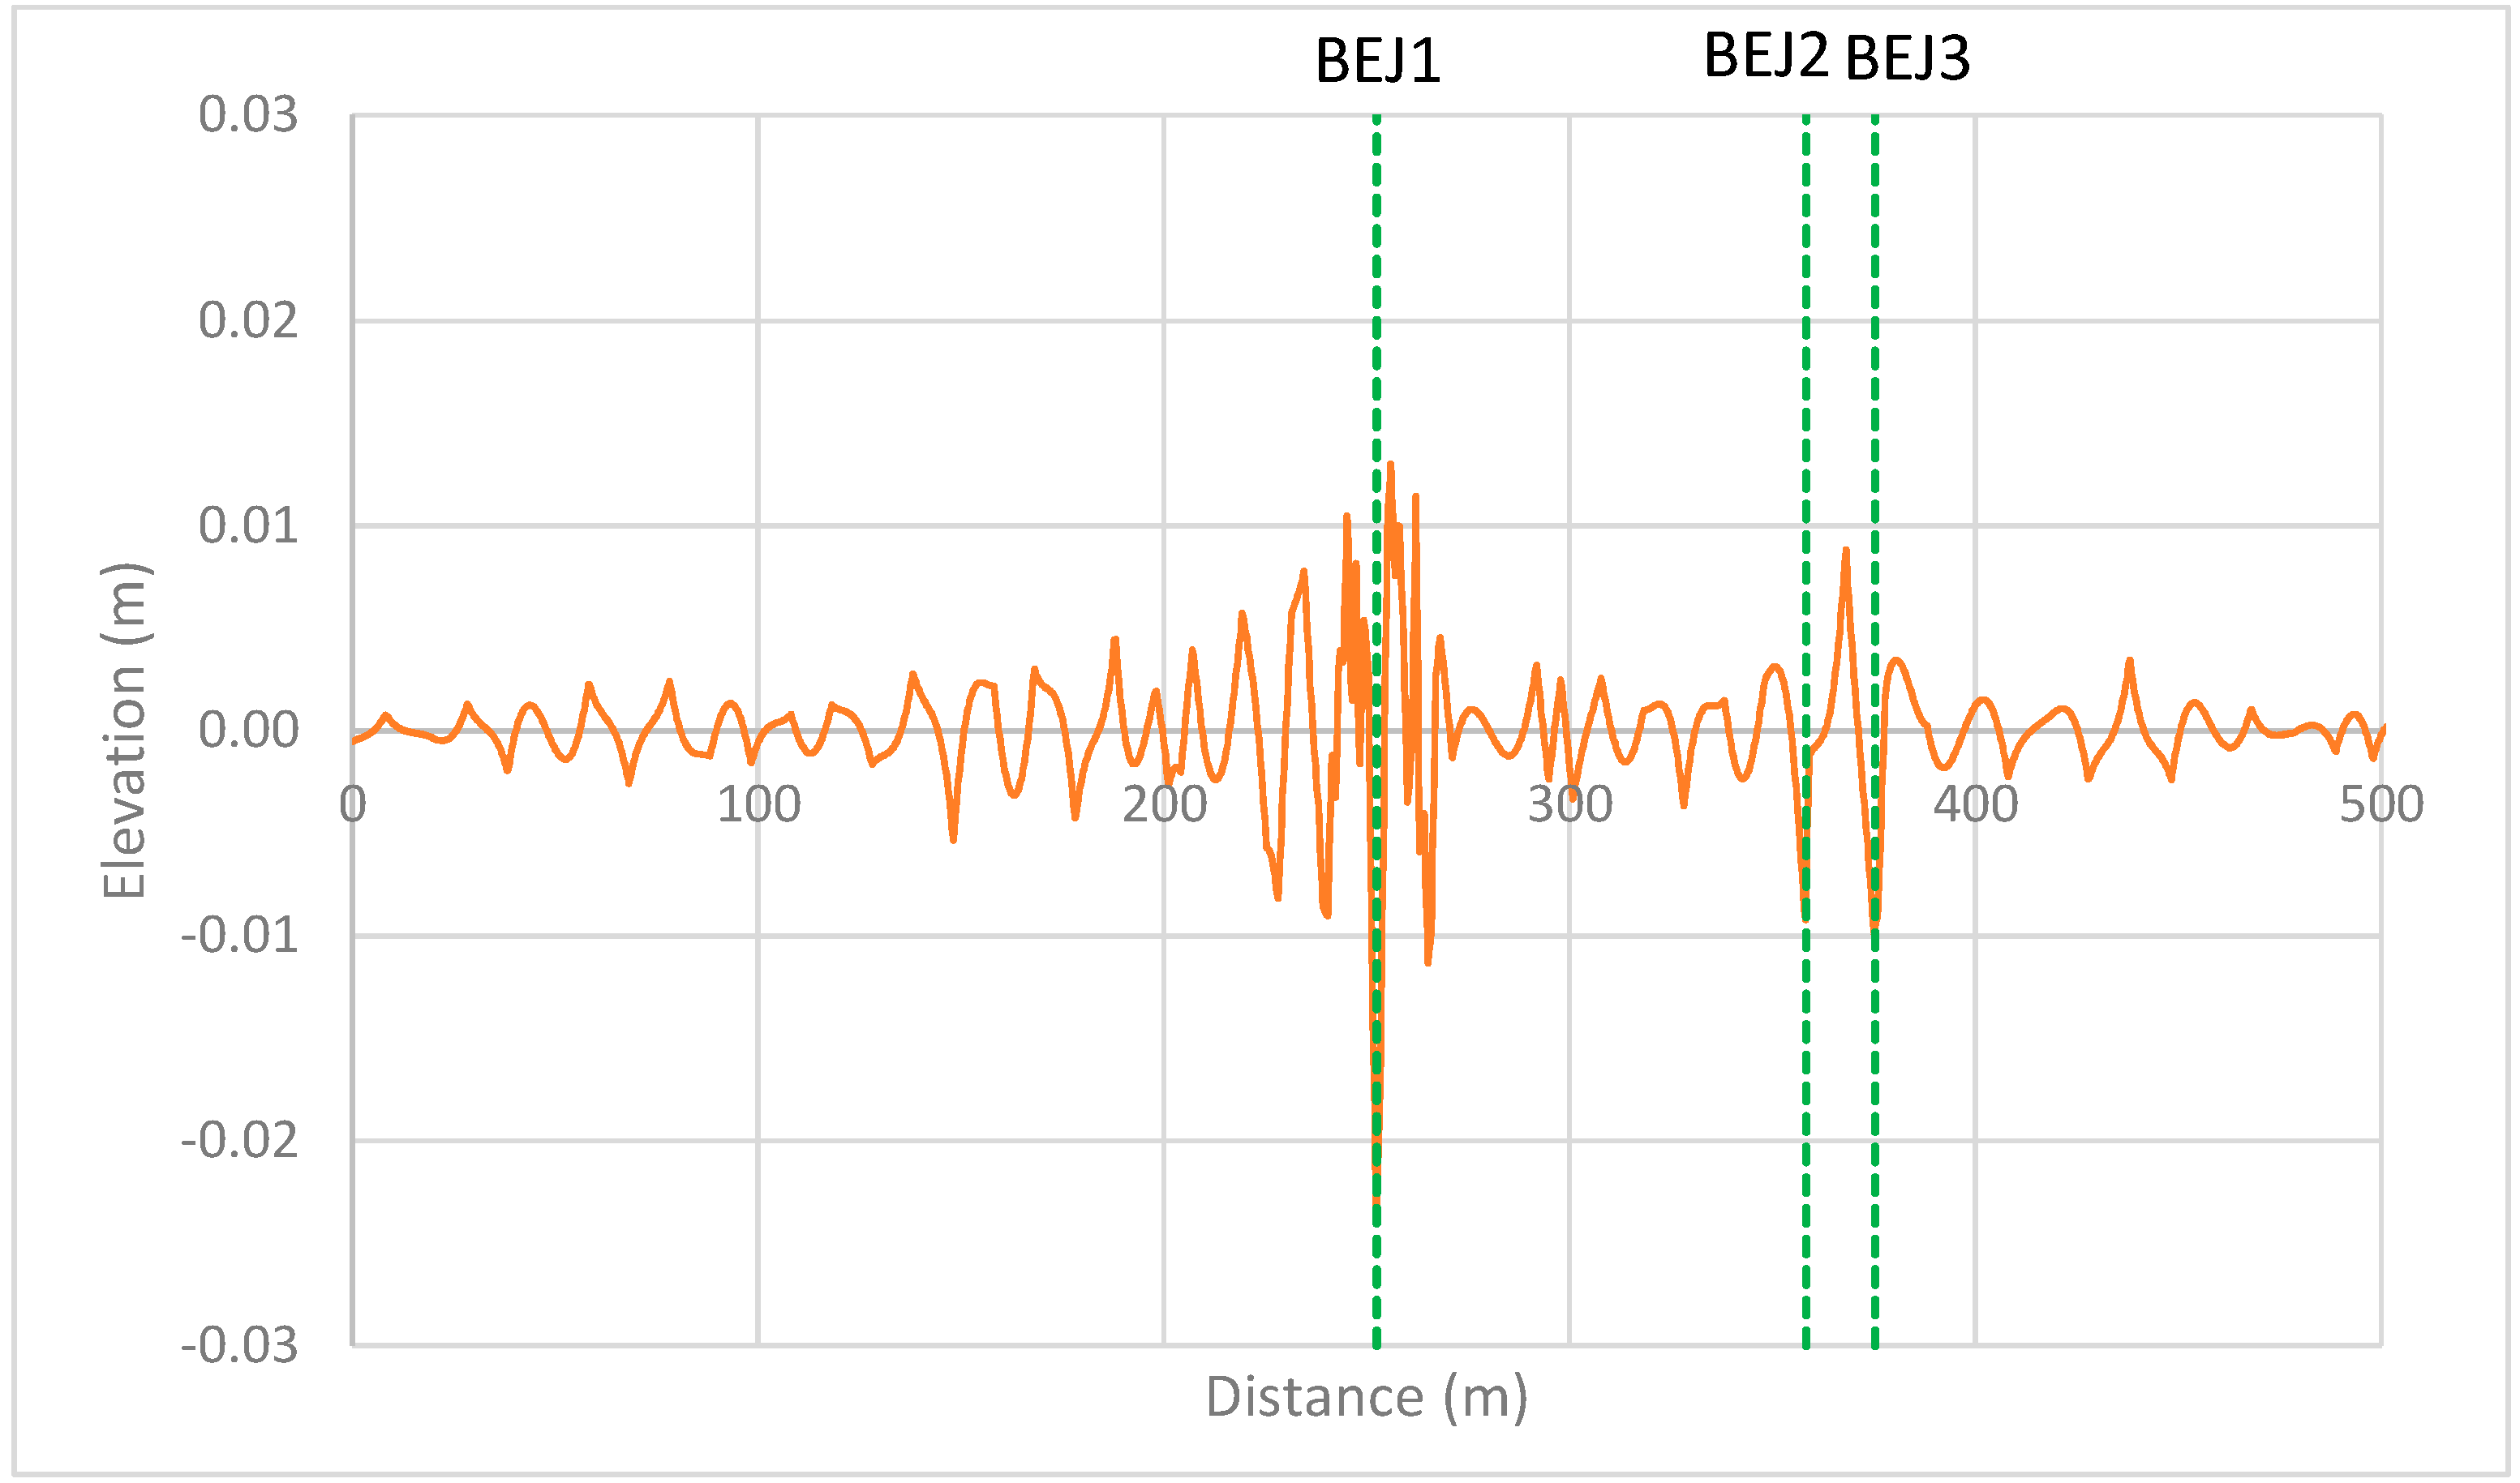
In the examined portion of the road, a rotation of the carriageway takes place, and BEJ1 is placed in correspondence with the transition curve, while the other two (i.e., BEJ2 and BEJ 3) are located in the circle arc. Applying a high-pass Butterworth filter with cut-off spatial frequency equal to 0.05 cycles/m (wavelength of 20 m) to the three 500 m-long alignments, it was found that the most significant irregularities were placed in correspondence to the three BEJs compared to the elevations in the remaining part of the pavement profiles (
Figure 14).
Moreover,
Figure 14 shows that the unevenness caused by the expansion joint in the road transition curve (i.e., BEJ1) is much greater than the other two BEJs. For this reason, further analyses were specifically carried out for BEJ1 (
Figure 13).
From the inspection survey, the largest pavement deformation was found 25 m after the joint location. Other pavement unevenness characterized by wavelengths of about 15 m occurred after the BEJ1. They are linked to the dynamic load applied to vehicles bumping on the joint with a speed of 90–110 km/h and the principal oscillation frequency of about 2 Hz (body bounce).
The roughness assessment of the survey road section was performed calculating the most worldwide used roughness evaluation criteria [
38]: the International Roughness Index (IRI). This approach [
39] is based on a mathematical model (quarter-car), whose mechanical parameters (also known as golden-car) are listed in
Table 4.
Its calculation is performed using Equation (7):
where
l is the length of the profile in km,
v is the simulated speed equal to 80 km/h,
is the time derivative of vertical displacement of the sprung mass in m and
is the time derivative of vertical displacement of the unsprung mass in m. The final value is expressed in slope units (e.g., m/km or mm/m).
IRI was developed in order to assess not only the ride quality on road pavements, but also other detrimental effects, such as dynamic load increment (on both vehicle and pavement) induced by road pavement irregularities. The algorithm to be used for its calculation is provided in [
40].
The Italian highway road agency requires calculating IRI on a segment of 10 m, admitting in general values lower than 1.8 m/km [
38]. In the case of short span bridges and when joints are present on road pavement surface, IRI values until 2.5 m/km are tolerated [
41]. According to
Figure 15, all examined alignments have IRI values greater than the threshold limit suggested by [
41] in the area across BEJ1, while close to the other two BEJs (i.e., BEJ2 and BEJ3) and in the remaining part of the profiles, the IRI values are lower than the threshold value. The only exception is Alignment 2 across BEJ3 (IRI = 3.55 m/km). Considering the significant difference found between the three BEJs in terms of IRI values, it is evident that BEJ1 has the most critical unevenness.
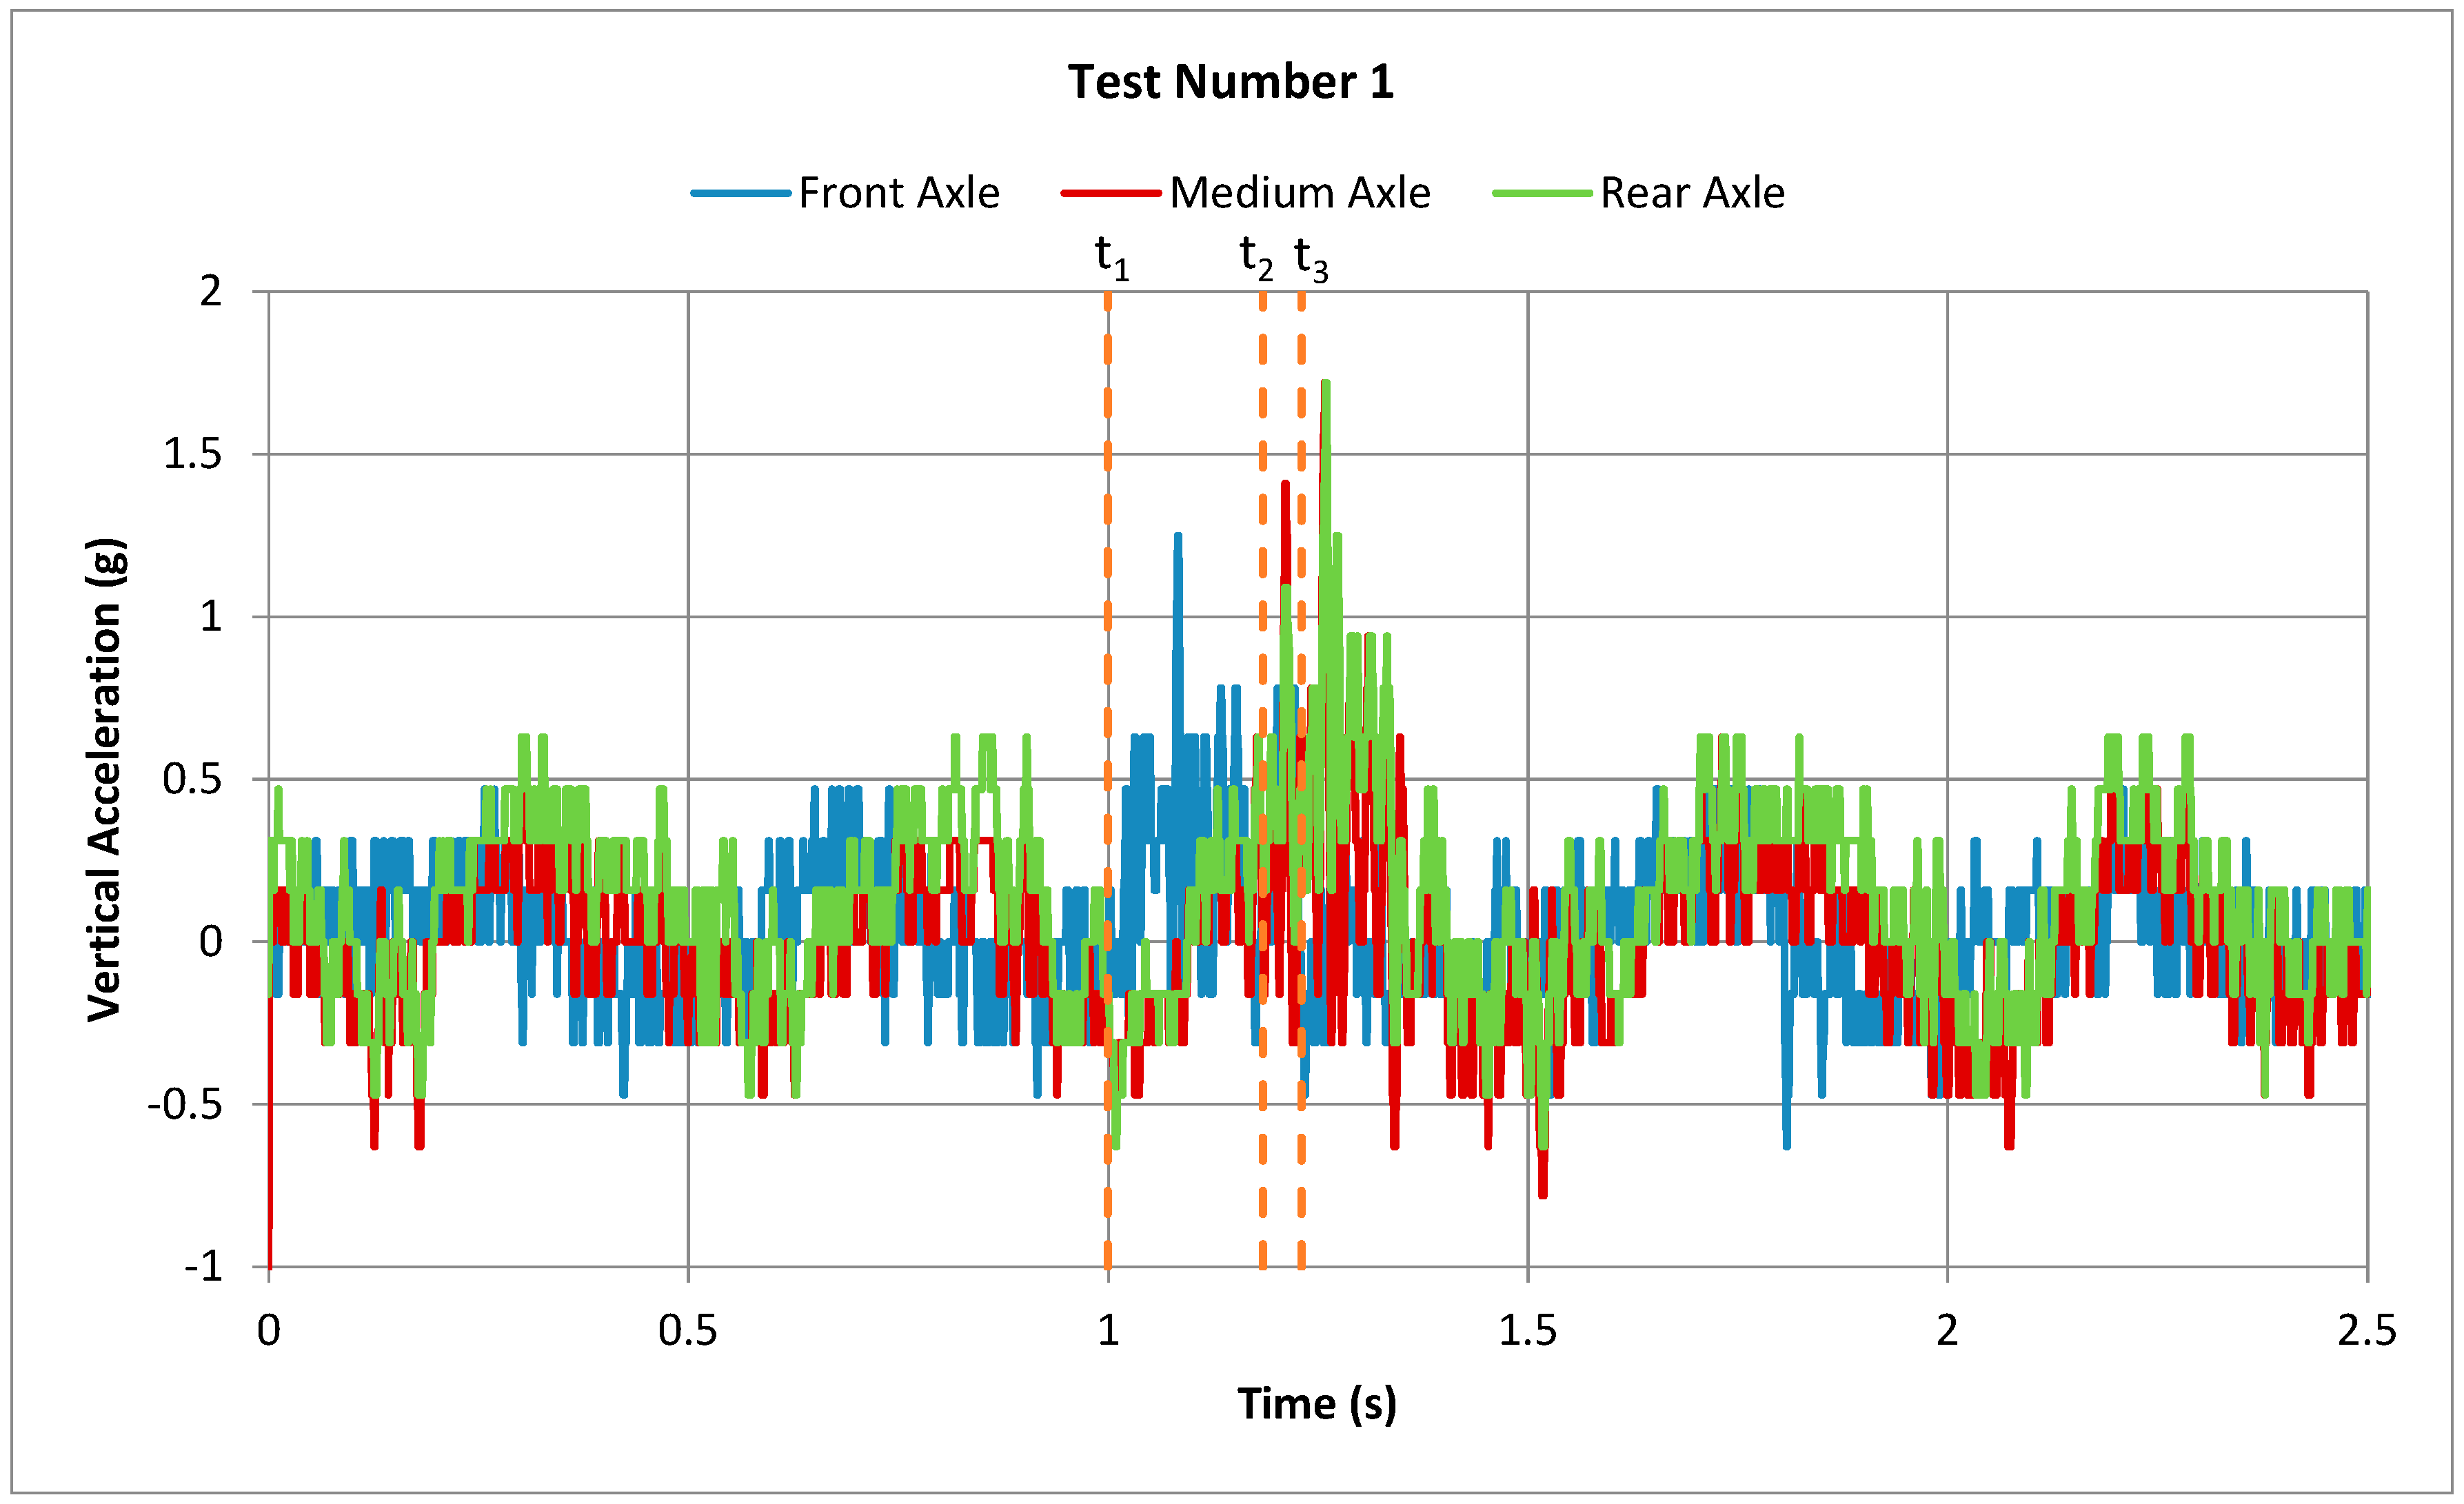
Several in situ measurements were carried out to evaluate the dynamic consequences on heavy vehicles running on BEJ1. All of the recorded accelerometer signals were made uniform to a homogeneous time duration of T = 4.587 s and considering a time sampling equal to 5.6 × 10⁻⁴ s (Δt). Thus, a whole number of N = 8192 samples was registered for each signal. In addition, for all of the vertical acceleration measures, the reference time t0 corresponds to test vehicle transit on a transversal road section located at about 29 m before the BEJ.
Table 5 shows the time of the three axles’ passages on the joint for each loading test, captured by means of a high frame rate camera.
Figure 16 shows the recorded accelerometer signals provided by the accelerometers on the front, medium and rear axles (number of tests = 1), with the indication of the three bump axle times. Positive peak values higher than 1 g were found for all of the test vehicle’s axles, confirming the loss of tire/pavement contact due to the passage on BEJ1.
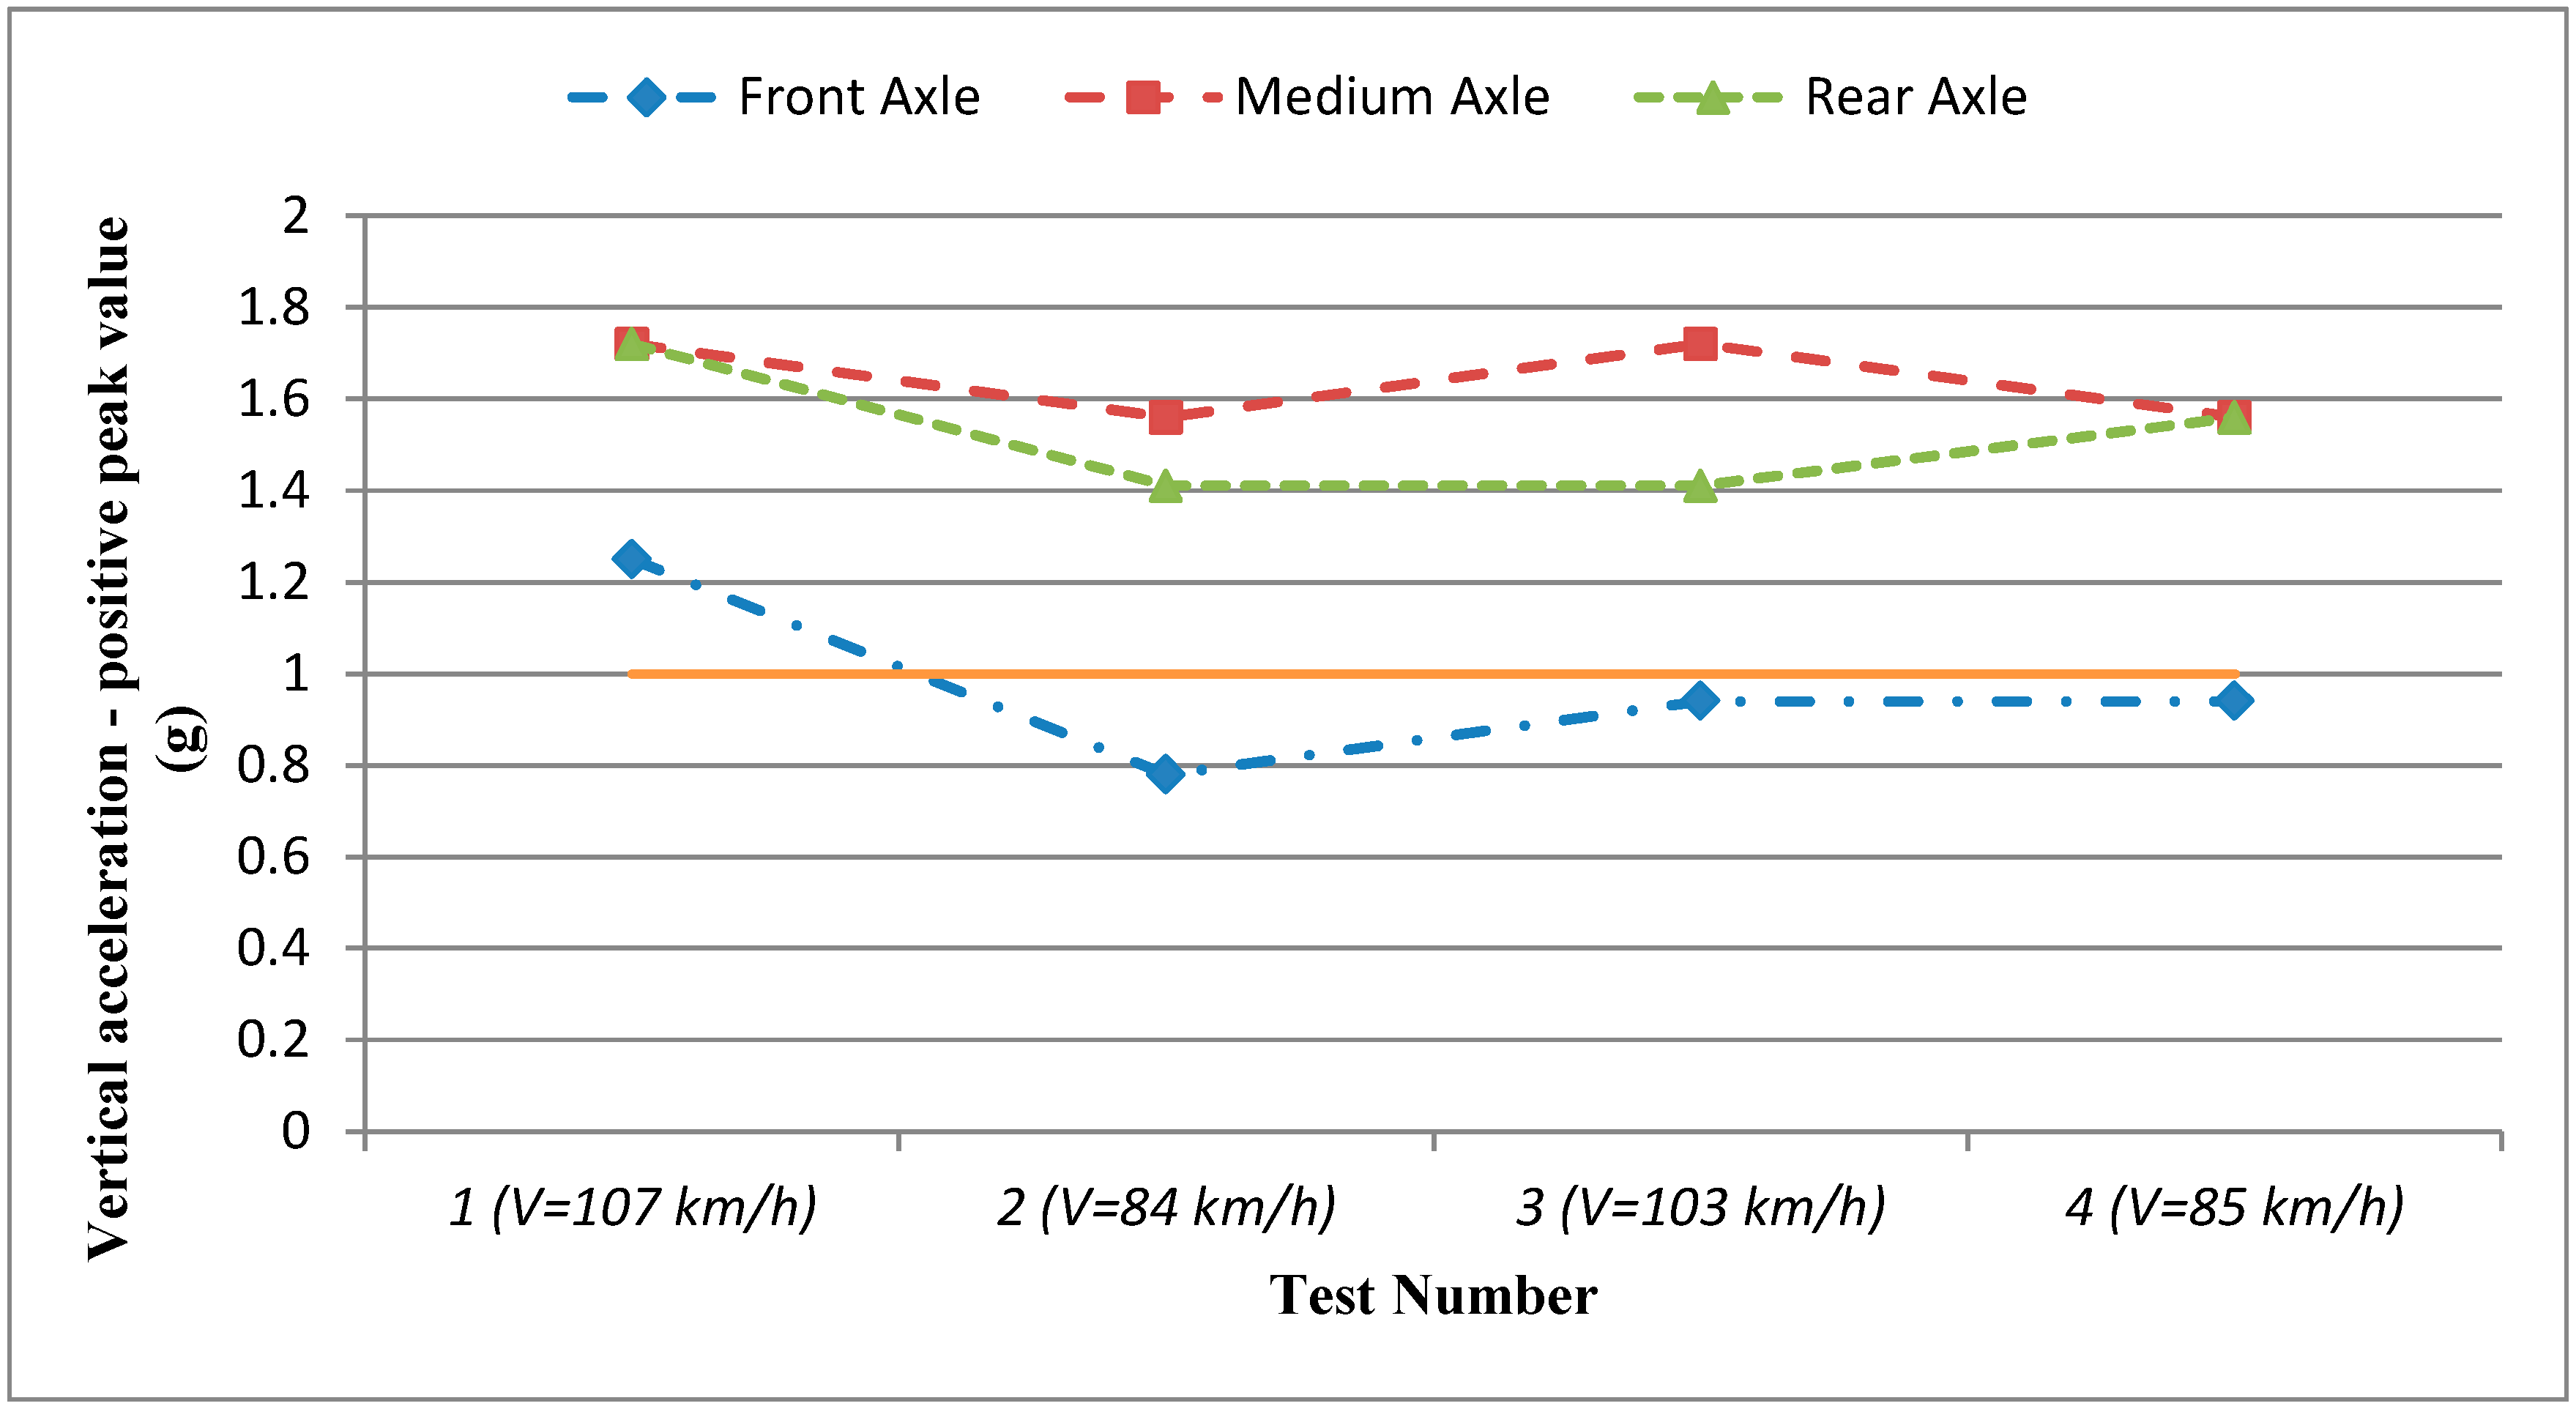
Analyzing the maximum positive vertical accelerations obtained for each configuration test (
Table 2), it was found that the medium axle was the most critical one (
Figure 17). In addition,
Figure 17 highlights the importance of the moving speed: increasing the vehicle velocity results in an increment of vertical acceleration on vehicles and passengers.
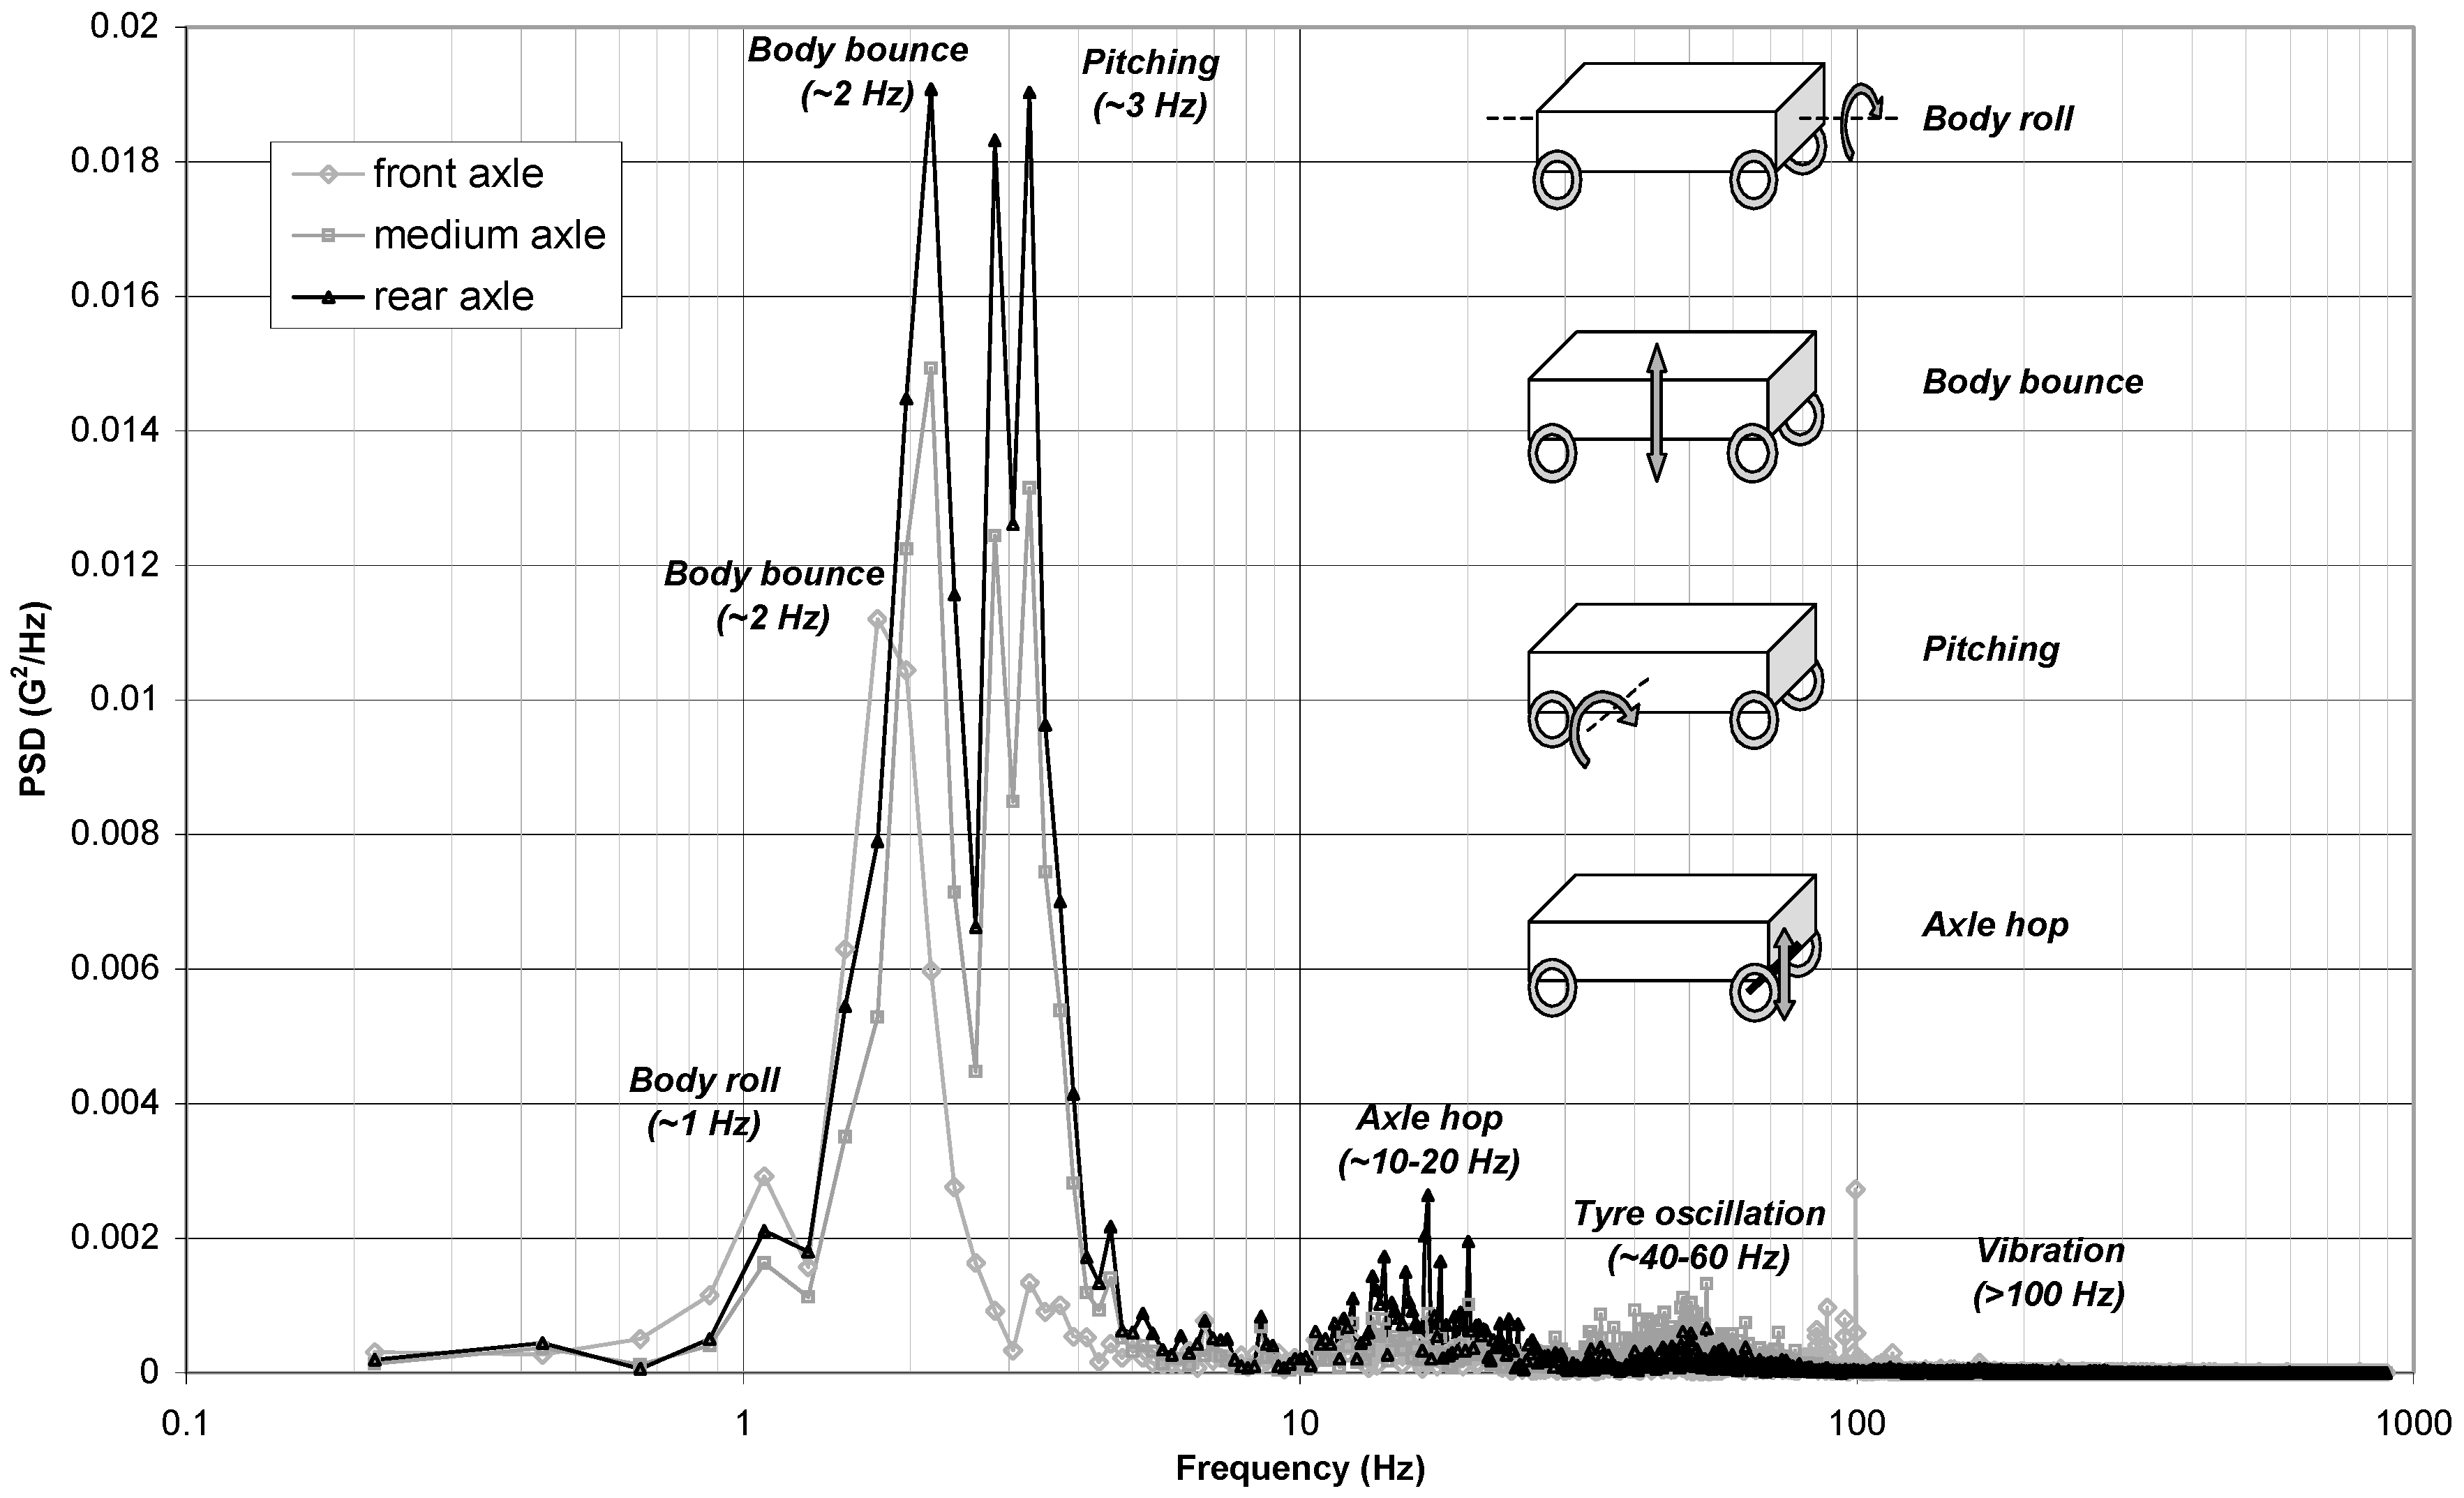
All of the collected data were also analyzed in the frequency domain, and the results were represented using the acceleration power spectral density (PSD) function. This procedure permitted studying the principal oscillation and vibration components of the vehicle due to the bump (
Figure 18).
According to
Figure 18, the main oscillation components are:
Vehicle roll oscillation: body roll f 1.0 Hz (T 1 s) (sprung mass);
Primary vehicle oscillation: body bounce f 2.0 Hz (T 0.5 s) (sprung mass);
Vehicle pitching oscillation: pitching f 3.0 Hz (T 0.33 s) (sprung mass);
Primary vehicle axles oscillation: axle hop f 10–20 Hz (T 0.1–0.05 s) (unsprung mass);
Tire oscillation and vibration: f 40–60 Hz (T 0.025–0.017 s) (unsprung mass);
Power and other part in vibration: f > 100 Hz (T < 0.001 s) (vibration).
Lower frequency responses (1–4 Hz) characterize the vehicle’s body (sprung mass) bounces, or pitches and rolls. High-frequency responses (10–50 Hz), instead, correspond to axle hop vibrations.
Acceleration measurements and their processing permitted identifying all vibrational components induced in the vehicle test by the geometric irregularity of BEJ1. In particular, the most important ones, which have a frequency range 1–4 Hz, determine the complete lifting from the pavement of the rear axles of the running ordinary heavy vehicles. Consequently, this phenomenon reduces the adherence of wheel-pavement, until the complete loss of adherence. Furthermore, in the paved areas adjacent to the joint, more accentuated irregularities appear, due to the considerable dynamic increment of the loads transmitted to the pavement.
In this sense, several simulation analyses were performed using the linear quarter-truck model described in [
32] to estimate the dynamic load increment for the heavy vehicles’ characteristic speed range running on the examined road (i.e., 80–120 km/h). The results of the simulation analyses (
Figure 19) show higher DLC values, increasing vehicle speed in analogy with literature studies [
34,
37]. The DLC calculation was performed considering just a limited segment having a total length of 100 m: 50 m before and 50 m after the BEJ1.
Comparing the DLC obtained for two different alignments (i.e., 1 and 3), the highest values were found for Alignment 3, whose unevenness (due to the BEJ presence) was greater than Alignment 1. In fact, the rotation of the carriageway along the transition curve has its torsion axis (inner roadside) very close to Alignment 1.
Figure 19 also reports the DLC mean value for both front and rear axles calculated considering all three alignments. A major dispersion (referred to the DLC mean value) was found for the rear axle, probably caused by the mechanical parameters considered.
The results obtained from the DLC analysis, in analogy to what was found through in situ acceleration measurements, highlighted that the rear axle is the most critical one in terms of the dynamic load transmitted to the pavement and to the bridge structure.
DLC values were also calculated for the first 100 m of the examined road branch, where no BEJs are present, to better underline the effects caused by BEJ1.
Figure 20 shows that the DLC of the first 100 m-long road has values significantly lower than those calculated in the area surrounding BEJ1.
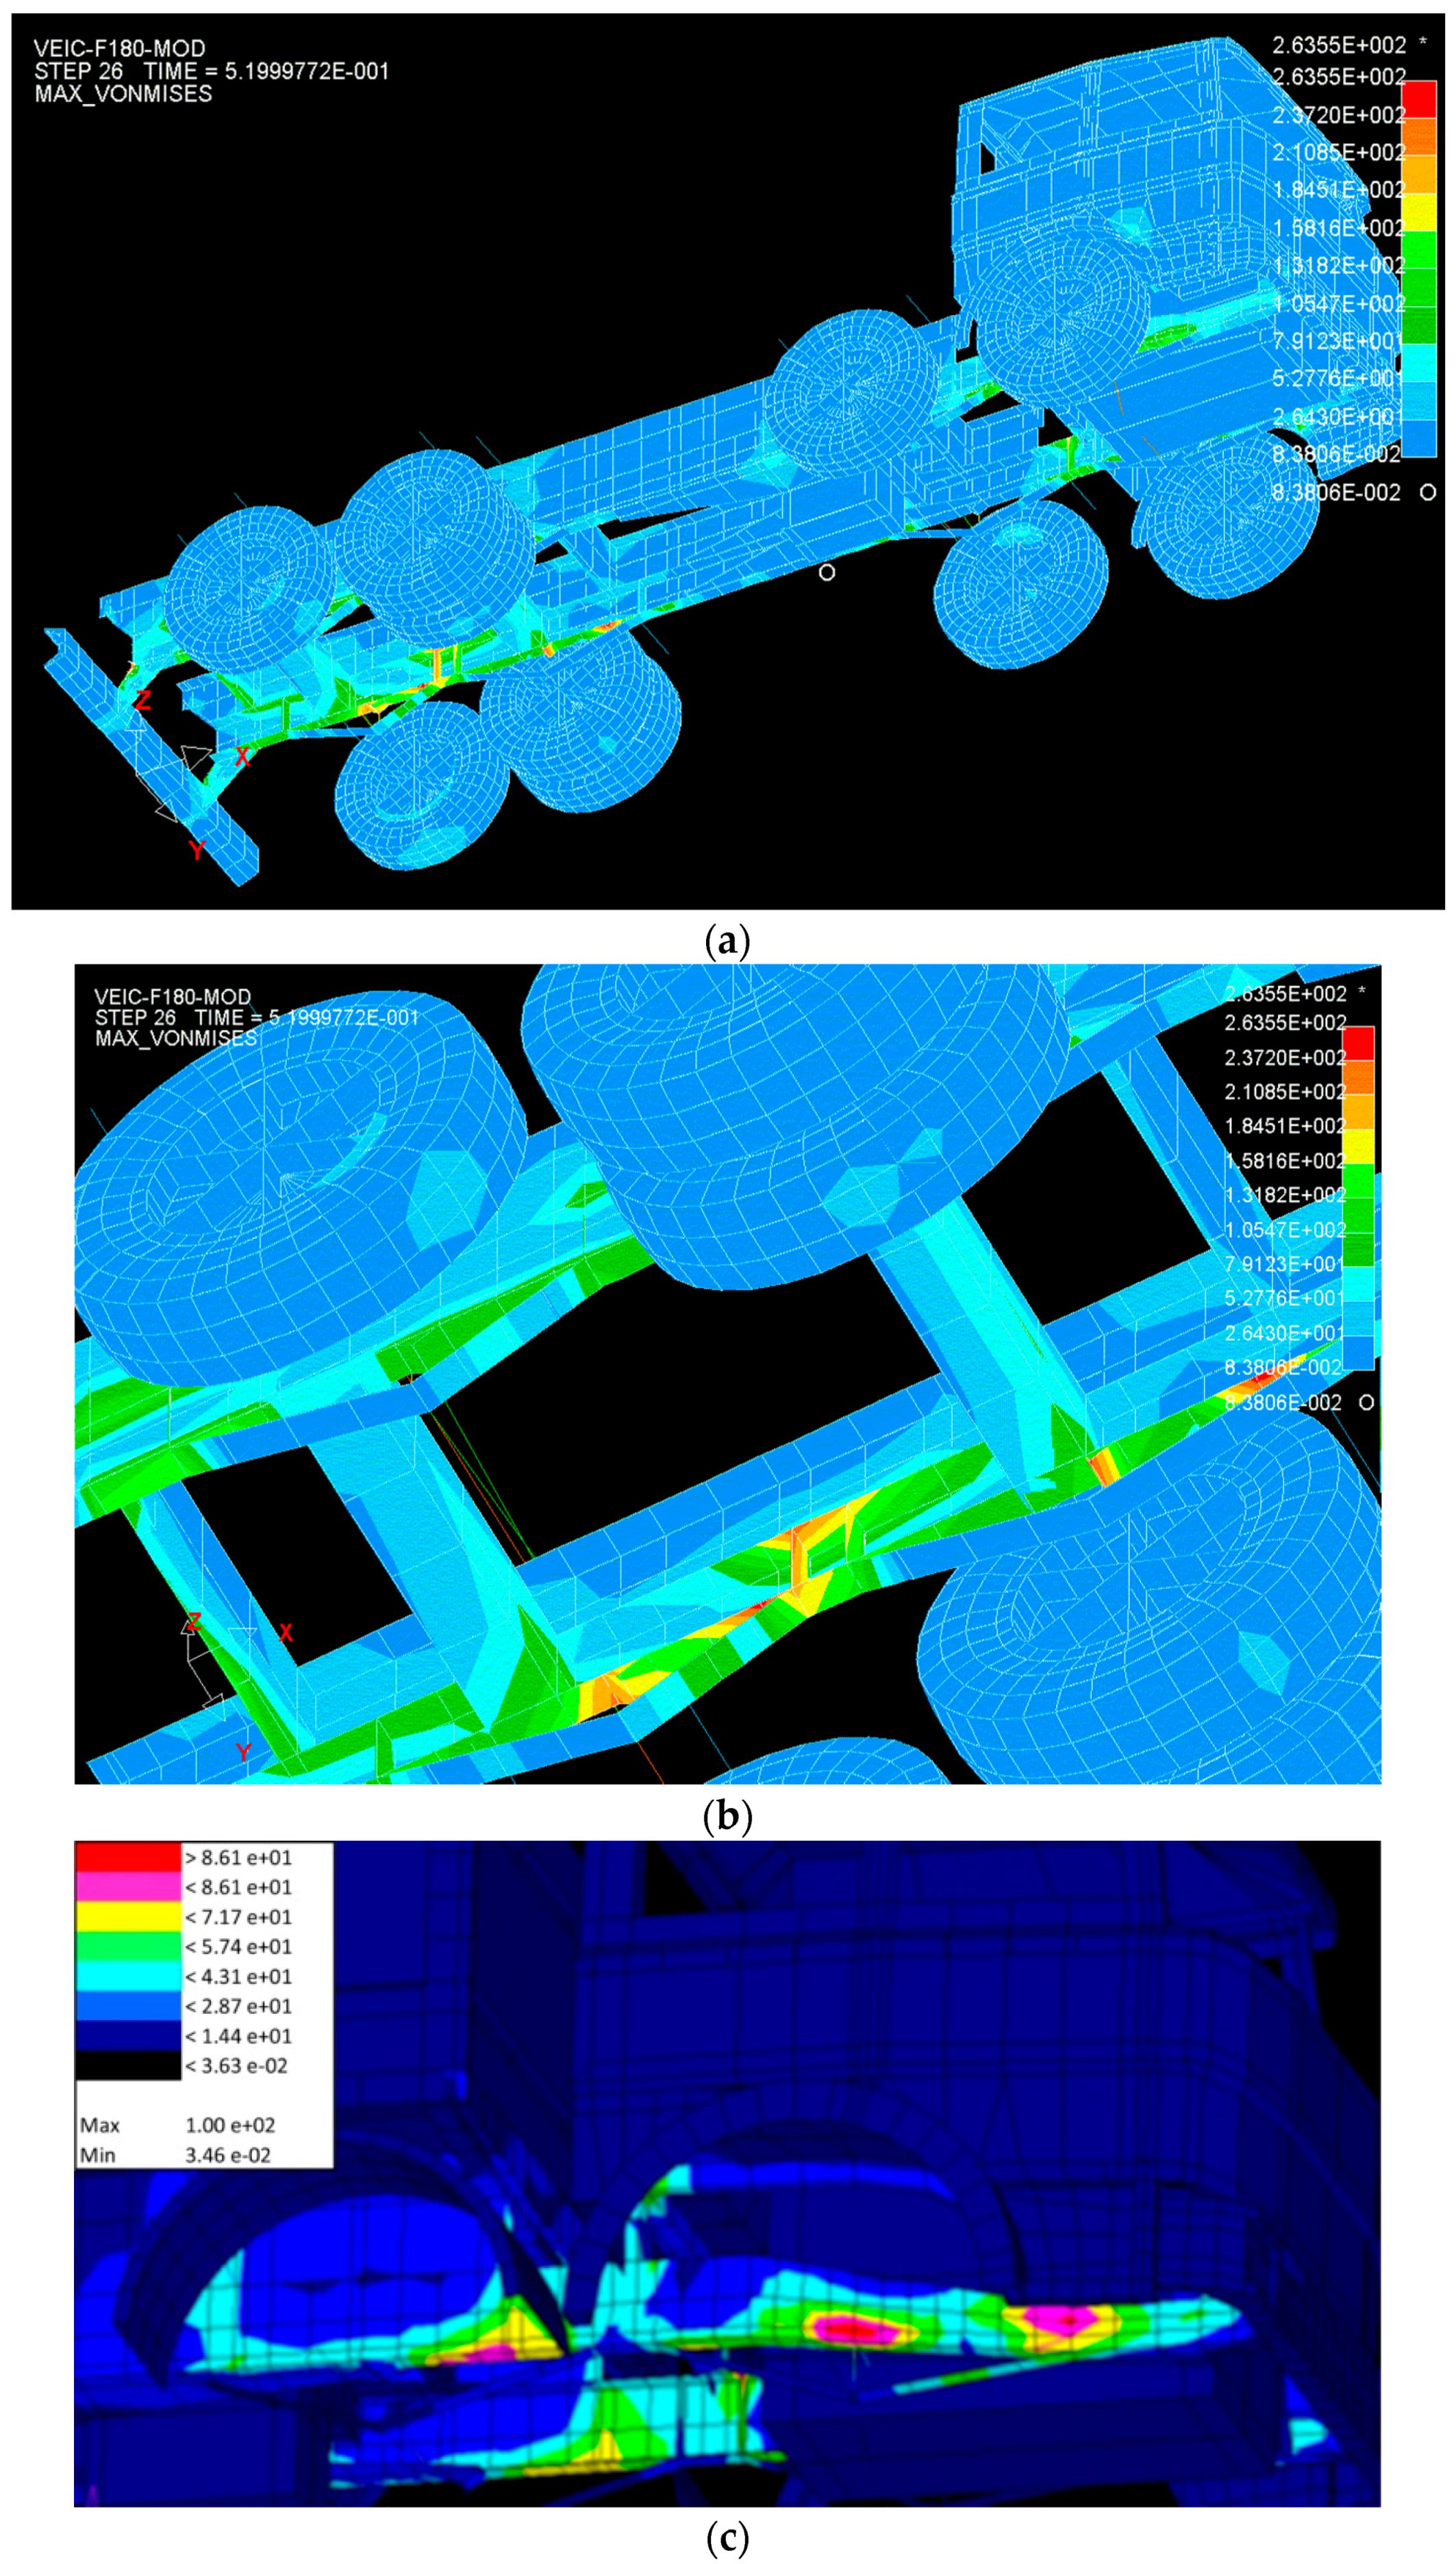
Finally, the stress distribution on heavy vehicle mechanical components due to the transit on BEJ1 was investigated by means of a 3D model. The obtained results are depicted in
Figure 21: since the maximum depth of the measured elevation is about 2.5 cm, the stress magnitude is not particularly burdensome for vehicle components.
Thus, the location of a BEJ in a transition curve does not provide a significant increase in the mechanical components of road vehicles, while it meaningfully affects traffic safety (due to the loss of tire/pavement contact) and dynamic load increment (i.e., higher forces transmitted to the road pavement and bridge structure).
For these reasons, the road agency planned:
the reconstruction of the joint to permit a more regular and continuous variation of the planimetric geometry of the road platform;
measures for the reduction of the driving speed (i.e., speed cameras and speed enforcement) to ensure a better circulation.
The adopted strategies ensure that under ordinary conditions, the circulation is regular, and the accident risk for road users is reduced; moreover, the reduced number and frequency of the required maintenance works increase the traffic safety.
5. Conclusions
In road engineering, bridge expansion joints often cause troubles concerning evenness and skid resistance. Even if the joint is designed and built in accordance with the best practice, the discontinuity of the pavement may produce a dangerous unevenness. This irregularity could be very important if the joint is in a transition section (clothoid) of the road, as considered in the paper. In fact, in this section, the curvature and super-elevation of the road gradually change between two consequent elements with different planimetric curvature. Consequently, in this area, the road surface is “slanted”, and if the joint is large (for example in a highway seismic joint), the elevation difference from the points of the road can reach some centimeters. This difference could produce an additional, undesirable unevenness in addition to a possible construction unevenness.
A heavy vehicle was instrumented with piezometric accelerometers to evaluate the effects of the irregular BEJ on a running vehicle. The results of the performed surveying and tests highlighted the unevenness on the surface profile caused by the presence of the BEJ along a transition curve. The analyses carried out in the present work underline how this kind of discontinuity may affect the response of truck suspensions and the dynamic response of the bridge. The measurements permitted also identifying the most representative frequencies of loads applied to the structure. The results also confirmed the possibility of a complete lifting of the vehicle’s rear axles with serious risks of grip loss on the road and, consequently, serious detrimental effects on road traffic safety. The road agency adopted two main actions to improve the level of service in the road section and to ensure a safe and efficient traffic flow: reduction of geometric irregularities resulting from the joint and reduction of the allowed speed.
BEJs are localized irregularities that can have different severity levels according to many factors, such as if placed in the road transition curve. This study provides a guidance on the evaluation of the detrimental effects induced by BEJs, which may affect all of the road infrastructure components: vehicles, pavement, bridge and users, with attention to safety. The results can be used by road agencies to specify strategies and procedures for policies to guarantee minimum safety levels at roads.


