1. Introduction
Explosive bolts are typical pyrotechnic release devices used for diverse applications, including launcher operation, rocket sled release, etc. [
1,
2,
3,
4]. Compared with normal bolts, an explosive bolt usually has a cavity filled with a removable cartridge or an explosive charge. By detonating the explosives, a shock wave is generated and the explosive bolt is broken so as to realize multistage separation between interfaces. Hence, the separation reliability is of great significance for release devices.
The reliability, efficiency, and design of explosive bolts has been studied [
1,
4,
5,
6]. Juho Lee et al. [
1,
4] established separation behavior analysis environments for ridge-cut explosive bolts and verified the numerical analysis method, including appropriate failure criteria. Their works focused on the separation mechanism and design parameters of explosive bolts. Syed Haider Abbas et al. [
5] proposed a non-contact, multipoint, and remote pyroshock measurement system to measure the pyroshock waves generated, which is very important to understand the characteristics of pyroshock on the host structure. Peng Gao et al. [
6,
7] proposed dynamic reliability models based on equivalent strength degradation paths and discussed the dynamic reliability analysis of explosive bolts in the launch process of satellites. Most of the literature has focused on the reliability of the structures in the exploding procedure and static strength design problems.
Yet, for missile devices, this reliability issue should cover the procedure of long-distance carrying on vehicles. In this procedure, missile vehicles experience alternating road surfaces. In addition to the vehicle parts, the missile and its connecting explosive bolts also undergo vibrations, which may cause fatigue damage and result in the failure of the release device. This connecting reliability is affected by the pretension force, structural geometry, failure probability of materials, and so on. Thus, it needs a comprehensive safety analysis. So far, no literature outlines how to design and prevent fatigue failure or how to perform fatigue assessments for explosive bolts.
Thus, in this article we state the process to evaluate the fatigue of explosive bolts on missiles during carrying on roads of Class A, C, and E. First, road roughness curves are generated via the displacement power spectral density (PSD) function according to ISO standard. Dynamics analyses are then performed by code ADAMS to obtain acceleration responses of different points on the vehicle, and the corresponding stress distribution of explosive bolts are calculated with FEM code ABAQUS. Finally, the fatigue life of the explosive bolt is evaluated by the stress-life method.
2. Generation of Road Surface Spectrum
Road roughness function
xm(
L) is generally defined as the variation of height
xm of a road surface to a reference plane along road length
L [
8]. Stochastic data of road roughness are measured and processed to obtain a displacement PSD
.
According to ISO 8608: 1995 [
9],
is namely road roughness factor. On the basis of displacement PSD, road surfaces are divided into eight classes from A to H.
n is spatial frequency, i.e., the number of wavelengths per meter,
a reference value of
n, and
an exponent of fitted PSD.
is the road roughness value at
, which is a constant for a given road class. From the national standard [
9],
and
.
If a road is sampled
N times with an interval
, the total sampling length is
and the spatial frequency resolution is
. With the discrete Fourier transform, the obtained data
is transformed to
The relationship between
and the displacement PSD
is [
10]
where
. Equation (3) gives the modulus value of the discrete Fourier transform. Suppose the phase angle is
, randomly selected in [0,2
], then
In Equation (4), only the first terms are transformed by the discrete Fourier transform, in which . Through mean normalization, we have and then and , and , …, and are respectively conjugate.
Performing the discrete inverse Fourier transform for
, we get [
11]
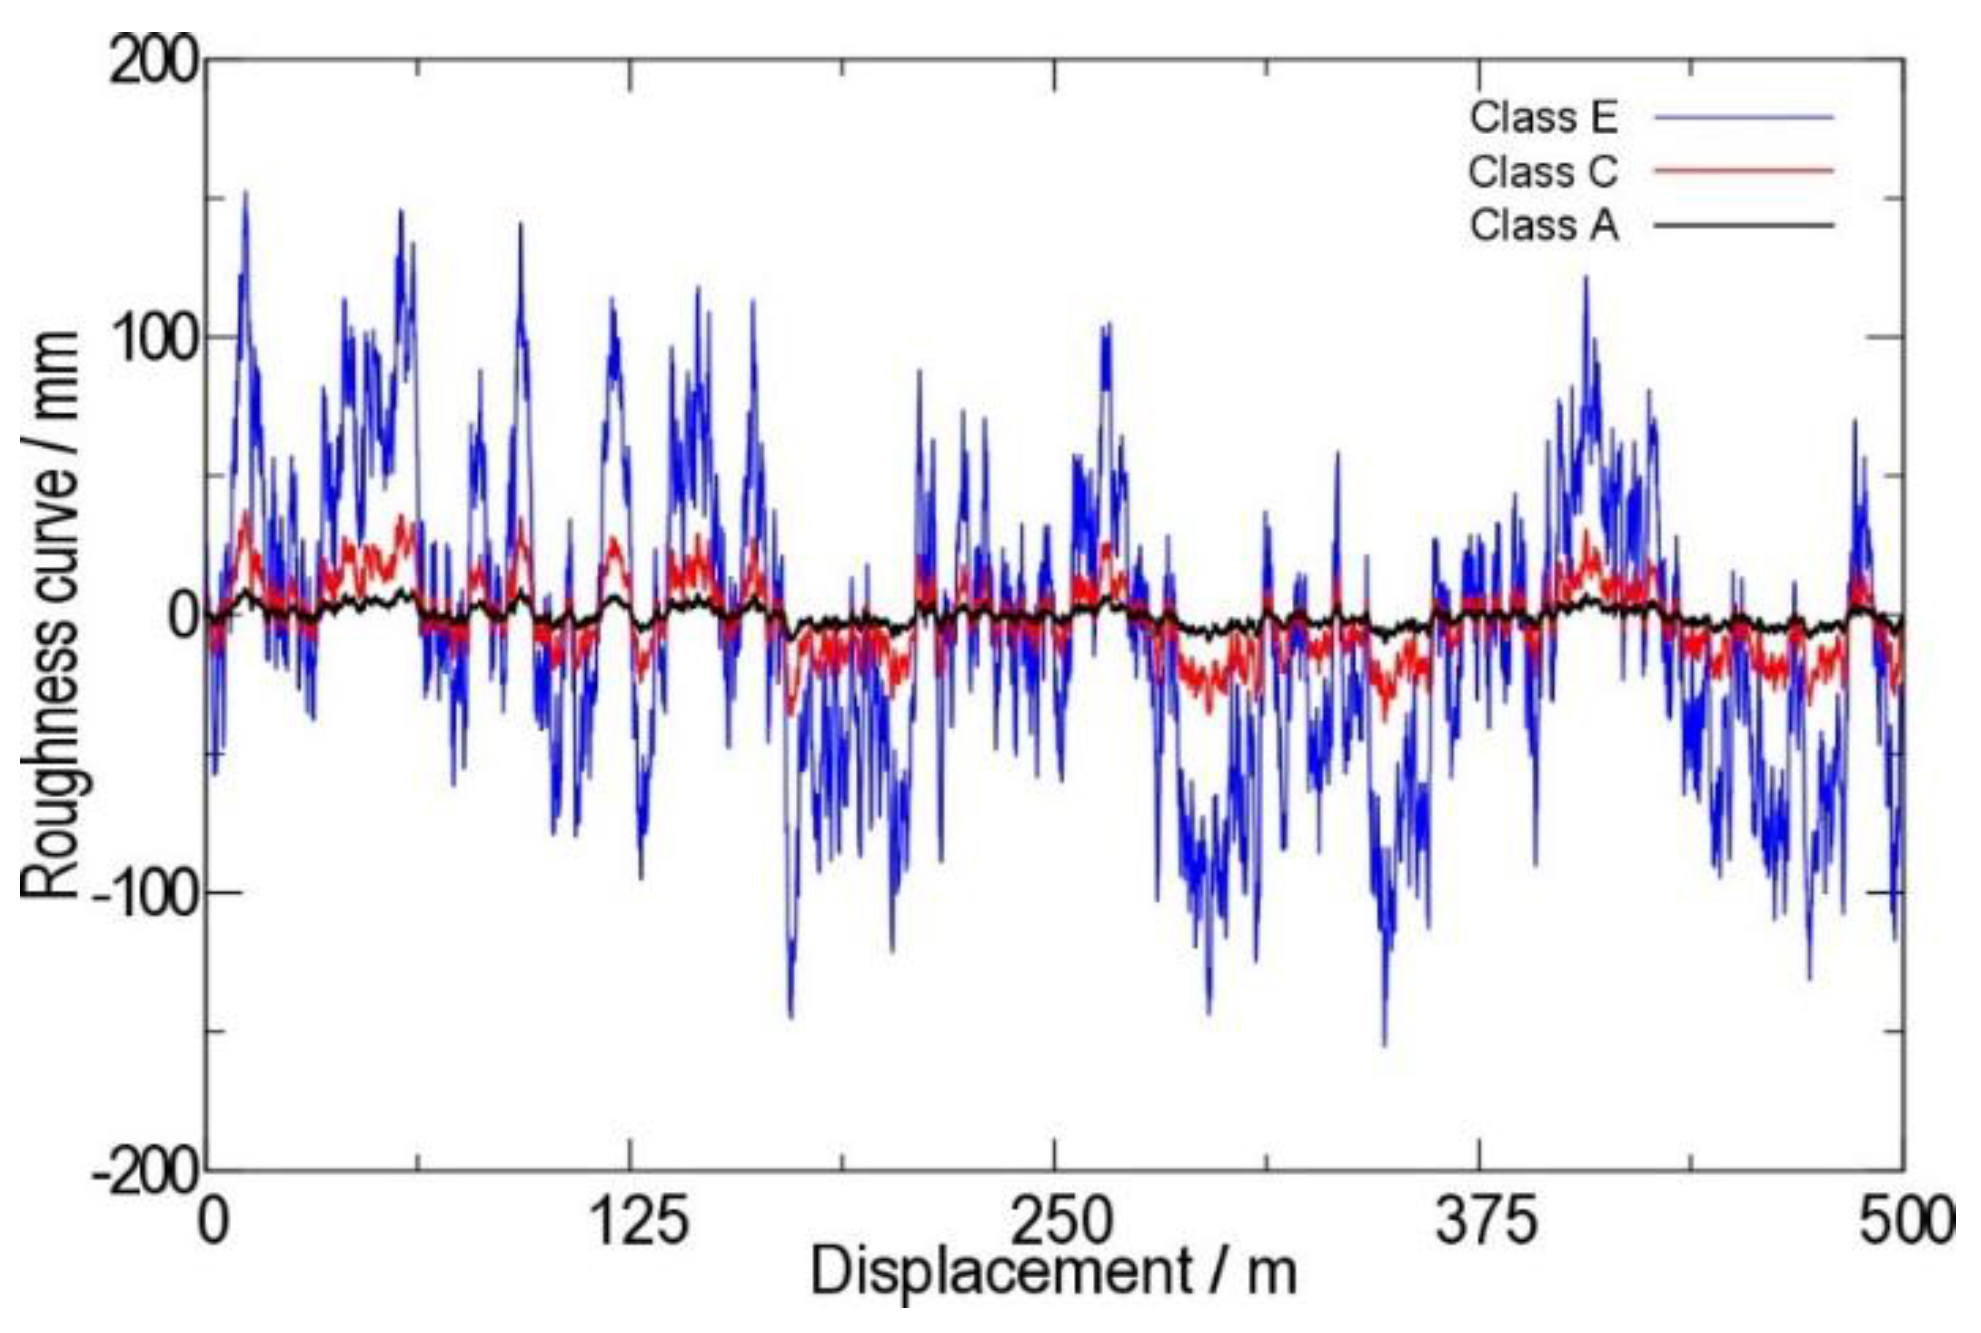
Statistical data shows that most of the highways in China belong to Class A, B, and C [
12]. So, in this paper Class A is taken as an ideal condition, Class C as a common one, and Class E as a severe one. We then simulate the road roughness and correspondingly study the dynamical response of the missile vehicle in maneuver.
Due to the existence of the vehicle vibration isolation system, the spatial frequency
n is sampled within the range of (0.011, 2.830) [
13]. Here, the sampling length is
with an interval
. From Ref. [
9],
is
,
, and
for Class A, C, and E roads, respectively. For each class, the same random sequence is used for phase angle
in Equation (3). Hence the road roughness of different classes changes proportionally and the ratio is
as plotted in
Figure 1.
3. Dynamics Analysis of the Missile Vehicle Based on ADAMS
The missile vehicle is simplified as shown in
Figure 2. The DOFs of
Y translational degree of freedom—the rotation degree of freedoms about axis
X and
Z, ROT
X and ROT
Z—are set to zero. The chassis is simplified as a rigid body, the suspension systems are described as Spring-Damping systems, and the Pacejka 89 tire model is picked to simulate the tire.
The suspension systems are constrained to the chassis with fixed joints, and all DOFs of these joints are constrained to zero. The tire and the suspension system are constrained with revolute joints at the center of the tire, where only the DOF of ROT Y exists.
Suppose that the rear wheels be driven at a constant speed of 12 m/s along axis X and that the riven torque has not been taken into consideration, by supposing the vehicle drives at a constant speed. Because the vehicle drives at a relatively low speed, we suppose the tires and the road surface be kept in contact during the whole transportation process.
The road surfaces obtained in
Section 2 are used as the excitation in the vehicle dynamic simulation to produce longitudinal displacement
X, vertical displacement
Z, and pitch angle φ. The suspension is modeled by a damping-spring system. Magic tire Pacejka89 in ADAMS is picked as the tire model. The related parameters of the missile and its vehicle are listed in
Table 1.
The virtual prototype of the missile and the carrying vehicle are assembly-built by the dynamics analysis software ADAMS, as shown in
Figure 3. Here, we suppose the total mass (including missile body, warhead, filler, and structures inside) of the missile is about 8300 kg; 1000 kg for the warhead and filler inside, and 7300 kg for the missile body and structures inside. The filler inside mainly affects the performances of the vehicle more, such as rollover. Our research focuses on the safety of the explosive bolt, so we neglect the effect of the filler and other structures inside, and construct a model according to mass equality. This simplification makes it more convenient to analyze the structures we are interested in, namely the explosive bolts.
Since we are interested only in the effect of road roughness on the carrying structure’s loading, instead of the dynamic process and performance of the vehicle, for the convenience of analysis we suppose the missile vehicle drives at a speed of 12 m/s on Class A, C, and E roads, and the wheelbase and the road surface are constrained coplanar in
X–
Z plane so as to remain in a linear motion. Performing dynamical analysis, we obtain the longitudinal, vertical, and pitch angle accelerations of point A on the missile vehicle when driven on Class A, C, and E roads, as shown in
Figure 4.
4. Mechanical Behavior Analysis of Explosive Bolts Based on FEM
In order to obtain the stress responses of explosive bolts during vibrations on roads, we model the assembly of vehicle frame, warhead, missile body, explosive bolts, and nuts together. The FEM model is shown in
Figure 5. The local meshes around the weaken groove are refined to get the mesh convergence. Properties and convergent meshes of the whole geometry missile model are listed in
Table 2. Contacts and constraints of the missile vehicle are assigned as listed in
Table 3.
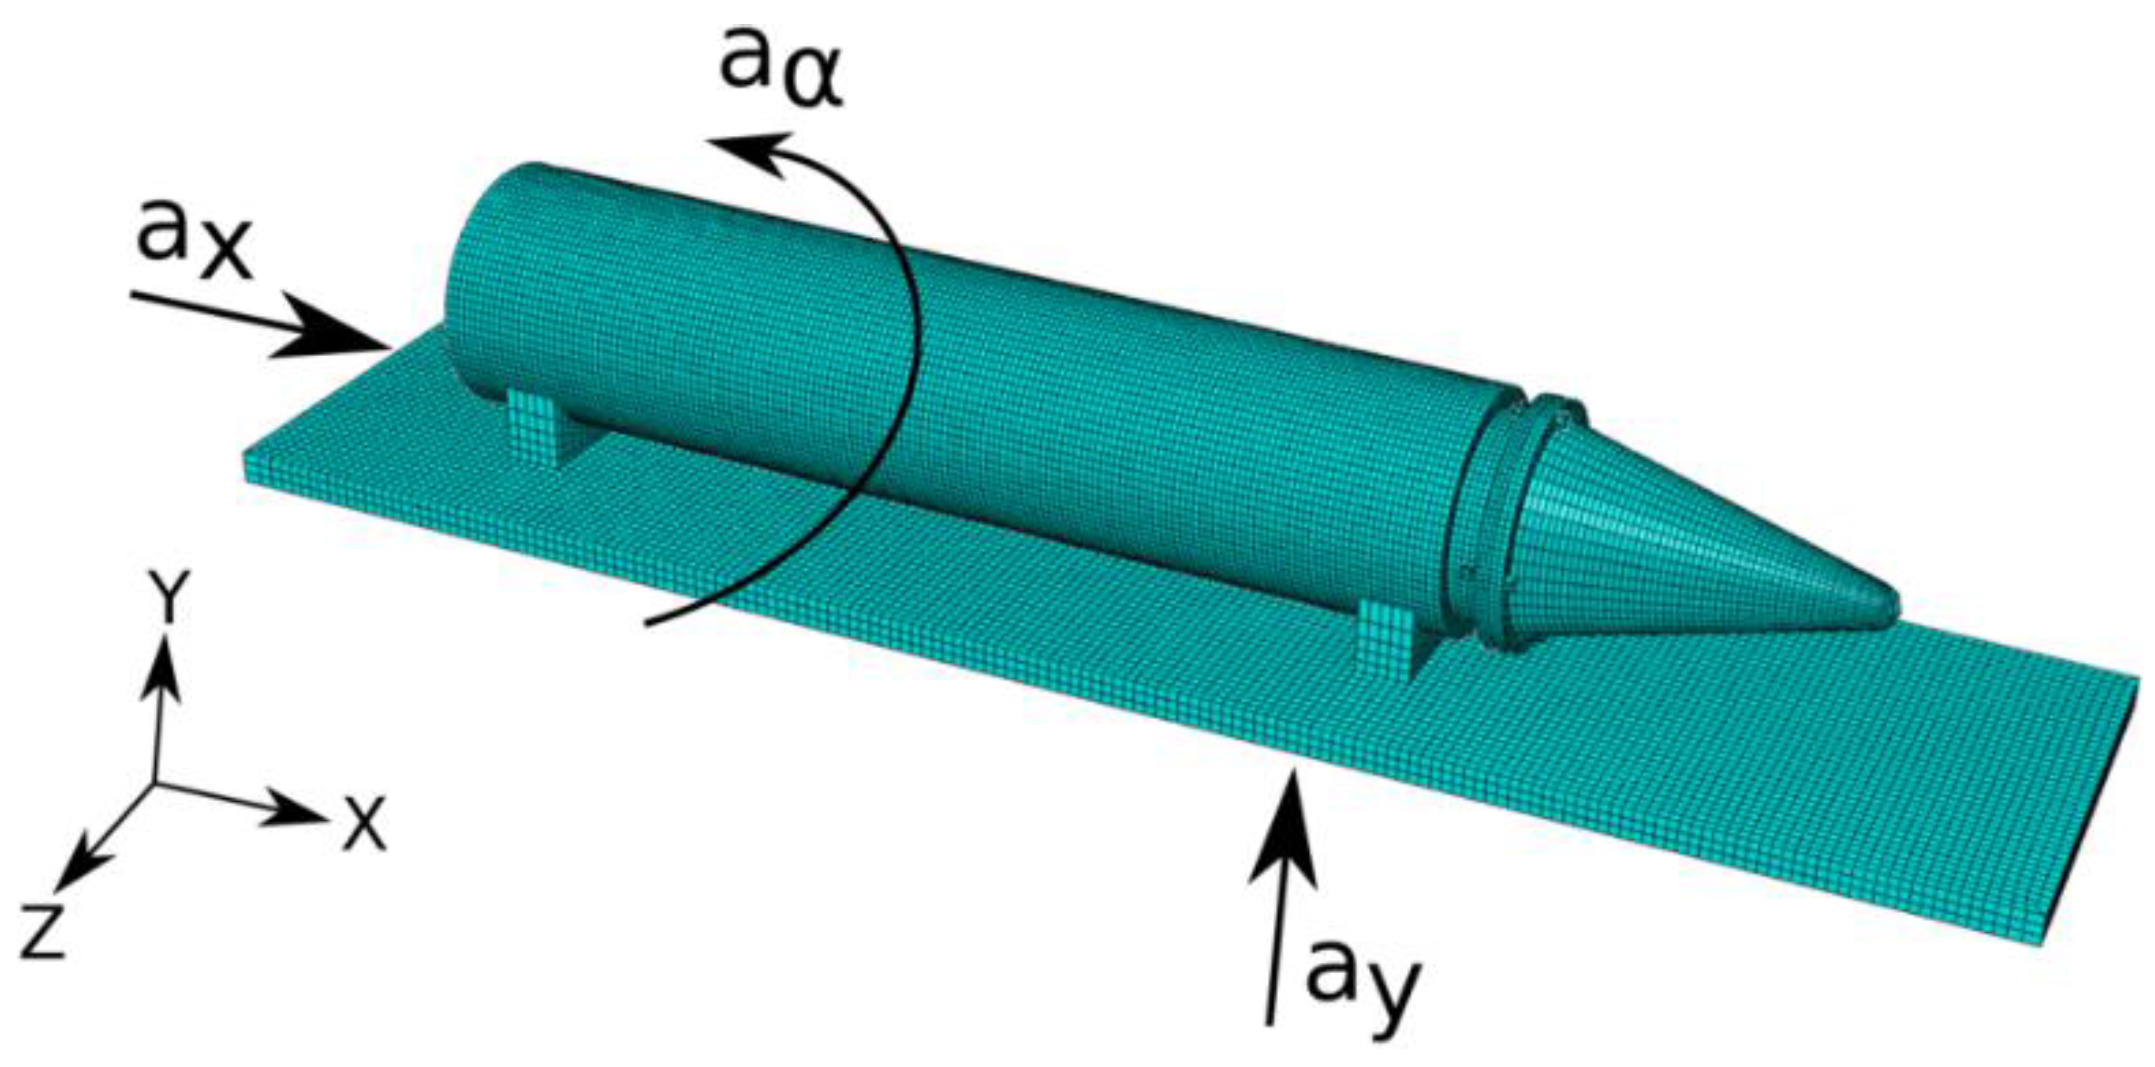
The pretension force of explosive bolts are assigned as
, where
is the area of the dangerous cross-section, i.e., the root section of the weaken groove. Thus, the pretension force is
. In this paper, for the complexity of the system we simplify the model and the loads. Suppose that the wheels will experience the same road surface model if they are at the same longitudinal position at the same time. Neglecting the loads of lateral (along
Z axis), yaw angle (about
Y axis) and roll angle (about
X axis), the loads are applied by the longitudinal, vertical, and pitch angle accelerations (about
Z axis),
ax,
ay, and
, of the missile vehicle obtained in
Section 3, as noted in
Figure 6.
Because the Class E road is the most serious condition, we take this to present our results.
Figure 7 gives the typical Tresca stress distribution at the weaken groove of bolt C when driving at the Class E road. In our calculation results, the Tresca stress is obviously larger than the Mises stress. Thus, it will be safer to take the Tresca stress as referring to the maximum shear stress strength theory into account to assess the fatigue of the explosive bolts. The maximum Tresca stress is 1222.32 MPa at the root of the groove, namely the dangerous point, which is lower than the conditional yield strength
1480 MPa. Thus, the explosive bolt is fully in an elastic deformation state.
Figure 8 presents the variation of the Mises and Tresca stress of the dangerous point on the explosive bolt C with time. It shows that the stress varies in small amplitude and that the maximum amplitude is about 14 MPa under the design pretension force. This is because of the existence of enough pretension force and the friction produced between contact surfaces.
5. Fatigue Life Assessment of Explosive Bolt
The Mises and Tresca stress response of the dangerous point on explosive bolt C when driving on different class roads are counted by rainflow method [
14]. The extreme condition, Class E road, is taken as an example to explain the fatigue assessment process during the carrying of the missile.
It is required that the key release devices will not fail during the 6000 km carrying distance. We take a stress-time response of FEM analysis shown in
Figure 8 as a load block, i.e., 400 m carrying distance, ignoring the unstable period induced by the startup. According to Miner’s rule, the fatigue life of the explosive bolt is required to be larger than the 15,000 load block.
The obtained 178 cyclic stresses rank in an ascending order by stress ratio
R, ranging from 0.9777 to 0.9975.
Table 4 lists only the first five cyclic Tresca stresses for references.
Generally, fatigue damage produced by vibration during driving of a vehicle is a high cycle fatigue issue. Thus, the stress-life method based on S-N curve can express the vibration fatigue life varying with loads by a three-parameter model as
where
N is the number of stress cycles, i.e., life, and
the applied maximum stress.
A,
b, and
are constants.
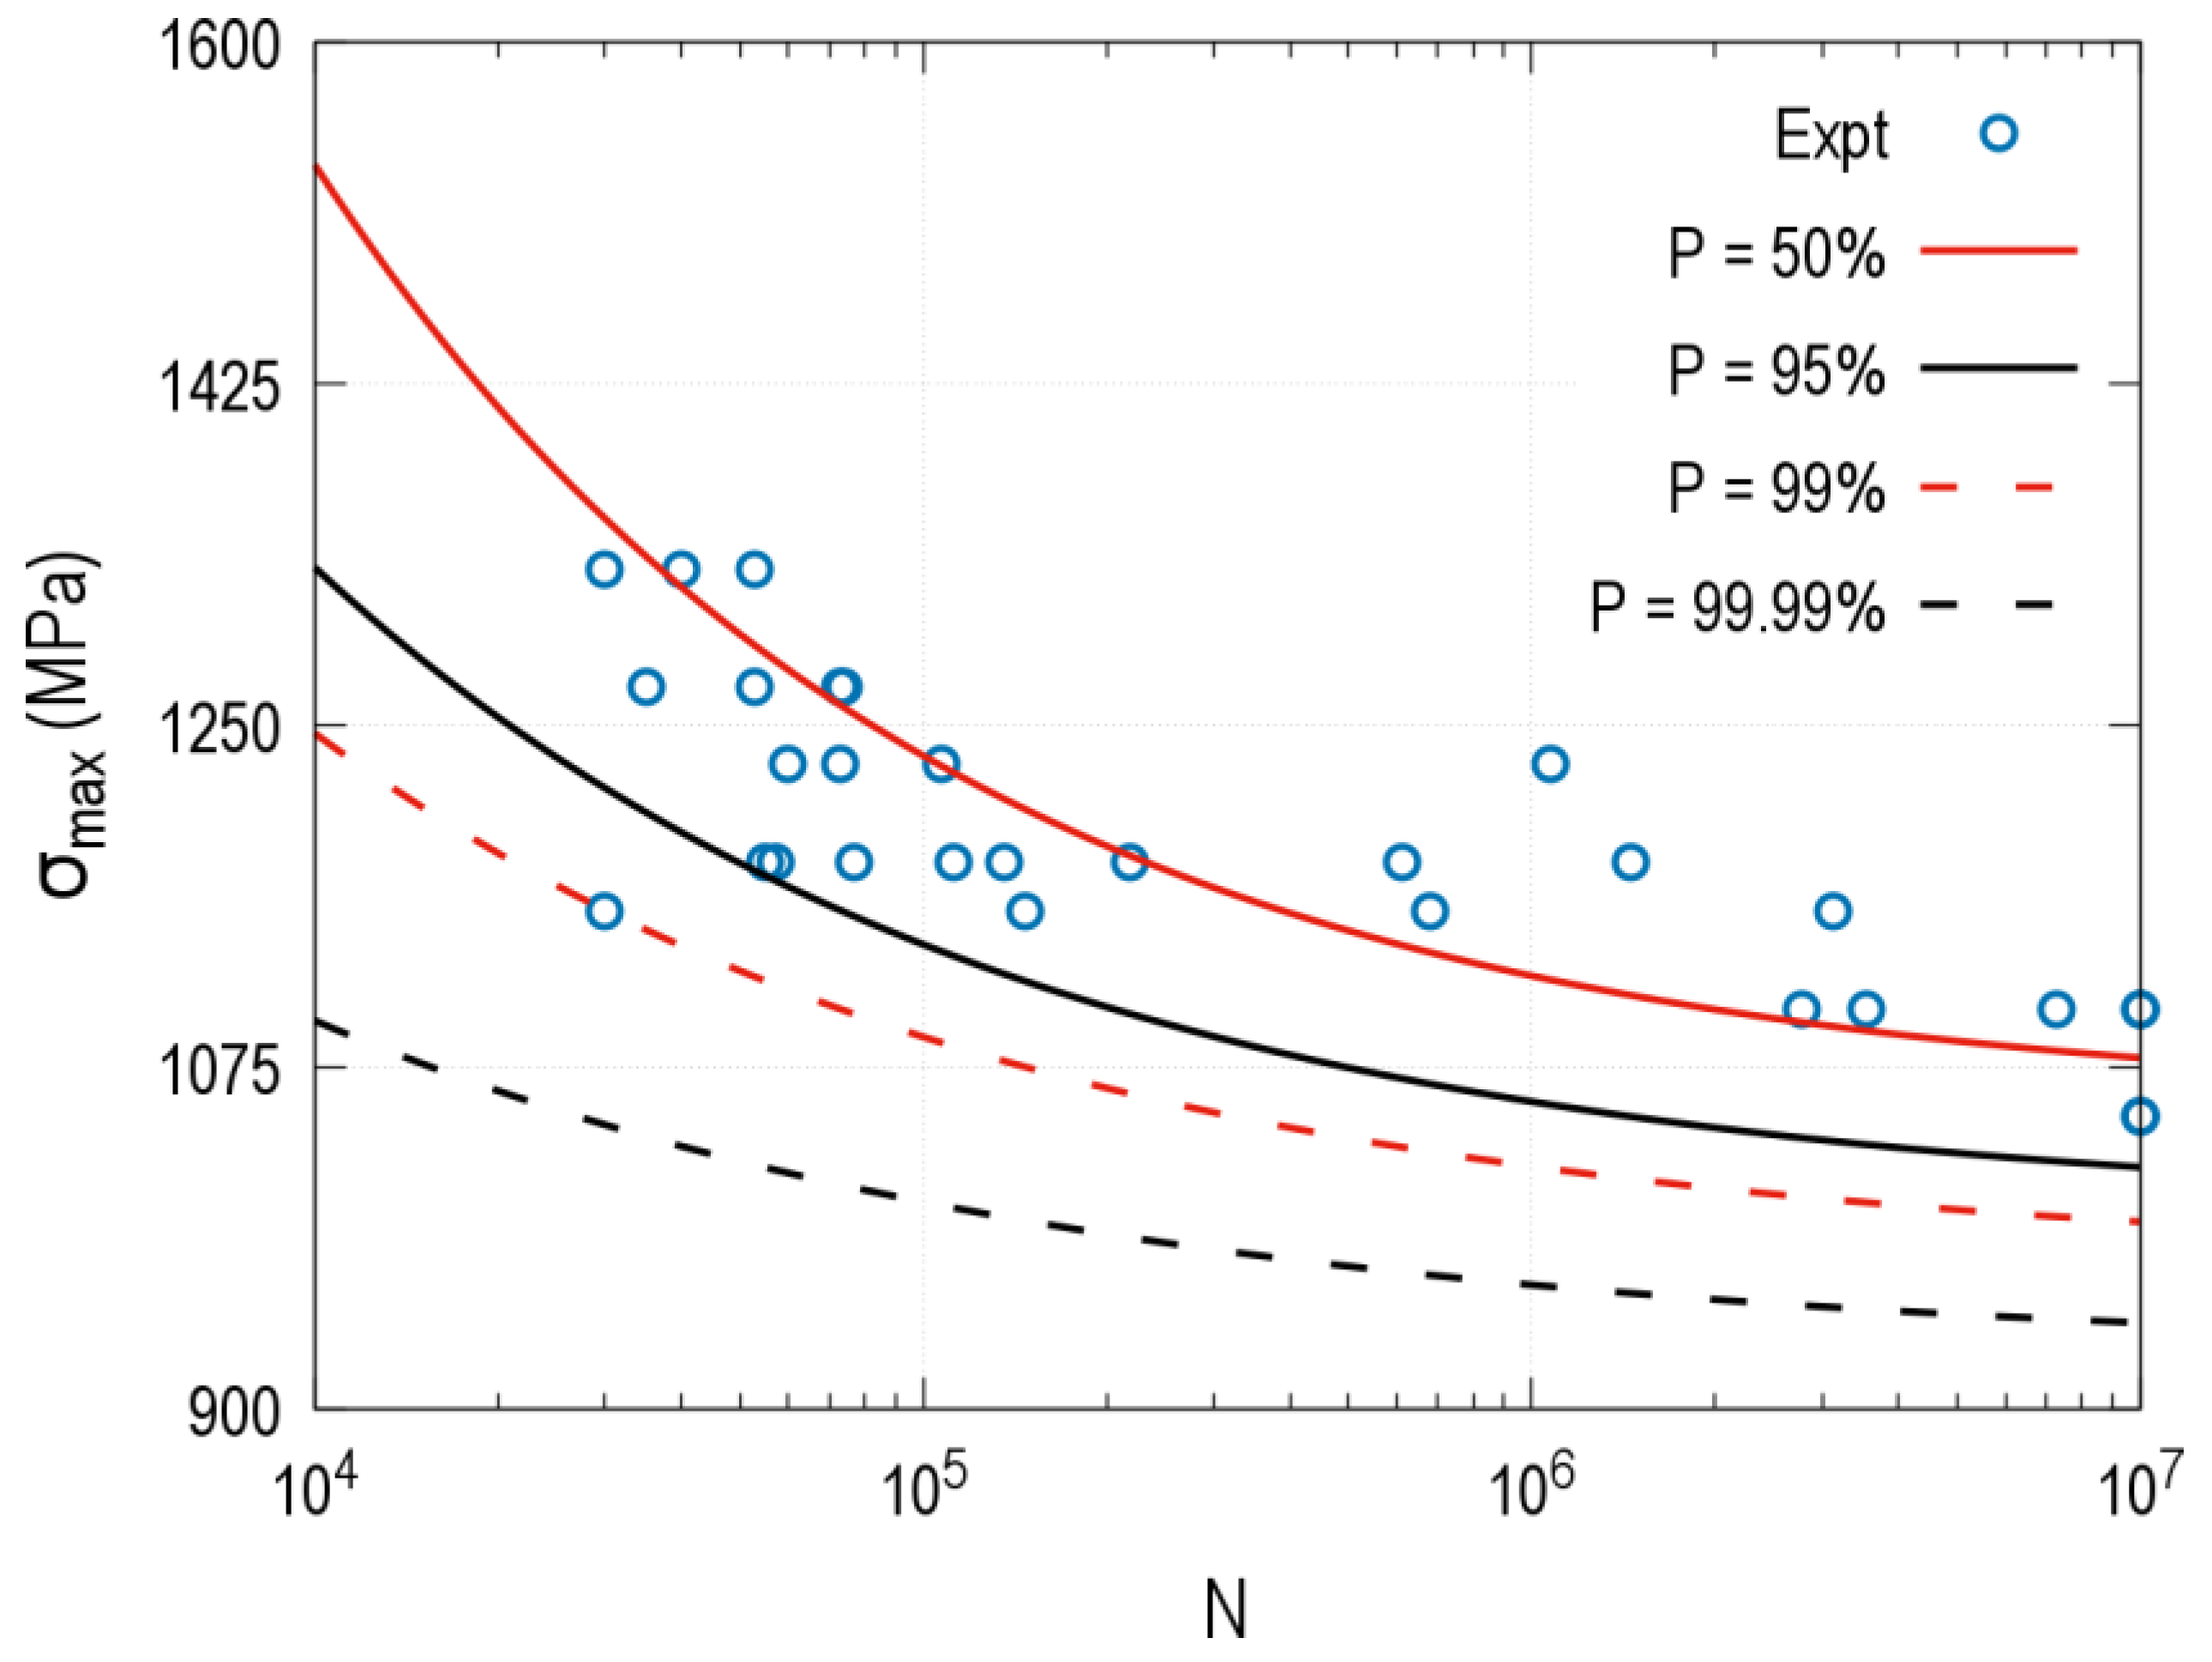
Referring to the axial-fatigue testing data of 30GrMnSiNi2A in [
15], the constant life curves of
Kt = 3 and
Kt = 5, and the S-N curve at
Kt = 1 and
R = 0.1 based on median fatigue life, are given, as plotted in
Figure 9,
Figure 10 and
Figure 11. In
Figure 11, we also give the S-N curves at
Kt = 1 and
R = 0.1 with different survival rates
P. Concerning
Figure 9,
Figure 10 and
Figure 11, through linear interpolation, we can get the constant life curves at any given
Kt,
P, and
R.
Figure 12 shows the constant life curve of
N = 10
7 at different
Kt and
P, and the dashed curves are obtained through linear interpolation.
Among all of the 178 cyclic stresses, Rmin = 0.9777. The corresponding fatigue limit is 1490 MPa, based on fatigue life curve for 99.99% survival rate, which is the minimum one with R ranging from 0.9777 to 0.9975. However, as we counted, the maximum stress of all the cycles is 1222.32 MPa, lower than the minimum fatigue limit. Hence, based on fatigue life curve for 99.99% survival rate, fatigue damage will not occur when driving on Class E roads and no fatigue damage accumulated. Consequently, with the designed geometry and pretension force in this paper, these explosive bolts can undergo more than 15,000 load blocks, i.e., 6000 km carrying distance on Class A to E roads.
6. Discussion
Since the missile vehicle and the release device are complex systems, the fatigue strength of the explosive bolts will be affected by the pretension force, the depth of the weaken groove, the road roughness, the fatigue life curve with a certain failure probability, and so on. Based on the above results, we can find when the pretension force of explosive bolts are assigned as , the vibration amplitude is relatively small; i.e., maximum amplitude is about 14 MPa and the corresponding stress ratio is 0.9777.
In order to ensure the explosive bolts will not break during the missile transportation on the vehicle, we analyze the effects of pretension force on the vibration behavior of the structure, as illustrated in
Figure 13. It reveals that the minimum stress ratio obviously decreases with the decreasing of the pretension force (from
to
) in the whole vibration response, while the maximum vibration amplitude increases linearly. Still following the analysis process in
Section 5, we obtain that these explosive bolts can undergo more than 6000 km carrying distance on Class A to E roads.
Except for the pretension force, there are still other factors that will influence structural safety, such as the design of the wall thicknesses of the weaken groove and the charge hole, and the dispersion of mechanical behavior of the material. From this work, we provide a possible process to assess the fatigue safety of this complex system. When there is a possibility of facing fatigue fracture, it is recommended that the diagram of
Figure 14 be followed to conduct fatigue evaluations or redesign the structure to improve safety. Also, further detailed material tests and structural optimization analyses are needed to ensure high-reliability safety.
7. Conclusions
- (1)
Road roughness curves of Class A, C, and E are generated based on the displacement PSD. The road roughness of different classes based on the same random sequence change proportionally, and the ratio is
. The corresponding longitudinal, vertical, and pitch angle accelerations of the missile vehicle are obtained when driving on roads of Class A, C, and E, as shown in
Figure 4a–c for point A.
- (2)
Counted with rainflow counting method, the stress ratio R at the root of the explosive bolt ranges from 0.9777 to 0.9975, and the maximum stress of all the cycles is 1222.32 MPa, which is lower than the corresponding minimum fatigue limit for a survival rate of 99.99%. Thus, with the designed geometry and pretension force in this paper, these explosive bolts can undergo more than 15,000 load blocks, i.e., 6000 km carrying distance on Class A to E roads.
- (3)
With the pretension force decreasing from
to
, the minimum stress ratio obviously decreases, while the maximum vibration stress amplitude increases linearly. When facing a fatigue fracture issue, it is recommended to follow the diagram of
Figure 14 to redesign the structure.


