Abstract
In human hearing, frequency resolution is a term used to determine how well the ear can separate and distinguish two sounds that are close in frequency. This capability of breaking speech sounds into various frequency components plays a key role in processing and understanding speech information. In this paper, a piecewise-linear frequency shifting algorithm for digital hearing aids is proposed. The algorithm specifically aims at improving the frequency resolution capability. In the first step, frequency discrimination thresholds are processed by a computer testing software. Then, the input signal is parsed through the proposed piecewise-linear frequency shifting algorithm, which comprises of linearly stretching and compressing the frequency content at different frequency ranges. Experimental results showed that by using the proposed frequency shifting algorithm, the separation of formant tracks was increased in the stretching region and slightly squeezed in the adjacent compression region. Subjective assessment on six hearing-impaired persons with V-shaped audiograms demonstrated that nearly a 10% improvement of speech discrimination score was achieved for monosyllabic word lists tested in a quiet acoustic setting. In addition, the speech reception threshold was also improved by 2~8 dB when disyllabic word listswere tested in a noisy acoustic scenario.
1. Introduction
Currently, signal processing research in digital hearing aids is mainly focused on improving “audibility” of acoustic signals, which is typically attempted to achieve loudness compensation and dynamic range compression of input sound in different frequency and sound pressure levels. These methods essentially are aimed to achieve a certain intensity of output sound in the digital hearing aids which will fit the characteristics of hearing-impaired patients. It is known that hearing impairment affects auditory threshold, sound analysis ability, and temporal gap discrimination. Therefore, even when they are able to hear the sound, they may not understand the meanings [1]. This situation occurs particularly when the hearing-impaired patients lose the ability to analyze the sounds. In general, a cochlea in a normal ear is able to distinguish various frequency components in speech sounds by producing vibration in different locations within the cochlea. In contrast, an impaired cochlea is unable to properly differentiate frequencies, which leads to frequency confusion and the inability to understand the speech sounds [2,3,4,5]. This situation is further exacerbated when the speech sounds are submerged in a noisy or disturbing environment [6].
In recent years, some acoustic signal processing algorithms have been proposed by researchers to improve the frequency resolution of hearing-impaired patients. A compression method was proposed by Kulkarni and Pandey [7], in which the input audio signal is divided into several sub-bands and then compressed to the center frequency within each band. Using this method, the frequency difference between the signal components is widened, and the aforementioned frequency confusion is alleviated. In previous studies [8,9], the cause and effect of frequency resolution decrease has been considered. It has been shown that when the response curve of the cochlear filter is widened, the peak-valley difference of the spectrum is decreased, which makes it difficult to perceive the formants of the speech. The Spectral Contrast Enhancement (SCE) algorithm is proposed which enhances the spectrum of the original speech signal by increasing the amplitude difference while maintaining the original sound pressure level. Previous experimental results [8,9] showed that a certain degree of improvement was provided by this method in speech recognition.
There are also some prior works on improving audibleness for severely hearing-impaired patients [10]. These patients usually suffer from deafness or partial deafness because of severe loss of listening capability in the high frequency region. A frequency-lowering algorithm which moves high frequency components of the input audio signals into lower frequency regions was proposed in [10,11]. By using this algorithm, the severely hearing-impaired persons can then perceive the previously lost high frequency components sounds as they have been shifted into a lower frequency range that is audible for the patients. However, high frequency hearing loss is only one of the symptoms of neurosensory deafness. There are other typical audiograms of neurosensory deafness, such as flat-shaped, slow descending-shaped, V-shaped (which is also called notched), island-shaped, and many others [12]. Different types of hearing loss usually have been faced with various difficulties in frequency resolution, for which the frequency-lowering algorithm is not able to accommodate. In a study by Bohnert et al. [13], advantages of frequency compression in noisy environment are researched.
Originating from the frequency lowering algorithm, a piecewise-linear frequency shifting algorithm for digital hearing aids is proposed to tackle deteriorated frequency resolution of V-shaped hearing loss patients. Different from the frequency lowering algorithm, which improves high frequency resolution only, the proposed algorithm has the ability to improve the frequency resolution of the patient in any frequency range. Also, the speech intelligibility for speech buried in noise is improved. Different from the previous SCE algorithm, the proposed scheme is to improve the frequency resolution not by changing the peak-valley difference of the amplitude spectrum, but by executing piecewise-linear frequency shift of the input signals. Parameters of the proposed algorithm can be adjusted easily to facilitate hearing aid personalization by simply changing frequency stretching and compression ratios. The proposed algorithm was implemented in a system. Six hearing-impaired persons (subjects) with V-shaped audiograms were tested. Experimental results indicated that the proposed piecewise-linear frequency shifting algorithm effectively improved the speech discrimination scores and decreased the speech reception thresholds of the tested subjects. The overall speech discrimination score of monosyllabic vocabulary in pure speech was improved by nearly 10%, while the speech reception threshold of disyllabic spondaic vocabulary in a noisy setting was reduced by 2~8 dB.
This paper is organized as follows. Firstly, the piecewise-linear frequency shifting algorithm is introduced in Section 2. Subsequently, implementation of the algorithm in a hearing aid system is explained in Section 3, and the experimental results are shown and discussed in Section 4. Finally, a conclusion is presented in Section 5.
2. Piecewise-Linear Frequency Shifting Algorithm
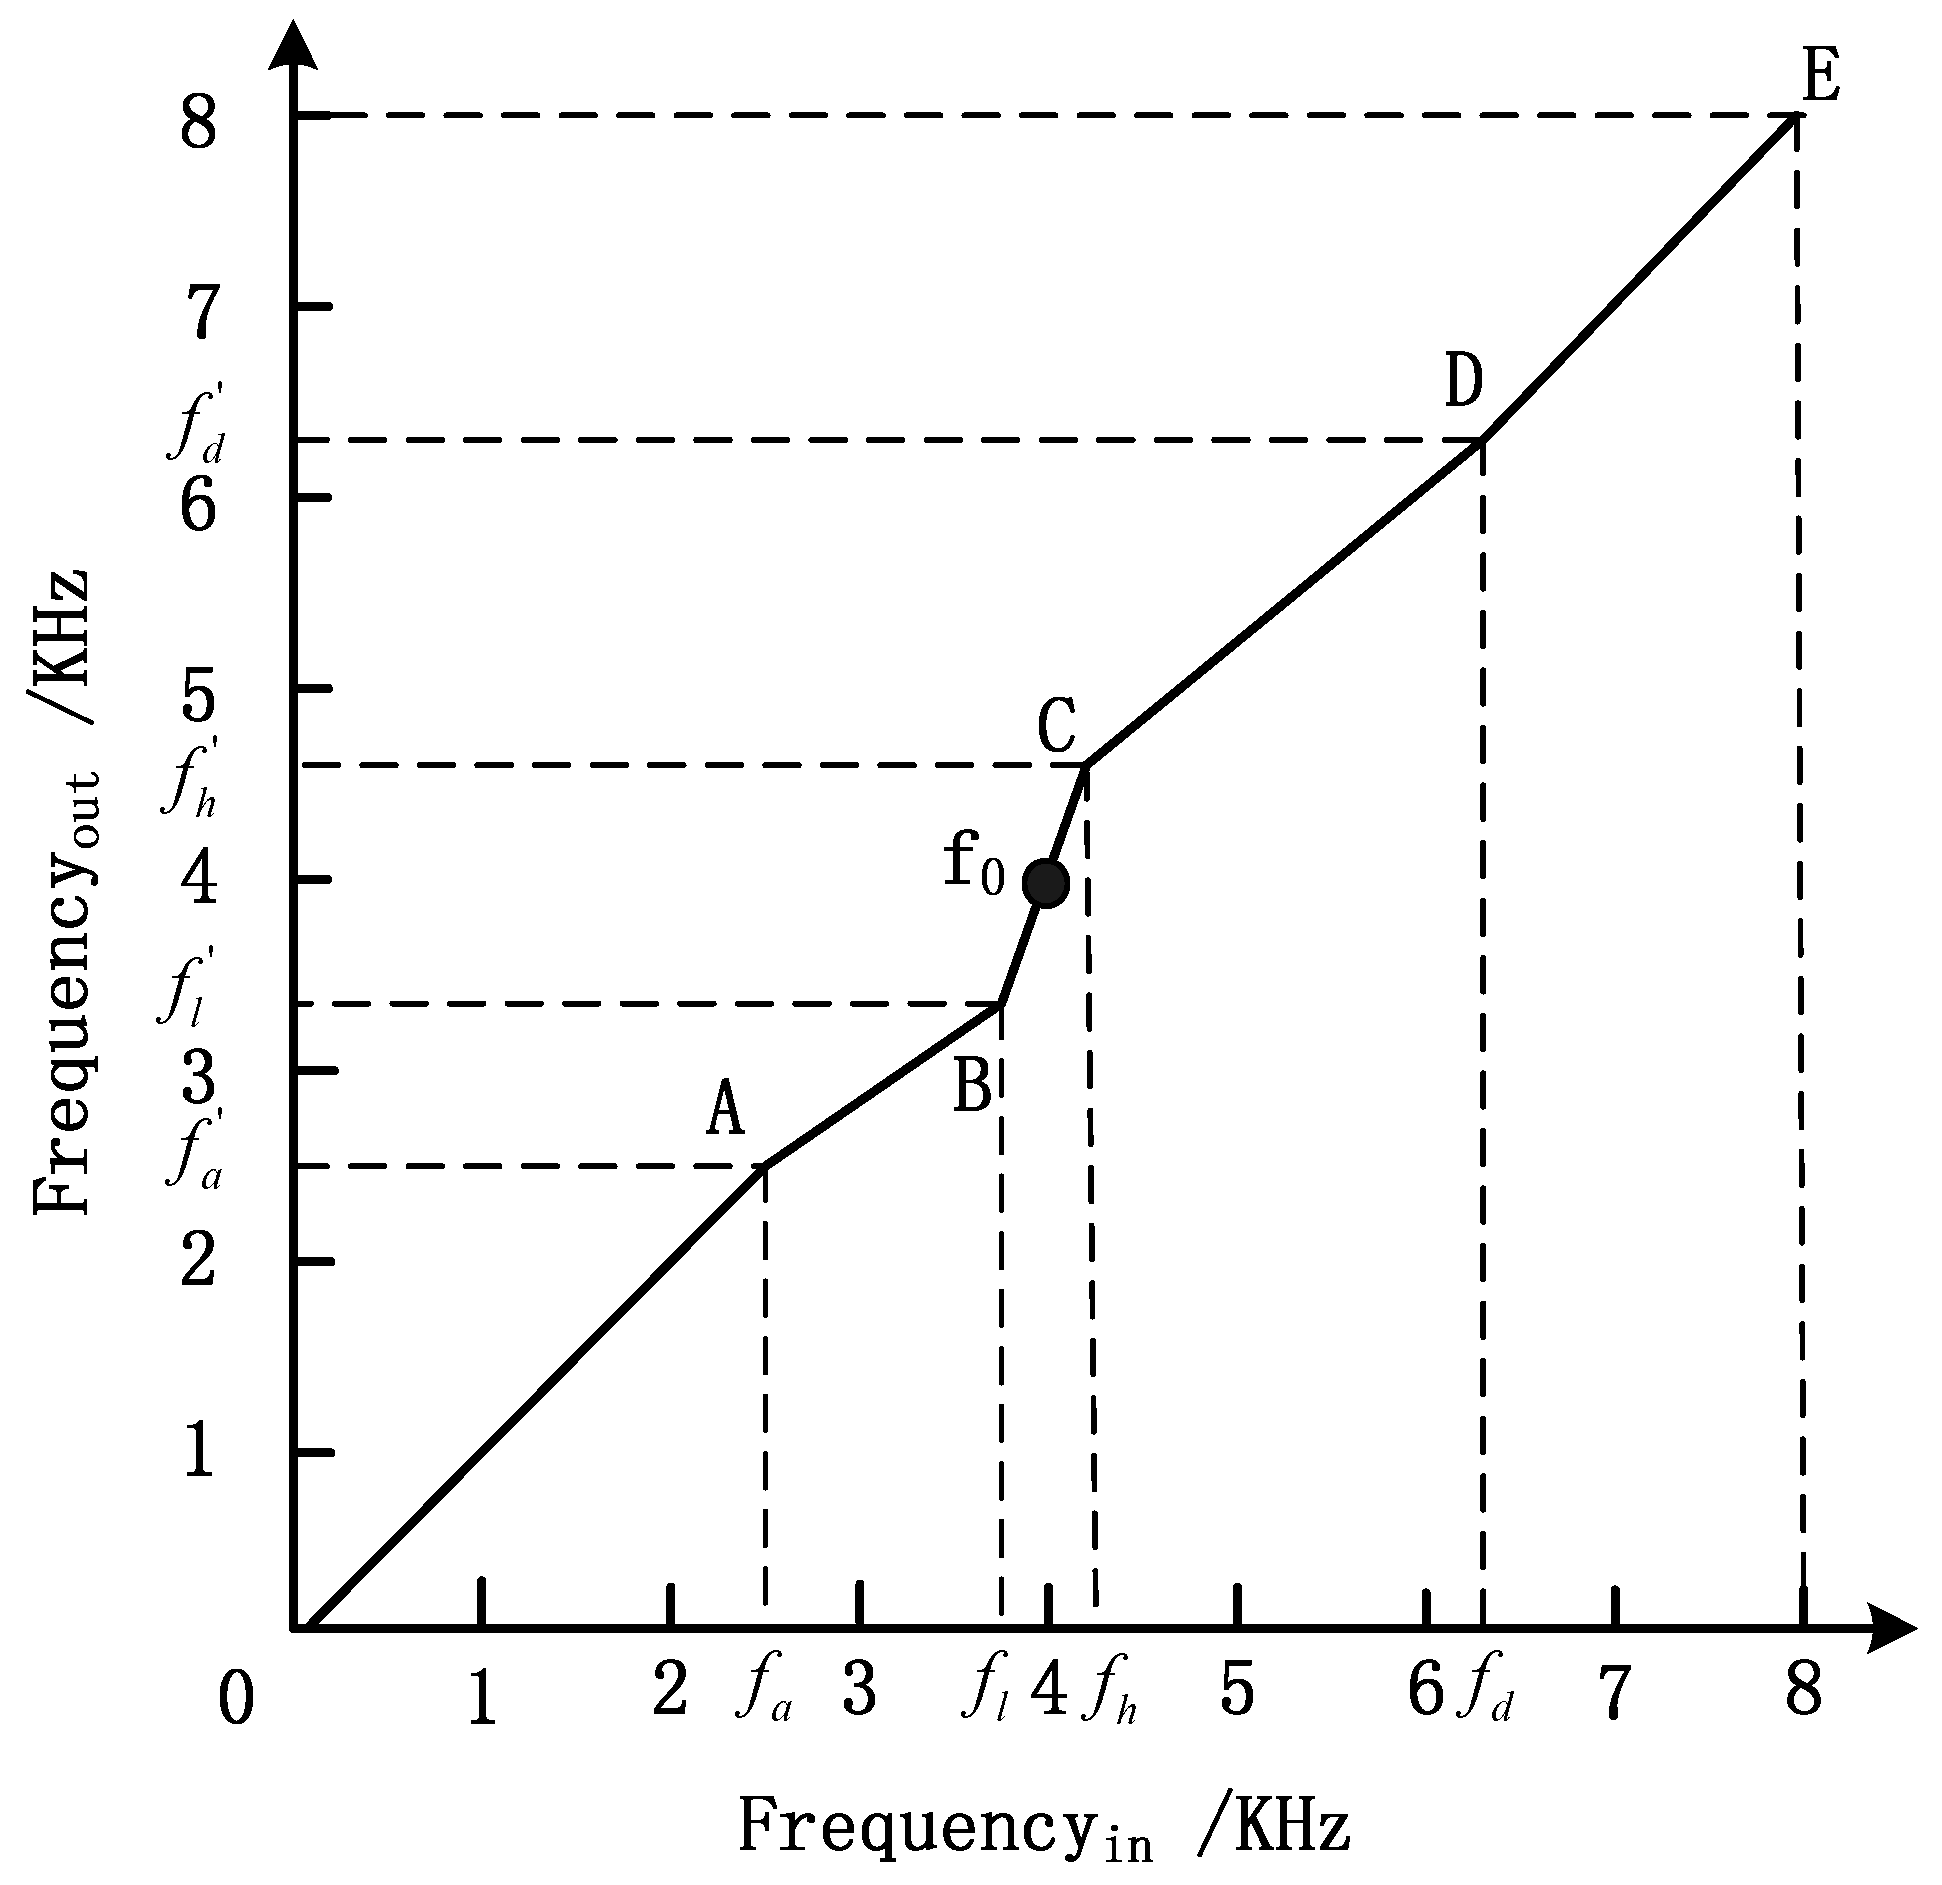
In traditional digital hearing aid algorithms, the audio signal is usually enhanced by a sound compensation scheme at certain frequencies according to pure tone hearing thresholds. However, such a scheme does not consider the loss of frequency discrimination. In order to deal with the deteriorated frequency resolution of hearing-impaired patients, a piecewise-linear frequency shifting algorithm for digital hearing aids is proposed. This algorithm is designed with the aim of improving the frequency resolution of the patient in a certain frequency range and at the same time enhancing speech intelligibility of speech sounds buried in noise. The relationship between frequencies before and after piecewise-linear frequency shifting is shown in Figure 1. Here, for the enhanced center frequency in frequency region where the ear is less sensitive, the original frequency components are stretched, from to , as shown in Figure 1. This step attempts to move the components out of the insensitive region. The scale of stretching is defined as Equation (1) and can be adjusted according to different application situations.

Figure 1.
The relationship between frequencies before and after piecewise-linear frequency shifting.
To avoid overlapping frequency components, the adjacent frequency ranges are compressed with parameters that are adjustable. As shown in Figure 1, segment AB defines a frequency region from to and is compressed by a compressing ratio in accordance with Equation (2). Similarly, segment CD defines a frequency region from to which is compressed by a compressing ratio , as shown in Equation (3) below.
The range of frequency stretching is decided according to the results of the frequency discrimination test. In order to control the distortion of the output signal, the value of the stretching ratio is justified. The bigger is, the worse the distortion is. The values of and are set according to the compression fields and . In speech recognition, speech sounds are recognized according to the relative positions of frequency components. Because the frequency distance among the frequency components is not changed by the frequency shifting algorithm, the components identification is not influenced. Although the waveform could eventually be distorted to some extent, the distortion level on speech recognition is considered acceptable.
3. Implementation of the Piecewise-Linear Frequency Shifting Algorithm
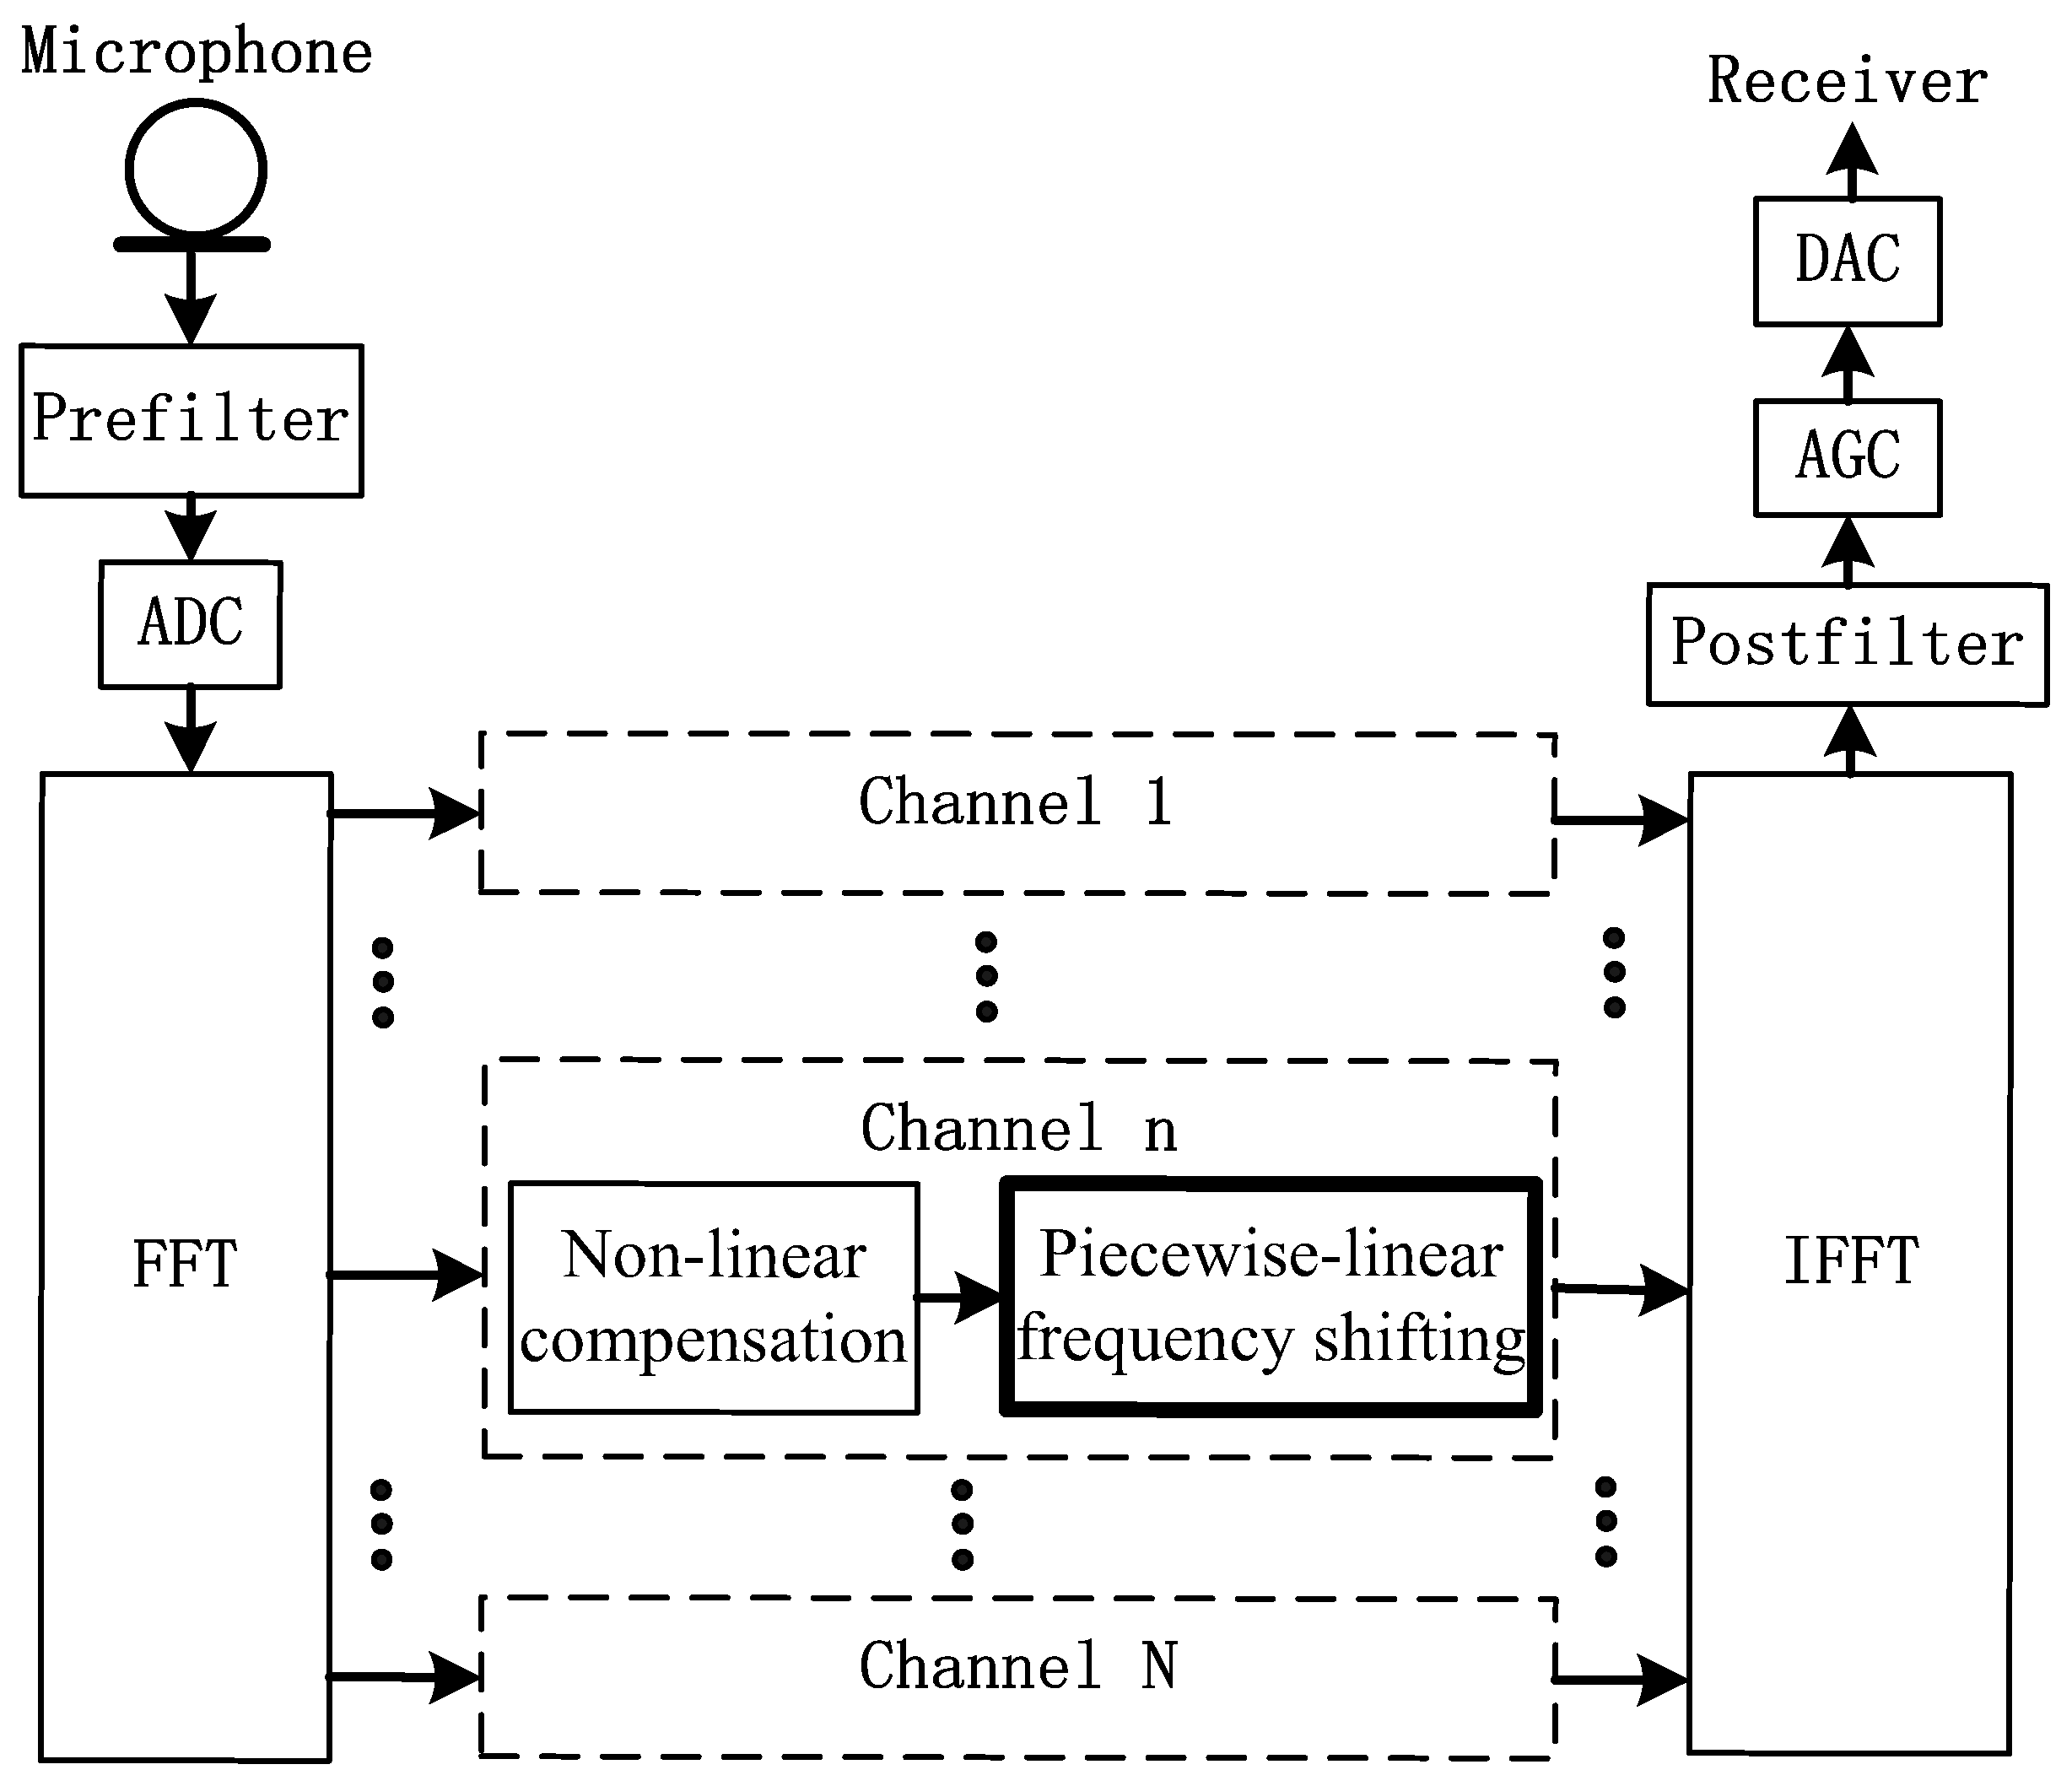
The proposed piecewise-linear frequency shifting algorithm can be implemented in the sub-bands of digital hearing aids. Figure 2 is a system block diagram showing the implementation of the proposed frequency shifting algorithm. The input signal from the microphone passes through a pre-filter before going through an analog to digital converter (ADC) and is analyzed to sub-bands by fast Fourier transform (FFT). These sub-bands are divided into N channels. The channels that contain the targeted frequency bands are first passed through non-linear compensation units which have transfer functions of wide dynamic range compression (WDRC). The outputs of the non-linear compensation units are then processed using the proposed piecewise-linear frequency shifting algorithm. The outputs are then combined using inverse fast Fourier transform (IFFT) before passing through a post filter, automatic gain control (AGC), and a digital to analog converter (DAC). Finally, they are passed to the receiving end. Specifically, within the channels that contain the targeted frequency bands, the frequencies are interpolated according to the stretching ratio and sampled according to the compressing ratio described earlier in Equations (1)–(3).

Figure 2.
Piecewise-linear frequency shifting unit in the digital hearing aids. ADC, analog to digital converter; DAC, digital to analog converter; AGC, automatic gain control; FFT, fast Fourier transform; IFFT, inverse fast Fourier transform.
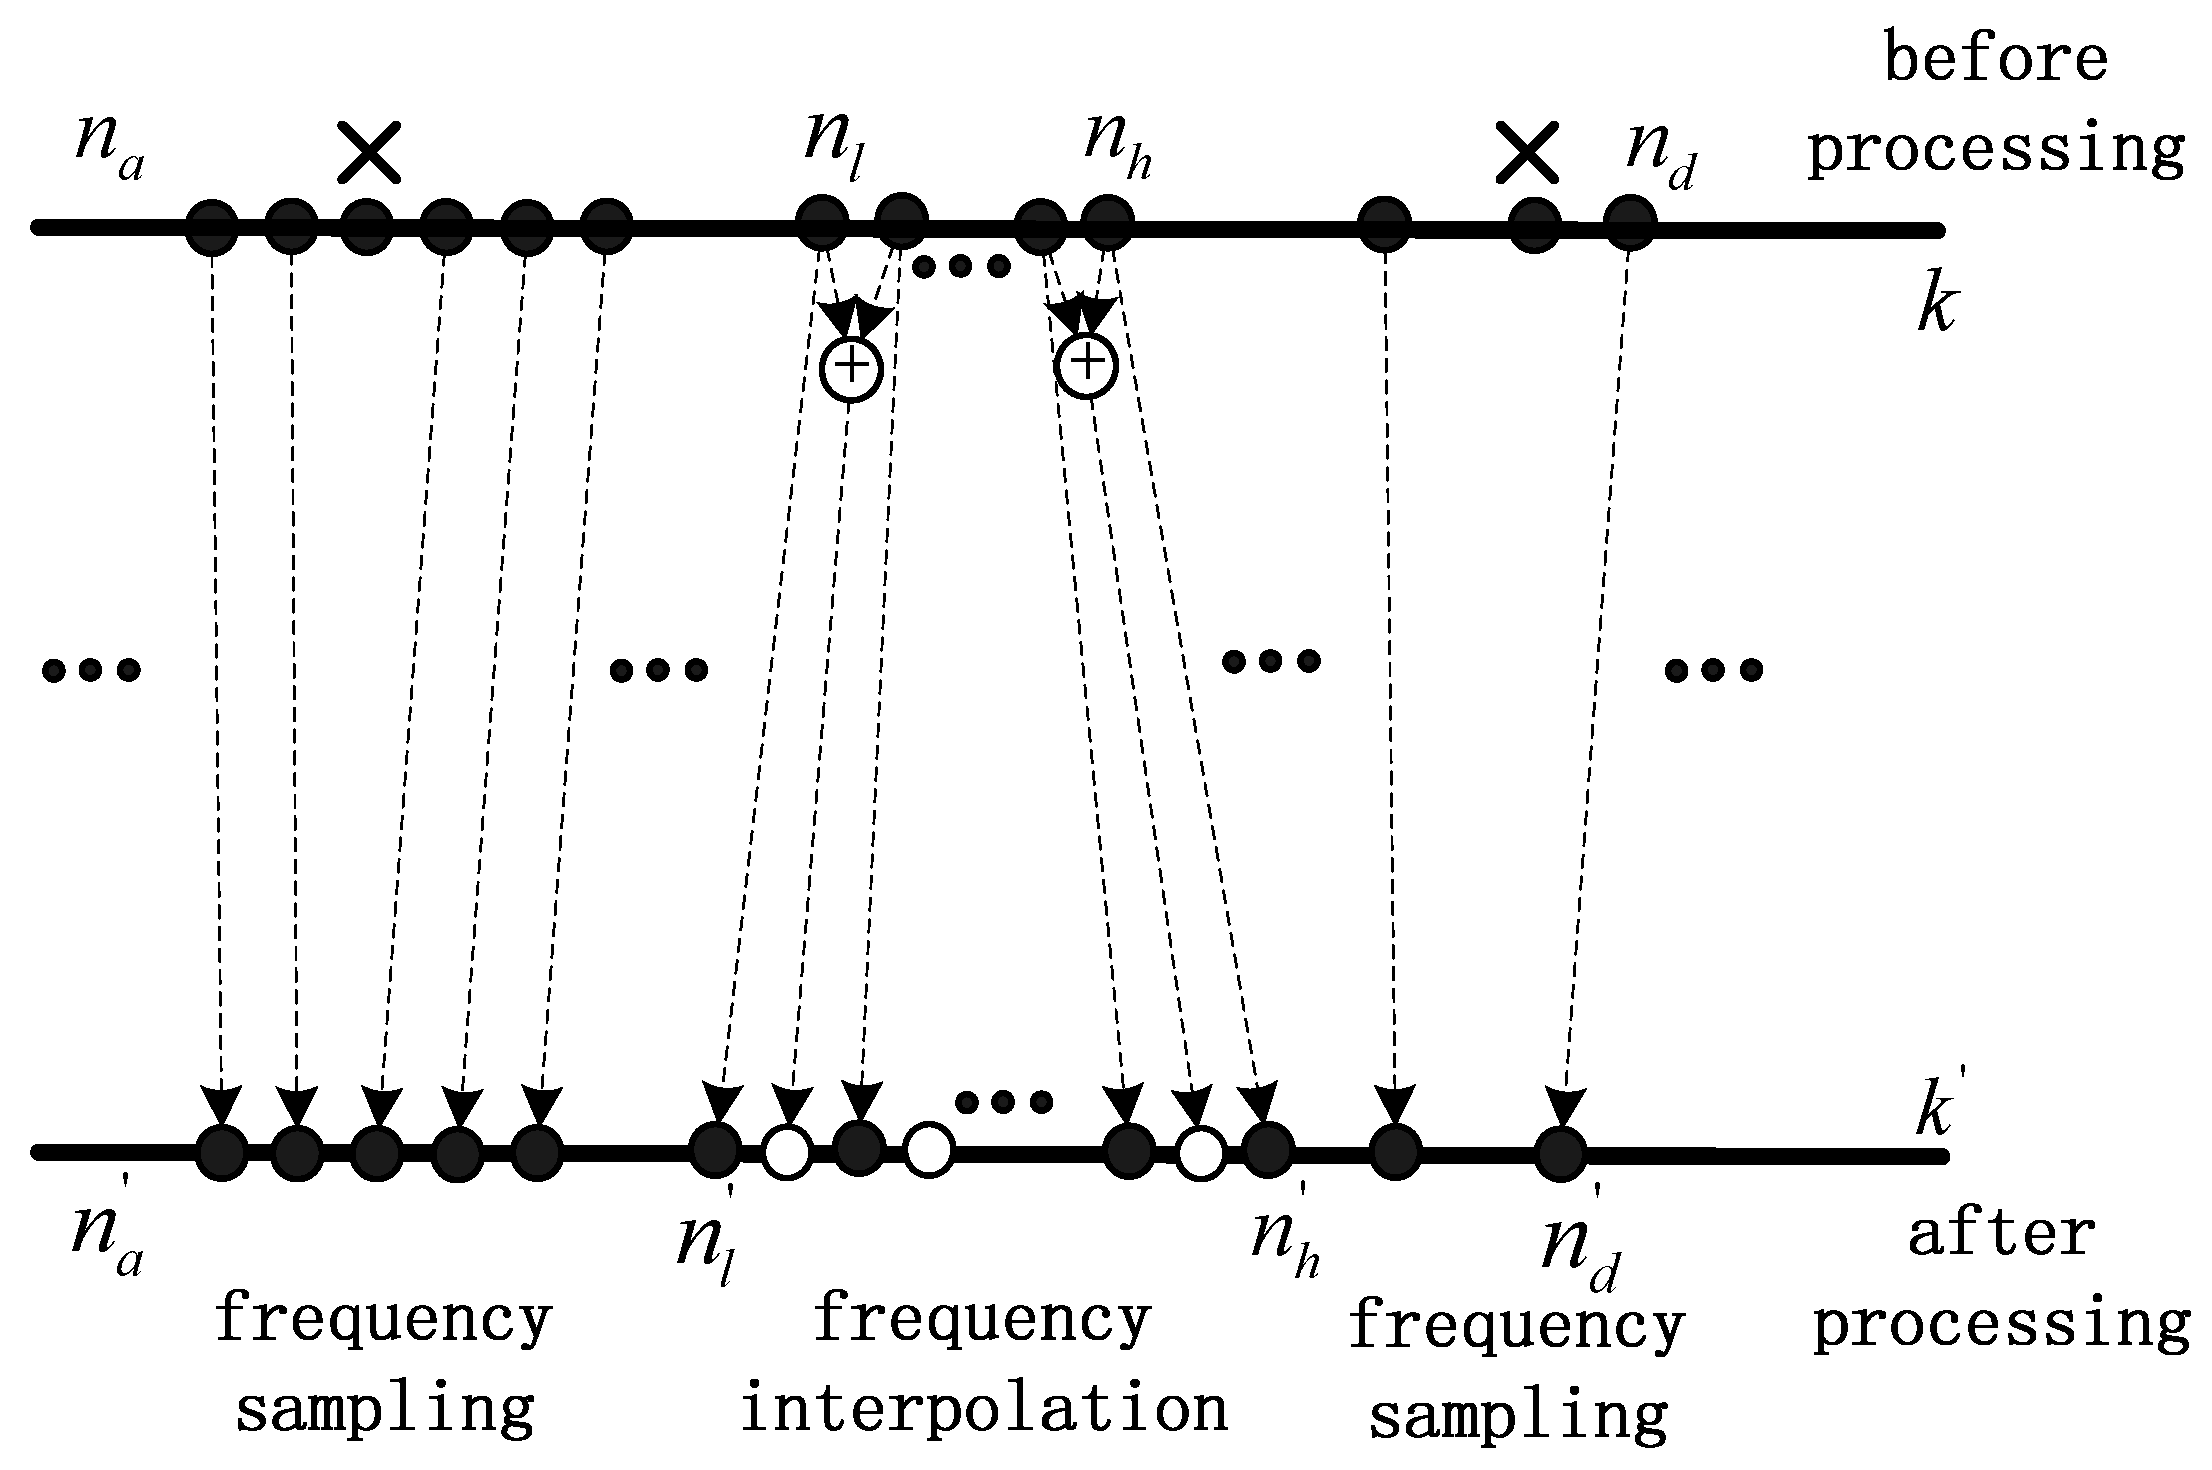
As shown in Figure 3, indicates the FFT spectrum series of the original input audio signal, and indicates the FFT spectrum series of the processed signal. indicates the spectrum region before stretching in series, and indicates the corresponding processed spectrum region in series where
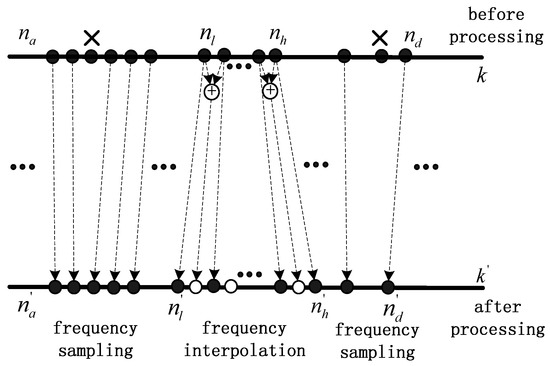
Figure 3.
Frequency interpolation and sampling.
Here is mapped to , with frequency points interpolated, and is compressed to , is compressed to with frequency points removed totally. Specifically,
So, in sequence is directly mapped to in sequence , and is directly mapped to . After the proposed frequency shifting process, the length of the sequence is unchanged and the overlap is thus avoided. It should be noted that for the stretching part, the amplitude and phase value of the interpolated points are calculated by magnitude and phase spectrums separately. Therefore, the amplitude and phase values of the original points are preserved.
4. Experimental Results
4.1. Subjects and Their Pure Tone Audiograms
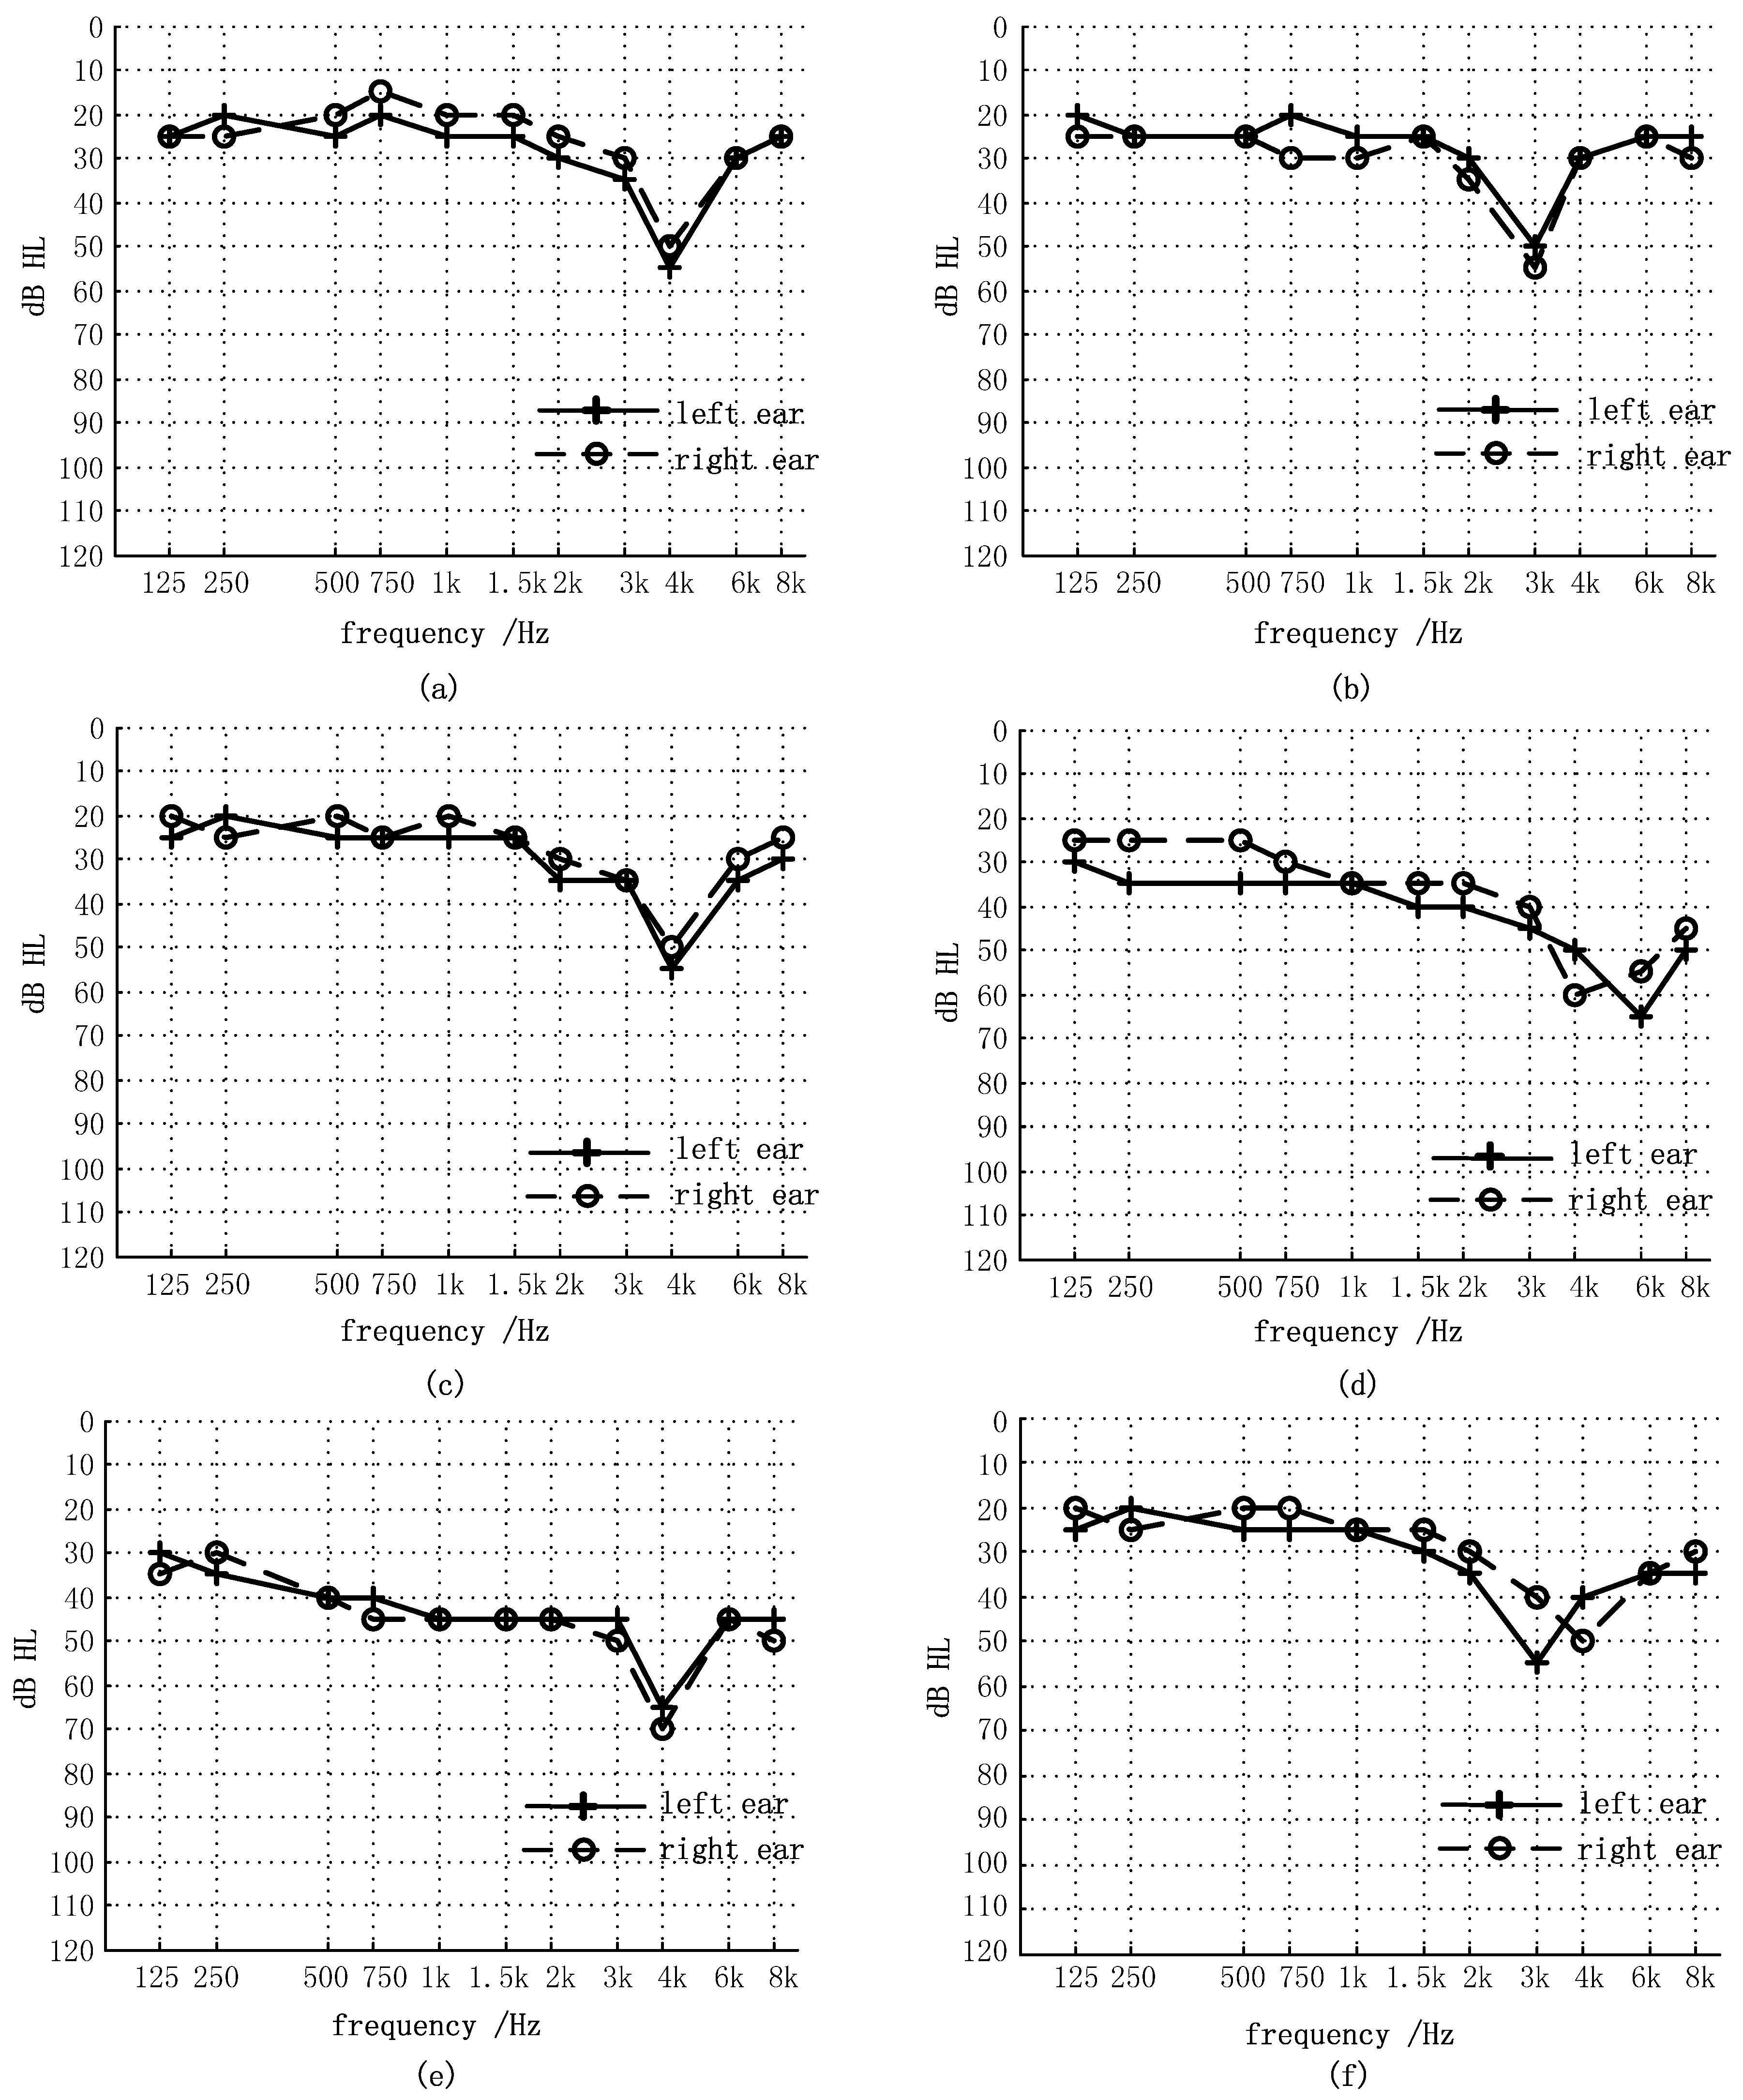
The system depicted in Figure 2 was realized in a prototype hearing aids software in a computer and used for the following experimental tests. Six hearing-impaired patients with V-shaped audiograms were tested in the experiments. The general information of the patients is shown in Table 1. All of the patients had the experience of wearing hearing aids for more than three months. All of the hearing aids had the functions of loudness compensation and wide dynamic range compression. There was not any frequency-shifting processing in their hearing aids. Pure tone hearing thresholds of the patients without wearing hearing aids were measured and the results of audiograms are shown in Figure 4 for both left and right ears.

Table 1.
General information of the subjects.
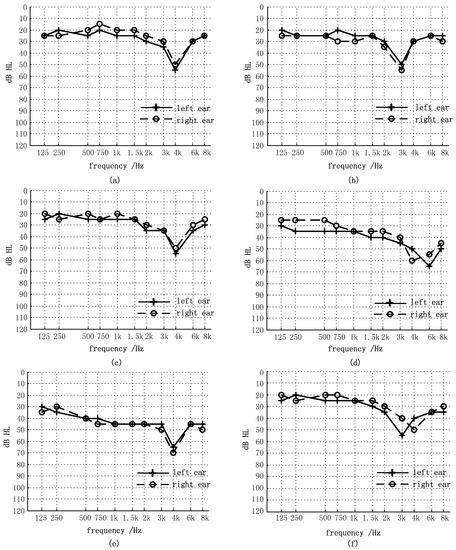
Figure 4.
Pure tone audiograms for the subjects: (a) S1; (b) S2; (c) S3; (d) S4; (e) S5; (f) S6.
4.2. Measurements of the Frequency Discrimination
Before processing frequency shifting, frequency resolution of the hearing-impaired person needs to be measured. Traditionally, Brian C. J. Moore proposed the psychophysical tuning curves (PTCs) method to obtain the frequency selectivity using a narrowband noise masker that sweeps in frequency [14,15]. Rapid methods for PTCs measurement to improve the maneuverability, thereby saving measuring time and reducing complexity, have also been proposed [16,17]. The Q10dB calculated by the curve indirectly reflects the frequency resolution of the subject at a certain frequency [18,19]. However, for sensorineural hearing-impaired patients, the measured Q10dB will fail when the minimum sound level is not recorded at which the patient is able to discriminate the probe signal from masker, or the bandwidth corresponding to 10dB above the minimum level is wider than the measuring field.
In our experiments, an alternative subjective listening test is conducted to obtain the frequency discrimination thresholds in different frequencies. Two pure tone signals (the probe signal and the offset signal) controlled and generated by computer software are emitted sequentially in a non-overlapping manner with 100 ms interval between them. The sound level is set to the most comfortable level (MCL) of the subject. Subjects are required to give indication when they are able to hear the two distinct sounds. According to the indication by the subject, the software adjusts the frequency offset until the subject reaches the discrimination threshold for which he/she is unable to identify [20]. The main steps of the proposed frequency discrimination measurement are as follows:
- Step 1
- The software plays an audio sequence at the testing frequency. The sequence consists of two 1-second pure tone signals with a 100 ms interval between them, namely “pure tone 1—pause—pure tone 2”. In the sequence, pure tone 1 is the probe signal at the testing frequency, and pure tone 2 is the offset frequency signal or the same probe signal.
- Step 2
- Each sequence is played once or twice. The second play is optional and activated by the listener. The listener needs to decide whether the two signals are identical.
- Step 3
- The software adaptively adjusts the frequency offset according to the correctness of the subject’s indication for the tone. The frequency offset values can be set as , with initial frequency offset , where is the frequency of the probe pure tone.
- Step 4
- When the subject gives N (N can be set by the software) times correct indications, then the frequency offset is halved. When the subject hits N times incorrect indications, the frequency offset is doubled. Otherwise the frequency offset is held constant and the testing continues.
- Step 5
- When the offset is switched back and forth between the adjacent [Δf1 Δf2]·M times, or the offset is already tested M times, the frequency discrimination threshold at the probe frequency is considered to be the geometric average of the last two adjacent frequencies . The measurement moves to the next frequency and then returns to step 1.
Coefficients of M and N can be set by the computer software to meet the application requirements, generally for 3~8 times. The larger the values of N and M, the more accurate the result will be, but at the expense of longer time consumption for the measurement. In our experiment, the values of N and M were set to 4 and 6, respectively. The results of the experiment of six subjects at the frequencies of the highest hearing thresholds are tabulated in Table 2.
Table 2.
The results of six subjects at the frequencies of the highest hearing thresholds.
To improve reliability of the results, the test is usually repeated over a period of time. In audiology research, frequency discrimination threshold of normal adults is about 0.1% to 0.45%, and decreases along with frequency of the probe signal. When the discrimination threshold is worse than the normal range, it may lead to difficulty indistinguishing speech in a noisy environment. This leads to deterioration of speech intelligibility for the patient [5].
4.3. The Performance of the Frequency Shifting Algorithm
In order to verify the effect of the proposed frequency shifting algorithm on the six subjects with V-shaped audiograms, subject evaluation tasks for speech discrimination score (SDS) and speech reception threshold (SRT) were performed. Speech discrimination score is the percentage of the speech words that a subject identifies correctly. The speech pressure level of 50% recognition score is defined as the speech reception threshold. For the choice of corpus, monosyllabic vocabulary, disyllabic vocabulary, and sentences were selected. Since a syllable is the smallest unit of Chinese language, monosyllabic lists are usually chosen for speech discrimination score tests. However, monosyllabic words cannot express complete semantics, coarticulation, allophone, and other phenomena in the language, so disyllabic spondaic words are commonly used for additional speech audiometry. The materials of the experiment were selected from the monosyllabic vocabulary and the disyllabic vocabulary in the Chinese Mandarin Speech Audiometry CD published by People’s Medical Publishing House. The corpus meets the national standard GB/T15508 with reference to “Acoustics Manual” for word selecting and recording. The audiometry procedure was performed according to references [21,22], and the software platform was established according to reference [23]. In the experiment, the materials were processed by the piecewise-linear frequency shifting algorithm.
The range of frequency stretching was decided according to the results obtained from the frequency discrimination test and the value of stretching ratio was determined by Equation (1). The range of frequency compressing, the compressing ratios and were determined by Equations (2)–(3). In order to control distortion of the output signal, the value of the stretching ratio was set between 2 to 5, and the values of and were set between 0.9 to 1. Table 3 shows the stretching ratios and the compressing ratios of the six subjects. As shown in Figure 1, and can be set freely according to the channel edge frequencies. In this paper, we used and in all experiments to avoid the influence of the different channel widths.
Table 3.
The parameters of the piecewise-linear frequency shifting algorithm.
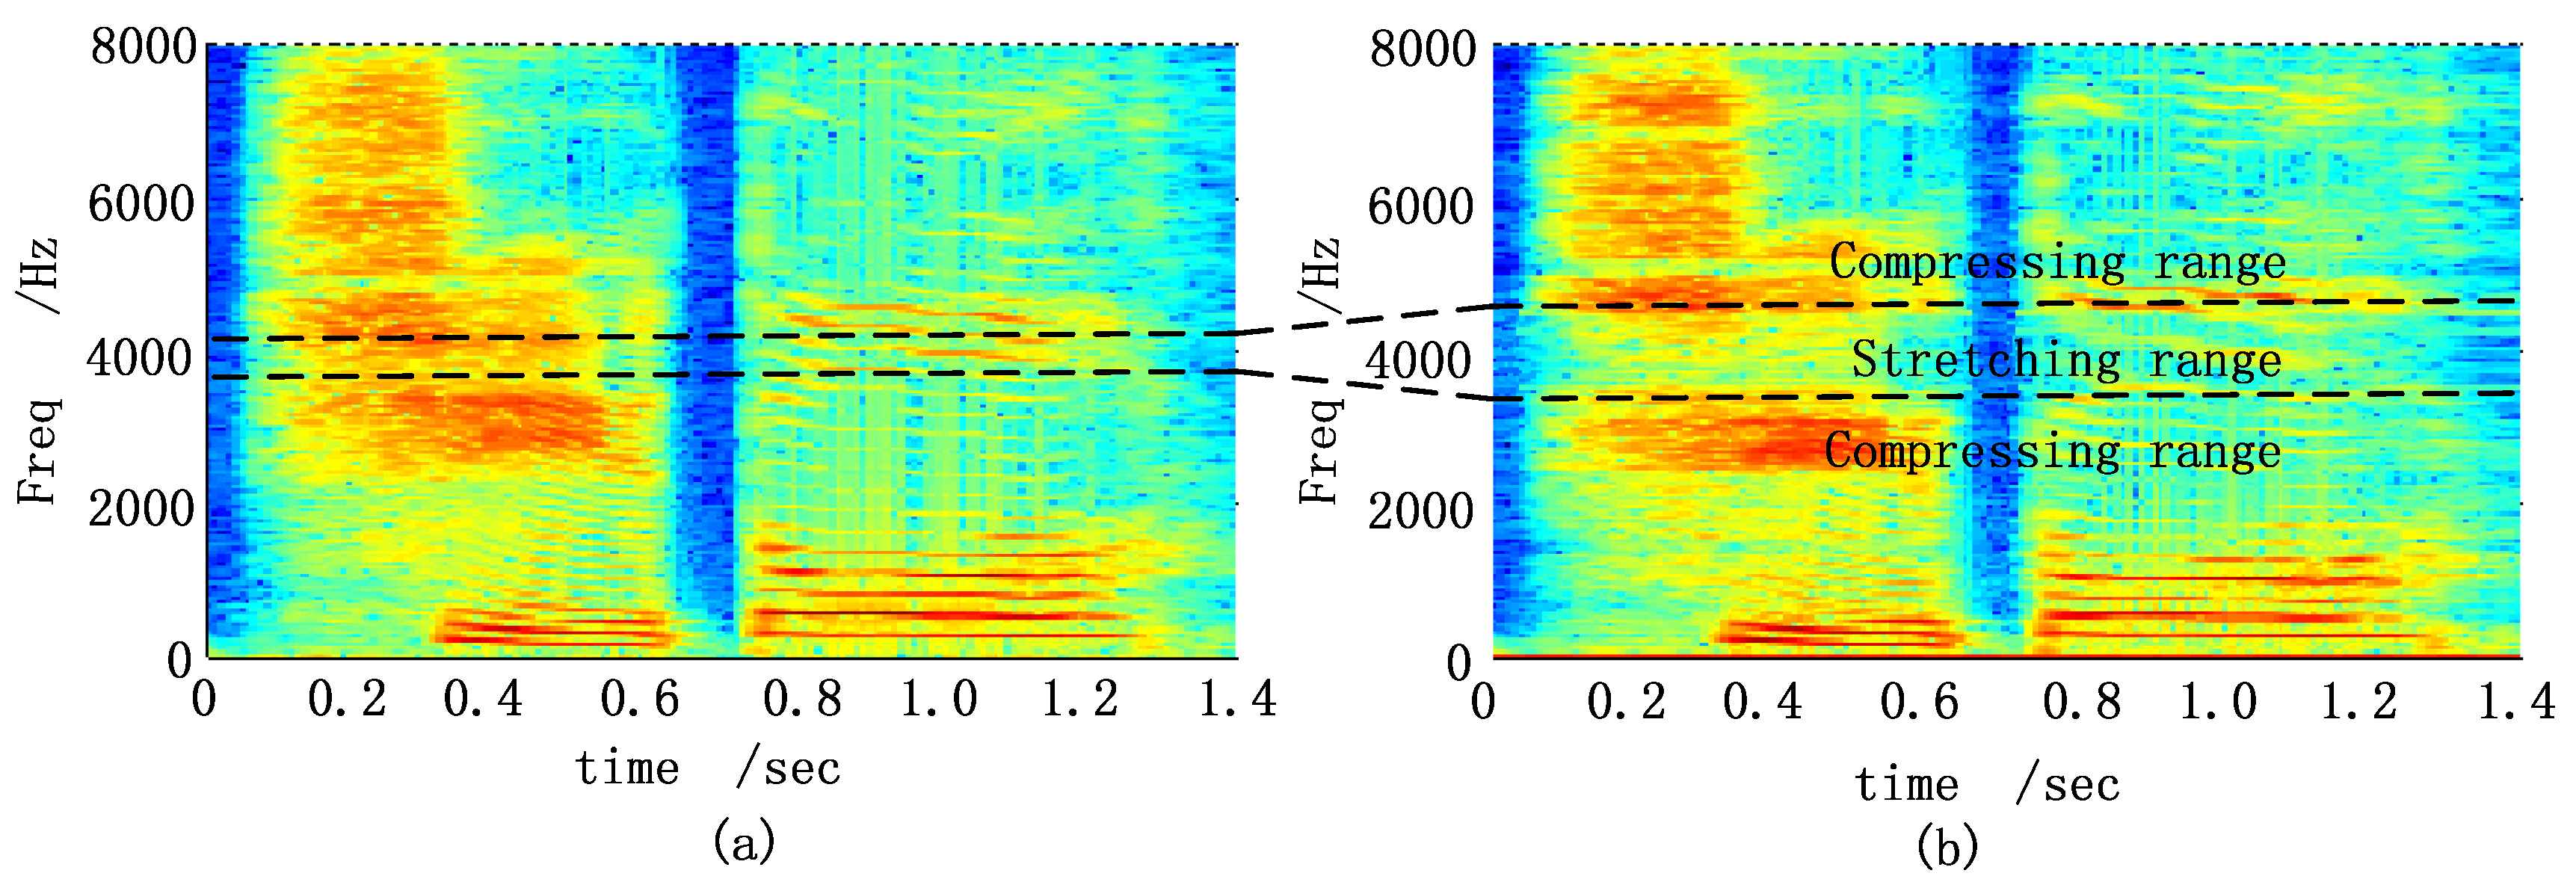
The original sample rate of the vocabularies was 44.1 kHz. This sampling rate was first changed to 16 kHz before processing. The frame length was 1024 samples with 512 samples overlapped. Figure 5 shows the spectrograms of the Chinese disyllabic word “Xuduo” (the meaning is “many”) before and after the proposed algorithm. Here, and the frequency stretching range was with the coefficients , , and .
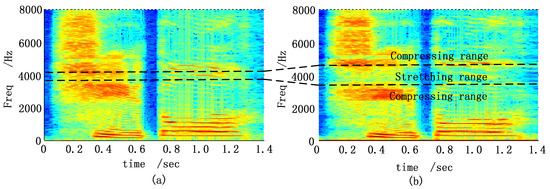
Figure 5.
Spectrograms of a Chinese disyllabic word. (a) Spectrogram before process; (b) Spectrogram after process.
As shown in Figure 5a,b, the spectrogram of the frequency region of the original signal was stretched in the spectrogram of the output signal. The separation of formant tracks was increased and the energy was diluted. While the spectrograms of the adjacent frequency ranges were compressed with the formants slightly squeezed. The audition in a silent room by a normal hearing person showed that the processed word was clear.
4.4. Experiment Results of SDS for Monosyllabic Vocabulary
The speech discrimination scores of the six subjects using monosyllabic vocabulary in “Mandarin Chinese Speech test CD” were tested. As shown in Table 4, the contribution of the different frequency components varies in speech recognition [24,25]. In Chinese, energy of the voiceless consonant is mainly focused on the medium-high frequency range. The loss of medium-high frequency sensitivity and resolution therefore leads to difficulty for voiceless consonant recognition.
Table 4.
The contribution of frequency components for speech recognition.
The experiments of SDS measurement based on both the original monosyllabic vocabulary and the processed monosyllabic vocabulary were also performed. Both the vocabularies included 30 equivalent wordlists. In every wordlist, there were 25 Chinese monosyllabic words. The tested original wordlists were selected randomly and the processed wordlists were always selected to ensure that they differed from the original wordlists. In addition, different lists were used in training and testing to ensure that the subjects were not able to remember the content. All six of the subjects utilized the supra-aural headphone in the silent room to listen to the words in the list. Equivalent monosyllabic wordlists were tested in different sound pressure levels from 10 dB to 100 dB with 10 dB steps. Spline interpolation was performed to acquire smooth performance-intensity curves. For every subject, nearly 100 min were spent to get performance-intensity (P-I) curves for the original vocabulary wordlists and the processed vocabulary wordlists.
The curves of performance-intensity (P-I), which depict the relationship between speech discrimination score and speech intensity, are shown in Figure 6. In the figure, the relationship based on the original vocabulary is depicted by solid lines, while that based on the processed vocabulary is depicted by dashed lines. From the figure, it can be concluded that different SDS lines could be achieved even if the subjects had similar audiograms. For example, S1 and S3 had similar audiograms, but the maxima speech discrimination score for S1 was 82%, while the maxima score for S3 was 74%. The P-I curves of S5 reached the maxima SDS when the sound pressure level was 80 dB, and then declined with an increase of sound pressure level. This indicated that the cause of the deafness may be in the auditory central nervous system [26]. In general, it can be seen that the proposed piecewise-linear frequency shifting algorithm had essentially improved the SDS of six subjects in different sound pressure levels (SPLs) by 4%~10%. Notably, S5 achieved the most significant improvement.
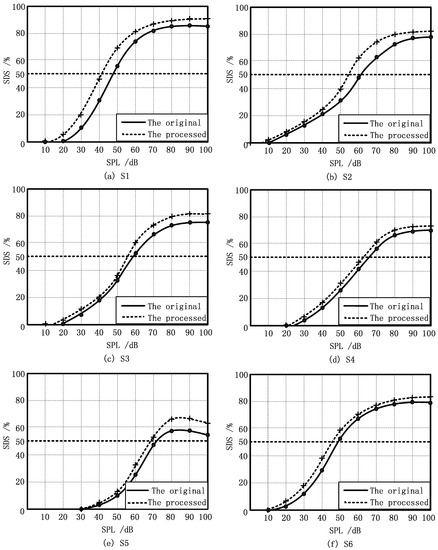
Figure 6.
Performance-intensity (P-I) curves using the original and the processed vocabularies with six subjects: (a) S1; (b) S2; (c) S3; (d) S4; (e) S5; (f) S6.
From P-I curves, the speech reception threshold (SRT) is defined, which is the softest intensity spondee words that an individual can repeat at least 50% of the time. The SRT of the six subjects with vocabularies before and after processing is listed in Table 5. From Table 5, the SRT of S1, S2, S5, and S6 were reduced by 3~8 dB, where the reduction of S2’s SRT was the largest. It can be concluded that the enhancement of frequency discrimination in 3000 Hz and 4000 Hz had a good effect on the speech intelligibility of the subjects. In addition, the subjects had no obvious discomfort with the processed words and their ability to identify voiceless consonants was improved.
Table 5.
Speech reception threshold (SRT) using the original and the processed vocabularies.
4.5. Speech Reception Threshold (SRT) Measurement Using Disyllabic Vocabulary in a Noisy Environment
Hearing-impaired individuals usually wear digital hearing aids in noisy environments. The measurement results using pure vocabularies without noise cannot reveal speech intelligibility of the subjects under real acoustic conditions. In our experiments, a noisy background which was generated by the SurroundRouter software and superposed disyllabic spondaic words, was used to test the SRT of the subjects in a noisy environment. SurroundRouter is a virtual acoustic scene software, published by Otometrics company, Denmark. The software has the capability to simulate the sounds associated with driving in a car, a marketplace, a meeting, a dinner party, etc. In every channel, foreground audio source is superposed to the background acoustic scene, with adjusted SNR and volume. In our experiments, acoustic simulations of riding in a car, a marketplace, and a dinner party were used as the background noise with a certain noise level. Because SRT measurement from P-I curves takes a long time, a fast SRT measurement scheme which satisfies the Guidelines for Determining Threshold Level for Speech [27] and which was recommended by Xi [28] was used. Five Chinese spondaic words with the same speech level were tested as a group. The experiment started with a group of words for which all of the words were recognized correctly. Then the speech level of the tested group was decreased sequentially and the accuracy of the reply was recorded. When all of the tested words in a group could not be recognized, the test was terminated. The SRT was then calculated using Equation (6) which was derived by Xi [28]:
SRT = the initial speech level − the number of the correct answers in the test + 2.5 dB
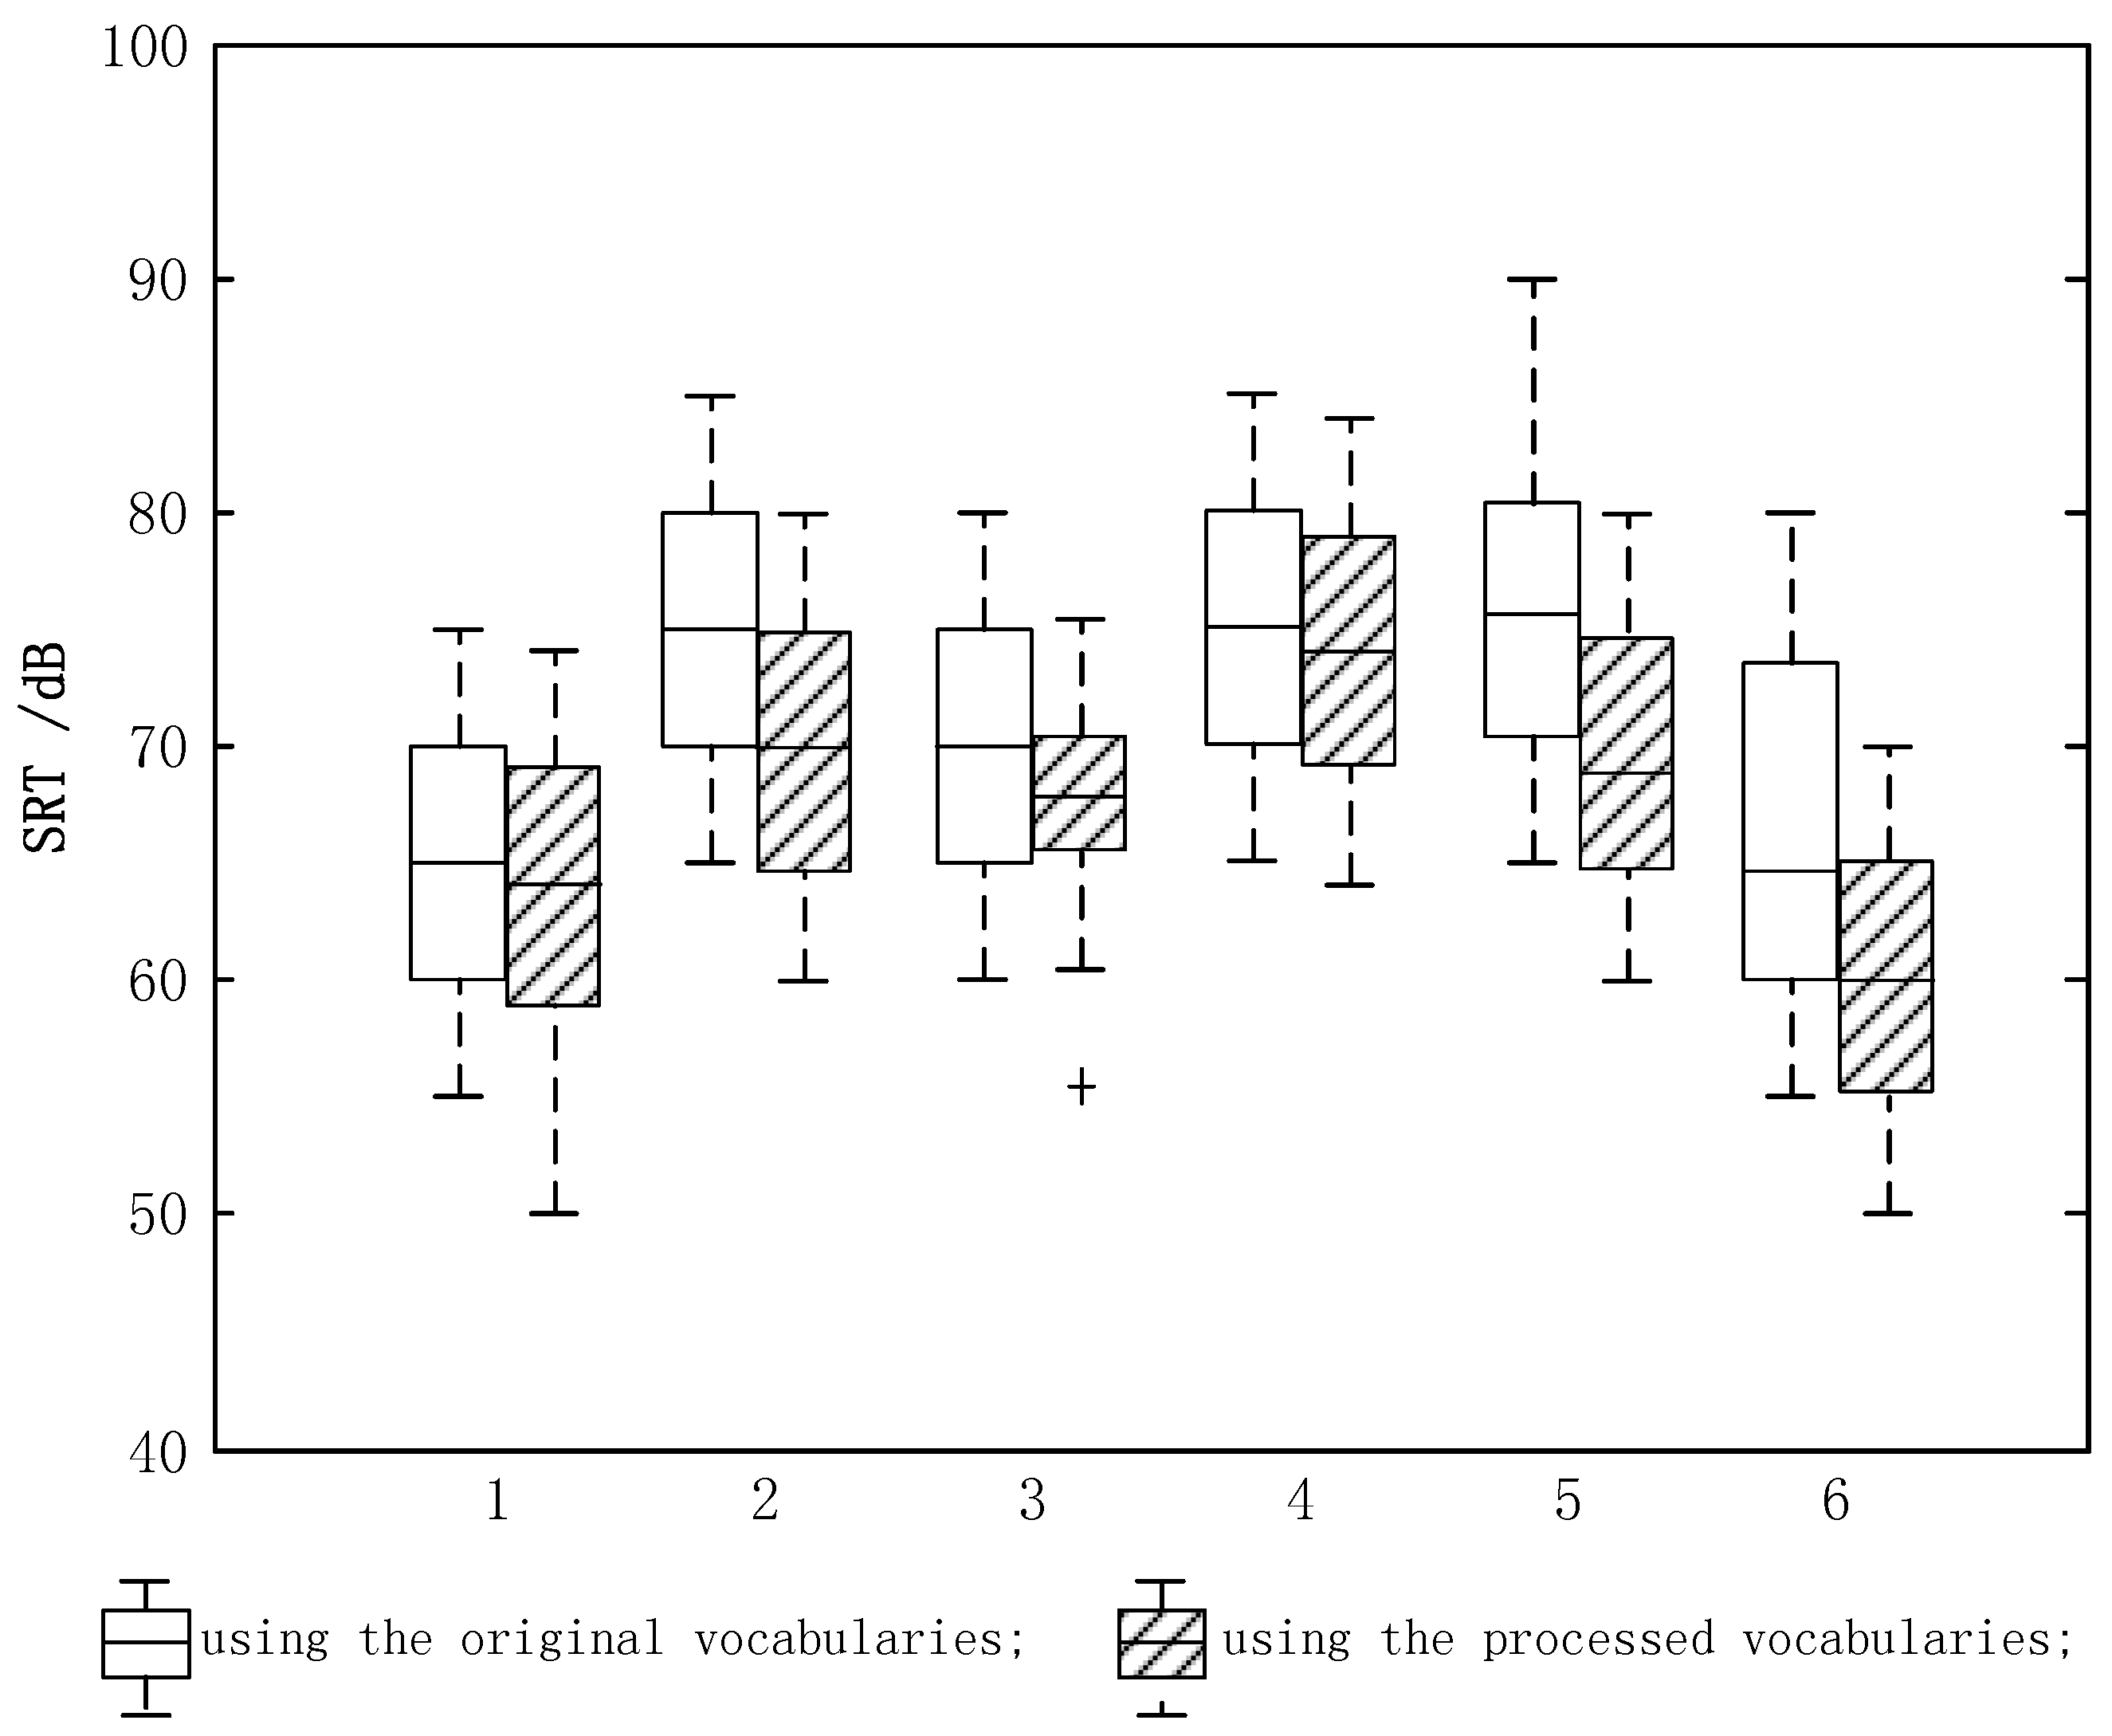
Figure 7 shows the SRT measurement results of the six subjects under the 60 dB car-riding background scenario superposed with Chinese disyllabic spondaic words. Before the test, the subjects were trained. Then, six word lists were tested randomly for every subject. According to one-way Analysis of Variance (ANOVA) with significant level , the testing results of the six subjects satisfied the hypothesis of normal distribution with homogeneity variances. However, using two-way ANOVA, there was a significant difference between the results using the original vocabularies and the processed vocabularies.
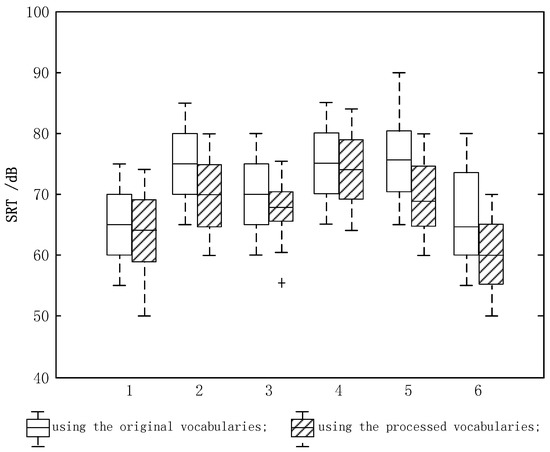
Figure 7.
Boxplot of SRT for the 60 dB car-riding scenario.
The boxplot of SRT results for the six subjects from the 60 dB car-riding scenario is shown in Figure 7. The hollow boxplot represents the results for the original vocabularies, while the shaded boxplot represents the results for the processed vocabularies. ‘+’ indicates that abnormal data is present. From Figure 7, all of the SRT results of the six subjects using the processed vocabularies were decreased by 2~8 dB compared with those using the original vocabularies. Among which, the SRT of S5 was decreased by 8 dB, S2 and S6 were decreased by 4 dB, S3 was decreased by 3 dB, and finally S1 and S4 were decreased by 2 dB.
The experimental results showed that the SRT in the noisy environment of the six subjects had been overall decreased by the piecewise-linear frequency shifting algorithm, and at the same time the speech intelligibility had been improved. The background scenarios for the market place, dinner party, and meeting were tested in the SRT measurement and the improvements were achieved under all background scenes.
5. Conclusions
In order to improve the frequency resolution of hearing-impaired individuals, a piecewise-linear frequency shifting algorithm in digital hearing aids was proposed. In this algorithm, the sensitivity of the hearing-impaired person in the confused frequency range was improved by frequency stretching. The adjacent frequency ranges were compressed to avoid overlap. The comparison between the original spectrograms and the processed spectrograms demonstrated that the distortion of the spectrogram in the compressed region was low. The audition in a silent room by a normal hearing person showed that the processed words were clear. The SDS for Chinese monosyllabic words and the SRT for Chinese spondaic disyllabic words were tested for six hearing-impaired subjects with V-shaped audiograms. The results showed that better SDS and SRT were achieved in the tests using the processed vocabularies than the original ones. This concluded that the speech recognition of the subjects in the noisy environment had been effectively improved. The results of this research will assist with the much needed development and implementation of new signal processing algorithms in commercially available digital hearing aids that are able to operate in real time within 2~8 ms time delay, which will lead to new hearing aids being developed with both amplitude compression and frequency shifting capabilities.
Acknowledgments
The work was supported by the National Natural Science Foundation of China under Grant No. 61375028, 61673108, and 61571106, Qing Lan Project of Jiangsu Province, Six Talent Peaks Project in Jiangsu Province under Grant No. 2016-DZXX-023,China Postdoctoral Science Foundation funded project under Grant No. 2016M601696, Jiangsu Planned Projects for Postdoctoral Research Funds under Grant No. 1601011B, and the open fund of Guangdong lighting and audio video engineering research center under Grant No. KF201601 and No. KF201602.
Author Contributions
The authors contributed equally to this work. Qingyun Wang drafted the main manuscript and conceived the experiments. Ruiyu Liang assisted in the design of the experiments. Susanto Rahardja contributed ideas, was involved in experimental discussions, and also revised the manuscript. Cairong Zou designed the experiments. Liye Zhao and Li Zhao performed the experiments and analyzed the data.
Conflicts of Interest
The authors declare no conflict of interest.
References
- Kalluri, S.; Humes, L.E. Hearing technology and cognition. Am. J. Audiol. 2012, 21, 338–343. [Google Scholar] [CrossRef]
- Li, X.Q. Fundamental and Application of Auditory Evoked Repsponse; Peoples Military Medical Press: Beijing, China, 2007. [Google Scholar]
- Hamilton, T.J.; Jin, C.; Tapson, J.; Van Schaik, A. A 2-D Cochlea with Hopf Oscillators. In Proceedings of the IEEE Biomedical Circuits and Systems Conference, Montreal, QC, Canada, 27–30 November 2007. [Google Scholar]
- Phillips, S.L.; Gordon-Salant, S.; Fitzgibbons, P.J.; Yeni-Komshian, G. Frequency and temporal resolution in elderly listeners with good and poor word recognition. J. Speech Lang. Hear. Res. 2000, 43, 217–228. [Google Scholar] [CrossRef] [PubMed]
- Jin, S.-H.; Nelson, P.B. Interrupted speech perception: The effects of hearing sensitivity and frequency resolution. J. Acoust. Soc. Am. 2010, 128, 881–889. [Google Scholar] [PubMed]
- Lunner, T.; Rudner, M.; Rönnberg, J. Cognition and hearing aids. Scand. J. Psychol. 2009, 50, 395–403. [Google Scholar] [CrossRef] [PubMed]
- Kulkarni, P.; Pandey, P.; Jangamashetti, D. Multi-band frequency compression for reducing the effects of spectral masking. Int. J. Speech Technol. 2007, 10, 219–227. [Google Scholar] [CrossRef]
- Chen, J.; Baer, T.; Moore, B.C. Effect of enhancement of spectral changes on speech intelligibility and clarity preferences for the hearing impaired. J. Acoust. Soc. Am. 2012, 131, 2987–2998. [Google Scholar] [CrossRef] [PubMed]
- Nogueira, W.; Rode, T.; Büchner, A. Spectral contrast enhancement improves speech intelligibility in noise for cochlear implants. J. Acoust. Soc. Am. 2016, 139, 728–739. [Google Scholar] [CrossRef] [PubMed]
- Simpson, A. Frequency-lowering devices for managing high-frequency hearing loss: A review. Trends Amplif. 2009, 13, 87–106. [Google Scholar] [CrossRef] [PubMed]
- Souza, P.E.; Arehart, K.H.; Kates, J.M.; Croghan, N.B.; Gehani, N. Exploring the limits of frequency lowering. J. Speech Lang. Hear. Res. 2013, 56, 1349–1363. [Google Scholar] [CrossRef]
- Yimu, A.; Di, Y.; Qiu, C. Classification of the audiograms for sensorineural deafness. J. Audiol. Speech Pathol. 2006, 14, 384–385. [Google Scholar]
- Bohnert, A.; Nyffeler, M.; Keilmann, A. Advantages of a non-linear frequency compression algorithm in noise. Eur. Arch. Oto-Rhino-Laryngol. 2010, 267, 1045–1053. [Google Scholar] [CrossRef] [PubMed]
- Moore, B.C. Psychophysical tuning curves measured in simultaneous and forward masking. J. Acoust. Soc. Am. 1978, 63, 524–532. [Google Scholar] [CrossRef] [PubMed]
- Moore, B.C. An Introduction to the Psychology of Hearing; BRILL: Leiden, The Netherlands, 2012. [Google Scholar]
- Jesteadt, W.; Sims, S. Decision process in frequency discrimination. J. Acoust. Soci. Am. 1974, 56, S44. [Google Scholar] [CrossRef]
- Sęk, A.; Alcántara, J.; Moore, B.C.; Kluk, K.; Wicher, A. Development of a fast method for determining psychophysical tuning curves. Int. J. Audiol. 2005, 44, 408–420. [Google Scholar] [CrossRef] [PubMed]
- Kluk, K.; Moore, B.C. Factors affecting psychophysical tuning curves for normally hearing subjects. Hear. Res. 2004, 194, 118–134. [Google Scholar] [CrossRef] [PubMed]
- Kluk, K.; Moore, B.C. Factors affecting psychophysical tuning curves for hearing-impaired subjects with high-frequency dead regions. Hear. Res. 2005, 200, 115–131. [Google Scholar] [CrossRef] [PubMed]
- Levitt, H. Transformed up-down methods in psychoacoustics. J. Acoust. Soc. Am. 1971, 49, 467–477. [Google Scholar] [CrossRef]
- Xi, X. Operation procedures on speech audiometry (1). J. Audiol. Speech Pathol. 2011, 19, 489–490. [Google Scholar]
- Xi, X. Operation procedures on speech audiometry (2). J. Audiol. Speech Pathol. 2011, 19, 582–584. [Google Scholar]
- Xi, X.; Huang, G.Y.; Ji, F. The establishment of computer-assisted Chinese speech audiometry platform. Chin. Sci. J. Hear. Speech Rehabil. 2010, 41, 31–34. (In Chinese) [Google Scholar]
- Liang, R.; Xi, J.; Zhou, J.; Zou, C.; Zhao, L. An improved method to enhance high-frequency speech intelligibility in noise. Appl. Acoust. 2013, 74, 71–78. [Google Scholar] [CrossRef]
- Zhao, H. Hearing Aids; People’s Medical Publishing House: Shelton, CT, USA, 2004. [Google Scholar]
- Boothroyd, A. The performance/intensity function: An underused resource. Ear Hear. 2008, 29, 479–491. [Google Scholar] [CrossRef] [PubMed]
- American Speech-Language-Hearing Association. Determining threshold level for speech. ASHA 1987, 29, 141–147. [Google Scholar]
- Xi, X. The basic content and clinical value of adult speech audiometry. J. Clin. Otorhinolaryngol. Head Neck Surg. 2013, 27, 337–339. [Google Scholar]

© 2017 by the authors. Licensee MDPI, Basel, Switzerland. This article is an open access article distributed under the terms and conditions of the Creative Commons Attribution (CC BY) license (http://creativecommons.org/licenses/by/4.0/).