
Simulation of Permanent Deformation in High-Modulus Asphalt Pavement with Sloped and Horizontally Curved Alignment

Abstract
:1. Introduction
2. Materials and Methods
2.1. Binder and Aggregates
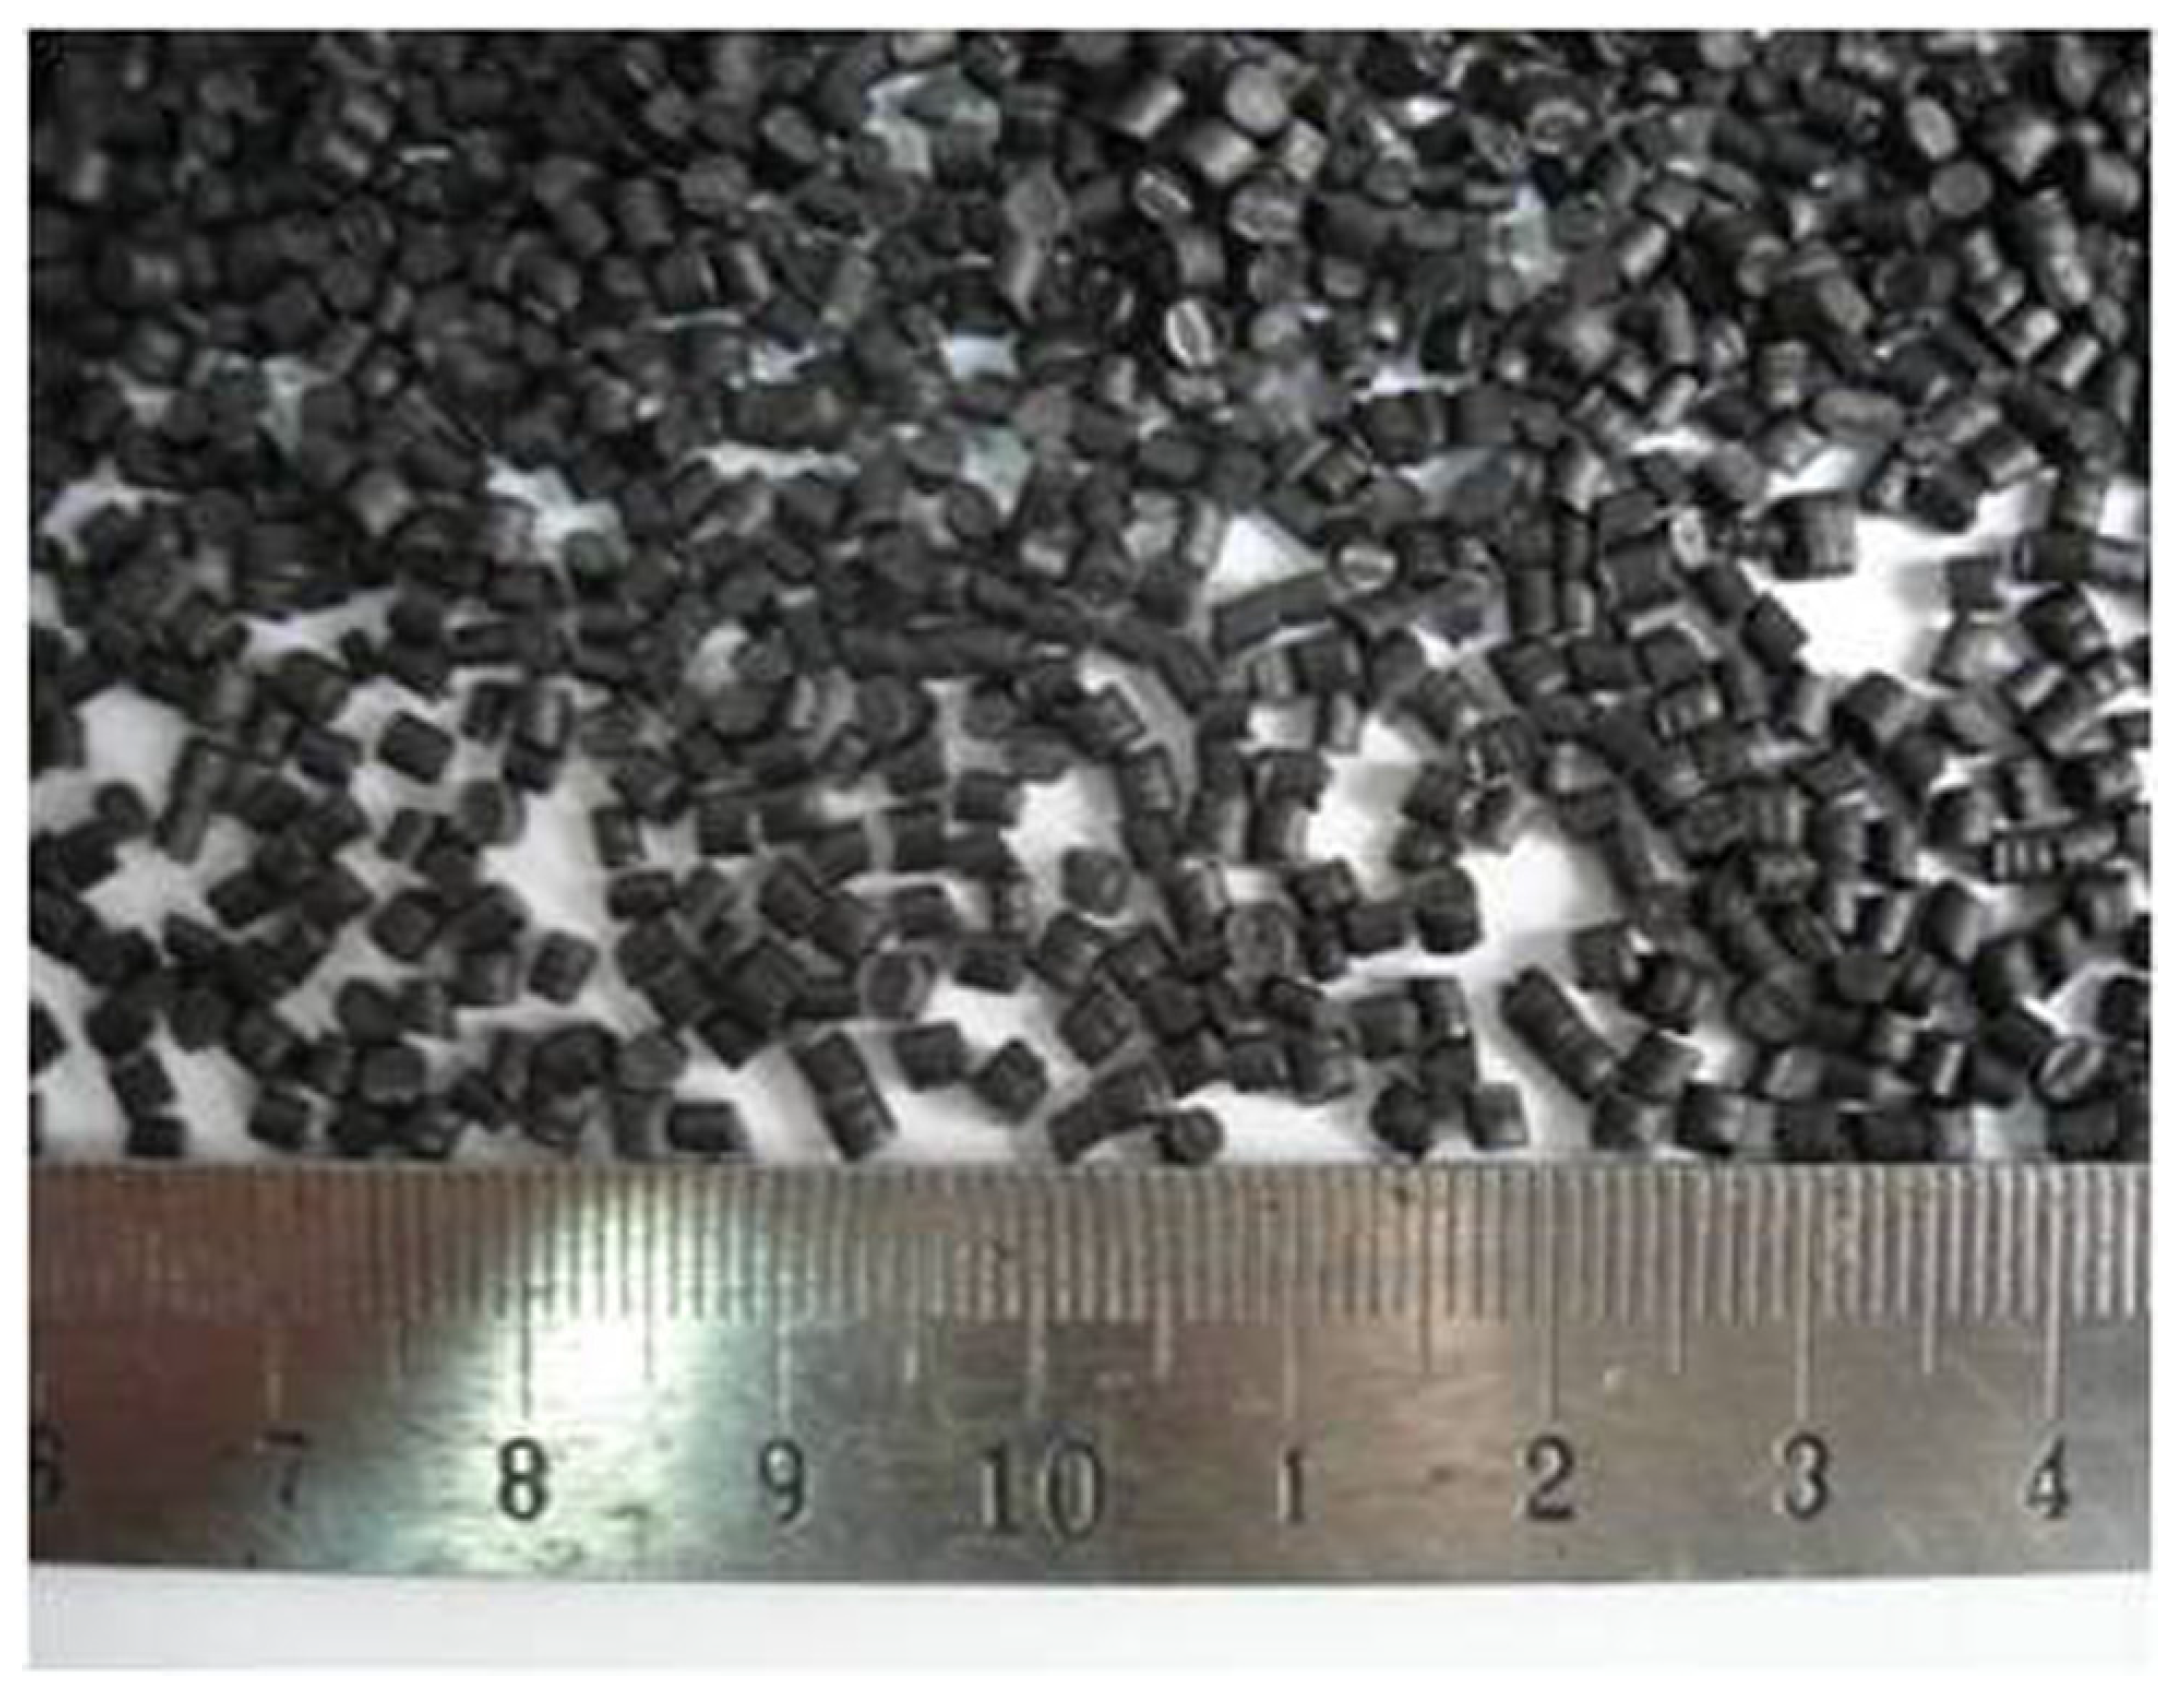
2.2. High-Modulus Additive
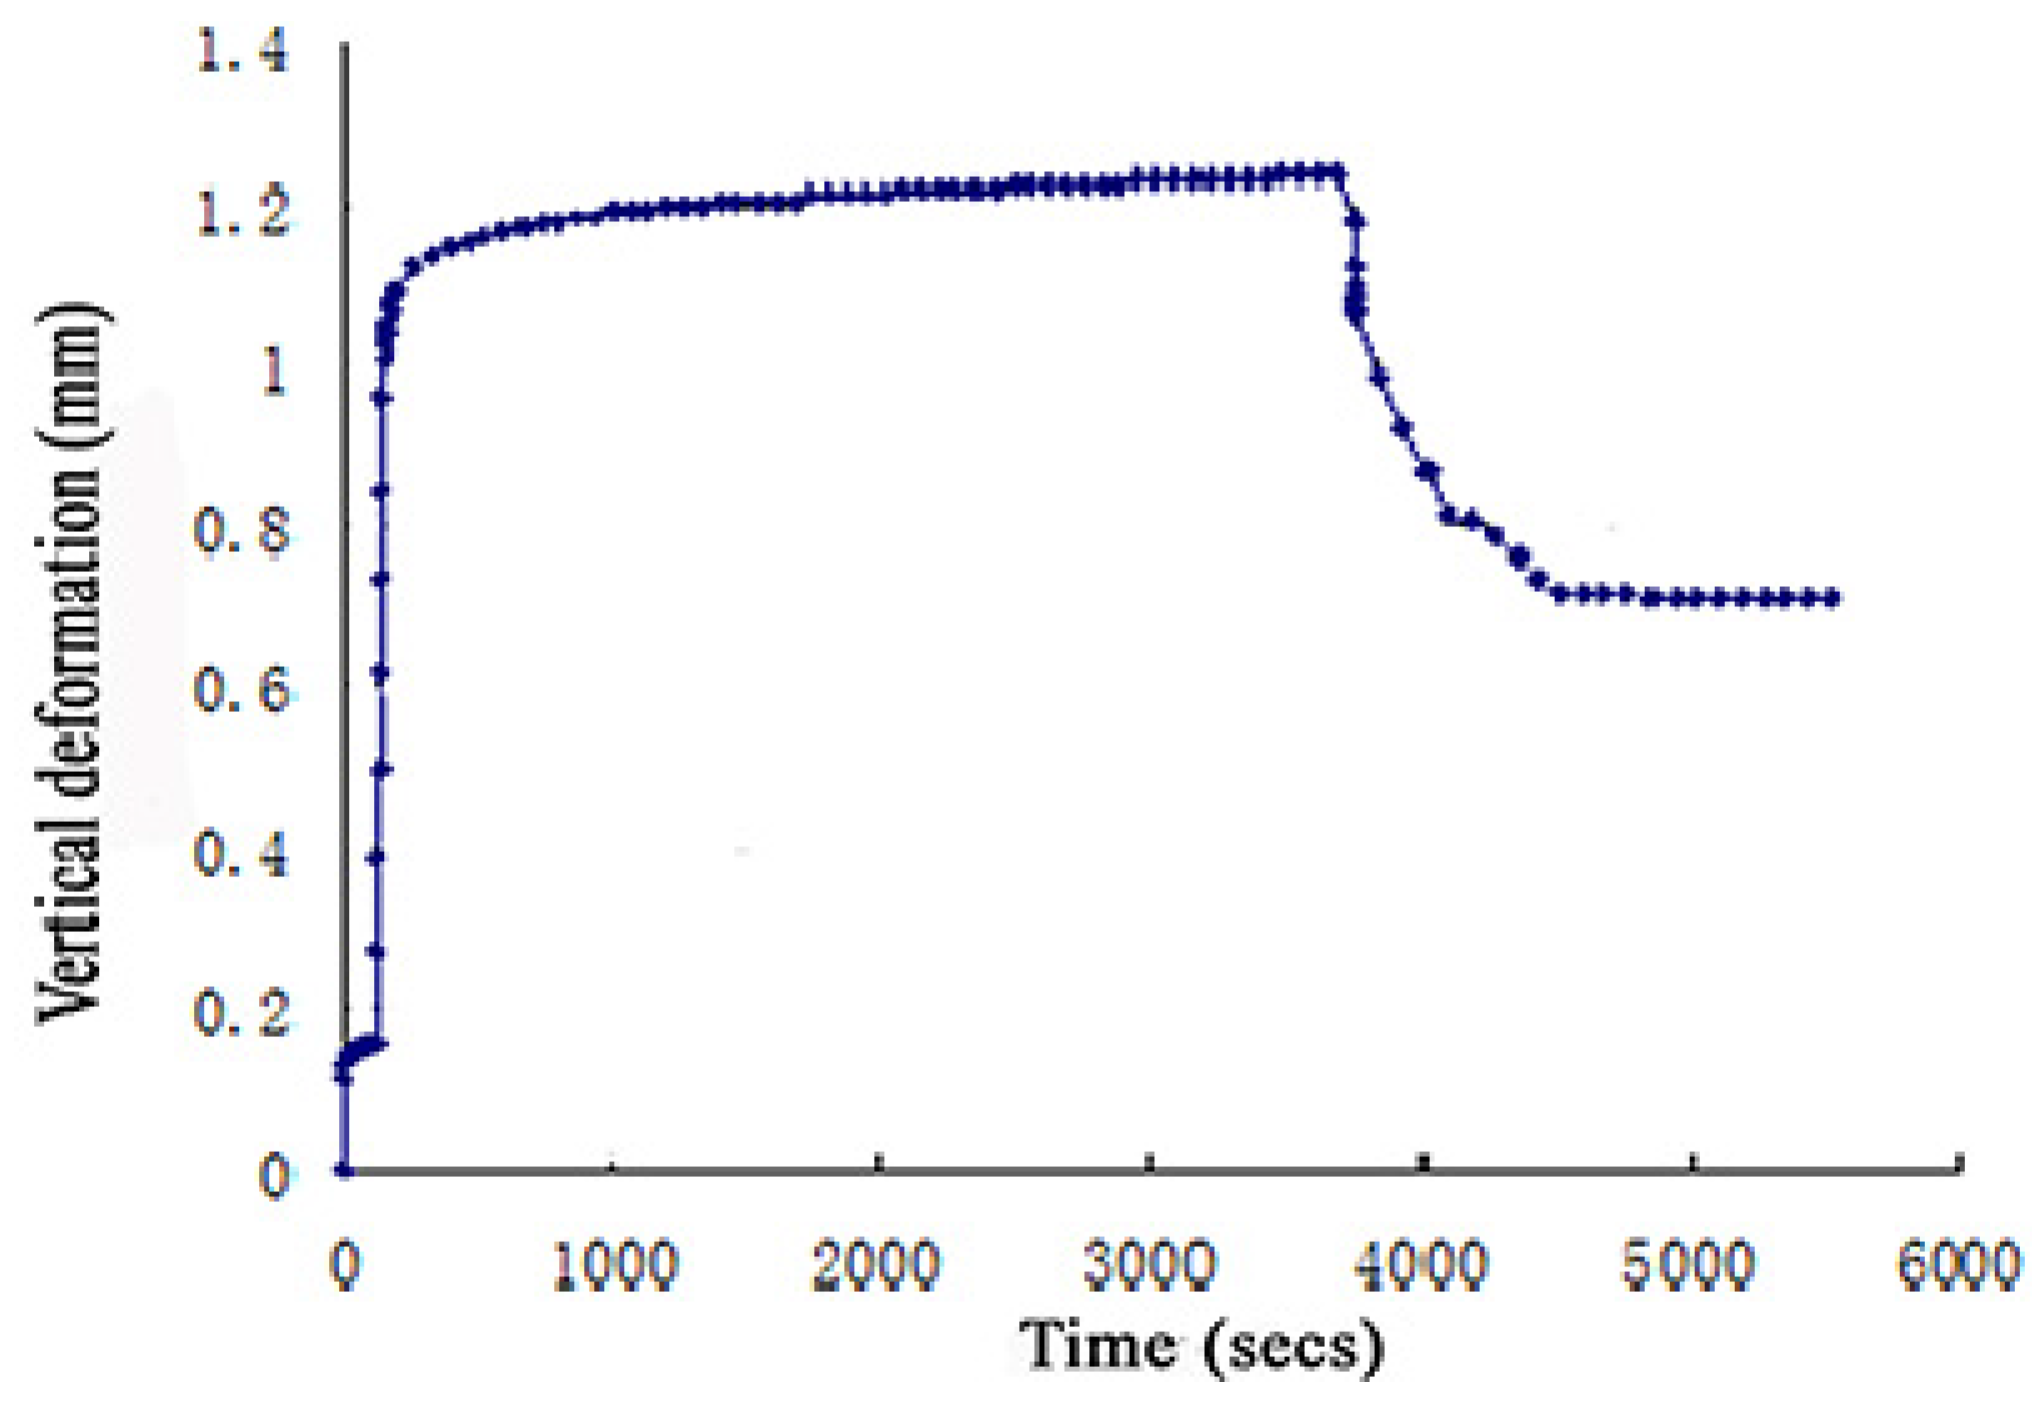
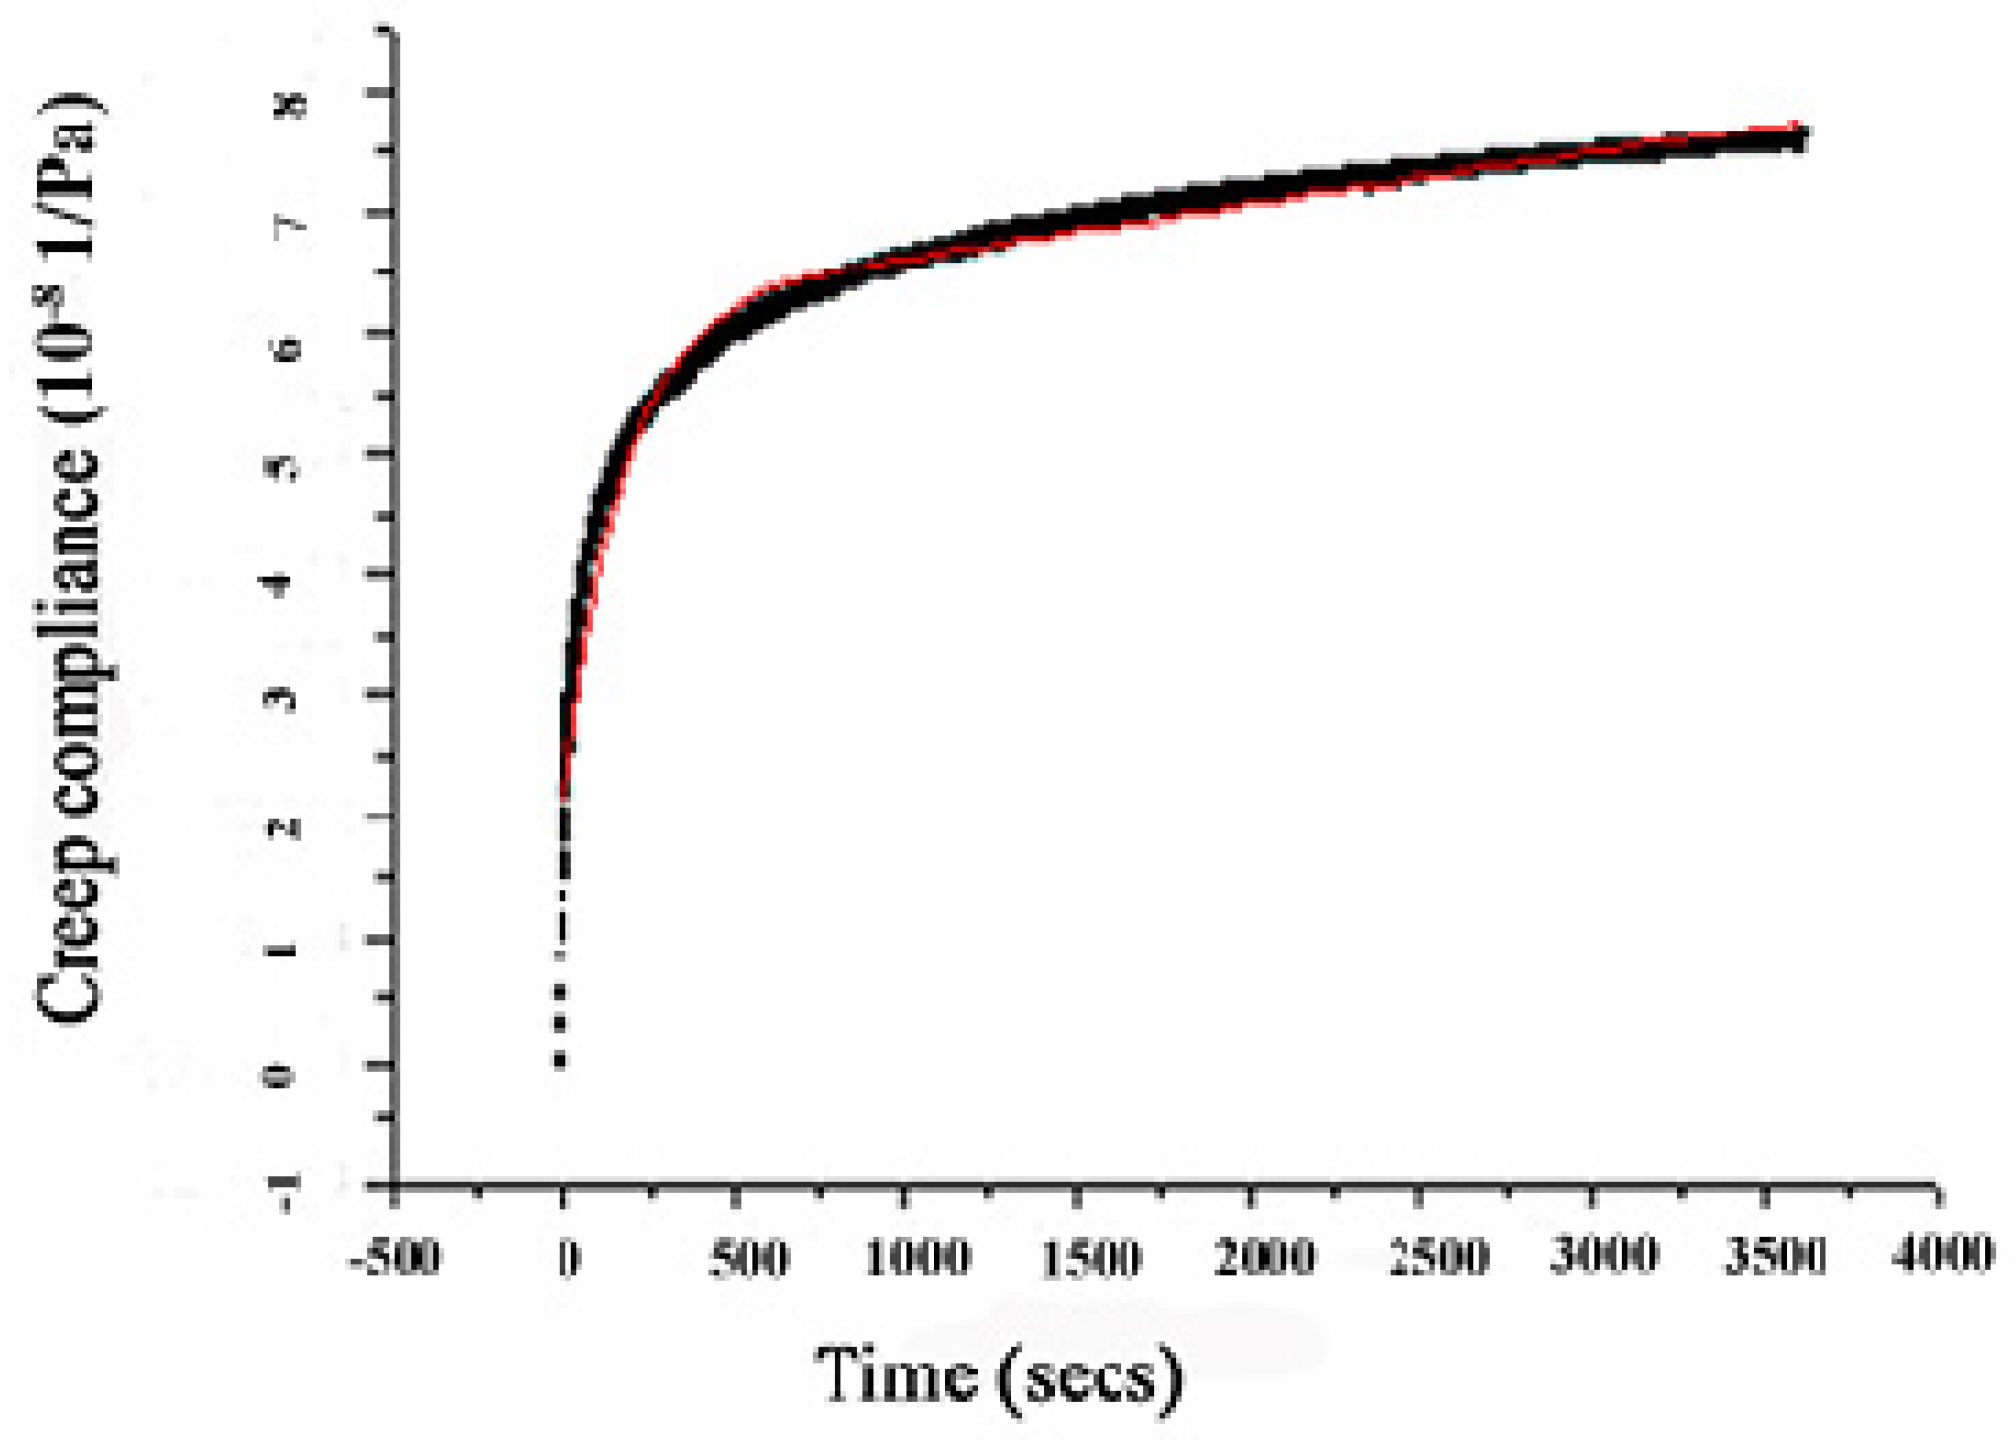
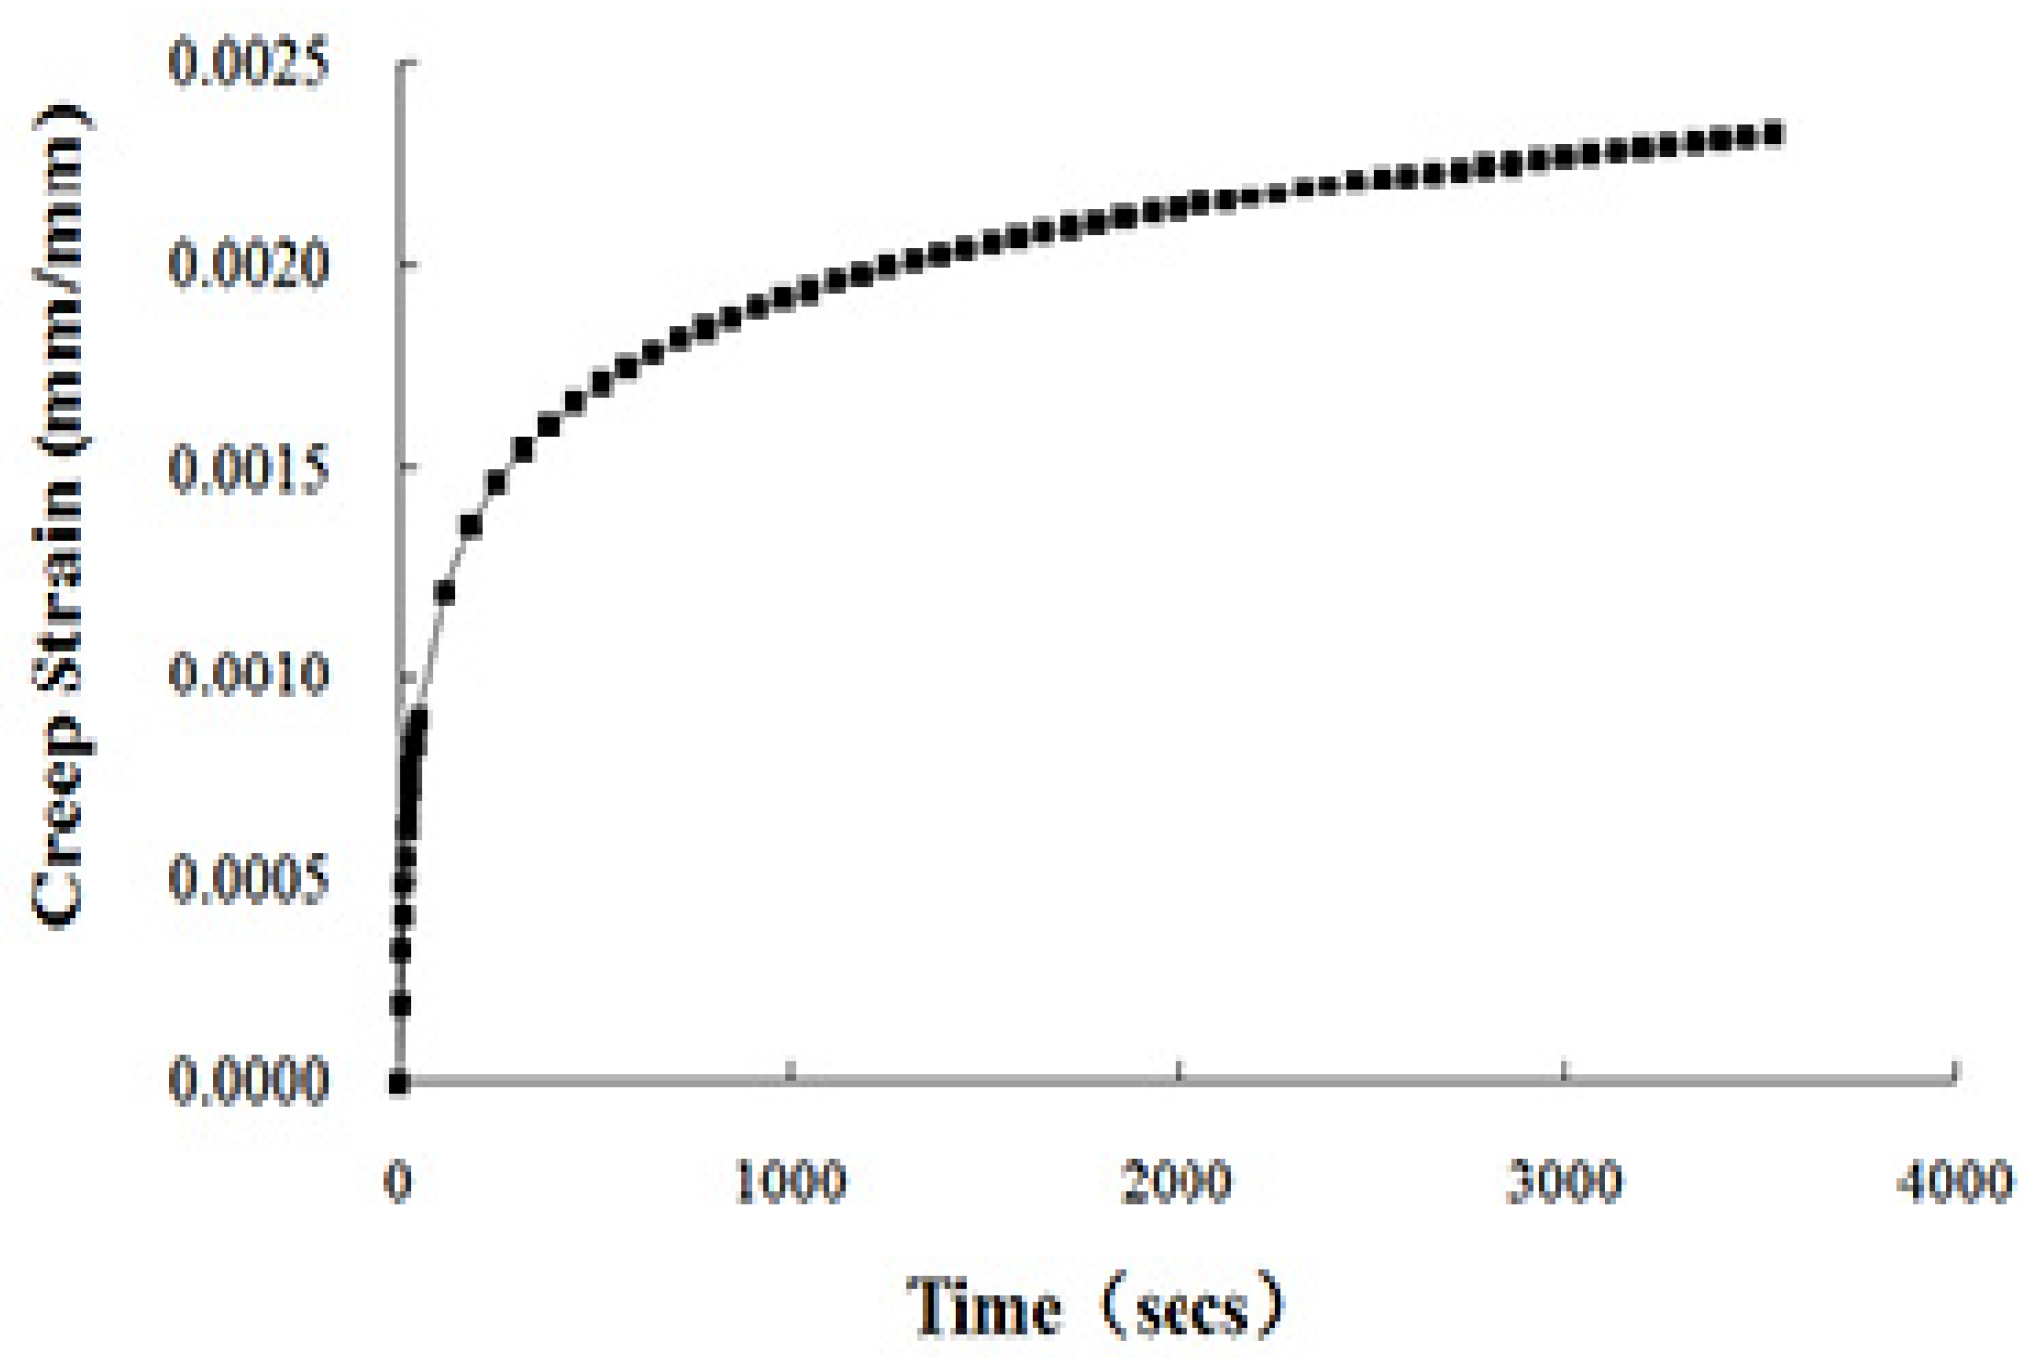
2.3. Creep Test
2.4. Viscoelastic Model and Its Adaptability
3. Simulating HMAC Pavement Deformation in Curved Ramp
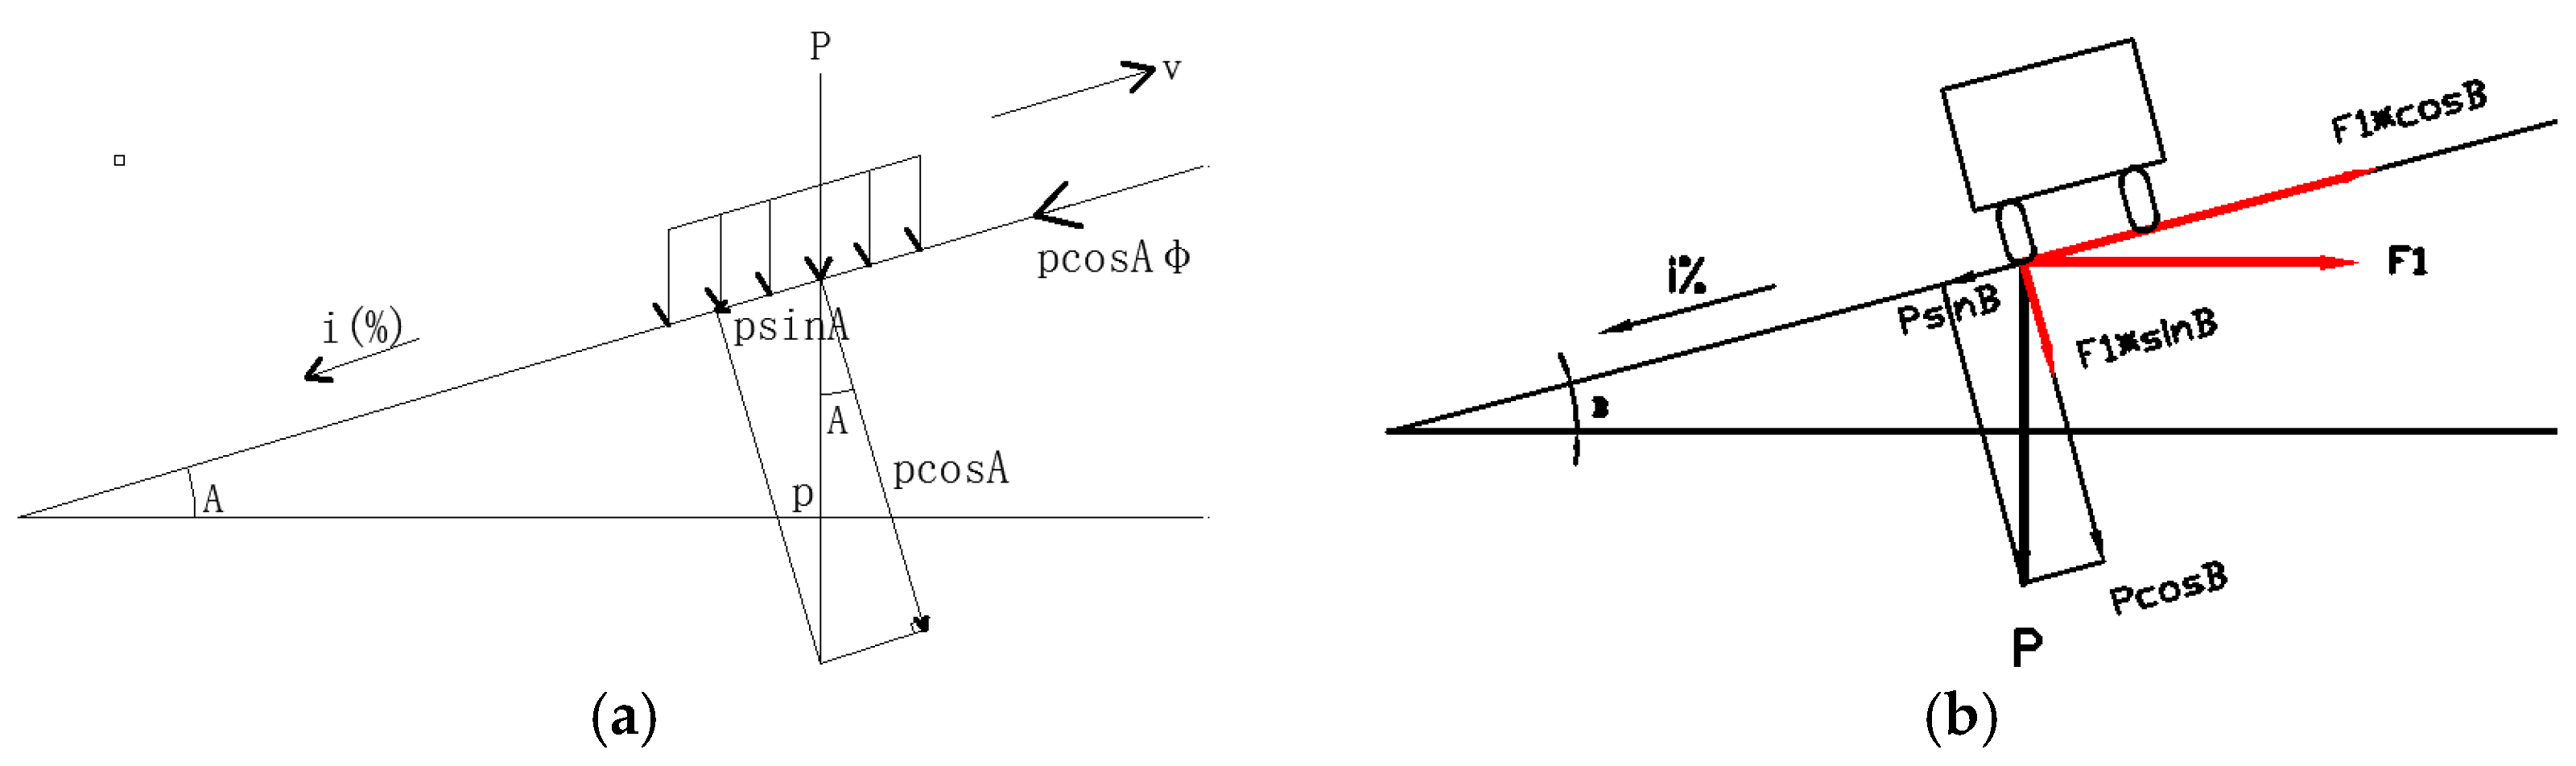
3.1. Road Alignment Feature
3.2. ANSYS Model
4. Results and Discussion
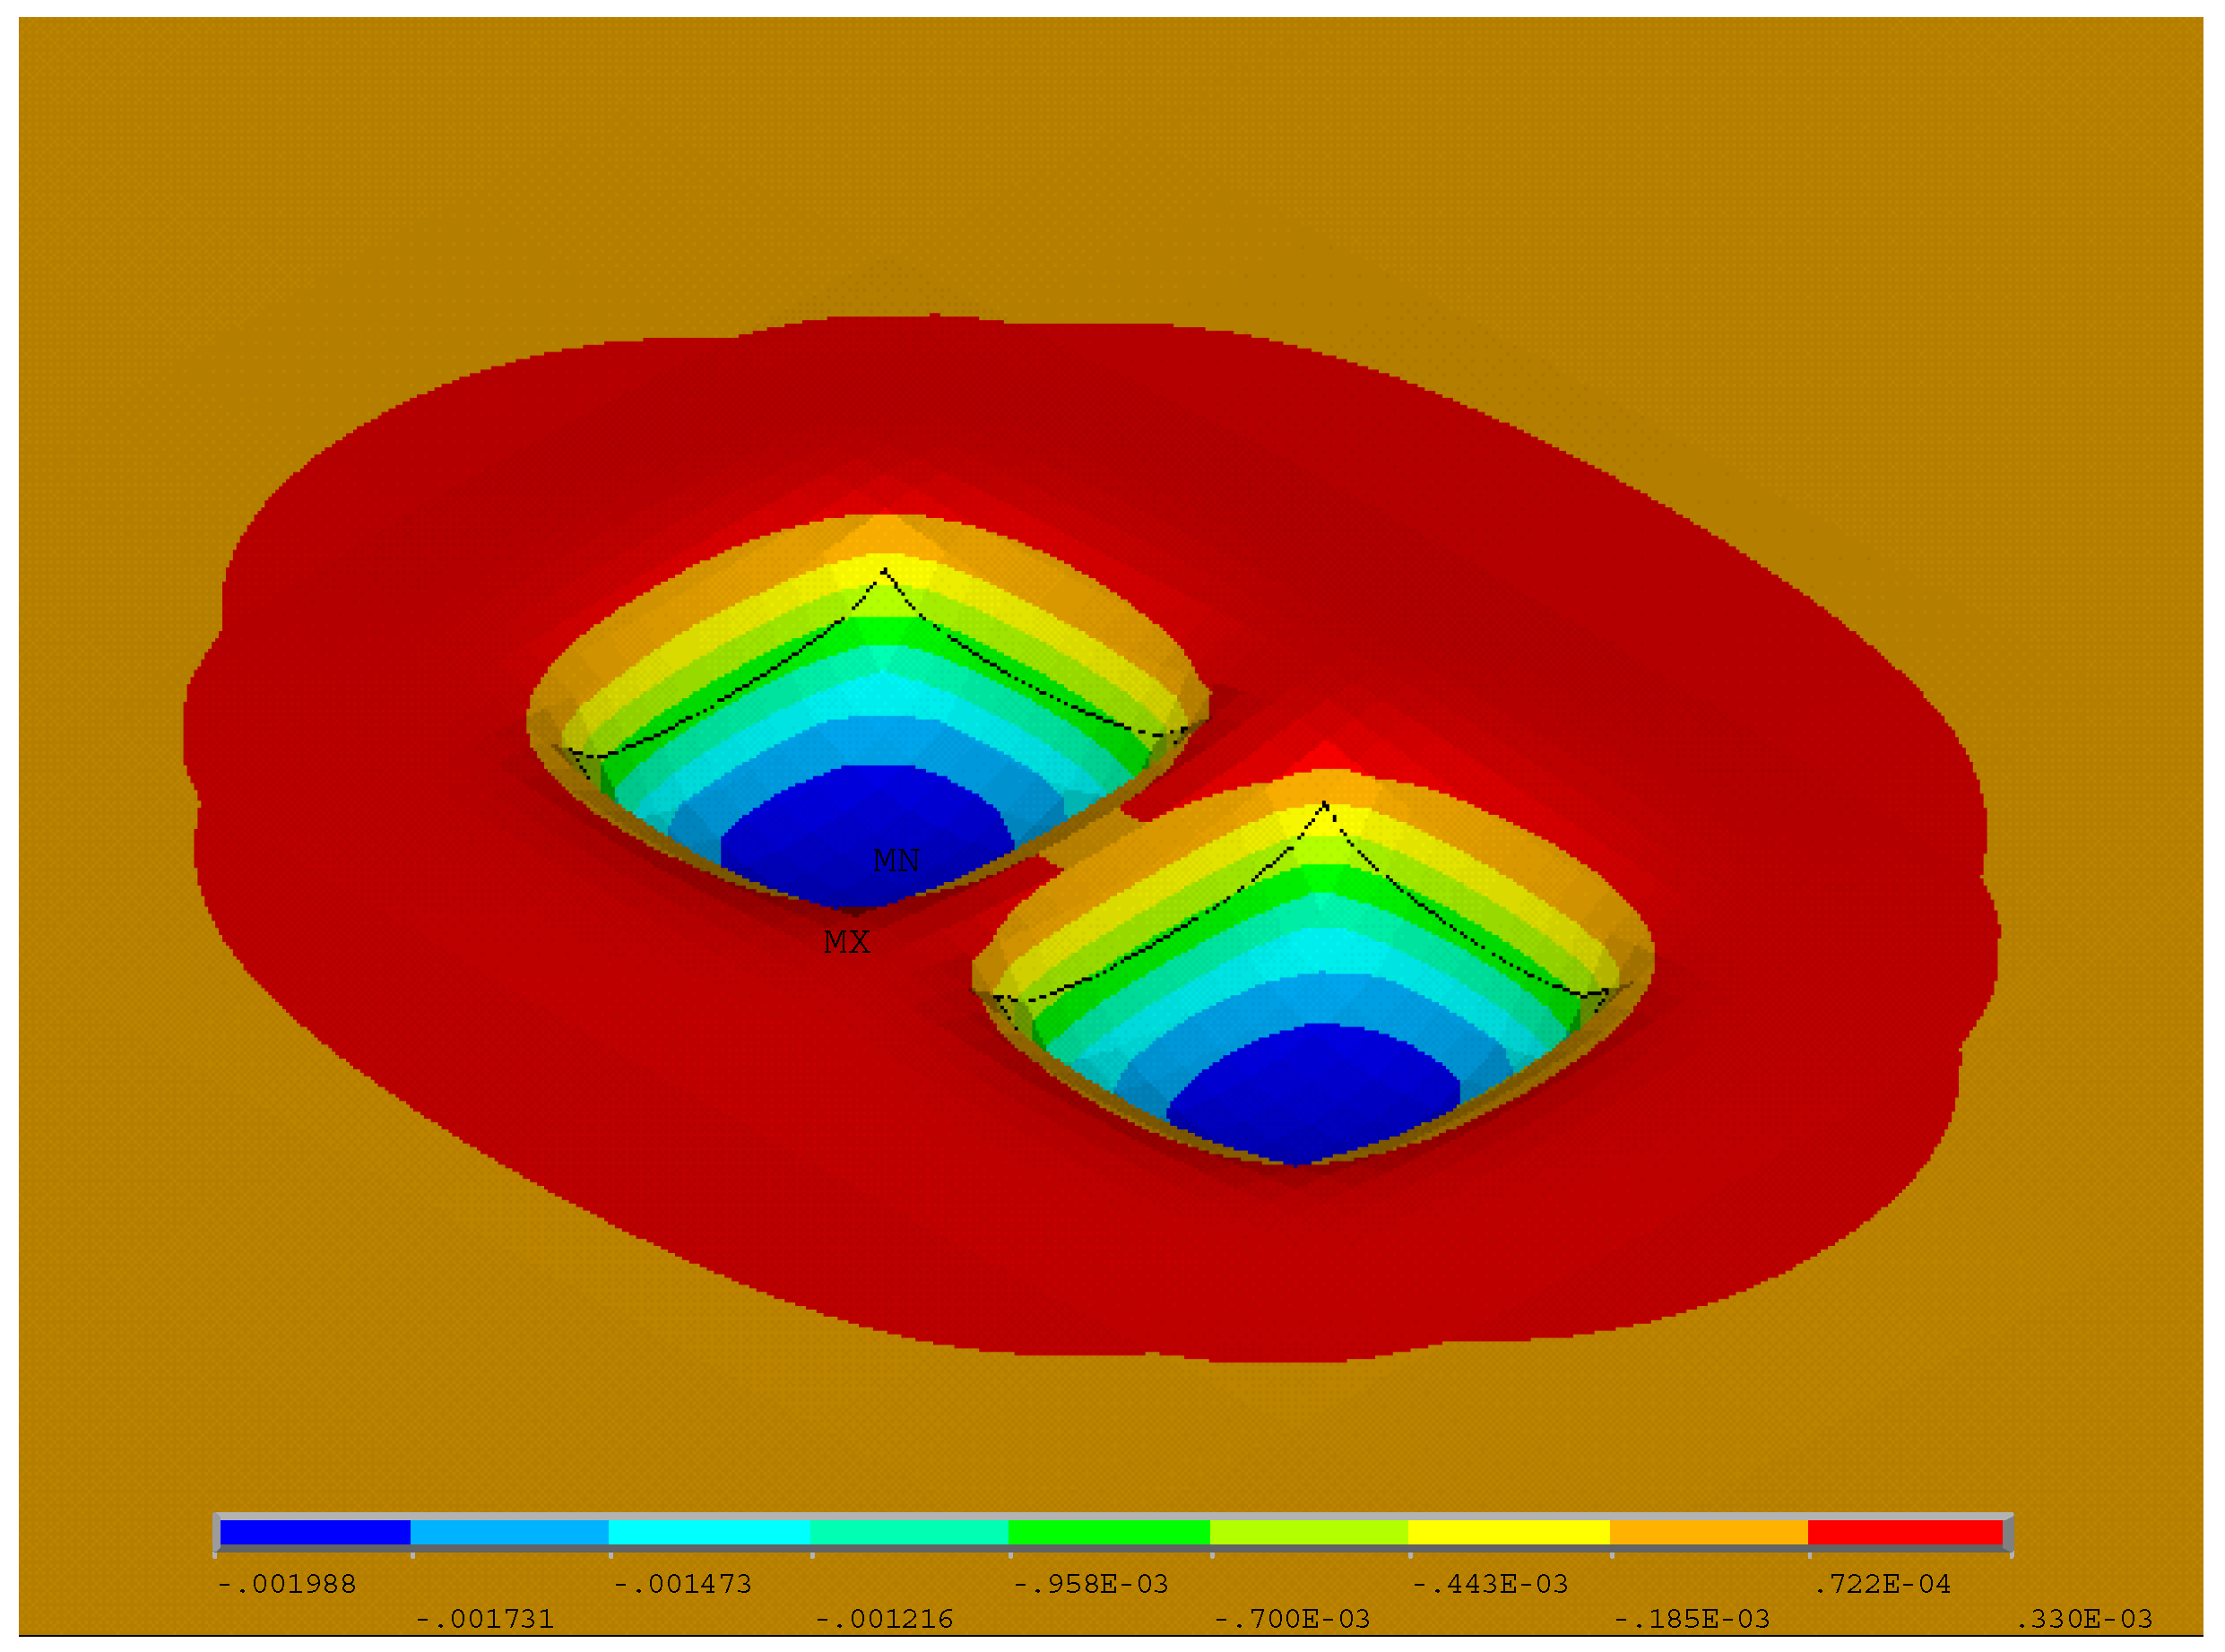
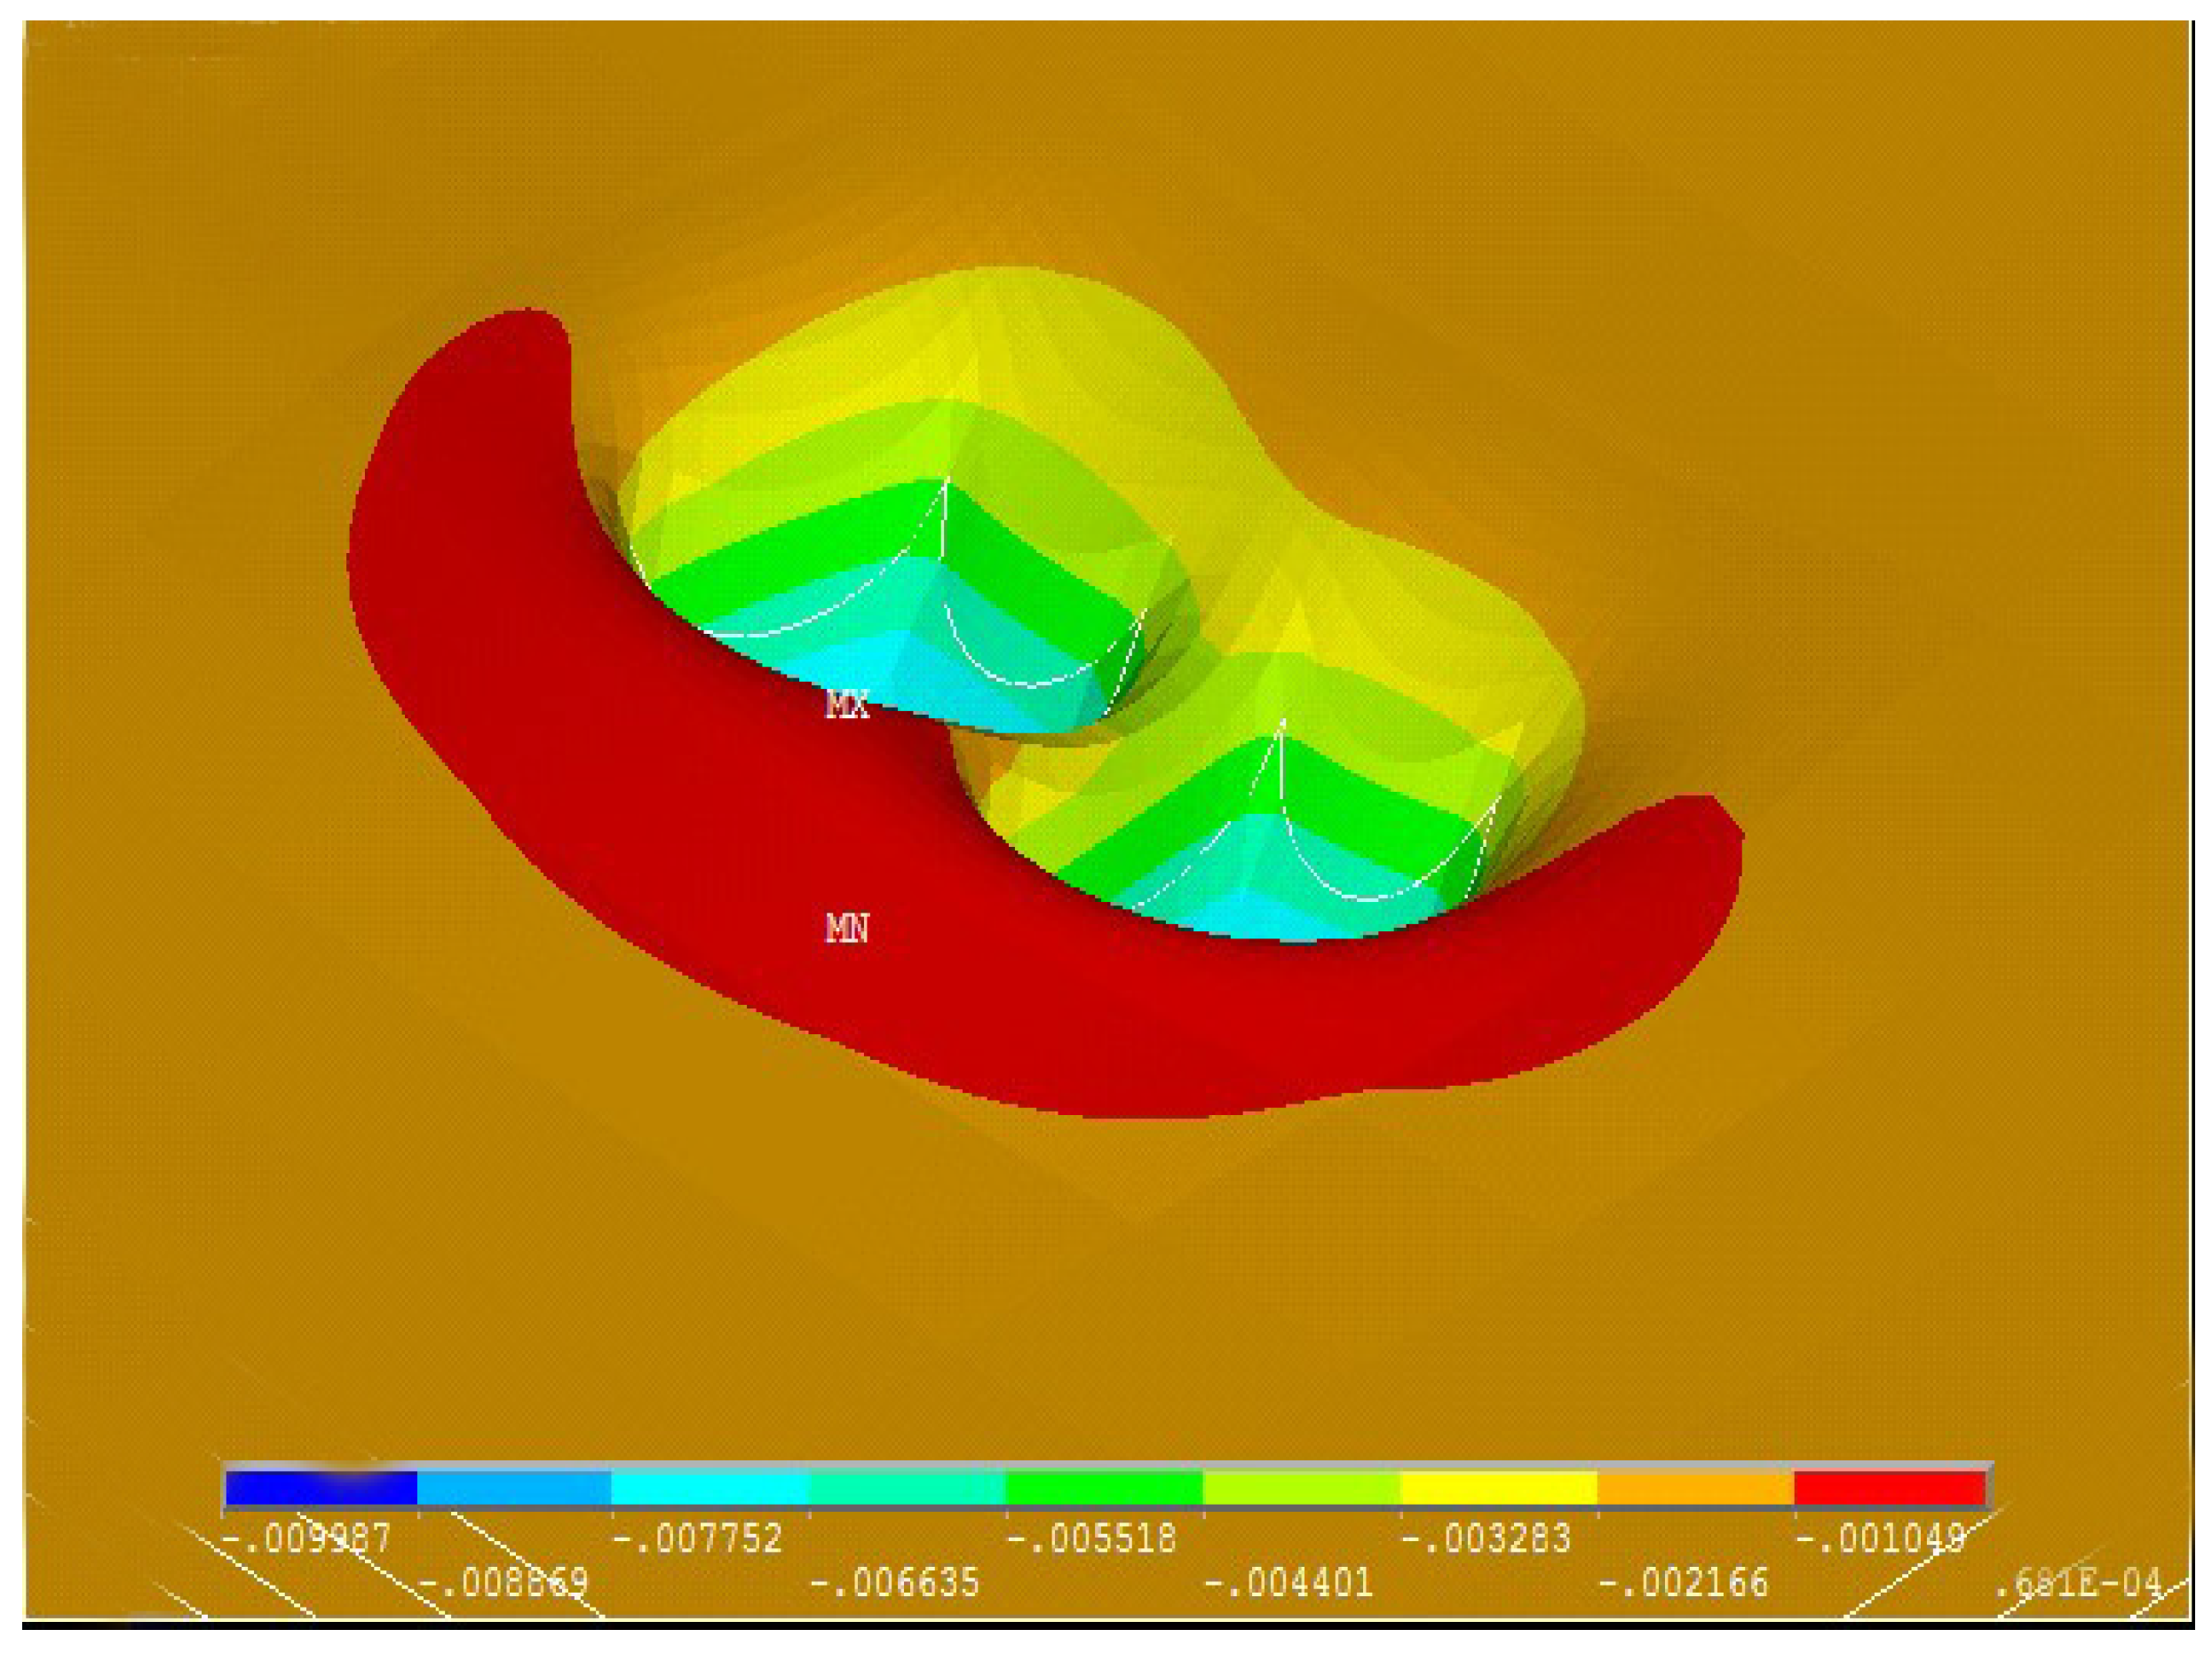
4.1. Contrast of Permanent Deformation in Flat Straight Road and Curved Ramp
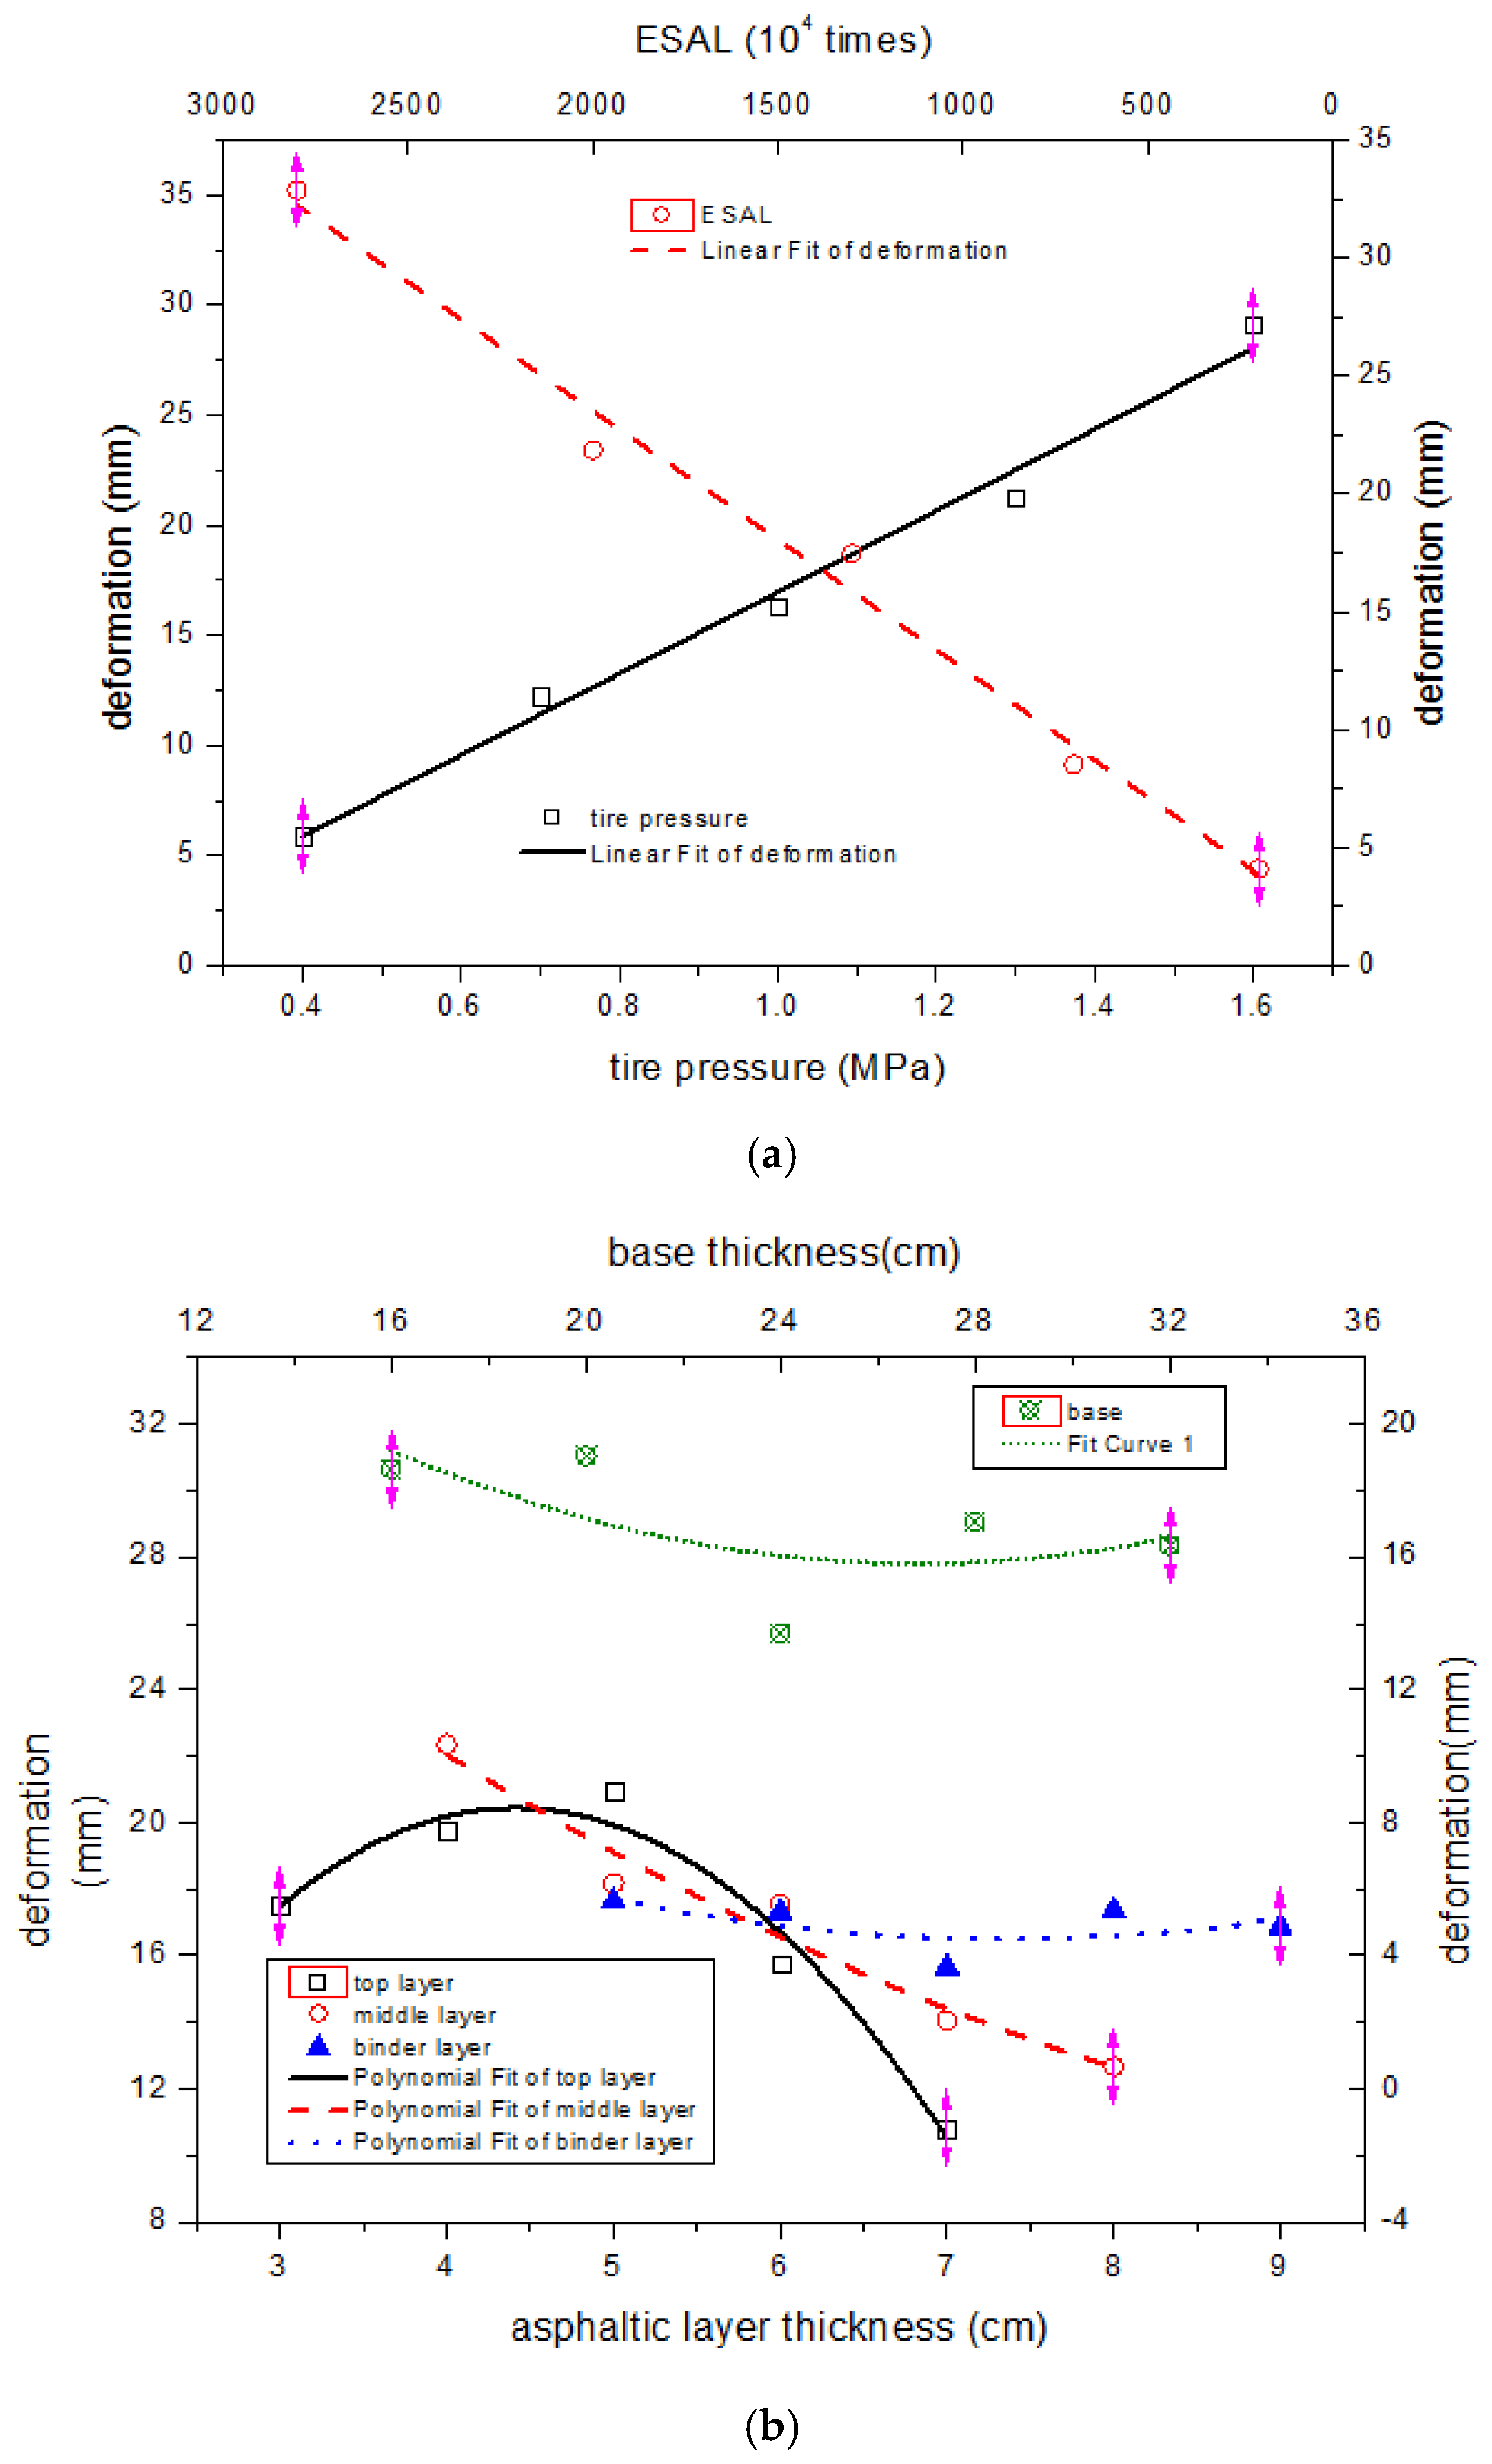
4.2. Influential Factor Analysis Using Orthogonal Design Method
4.3. Rutting Prediction Model for HMAC Pavement in Curved and Sloped Road
- RD is the rutting depth (mm),
- P is the tire pressure (MPa),
- N is the ESAL number (104 times),
- is the thickness of top asphaltic course (cm),
- is the thickness of middle HMAC course (cm),
- is the thickness of binder asphaltic course (cm),
- is the thickness of semi rigid base (cm).
5. Conclusions
- (1)
- The maximum rutting depth and bump height of HMAC pavement in curved and sloped road were greater than those in straightaway. The downward pavement areas of curved and sloped road developed evident upheaval due to longitudinal friction force. In addition, the outside pavement of horizontal curve presented larger upheaval than the inner side due to sideway force.
- (2)
- Analysis shows the upper and middle asphaltic courses were more crucial to pavement anti-rutting performance in curved and sloped road since inclusion of longitudinal and transverse shear force changed pavement deformation characteristic and the potential rutting area had a tendency to move up.
- (3)
- A preliminary model to predict rutting in HMAC pavement with sloped and horizontally curved alignment was presented based on material and structural features of asphalt pavement in China today.
Acknowledgments
Author Contributions
Conflicts of Interest
References
- Drescher, A.; Kim, J.R.; Newcomb, D.E. Permanent deformation in asphalt concrete. J. Mater. Civ. Eng. 1993, 5, 112–128. [Google Scholar] [CrossRef]
- Li, C.; Li, L. Criteria for controlling rutting of asphalt concrete materials in sloped pavement. Constr. Build. Mater. 2012, 35, 330–339. [Google Scholar] [CrossRef]
- Xu, T.; Huang, X. Investigation into causes of in-place rutting in asphalt pavement. Constr. Build. Mater. 2012, 28, 525–530. [Google Scholar] [CrossRef]
- Katicha, S.W.; Apeagyei, A.K.; Flintsch, G.W.; Loulizi, A. Universal linear viscoelastic approximation property of fractional viscoelastic models with application to asphalt concrete. Mech. Time-Depend. Mater. 2014, 18, 555–571. [Google Scholar] [CrossRef]
- Hofko, B. Addressing the permanent deformation behavior of hot mix asphalt by triaxial cyclic compression testing with cyclic confining pressure. J. Traffic Transp. Eng. 2015, 2, 17–29. [Google Scholar] [CrossRef]
- Zhao, Y.; Wang, L.; Chen, P.; Zeng, W. Determination of surface viscoelastic response of asphalt pavement. J. Eng. Mech. 2015, 141, 1–8. [Google Scholar] [CrossRef]
- Blab, R.; Harvey, J. Modeling measured 3D tire contact stress in a viscoelstic FE pavement model. Int. J. Geomech. 2002, 2, 271–290. [Google Scholar] [CrossRef]
- Fang, H.; Haddock, J.E.; White, D.E.; Hand, A.J. On the characterization of flexible pavement rutting using creep model-based finite element analysis. Finite Elem. Anal. Des. 2004, 41, 49–73. [Google Scholar] [CrossRef]
- Abed, A. Evaluation of rutting depth in flexible pavements by using finite element analysis and local empirical model. Am. J. Eng. Appl. Sci. 2012, 5, 163–169. [Google Scholar]
- Wu, S.; Wang, J.; Chen, T. Stress analysis of asphalt pavement on large longitudinal slope. J. Wuhan Univ. Technol. Transp. Sci. Eng. Ed. 2006, 30, 969–972. (In Chinese) [Google Scholar]
- Pei, J.Z.; Chen, Y.; Chang, M.F. Mechanism of rutting formation in long and steep climbing sections of asphalt pavement. In Proceedings of the ICCTP 2009: Critical Issues in Transportation Systems Planning, Development, and Management, Harbin, China, 5–9 August 2009; ASCE: St. Louis, MO, USA, 2009. [Google Scholar]
- Hajj, E.Y.; Tannoury, G.; Sebaaly, P.E. Evaluation of rut resistant asphalt mixtures for intersection. Road Mater. Pavement Des. 2011, 12, 263–292. [Google Scholar] [CrossRef]
- Yang, X.; Guan, H.; Zhang, Q.; Zhou, L. The rutting resistant surface course combination for continuous uphill section of expressway. In Proceedings of the GeoShanghai 2010 International Conference: Paving Materials and Pavement Analysis, Shanghai, China, 3–5 June 2010; ASCE: St. Louis, MO, USA, 2010. [Google Scholar]
- Yang, J.; Li, W. Finite element analysis of asphalt pavement on long-steep longitudinal slope. J. Traffic Transp. Eng. 2010, 10, 20–31. (In Chinese) [Google Scholar]
- Li, L.; Huang, X.; Wang, L.; Li, C. Integrated experimental and numerical study on permanent deformation of asphalt pavement at intersections. J. Mater. Civ. Eng. 2013, 25, 907–912. [Google Scholar] [CrossRef]
- Zheng, M.; Han, L.; Wang, F.; Mi, H.; Li, Y.; He, L. Comparison and analysis on heat reflective coating for asphalt pavement based on cooling effect and anti-skid performance. Constr. Build. Mater. 2015, 93, 1197–1205. [Google Scholar] [CrossRef]
- Capitão, S.; Picado-Santos, L. Assessing permanent deformation resistance of high modulus asphalt mixtures. J. Transp. Eng. 2006, 132, 394–401. [Google Scholar] [CrossRef]
- Petho, L. High modulus asphalt mix (EME) for heavy duty applications and preliminary laboratory test results in Australia. In Proceedings of the AAPA 15th International Flexible Pavements Conference, Brisbane, Australia, 22–25 September 2013. [Google Scholar]
- Ministry of Transport (MOT). Technical Specification for Construction of Highway Asphalt Pavement; JTG F40-2004; Ministry of Transport: Beijing, China, 2004.
- Espersson, M. Effect in the high modulus asphalt concrete with the temperature. Constr. Build. Mater. 2014, 71, 638–643. [Google Scholar] [CrossRef]
- Ebrahimi, M.G.; Saleh, M.; Gonzalez, M. Interconversion between viscoelastic functions using the Tikhonov regularisation method and its comparison with approximate techniques. Road Mater. Pavement Des. 2014, 15, 820–840. [Google Scholar] [CrossRef]
- Saboo, N.; Kumar, P. A study on creep and recovery behavior of asphalt binders. Constr. Build. Mater. 2015, 96, 632–640. [Google Scholar] [CrossRef]
- Park, S.W.; Kim, Y.R. Fitting prony-series viscoelastic models with power-law presmoothing. J. Mater. Civ. Eng. 2001, 13, 26–32. [Google Scholar] [CrossRef]
- Chen, J.; Zhou, C.; Wang, Z. Data processing and viscoelastic computation for creep test of asphalt mixture. J. Southeast Univ. Nat. Sci. Ed. 2007, 37, 1091–1095. (In Chinese) [Google Scholar]
- Che, F. HMAC Performance Evaluation and Numerical Simulation for Special Section Pavement. Ph.D. Thesis, Chang’an University, Xi’an, China, 2011. [Google Scholar]
- Ministry of Transport (MOT). Design Specification for Highway Alignment; JTG D20-2006; Ministry of Transport: Beijing, China, 2006.
- Huang, F. Permanent Deformation Simulation and Rutting Depth Prediction of Asphalt Pavement. Master’s Thesis, Southeast University, Nanjing, China, 2006. [Google Scholar]
- Kong, H. Study on the Optimum Design of Asphalt Pavement Structure in Long Steep Longitudinal Slope Section Based on Rutting Resistance. Master’s Thesis, Chang’an University, Xi’an, China, 2012. [Google Scholar]
- Zhang, Q.; Zeng, S.; Wu, C. Orthogonal design method for optimizing roughly designed antenna. Int. J. Antennas Propag. 2014, 2014, 586360. [Google Scholar] [CrossRef]
- Otto, K.N.; Antonsson, E.K. Extensions to the Taguchi method of product design. J. Mech. Des. 1993, 115, 5–13. [Google Scholar] [CrossRef]
- Fraley, S.; Oom, M.; Terrien, B.; Zaleskwi, J. Design of Experiments via Taguchi Methods: Orthogonal Arrays. Available online: https://zh.scribd.com/document/133377816/Design-of-Experiments-via-Taguchi-Methods-Orthogonal-Arrays (accessed on 10 December 2016).
- Zheng, M.; Han, L.; Qiu, Z.; Li, H.; Ma, Q.; Che, F. Simulation of permanent deformation in high modulus asphalt pavement using Bailey-Norton creep law. J. Mater. Civ. Eng. 2016, 28, 1–11. [Google Scholar] [CrossRef]
- Praticò, F.G.; Casciano, A.; Tramontana, D. Pavement life cycle cost and asphalt binder quality: A theoretical and experimental investigation. J. Constr. Eng. Manag. 2011, 137, 99–107. [Google Scholar] [CrossRef]


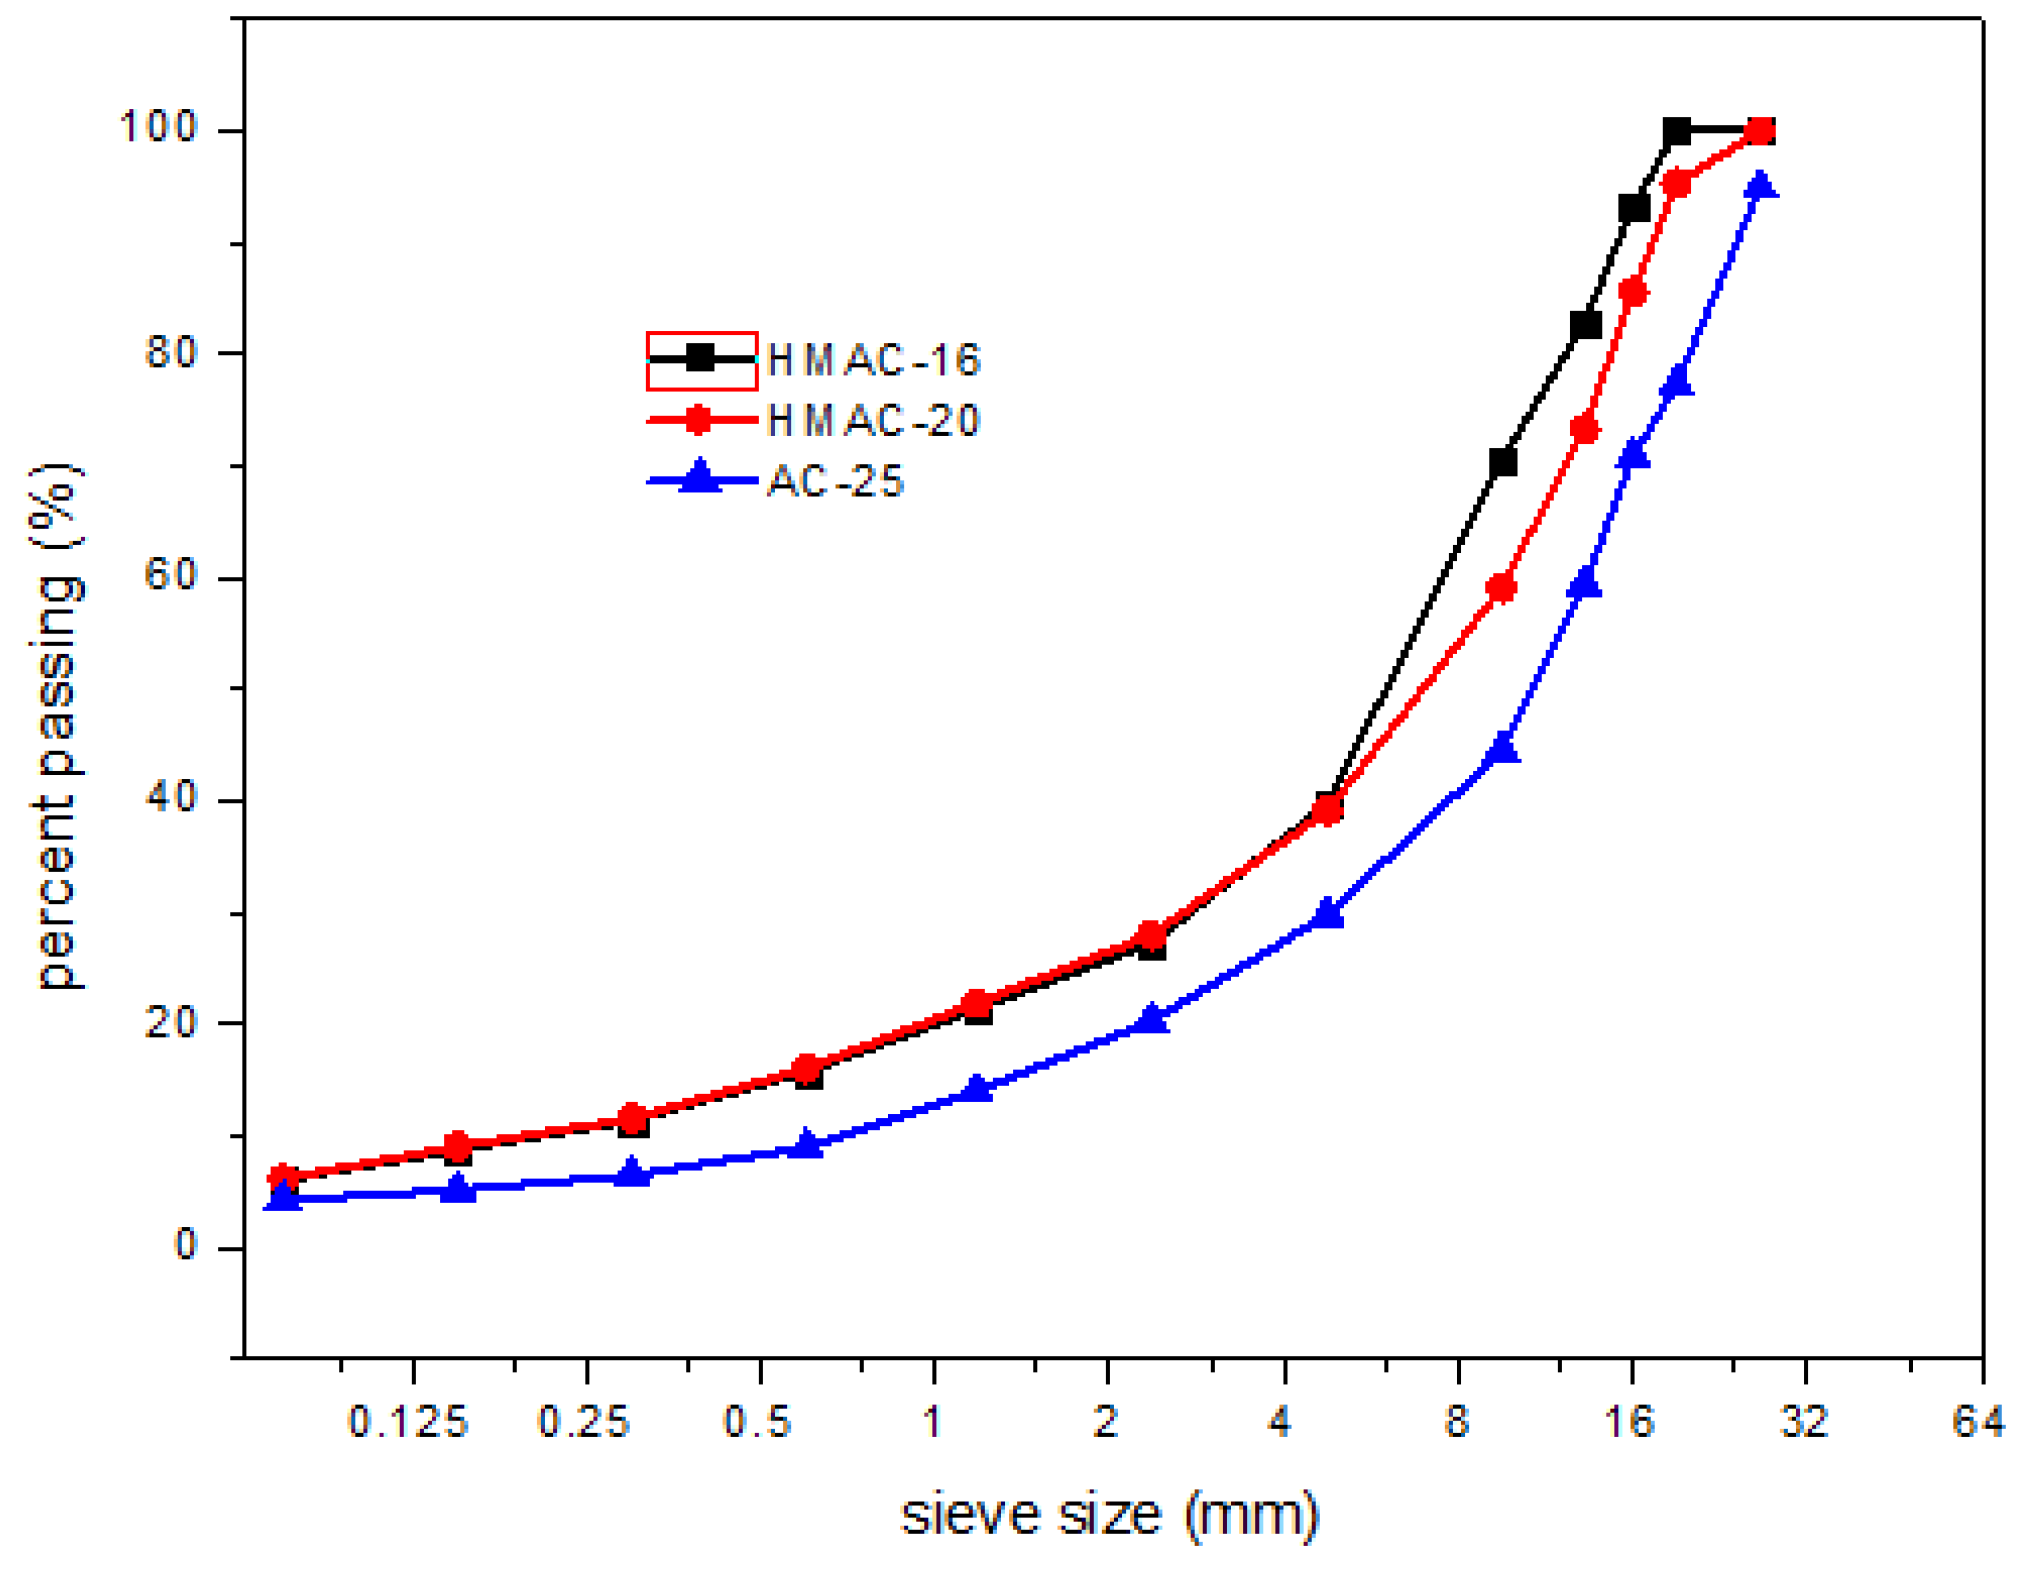
| Temp. | Mixture | Model Parameter | Prony Series Coefficient | ||||||
|---|---|---|---|---|---|---|---|---|---|
| E1 (MPa) | E2 (MPa) | η1 (GPa·s) | η2 (GPa·s) | g1 | g2 | τ1 | τ2 | ||
| 50 °C | AC-25 | 400 | 68 | 74 | 43 | 0.869 | 0.131 | 54.910 | 1706.277 |
| HMAC-16 | 700 | 166 | 190 | 57 | 0.932 | 0.068 | 63.290 | 1831.429 | |
| HMAC-20 | 800 | 132 | 220 | 68 | 0.908 | 0.092 | 59.229 | 2399.987 | |
| Design Speed (km/h) | 120 | 100 | 80 | 60 | 40 | 30 | 20 |
|---|---|---|---|---|---|---|---|
| Max slope I (%) | 3 | 4 | 5 | 6 | 7 | 8 | 9 |
| Slope angle A (°) | 1.718 | 2.291 | 2.862 | 3.434 | 4.004 | 4.574 | 5.143 |
| psinA (MPa) | 0.021 | 0.028 | 0.035 | 0.042 | 0.049 | 0.056 | 0.063 |
| pcosA (MPa) | 0.707 | 0.706 | 0.706 | 0.706 | 0.705 | 0.705 | 0.704 |
| fl = psinA + φpcosA (MPa) | 0.375 | 0.381 | 0.388 | 0.395 | 0.402 | 0.409 | 0.415 |
| Structural Layers | Thickness (cm) | Resilient Modulus (MPa) | Poisson Ratio | |
|---|---|---|---|---|
| Asphaltic layers | Top layer | 3–7 | using viscoelastic parameters | using viscoelastic parameters |
| Middle course | 4–8 | |||
| Binder course | 5–9 | |||
| Semi rigid base | 16–32 | 1400 | 0.25 | |
| Subbase | 20 | 600 | 0.25 | |
| Subgrade | 700 | 60 | 0.25 | |
| ESALs (104 times) | Accumulated Loading Time (s) | Recovery Time (s) |
|---|---|---|
| 200 | 5760 | 2400 |
| 700 | 20,160 | 8400 |
| 1300 | 37,440 | 15,600 |
| 2000 | 57,600 | 24,000 |
| 2800 | 80,640 | 33,600 |
| Factor | Level | ||||
|---|---|---|---|---|---|
| 1 | 2 | 3 | 4 | 5 | |
| P1-tire pressure (MPa) | 0.4 | 0.7 | 1.0 | 1.3 | 1.6 |
| P2-ESAL (104 times) | 200 | 700 | 1300 | 2000 | 2800 |
| P3-top layer thickness (cm) | 3 | 4 | 5 | 6 | 7 |
| P4-middle course thickness (cm) | 4 | 5 | 6 | 7 | 8 |
| P5-binder course thickness (cm) | 5 | 6 | 7 | 8 | 9 |
| P6-base thickness (cm) | 16 | 20 | 24 | 28 | 32 |
| Experiment No. | Factor | Deformation (mm) | |||||
|---|---|---|---|---|---|---|---|
| P1 | P2 | P3 | P4 | P5 | P6 | ||
| 1 | 1 | 1 | 1 | 1 | 1 | 1 | 1.308 |
| 2 | 1 | 2 | 2 | 2 | 2 | 2 | 3.894 |
| 3 | 1 | 3 | 3 | 3 | 3 | 3 | 6.350 |
| 4 | 1 | 4 | 4 | 4 | 4 | 4 | 7.136 |
| 5 | 1 | 5 | 5 | 5 | 5 | 5 | 10.643 |
| 6 | 2 | 1 | 2 | 3 | 4 | 5 | 2.603 |
| 7 | 2 | 2 | 3 | 4 | 5 | 1 | 6.467 |
| 8 | 2 | 3 | 4 | 5 | 1 | 2 | 10.033 |
| 9 | 2 | 4 | 5 | 1 | 2 | 3 | 13.476 |
| 10 | 2 | 5 | 1 | 2 | 3 | 4 | 28.690 |
| 11 | 3 | 1 | 3 | 5 | 2 | 4 | 3.550 |
| 12 | 3 | 2 | 4 | 1 | 3 | 5 | 10.128 |
| 13 | 3 | 3 | 5 | 2 | 4 | 1 | 13.940 |
| 14 | 3 | 4 | 1 | 3 | 5 | 2 | 24.299 |
| 15 | 3 | 5 | 2 | 4 | 1 | 3 | 29.557 |
| 16 | 4 | 1 | 4 | 2 | 5 | 3 | 5.095 |
| 17 | 4 | 2 | 5 | 3 | 1 | 4 | 8.055 |
| 18 | 4 | 3 | 1 | 4 | 2 | 5 | 19.172 |
| 19 | 4 | 4 | 2 | 5 | 3 | 1 | 25.092 |
| 20 | 4 | 5 | 3 | 1 | 4 | 2 | 49.035 |
| 21 | 5 | 1 | 5 | 4 | 3 | 2 | 7.977 |
| 22 | 5 | 2 | 1 | 5 | 4 | 3 | 14.072 |
| 23 | 5 | 3 | 2 | 1 | 5 | 4 | 37.823 |
| 24 | 5 | 4 | 3 | 2 | 1 | 5 | 39.232 |
| 25 | 5 | 5 | 4 | 3 | 2 | 1 | 46.460 |
| Kj1 | 29.331 | 20.533 | 87.541 | 111.770 | 88.185 | 93.267 | - |
| Kj2 | 61.269 | 42.616 | 98.969 | 90.851 | 86.552 | 95.238 | - |
| Kj3 | 81.474 | 87.318 | 104.634 | 87.767 | 78.237 | 68.550 | - |
| Kj4 | 106.449 | 109.235 | 78.852 | 70.309 | 86.786 | 85.254 | - |
| Kj5 | 145.564 | 164.385 | 54.091 | 63.390 | 84.327 | 81.778 | - |
| 5.866 | 4.107 | 17.508 | 22.354 | 17.637 | 18.653 | - | |
| 12.254 | 8.523 | 19.794 | 18.170 | 17.310 | 19.048 | - | |
| 16.295 | 17.464 | 20.927 | 17.553 | 15.647 | 13.710 | - | |
| 21.290 | 21.847 | 15.770 | 14.062 | 17.357 | 17.051 | - | |
| 29.113 | 32.877 | 10.818 | 12.678 | 16.865 | 16.356 | - | |
| Range | 23.247 | 28.770 | 10.109 | 9.676 | 1.990 | 5.338 | - |
© 2017 by the authors. Licensee MDPI, Basel, Switzerland. This article is an open access article distributed under the terms and conditions of the Creative Commons Attribution (CC BY) license (http://creativecommons.org/licenses/by/4.0/).
Share and Cite
Zheng, M.; Han, L.; Wang, C.; Xu, Z.; Li, H.; Ma, Q. Simulation of Permanent Deformation in High-Modulus Asphalt Pavement with Sloped and Horizontally Curved Alignment. Appl. Sci. 2017, 7, 331. https://doi.org/10.3390/app7040331
Zheng M, Han L, Wang C, Xu Z, Li H, Ma Q. Simulation of Permanent Deformation in High-Modulus Asphalt Pavement with Sloped and Horizontally Curved Alignment. Applied Sciences. 2017; 7(4):331. https://doi.org/10.3390/app7040331
Chicago/Turabian StyleZheng, Mulian, Lili Han, Chongtao Wang, Zhanlei Xu, Hongyin Li, and Qinglei Ma. 2017. "Simulation of Permanent Deformation in High-Modulus Asphalt Pavement with Sloped and Horizontally Curved Alignment" Applied Sciences 7, no. 4: 331. https://doi.org/10.3390/app7040331
APA StyleZheng, M., Han, L., Wang, C., Xu, Z., Li, H., & Ma, Q. (2017). Simulation of Permanent Deformation in High-Modulus Asphalt Pavement with Sloped and Horizontally Curved Alignment. Applied Sciences, 7(4), 331. https://doi.org/10.3390/app7040331