


Abstract
In order to study the base pounding effects of base-isolated structure under earthquake excitations, a base pounding theoretical model with a linear spring-gap element is proposed. A finite element analysis program is used in numerical simulation of seismic response of based-isolated structure when considering base pounding. The effects of the structure pounding against adjacent structures are studied, and the seismic response of a base-isolated structure with lead-rubber bearing and a base-isolated structure with friction pendulum isolation bearing are analyzed. The results indicate that: the model offers much flexibility to analyze base pounding effects. There is a most clearance unfavorable width between adjacent structures. The structural response increases with pounding. Significant amplification of the story shear-force, velocity, and acceleration were observed. Increasing the number of stories in a building leads to an initial increase in impact force, followed by a decrease in such force. As a result, it is necessary to consider base pounding in the seismic design of base-isolated structures.
1. Introduction
As one of the most destructive natural disasters, an earthquake can cause heavy casualties, and great damage to buildings, bridges, and roads. One of the most devastating earthquakes in recent years is the 2008 Sichuan earthquake, which killed more than 69,000 people, left more than 18,000 missing, and caused a direct economic loss of 845.1 billion yuan. Earthquakes can cause great damage. Therefore, the study and application of seismic engineering are of great significance. With the development of science and technology, many meaningful anti-seismic methods, including energy dissipation, vibration control, and based isolation were developed [1,2,3,4,5]. Since the base isolated system was first applied in the 1970s, a lot of relevant research has been conducted [6,7,8,9,10]. Energy dissipation devices [11,12,13], which can dissipate seismic energy and efficiently reduce structural damages, are set between the foundation and the superstructure. Lead-rubber bearing and friction pendulum isolation bearing are usually used as energy dissipation device for base isolation. However base-isolated structures usually experience large horizontal displacements during strong earthquakes due to their weak horizontal stiffness. Hence, there is a great possibility of the structure pounding against adjacent structures [14,15].
Studies on base pounding effects during a strong earthquake are rare. The earliest studies of the width of clearance and foundation stiffness effects were was performed by Tsai [16] and Malhotra [17]. Other teams [18,19,20,21,22,23,24,25,26] conducted extensive research on response of the structures pounding against adjacent structures, and on how to reduce seismic energy through theoretical studies and numerical simulations. Mavronicola and colleagues [27] used a smooth bilinear (Bouc-Wen) model to simulate the seismic isolation system, while the Kelvin-Voigt [28] impact model and other models were adopted in structural response analysis under strong excitations. The accuracy and flexibility of these impact models were discussed. A typical four-story fixed-base RC building that was subjected to seismic pounding was analyzed in Pant and Wijeyewichrema [29]. Three-dimensional finite element analyses were conducted considering material and geometric nonlinearities. Fan et al. [30] considered pounding responses with different system parameters, such as impact model, size of gap, and natural vibration period. Many factors were considered in Ye’s study [31], including superstructure’s stiffness, impaction stiffness, the mechanical properties of the bearing, and the different width of clearance.
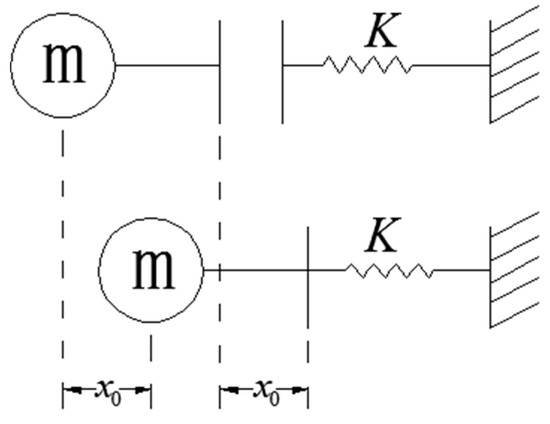
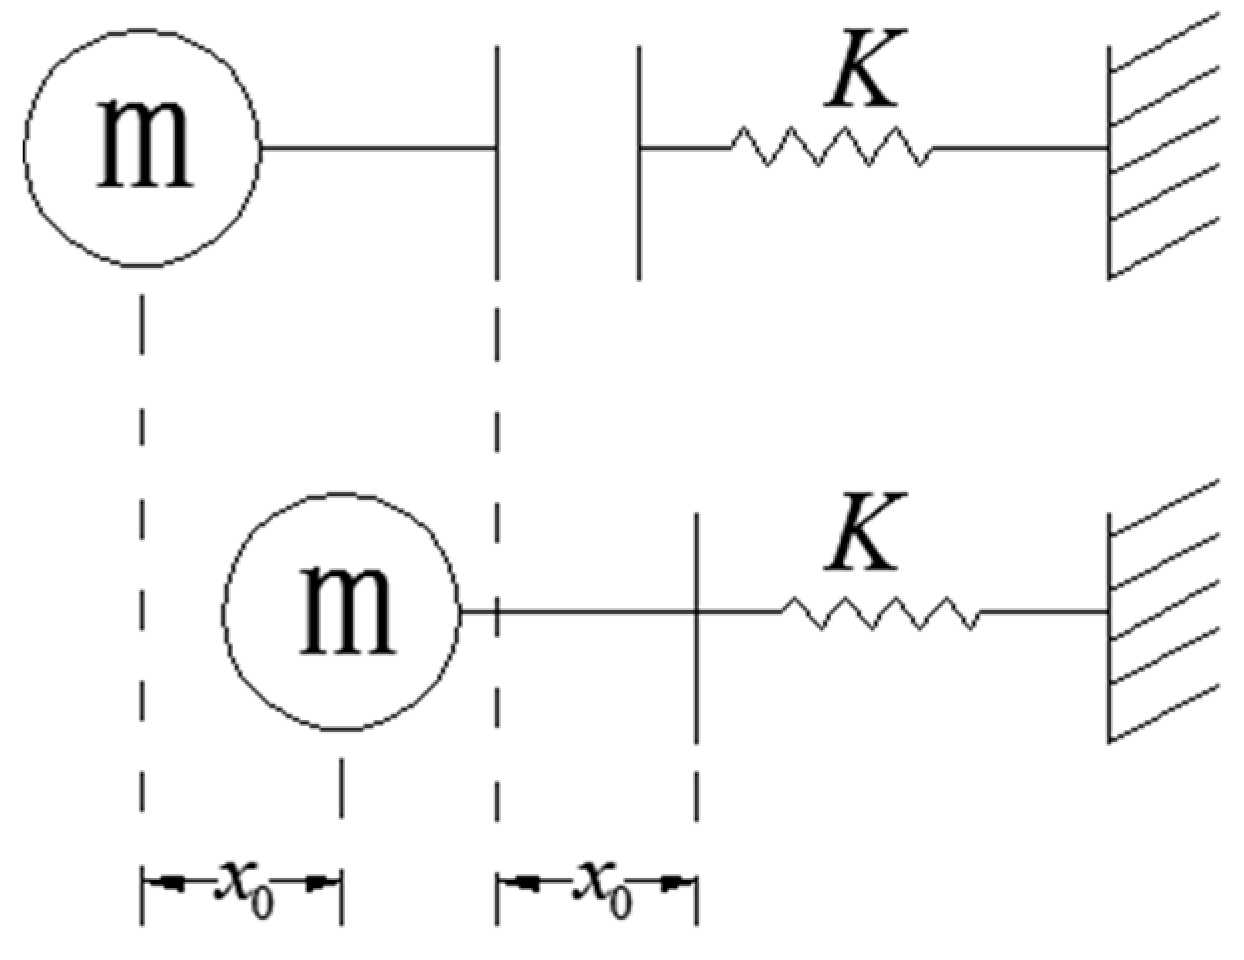
On the basis of previous research work, a new base pounding theoretical model with linear spring-gap element is proposed. Assuming that the superstructure is linear-elastic, the colliding unit presented in Figure 1 adopts the linear spring with gap, and the collision analysis of the base isolation structure under strong earthquakes is conducted. Seismic response analysis of base-isolated structure considering base pounding by this model is discussed in this paper. In order to compare the difference in response between the base-isolated structure with lead-rubber bearing and the base-isolated structure with friction pendulum isolation bearing, two types of finite element models are used in analysis. Finite element models with different gap have were used to determine the maximum node acceleration in top story and the most unfavorable width of clearance between adjacent structures. The values of impact force, story shear-force, displacement, velocity and acceleration are obtained. Finally, such values are compared to previous research to verify its rationality.
Figure 1.
Linear spring-gap element.
2. Models and Equations of Motion
2.1. Base Pounding Model
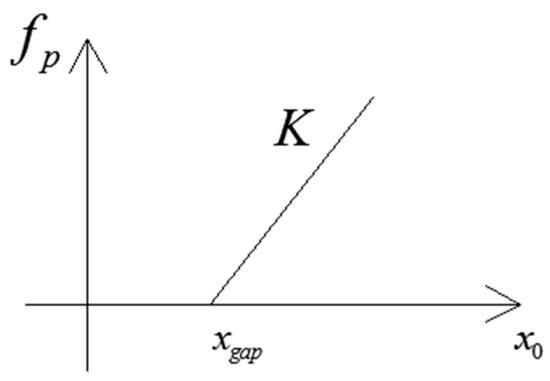
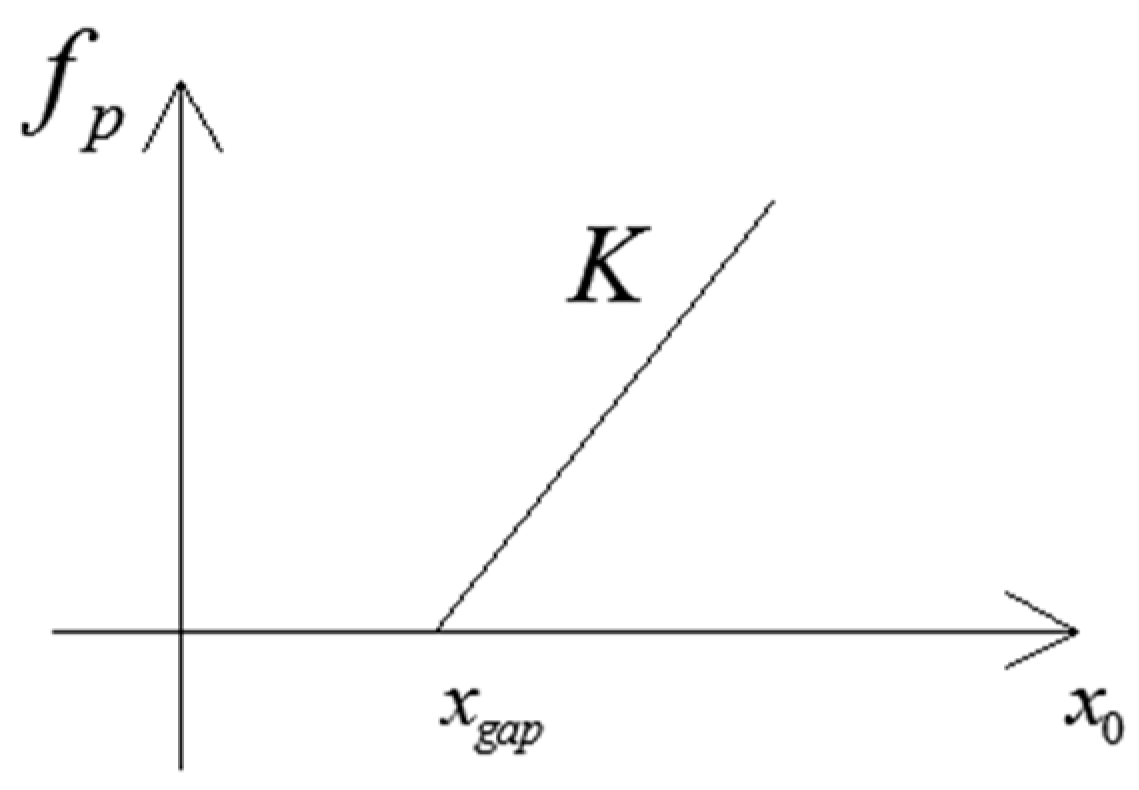
There are two methods to investigate impact behavior, the classical dynamics method and the contact element method. The classical one cannot reflect the change of impact force, deformation and collision duration and other elements. Furthermore, it is difficult to implement in finite element analysis. Therefore, it has limited scope of use [32,33,34]. The contact element method is easy to implement in software with high precision. Consequently, the contact element method is adopted in this paper. Research conducted by Fan et al. [30] shows that linear viscoelastic model can provide enough accuracy in engineering. Thus, a linear spring-gap element was used in this base pounding theoretical model. Figure 1 presents the linear spring-gap element. Figure 2 and Equation (1) present its force-displacement relation.
Figure 2.
Force-displacement curve.
2.2. Equations of Motion
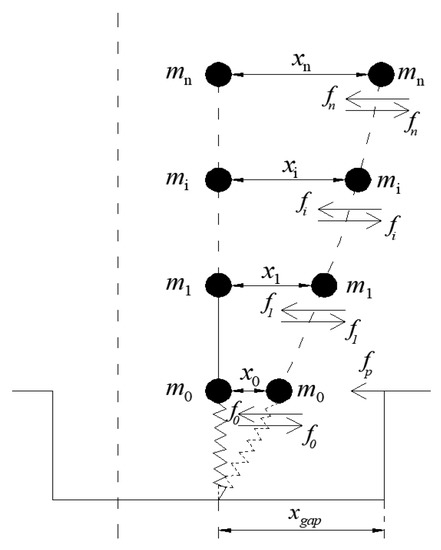
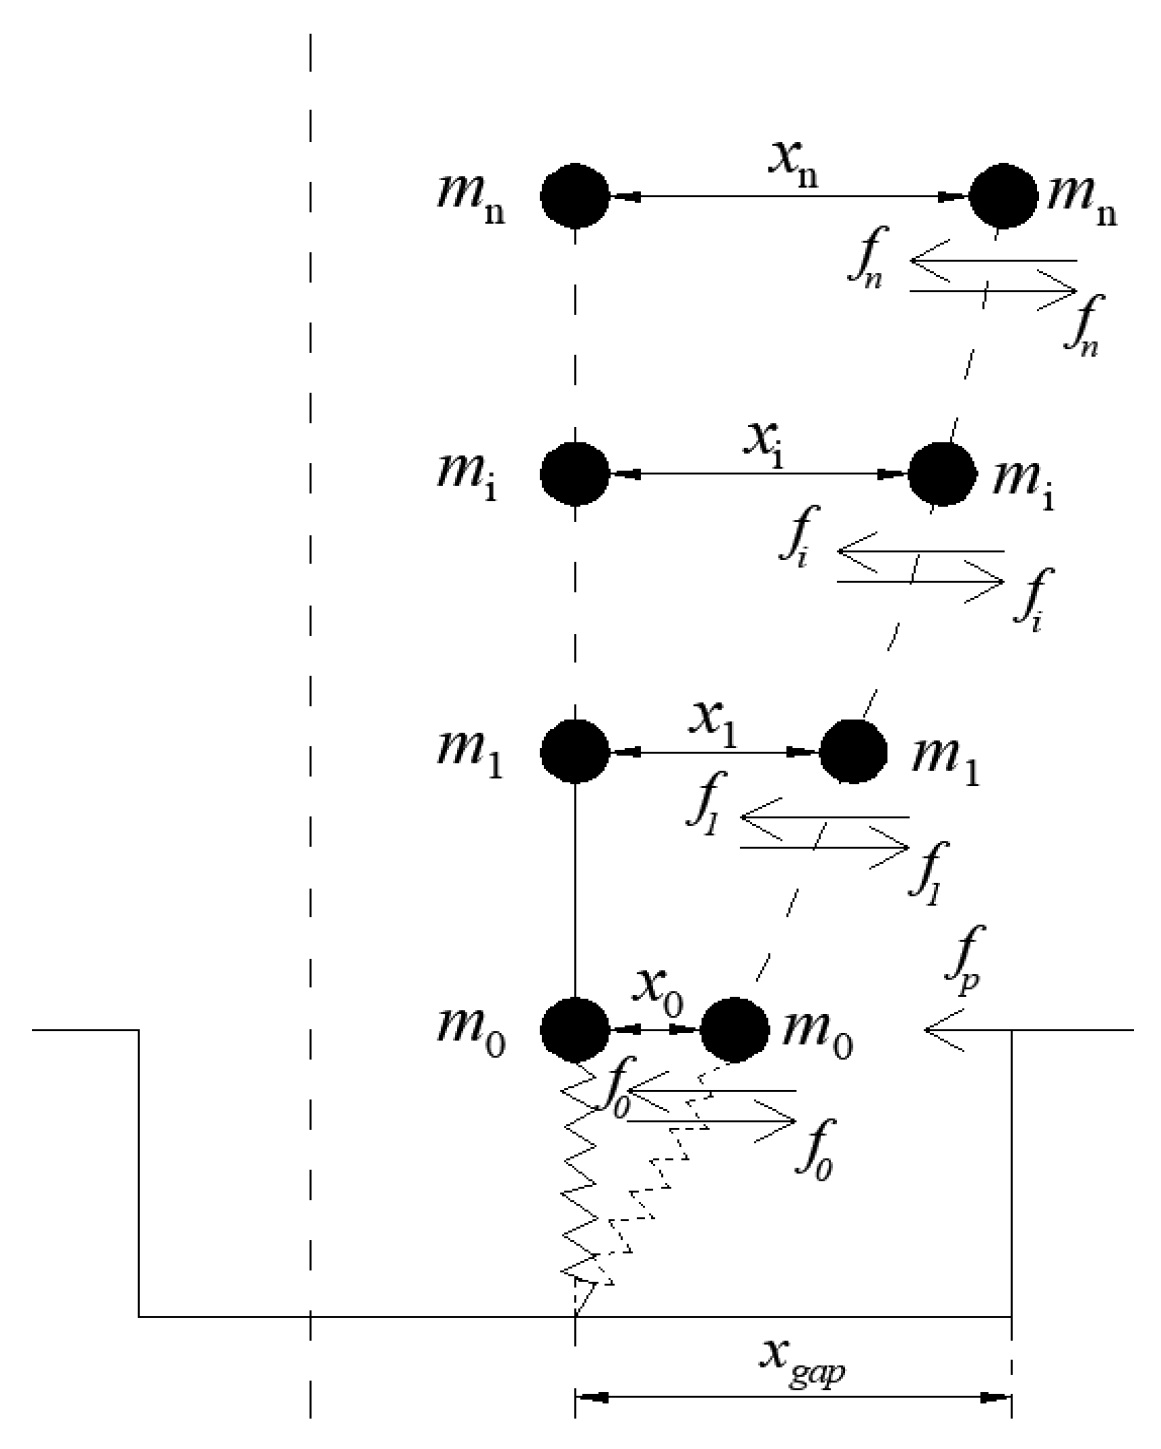
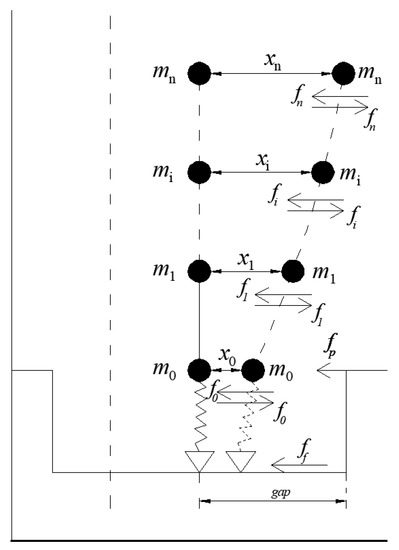
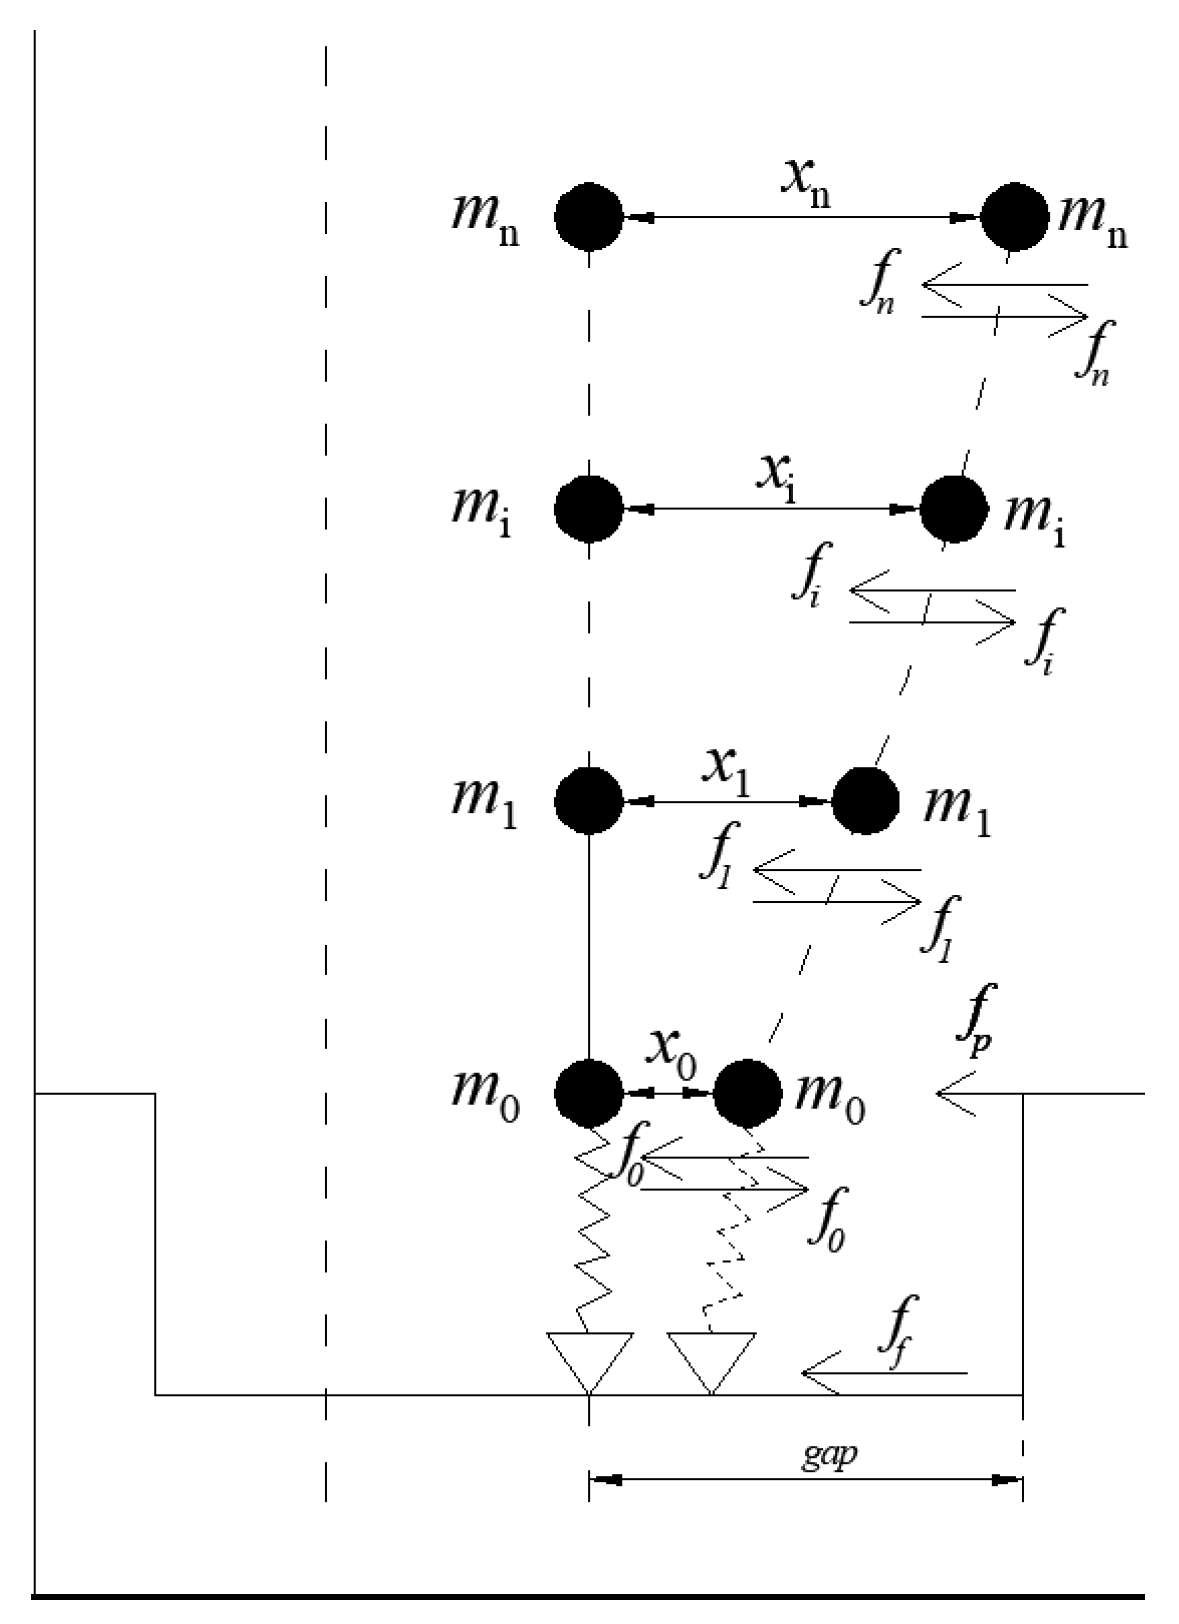
Assuming that the stiffness of the floor slabs in-plane is infinite and the masses of the floor slabs are lumped at the floor levels, base pounding models were built with linear spring-gap elements. Figure 3 and Figure 4 present the models of a base-isolated structure with lead-rubber bearing and with friction pendulum isolation bearing, respectively. The equations of motion of the superstructure are expressed in Equation (2).
where are the relative velocities and accelerations of floor i, respectively, is the earthquake ground motion acceleration, and are the mass and damping of floor i, respectively. The restoring force of floor i is expressed by the following equation:
where is the stiffness of floor i, and is the relative displacement of floor i.
Figure 3.
Model of the base-isolated structure with lead-rubber bearing.
Figure 4.
Model of the base-isolated structure with friction pendulum isolation bearing.
Rayleigh Damping is calculated by the following equation:
where , are calculated by Equation (5) if the damping ratios and associated with specific frequencies , are known.
Equations of motion for the isolation layer (the base-isolated structure with lead-rubber bearing) are given as,
where is the mass of isolation layer, are relative the velocities and accelerations of the isolation layer, respectively, is the damping coefficient of the isolation layer, and are the restoring and the impact force the of isolation layer, respectively.
Equations for the restoring force have been built using the Bouc-wen model:
where is the isolation layer’s initial stiffness, is the ratio of the yield stiffness to the pre-yield stiffness of bearing, is the displacement of the isolation layer, is the hysteretic displacement of the isolation system, and is the yield displacement.
The first order differential equation of the hysteretic displacement is given as,
where , , , and are related to the amplitude of hysteretic displacement, initial stiffness, and hysteretic shape.
Equations of motion of the isolation layer (the base-isolated structure with friction pendulum isolation bearing) is given as,
Restoring force can be calculated by Equation (10).
where is the stiffness of bearing, is the displacement of isolation layer.
Friction can be expressed as,
where is the coefficient of sliding friction of bearing, N is the weight of superstructure (), is a parameter related to hysteresis characteristics, and is expressed in Equation (12).
In Equation (12), Y is the elastic shear deformation of bearing before sliding, is the ground velocity of bearing, and , , , and are related to amplitude of hysteretic displacement, initial stiffness, and hysteretic shape.
3. Engineering Case and Numerical Simulation
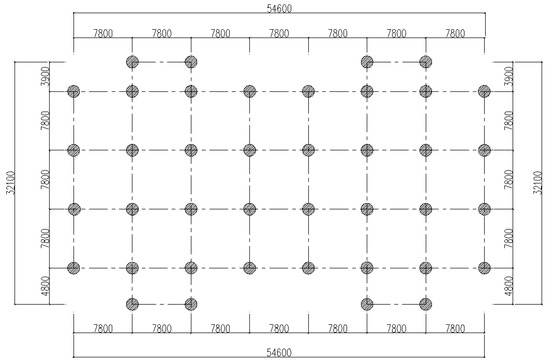
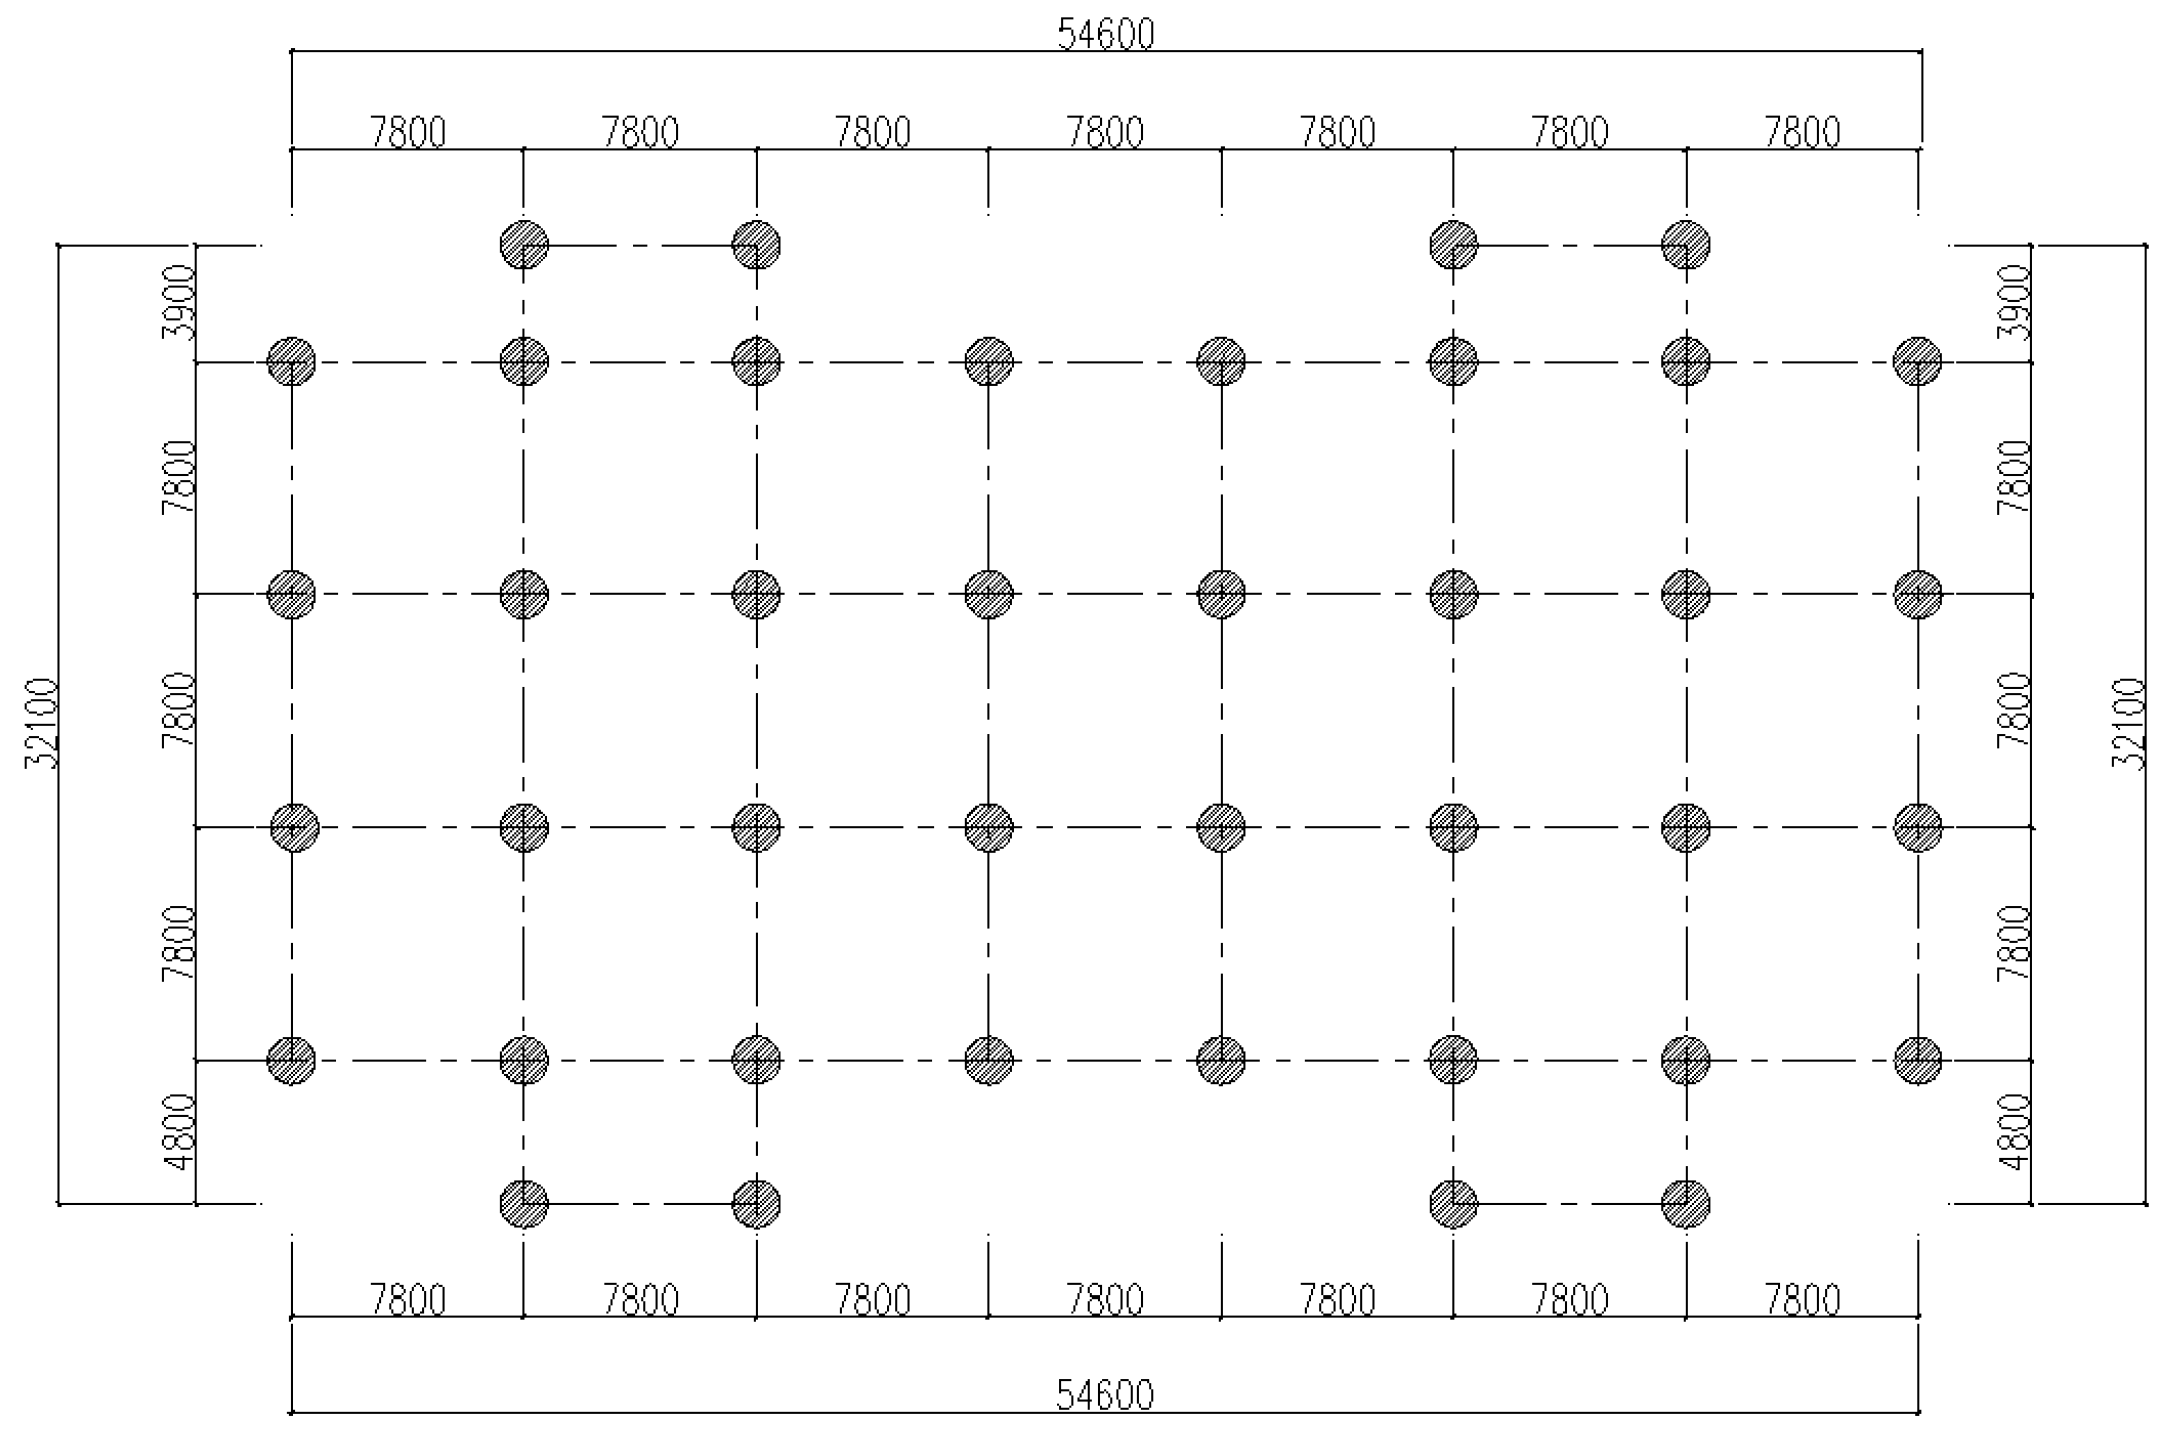
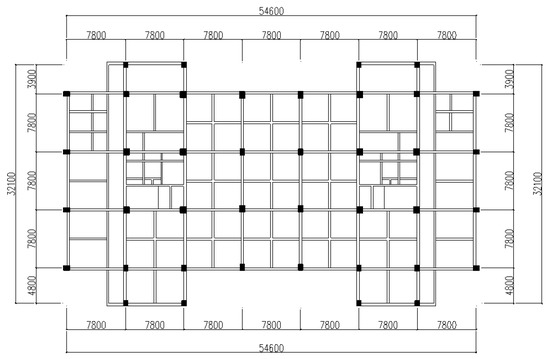
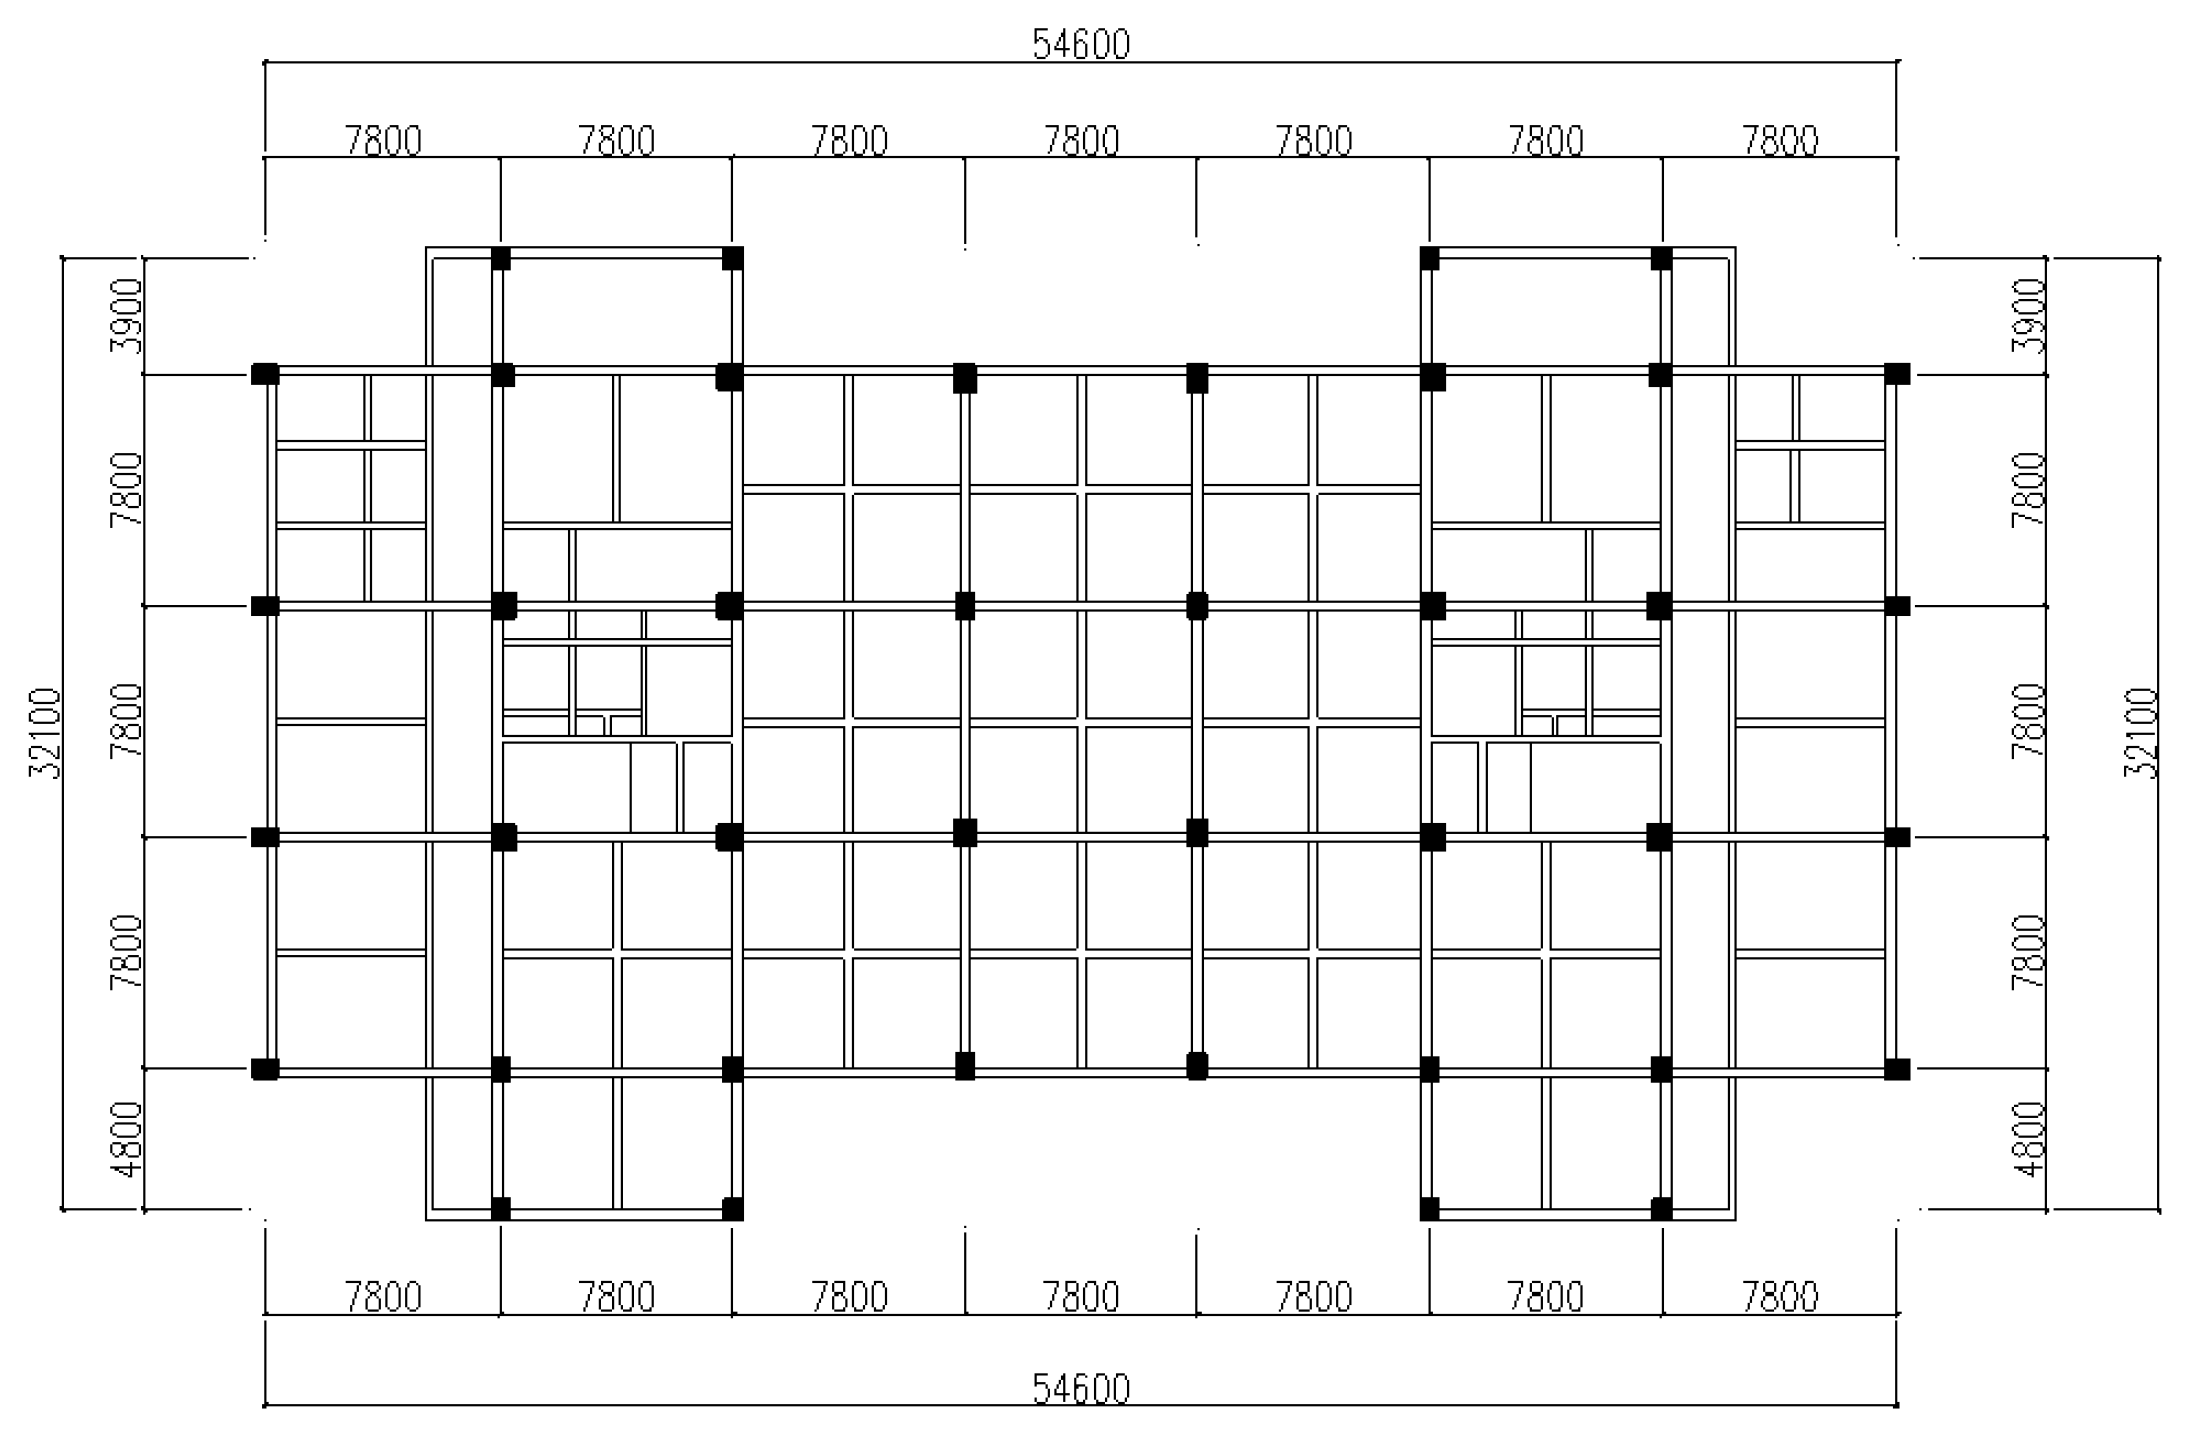
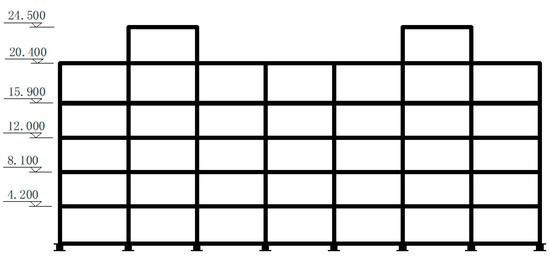
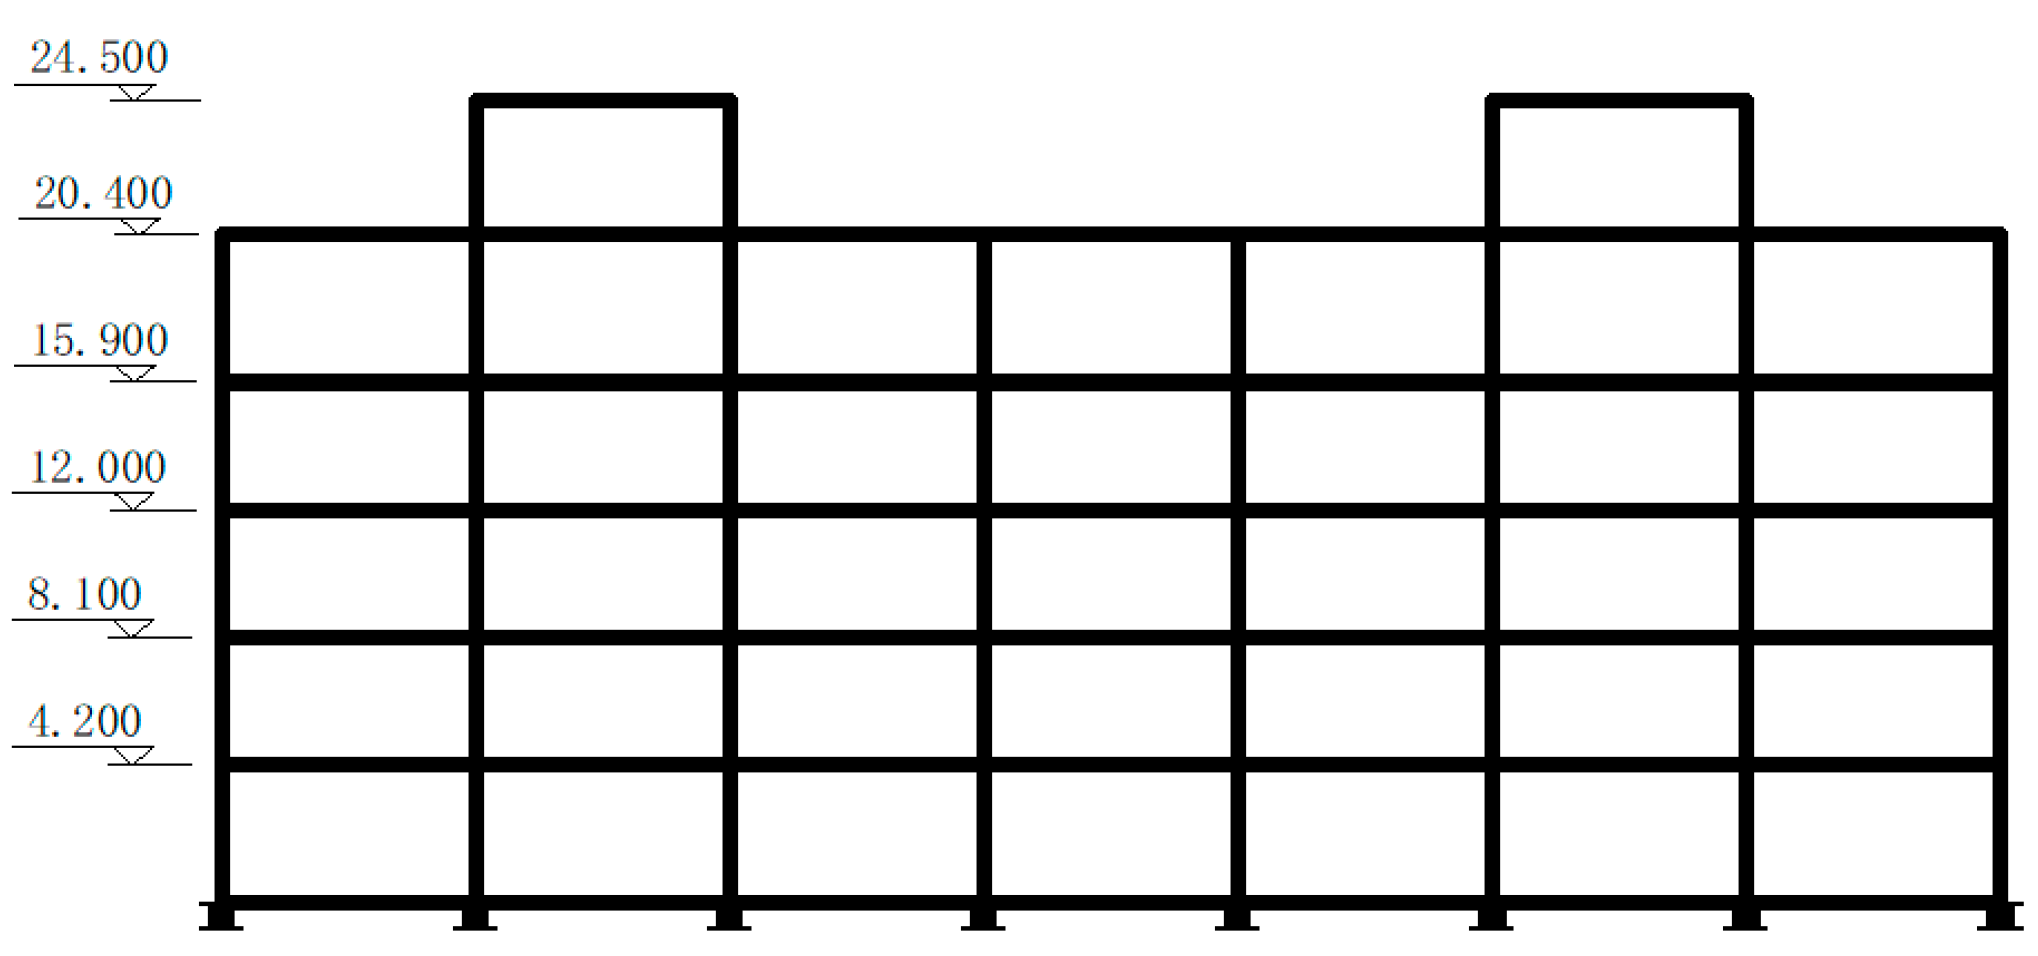
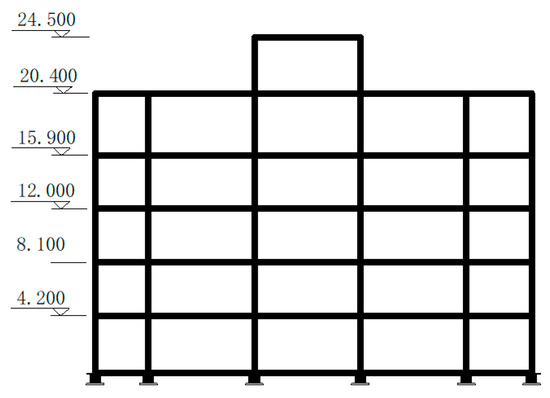
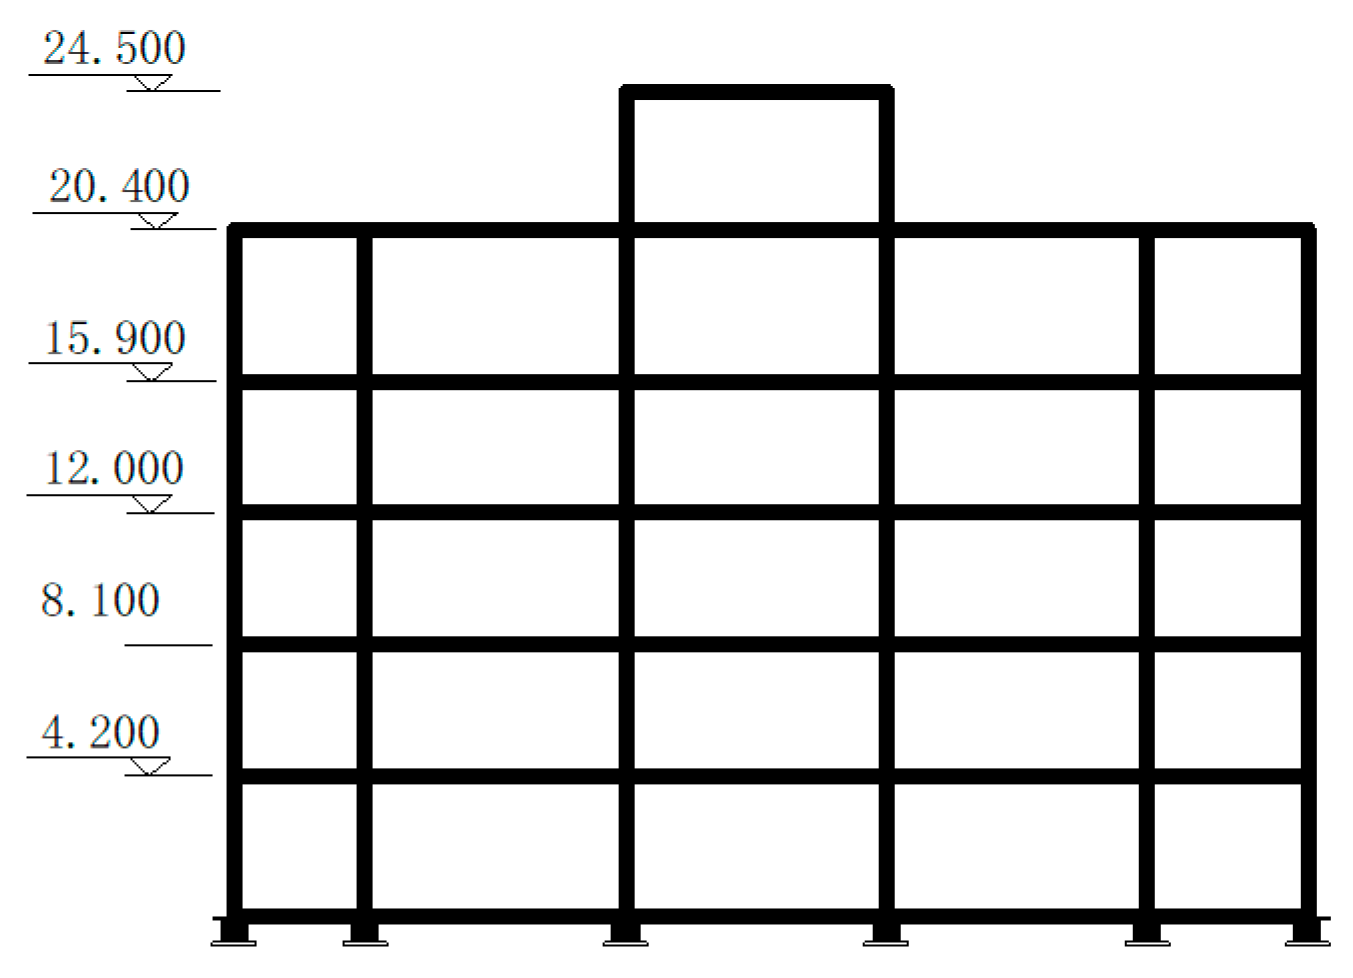
As mentioned previously, two finite element models were developed. Finite element model A is modeled after a building in Tibetan Qiang Autonomous Prefecture of Ngawa, Sichuan Province, China. The structure of the building is the base-isolated frame structure with lead-rubber bearing. Model A consists of 40 lead-rubber bearings of the same type. The mass of the isolation layer is 2490.55 tons. The equivalent horizontal stiffness is 4.418 × 10⁵ N/mm. The damping ratio of the isolation layer is 0.23. Figure 5 presents the arrangement of the bearings. Figure 6 presents the arrangement of the beams and pillars. Figure 7 and Figure 8 present the structure’s front elevation and side elevations, respectively. Table 1 presents the parameters of each story.
Figure 5.
Arrangement of the bearings (mm).
Figure 6.
Arrangement of the beams and pillars (mm).
Figure 7.
Front elevation of building (m).
Figure 8.
Side elevation of building (m).
Table 1.
Parameters of story.
Finite element model B is modeled after model A. The superstructure of model B is the same as that of model A. However, the lead-rubber bearings in model A are replaced with friction pendulum isolation bearings. For model B, the mass of the isolation layer is 2490.55 tons. The equivalent horizontal stiffness is 1.6 × 10⁵ N/mm, and the damping ratio of the isolation layer is 0.
3.1. Most Unfavorable Clearance Width
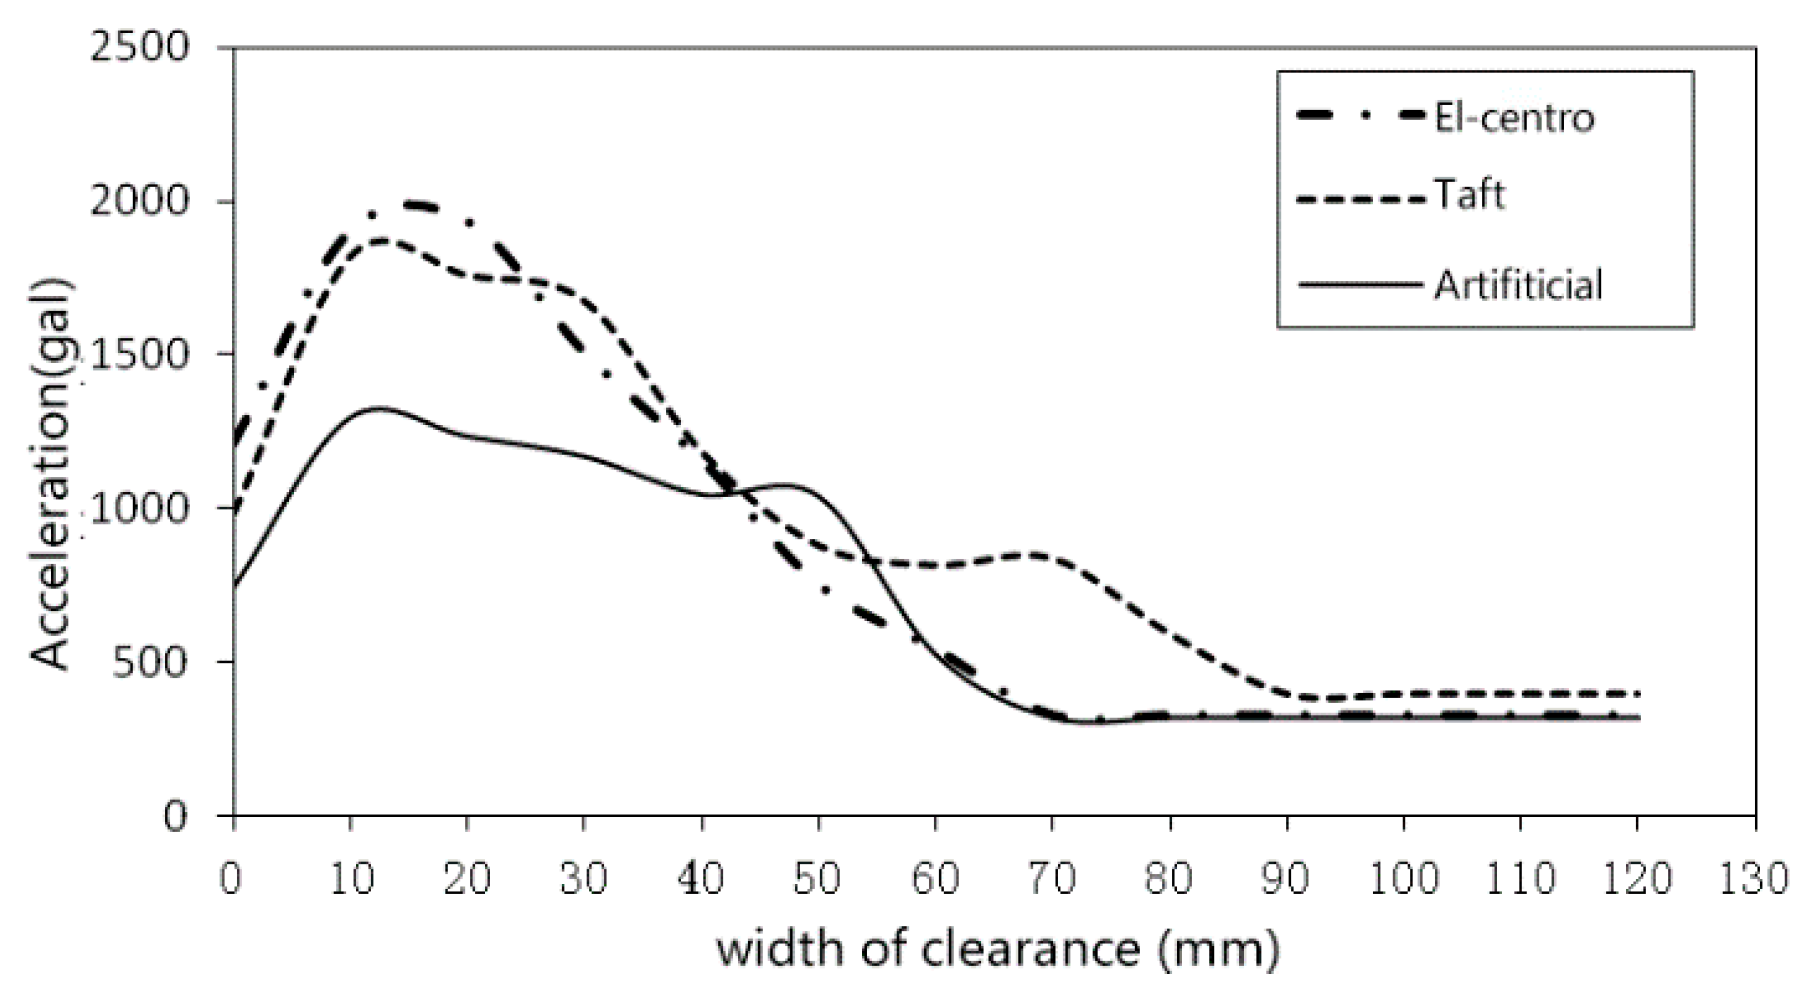
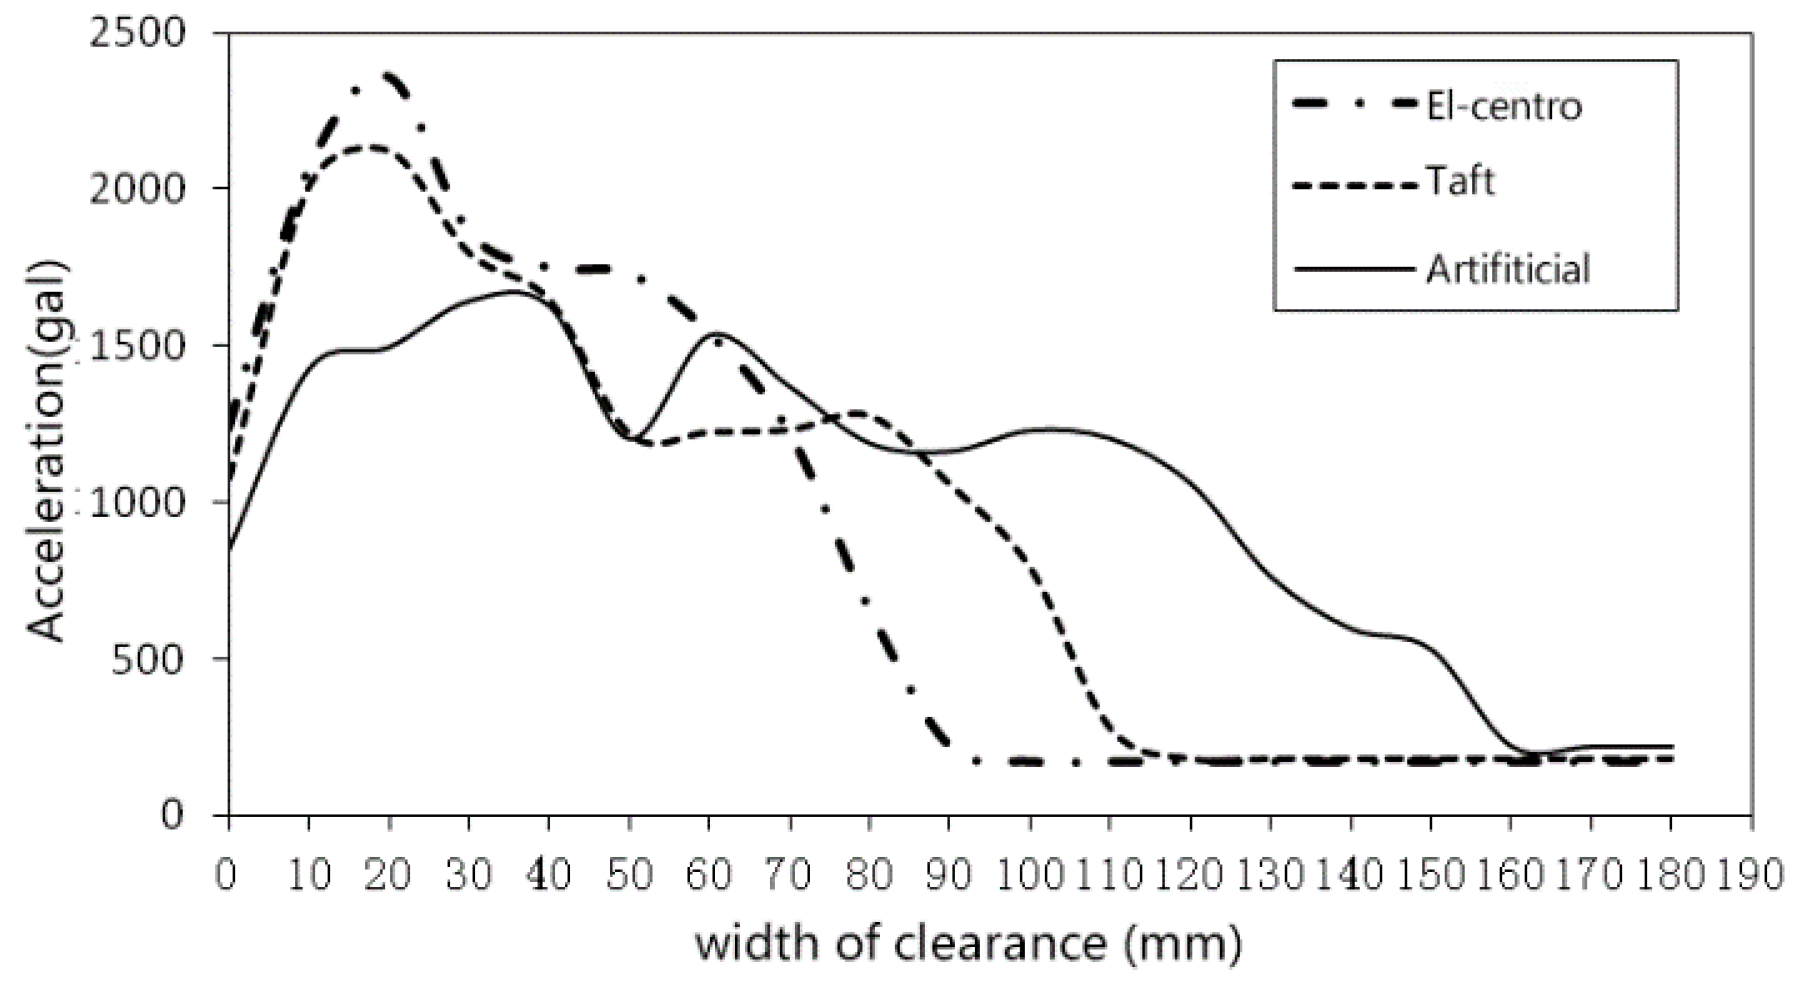
In order to study the pounding effects with different clearance width, a parametric study was conducted. Two sets of strong earthquake records (El Centro (NS) and Taft (EW)), and a set of artificial acceleration time-history curves are used as excitations in the simulations. According to the Code for Seismic Design of Buildings of China (built on Site-class four, intensity 8) [35], 400 gal is adopted as the peak ground acceleration for rare earthquakes. In order to analyze the tendency of absolute acceleration with different clearance widths, the acceleration value (node 858) in the top story is extracted for both models A and B.
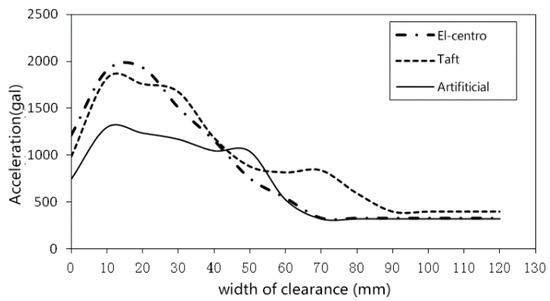
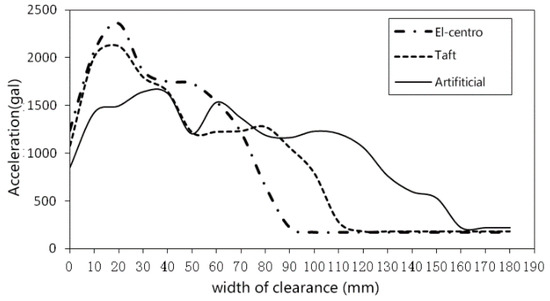
In Figure 9 and Figure 10, the tendencies of absolute acceleration are similar while varying the different clearance widths. First, the maximum value of acceleration increased with an increasing clearance width, and then it decreased with continued increase in clearance width, and finally leveled off. When the clearance width was approximately 20 mm, the value of acceleration was the highest.
Figure 9.
Maximum acceleration value changes with clearance width in model A.
Figure 10.
Maximum acceleration value changes with clearance width in model B.
3.2. Effects of Pounding
The effects of the structure pounding against adjacent structures are studied from the perspective of time-history of impact force, story shear-force, velocity, and acceleration. In order to obtain the maximum response of the structure, the clearance width for both models A and B are set to 20 mm.
3.2.1. Impact Force
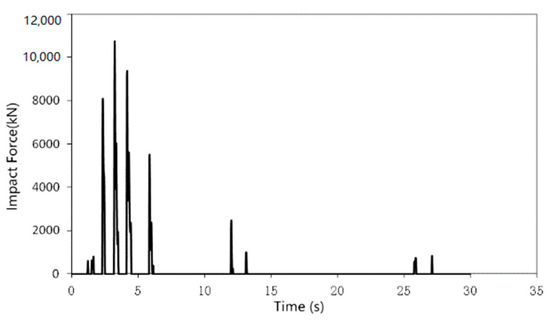
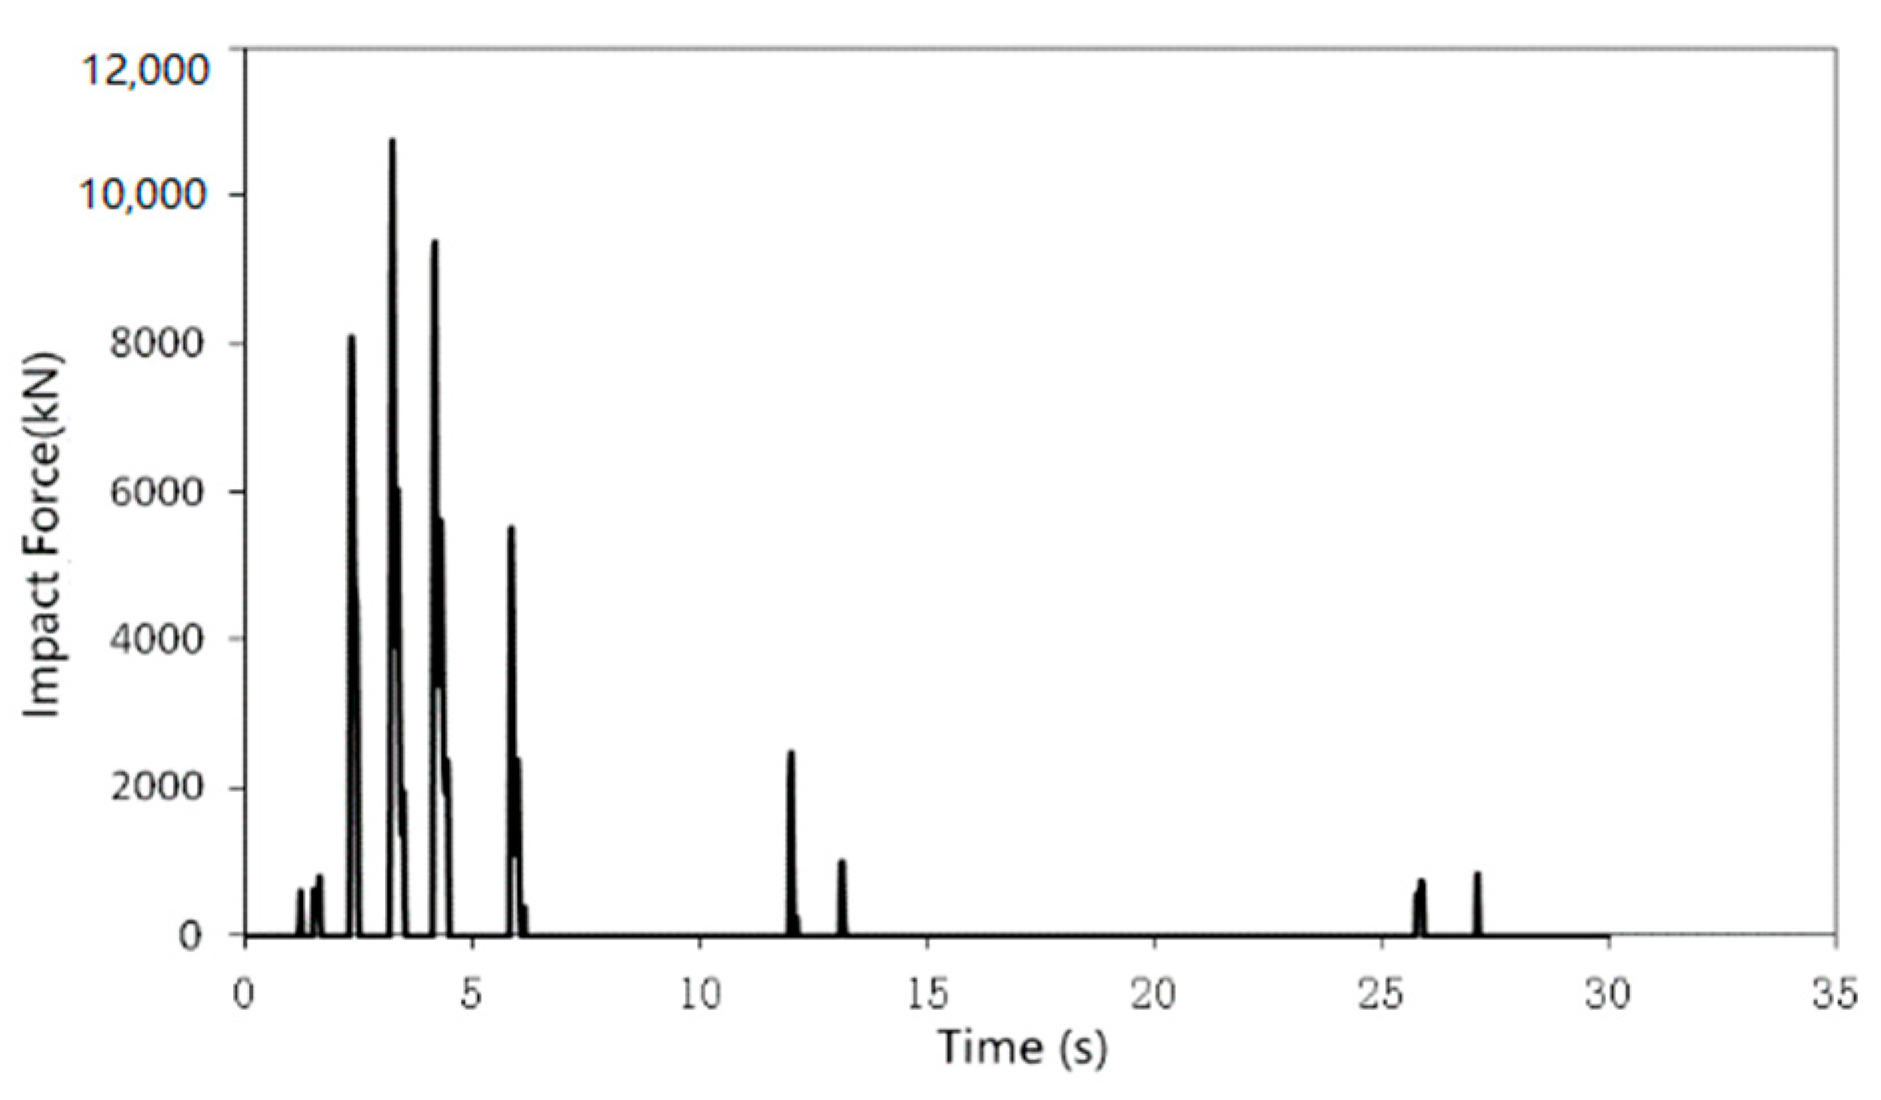
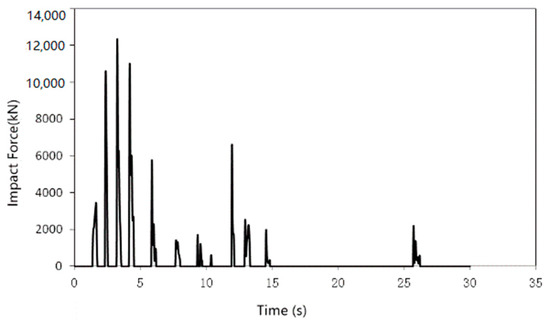
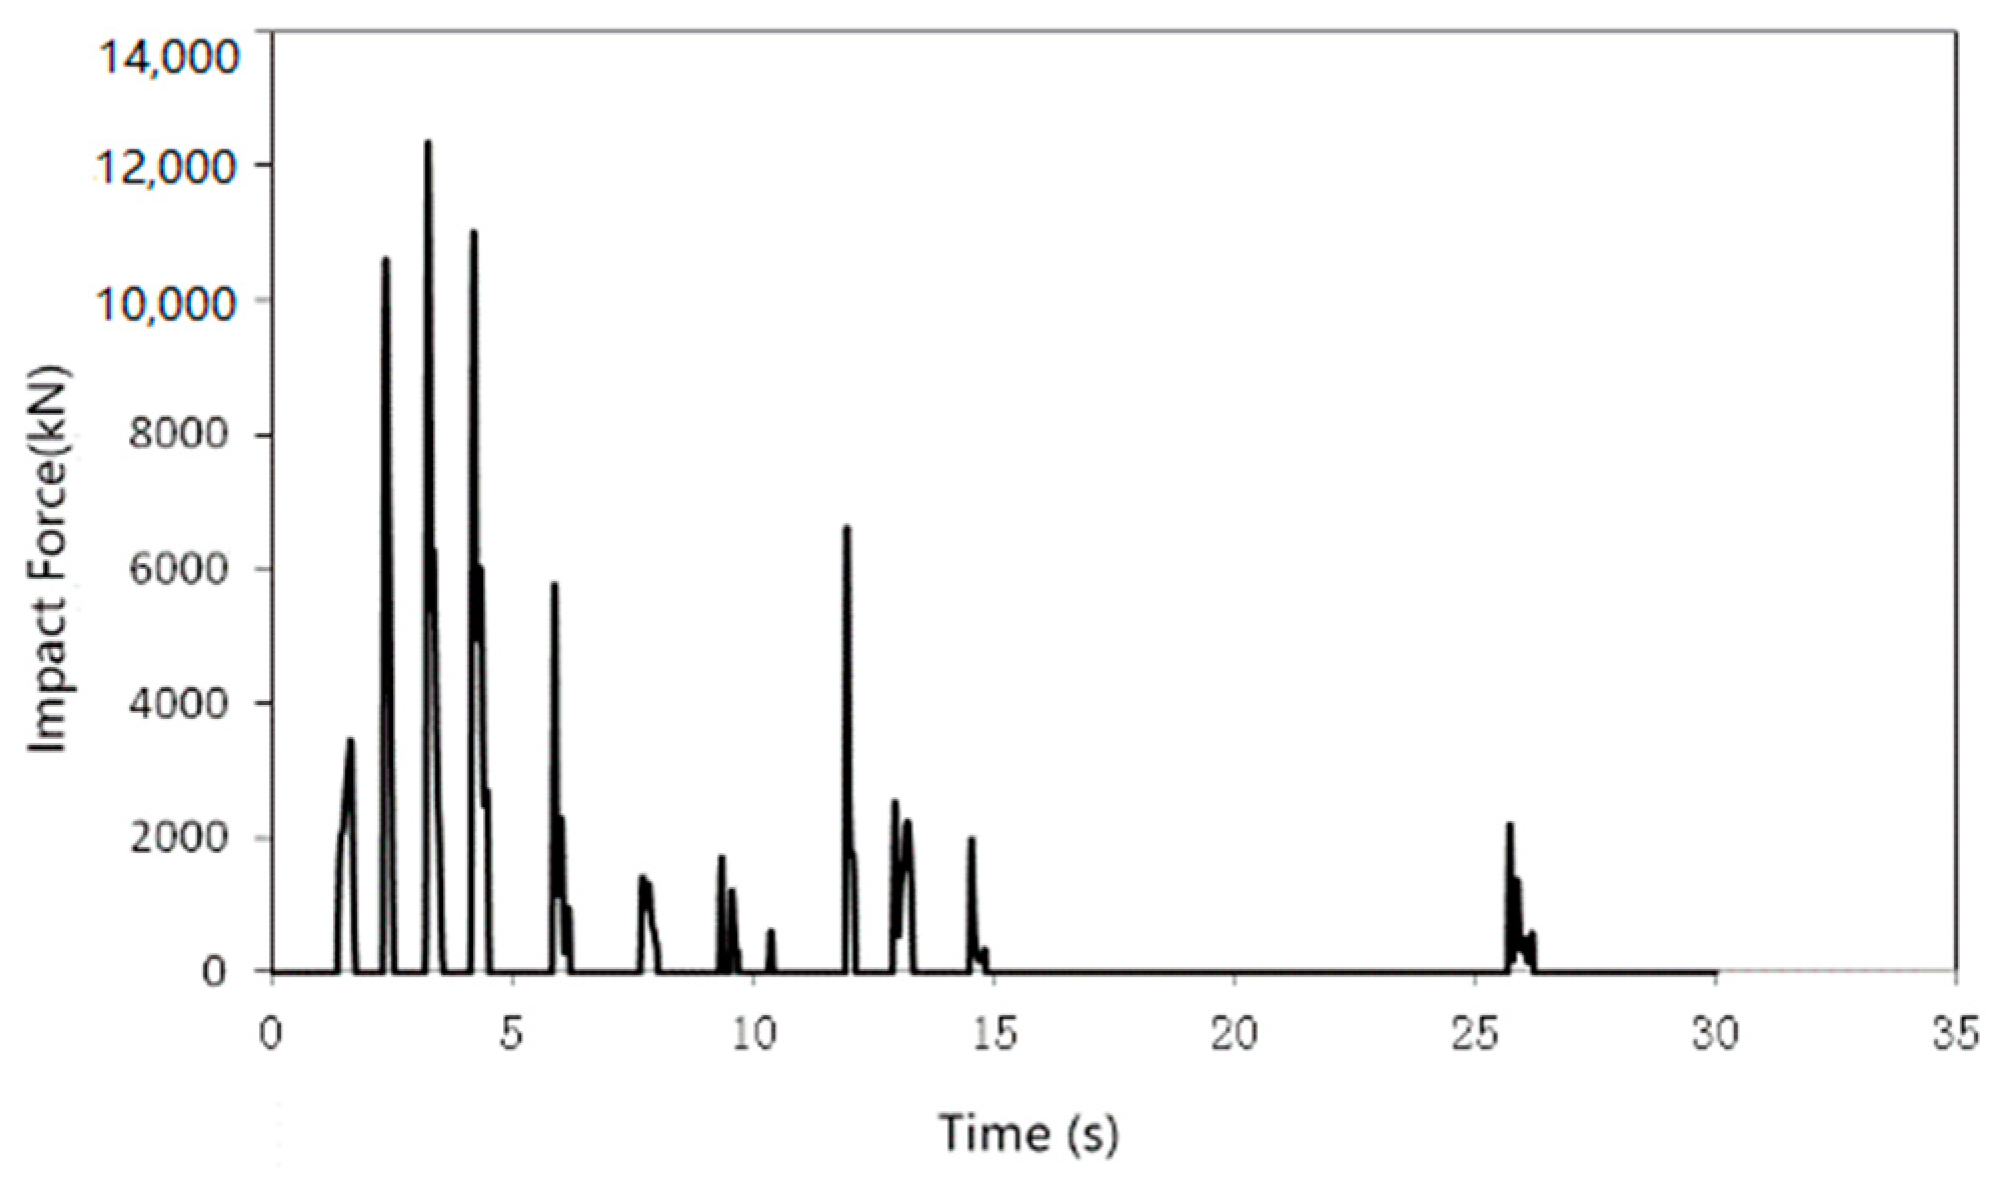
Figure 11 and Figure 12 show the time-history curve of the impact force under El Centro earthquake excitation. Every peak in the curve represents a pounding. As shown, pounding did not happen just once, but repeatedly during the earthquake.
Figure 11.
Time-history curve of impact force for model A.
Figure 12.
Time-history curve of impact force for model B.
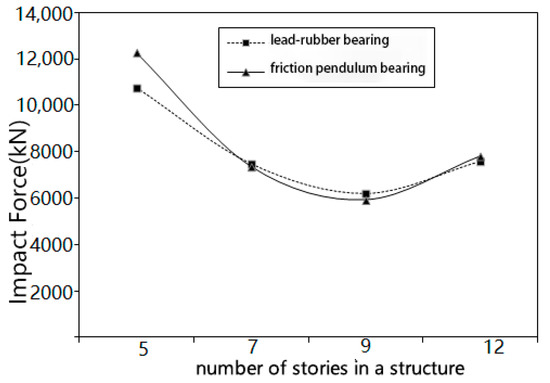
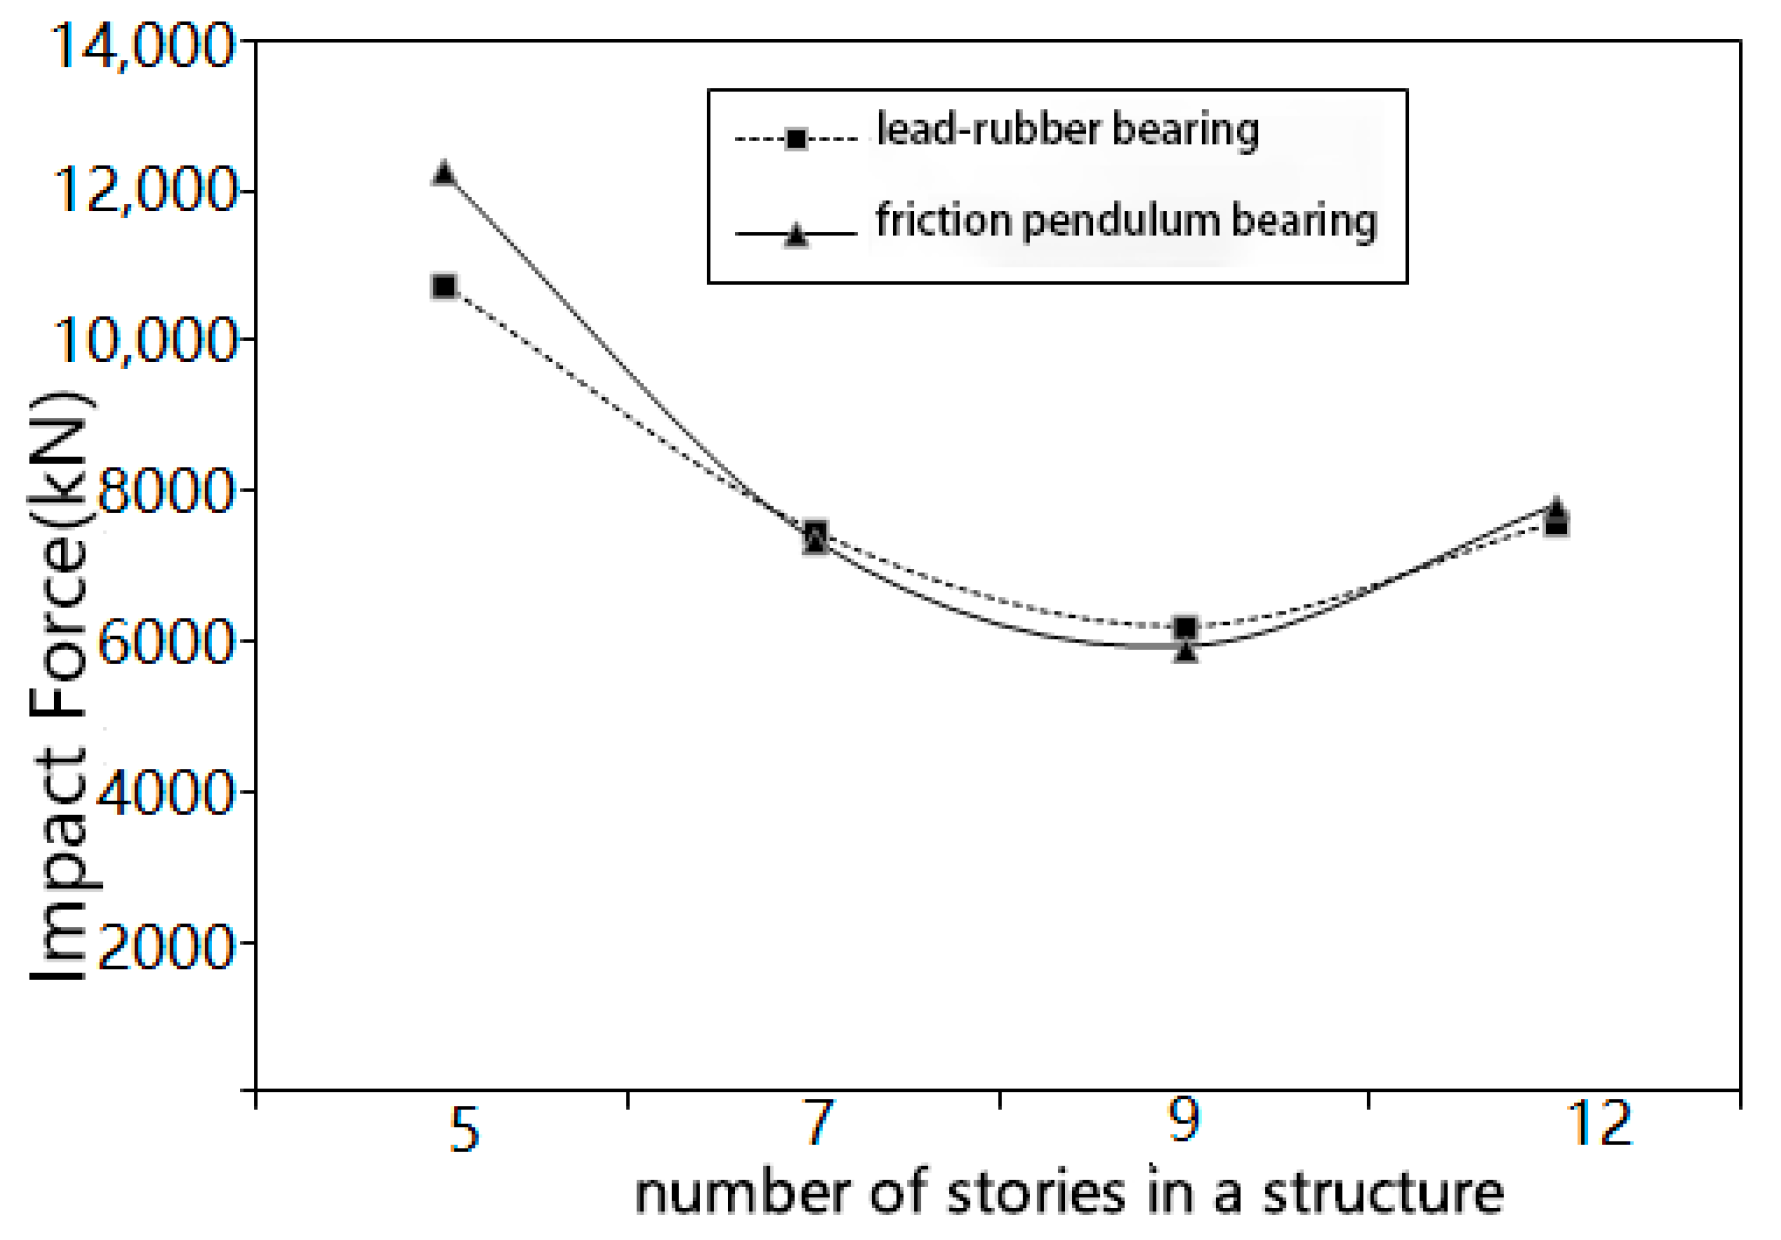
On the basis of models A and B, models with 7, 9, and 12 stories were built to study the effects of story and on pounding. Figure 13 shows the curve of impact force variation with the number of stories under the El Centro earthquake excitation.
Figure 13.
Curves of impact force changes with story.
In Figure 13, it can be seen that the impact force first decreases with an increasing number of stories, but then decreases. This pattern also can be observed in under the other two excitations. Therefore, the number of stories in a building is not a good standard to estimate the magnitude of the impact force. More factors such as the type of structure, and material characteristics should be considered.
3.2.2. Story Shear-Force
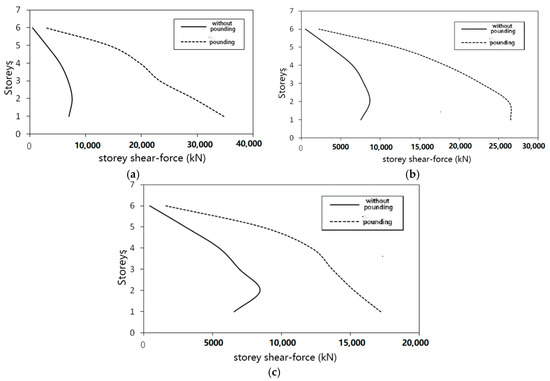
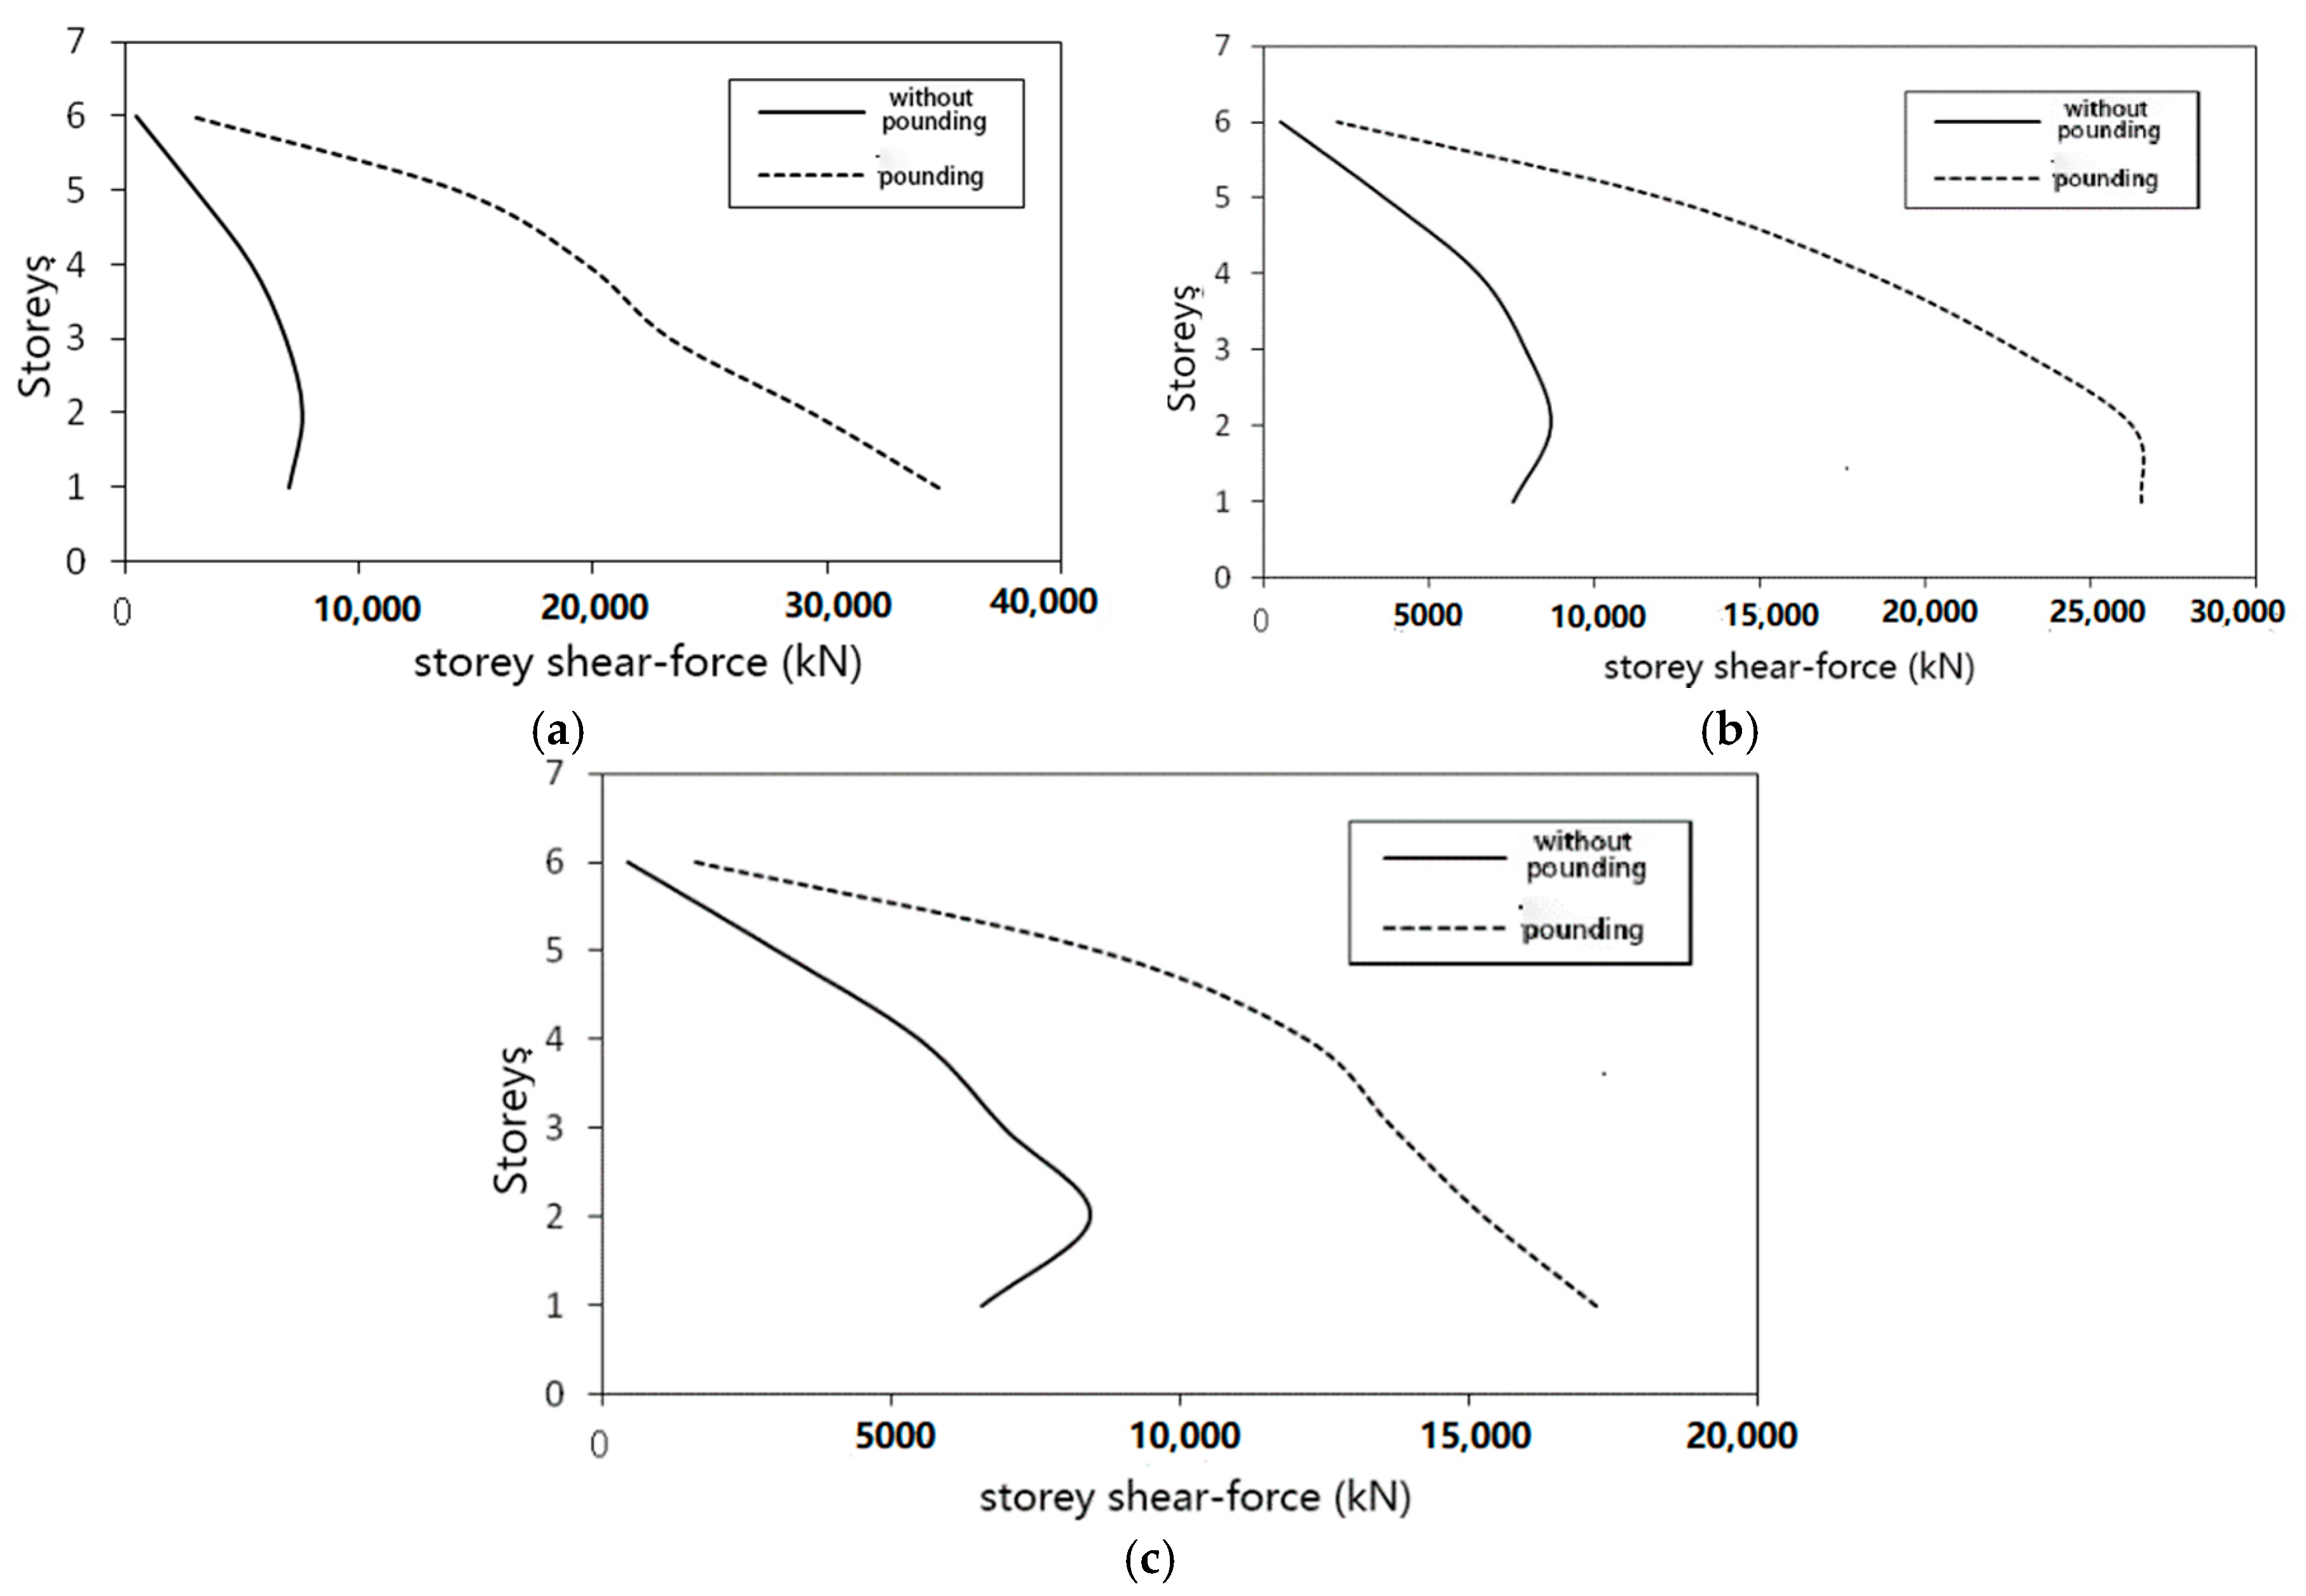
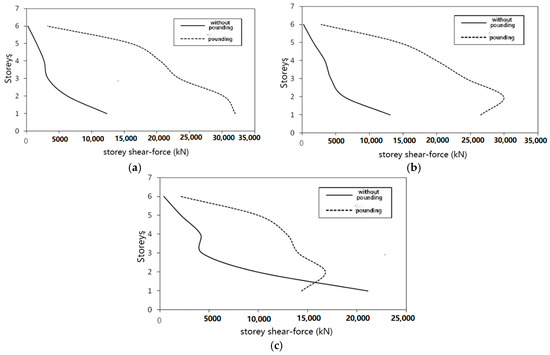
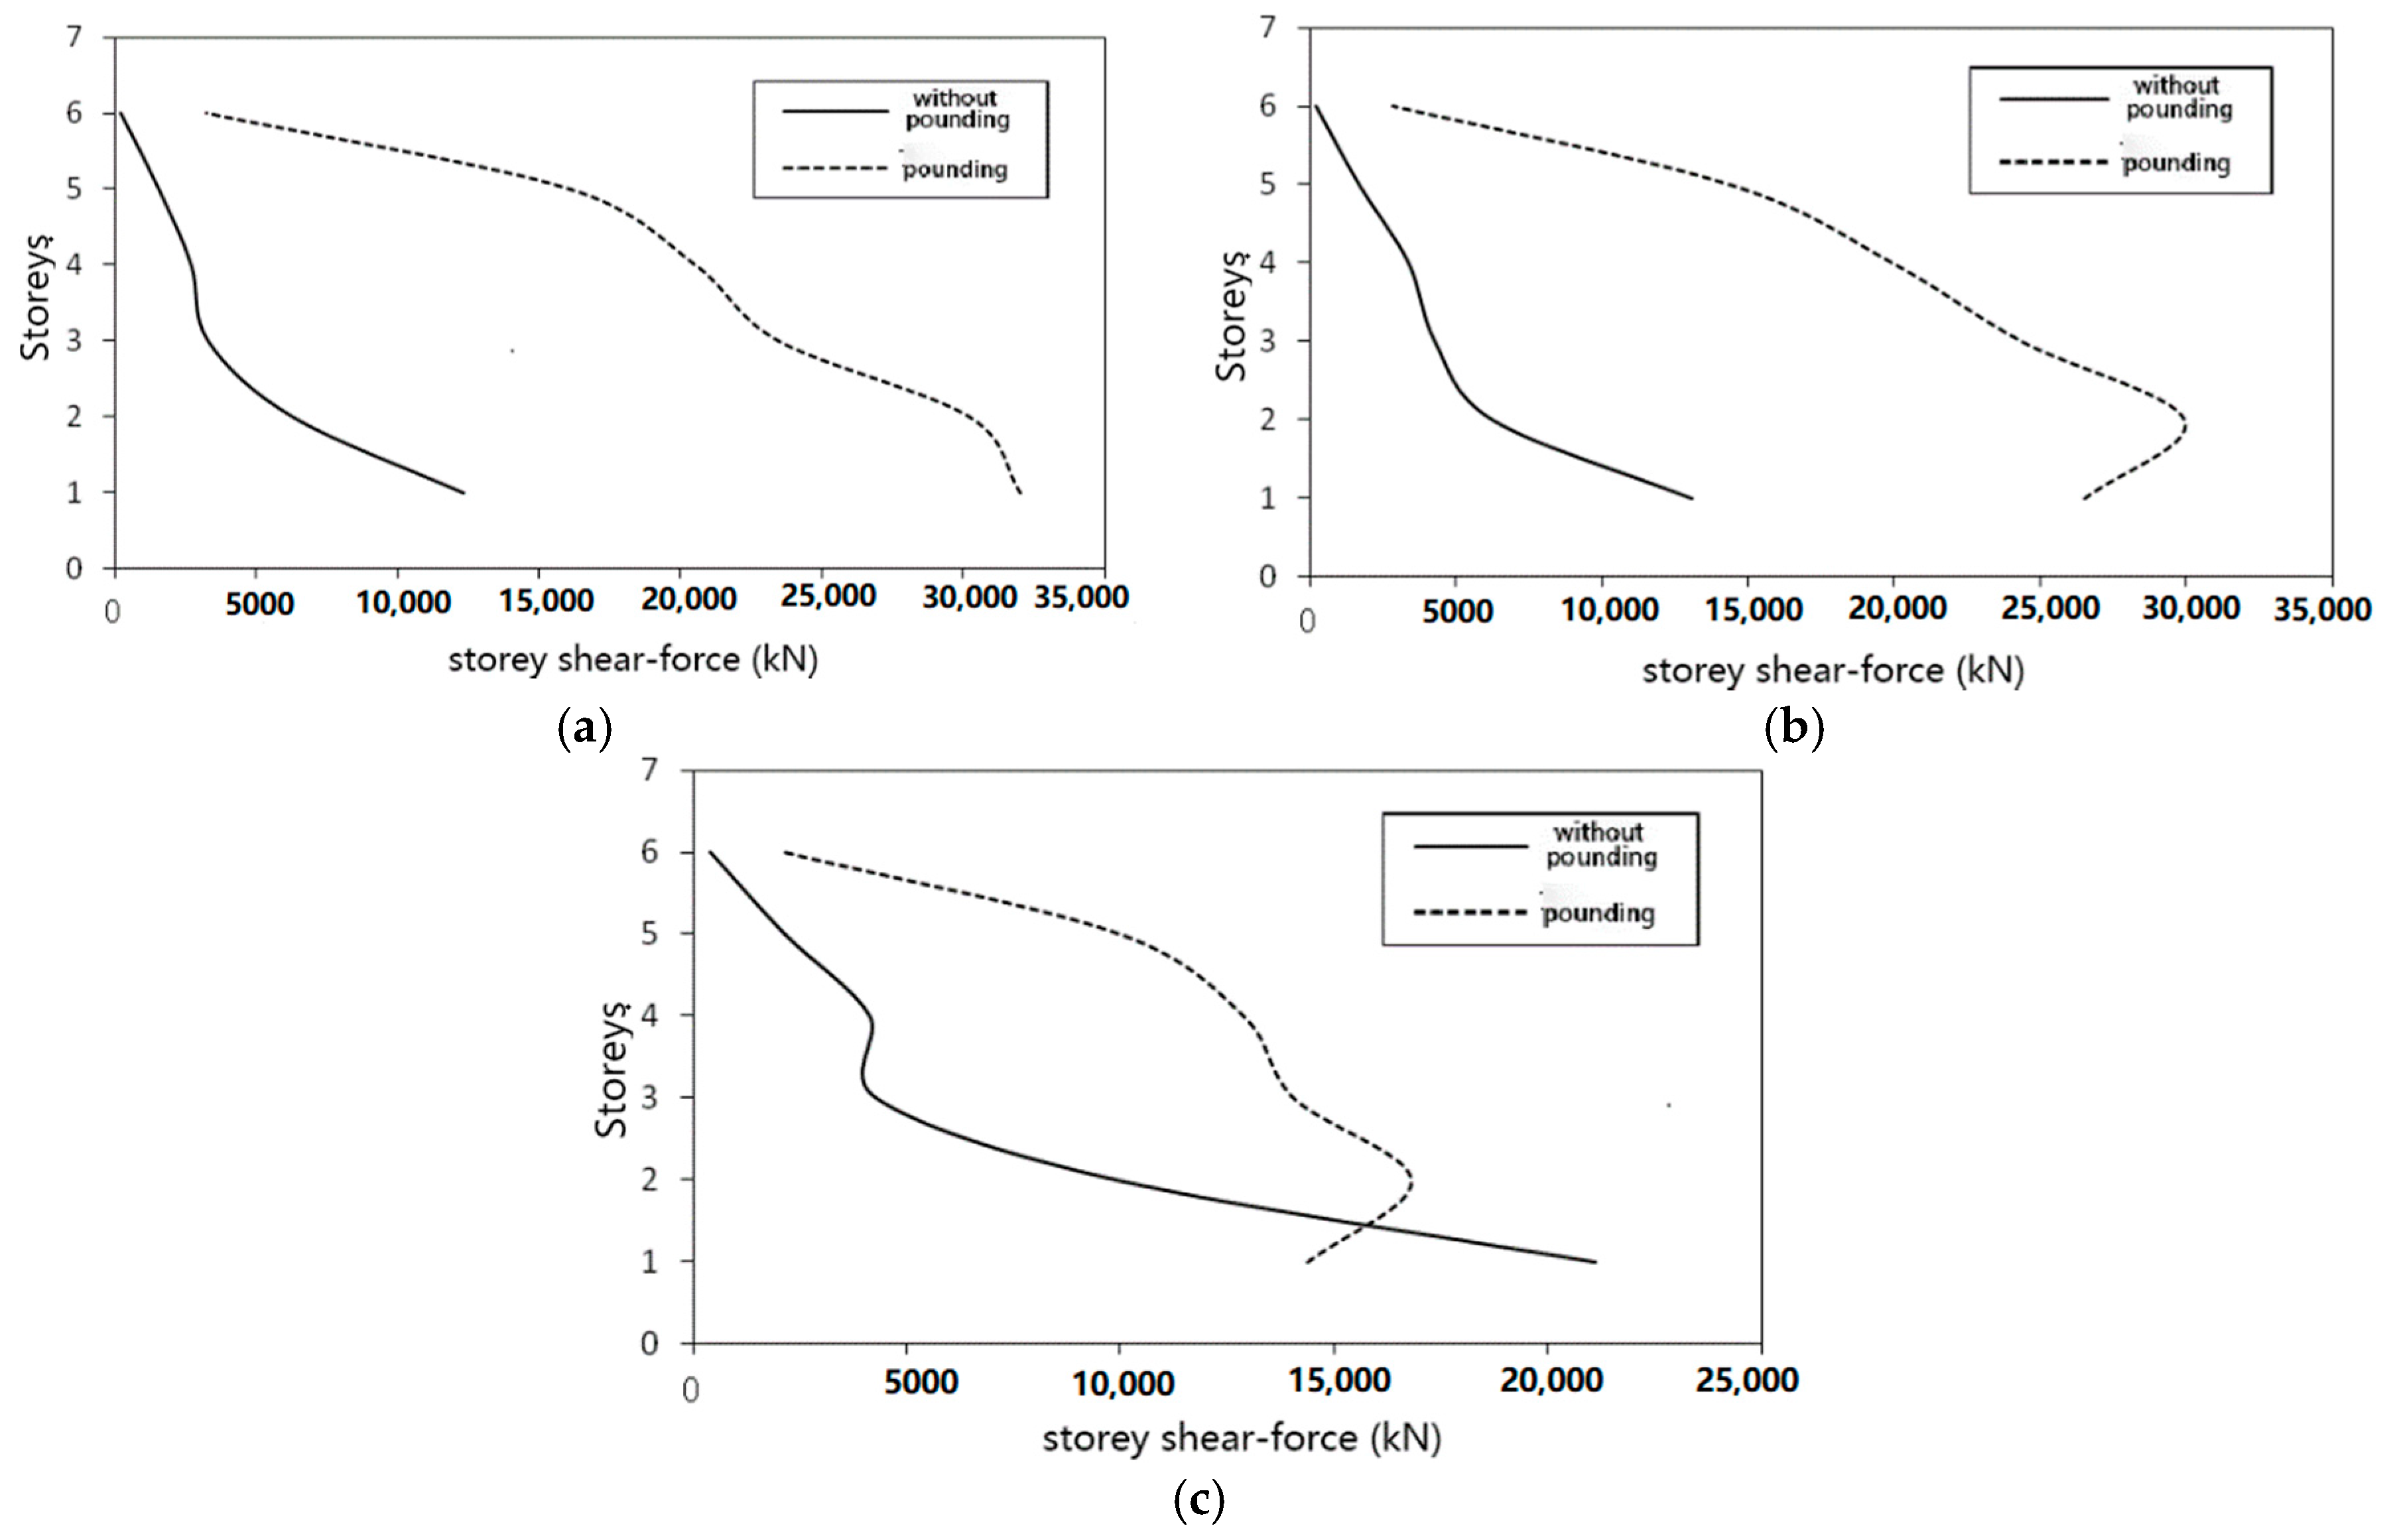
Figure 14 and Figure 15 compare story shear-force with and without pounding. Table 2 and Table 3 present the maximum values of story shear-force for models A and B under different earthquakes. In Table 2, for the base-isolated structure with lead-rubber bearing, it can be seen that there is a 3.59 to 5.06 times growth of story shear-force for the El Centro earthquake, 2.04 to 3.13 times growth for the Taft earthquake, and 1.03 to 2.63 times for the Artificial earthquake. In Table 3, for the base-isolated structure with friction pendulum isolation bearing, 1.59 to 12.60 times growth of story shear-force can be observed for the El Centro earthquake, as well as 1.30 to 10.93 times growth for the Taft earthquake, and −0.18 to 3.24 times growth for the Artificial earthquake.
Figure 14.
Story shear-force under different earthquakes (model A). (a) El Centro earthquake; (b) Taft earthquake; (c) Artificial excitation.
Figure 15.
Story shear-force under different earthquakes (model B). (a) El Centro earthquake; (b) Taft earthquake; (c) Artificial excitation.
Table 2.
Maximum values of story shear-force for model A.
Table 3.
Maximum values of story shear-force for model B.
It can be inferred that there is a considerable amplification of the story shear-force under pounding for both types of isolated structures. In particular, for the structure with friction pendulum isolation bearing, the amplification of the shear-force in the first story is larger than that in other stories.
3.2.3. Acceleration
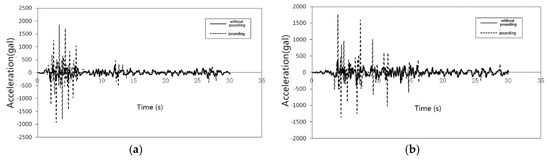
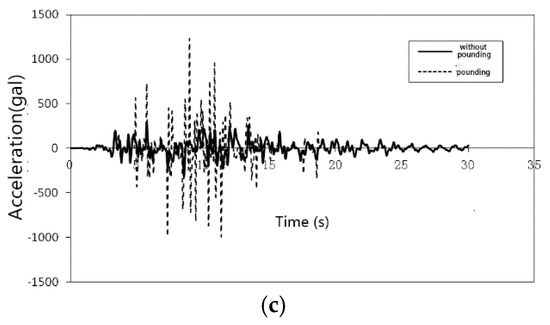
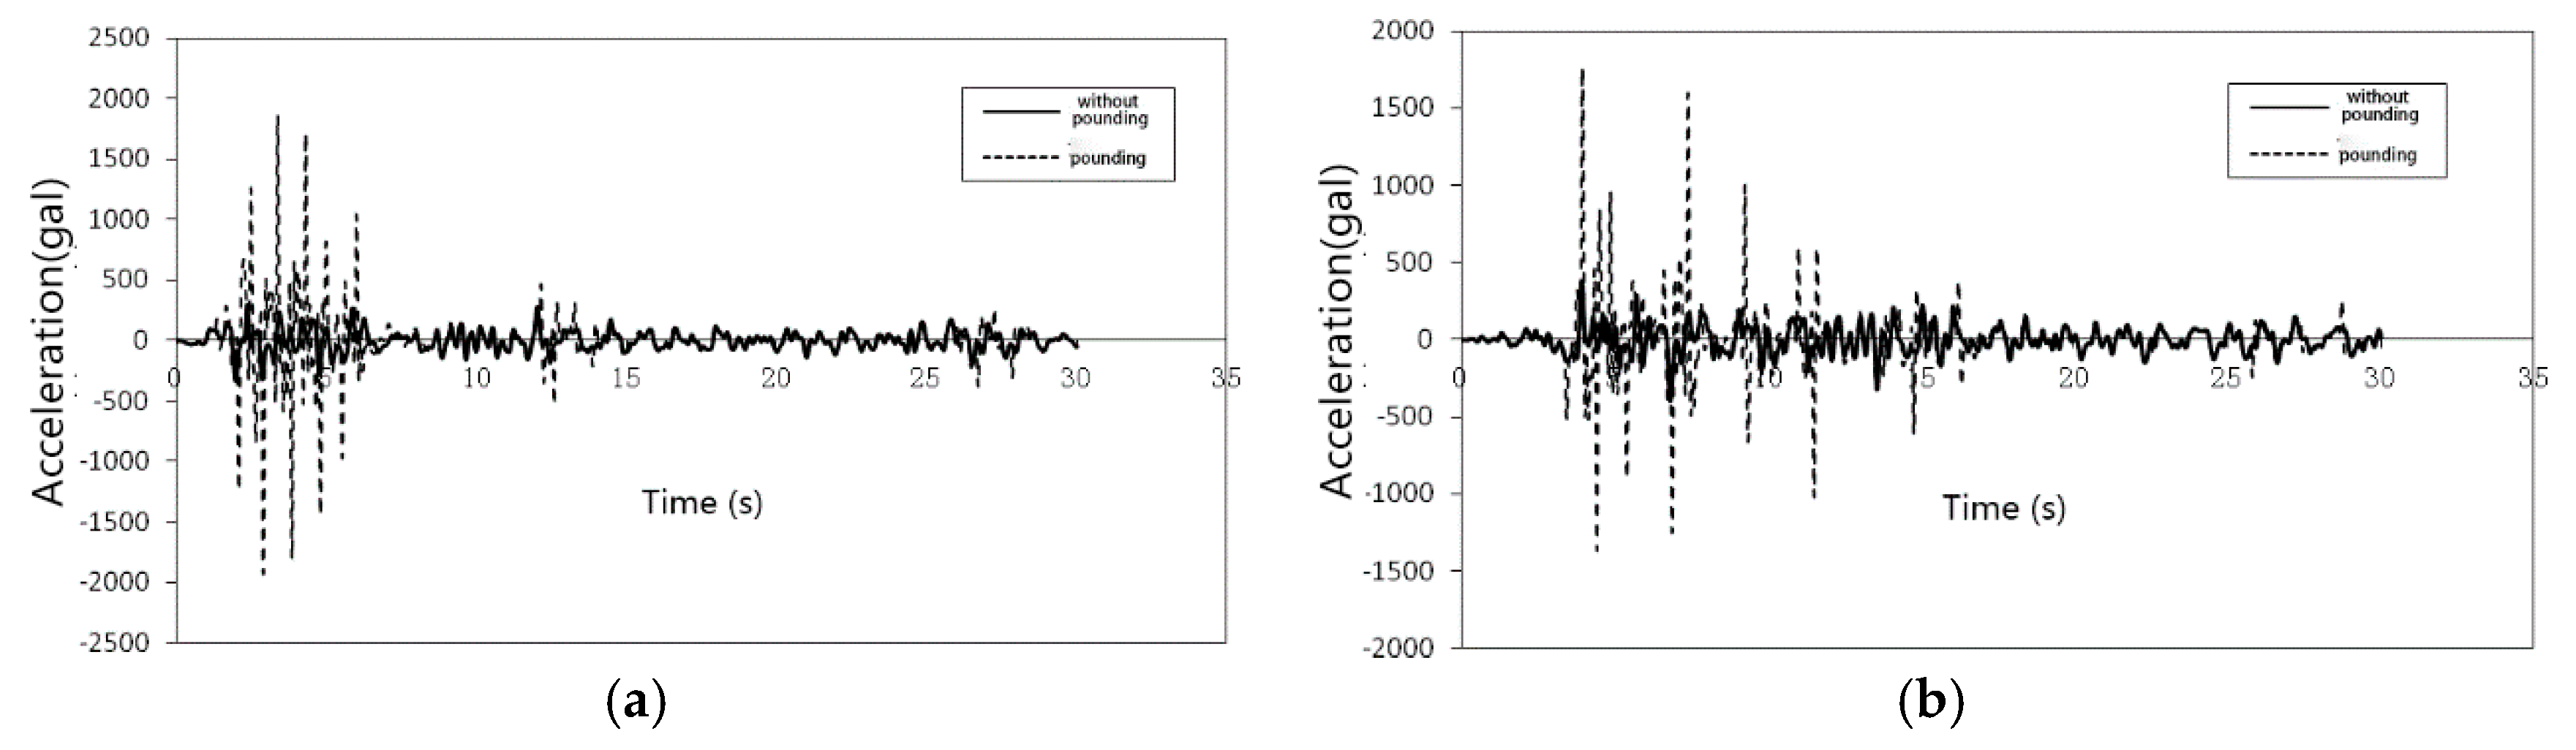
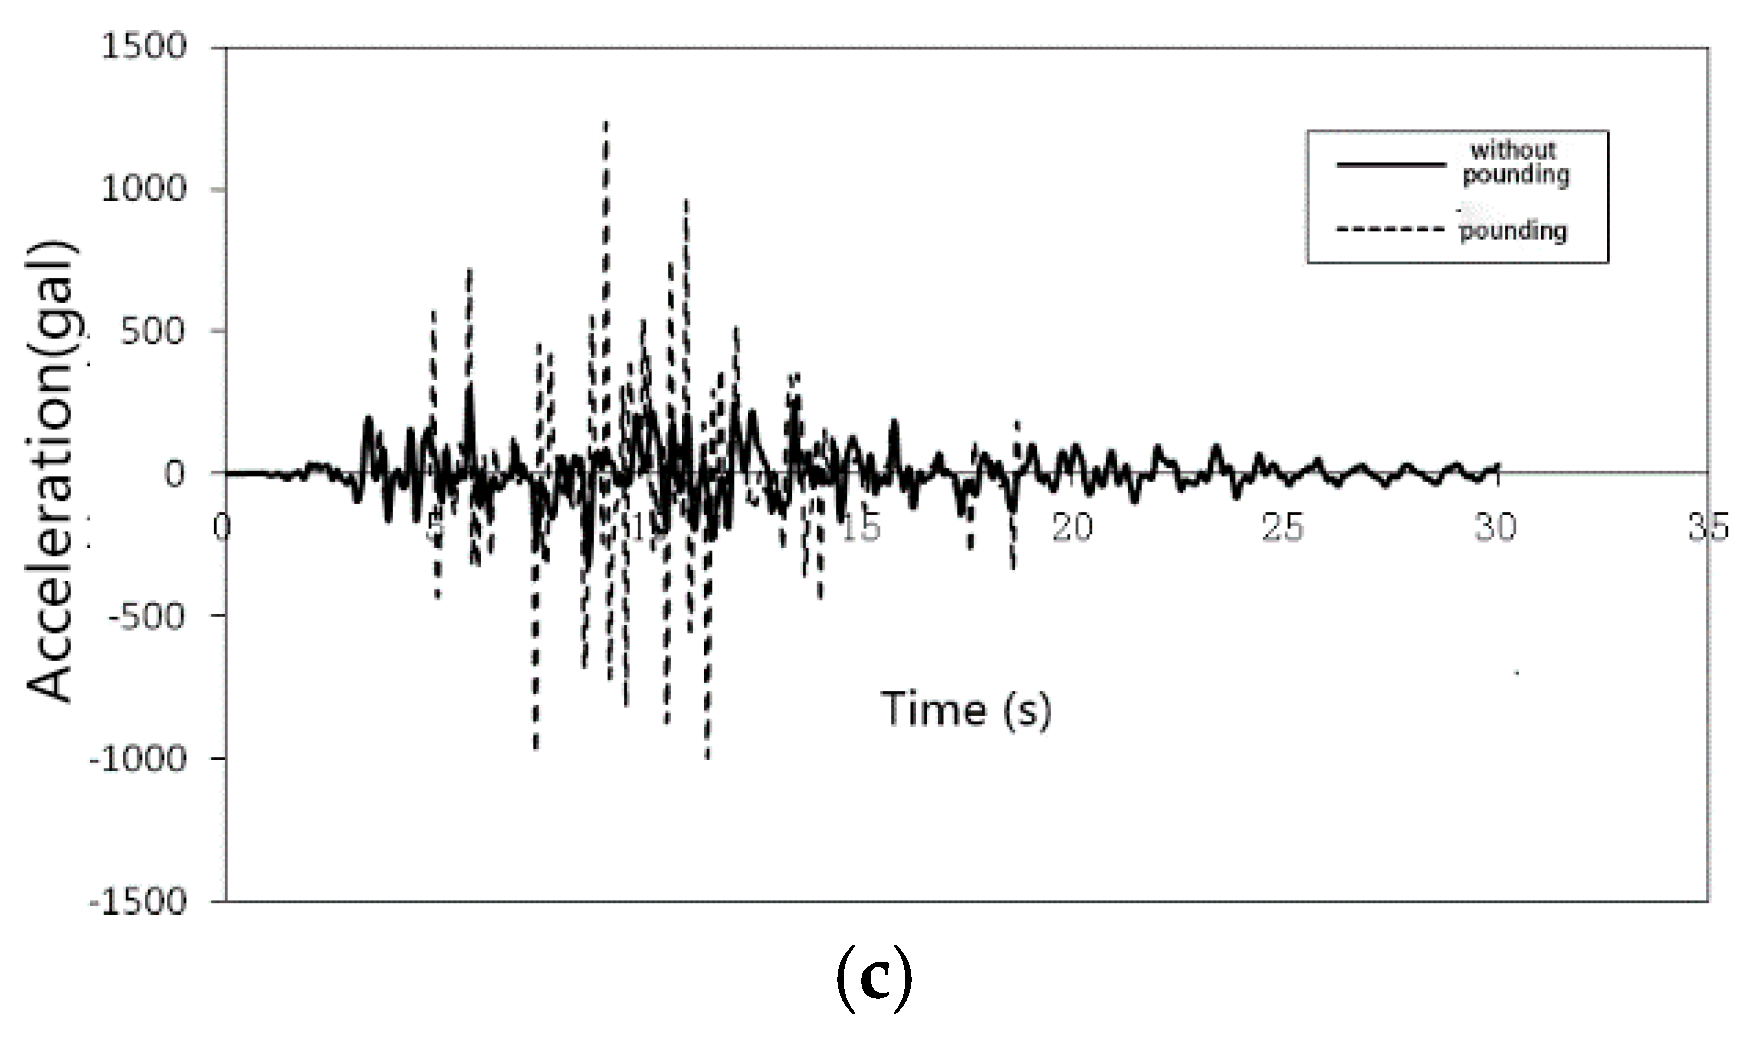
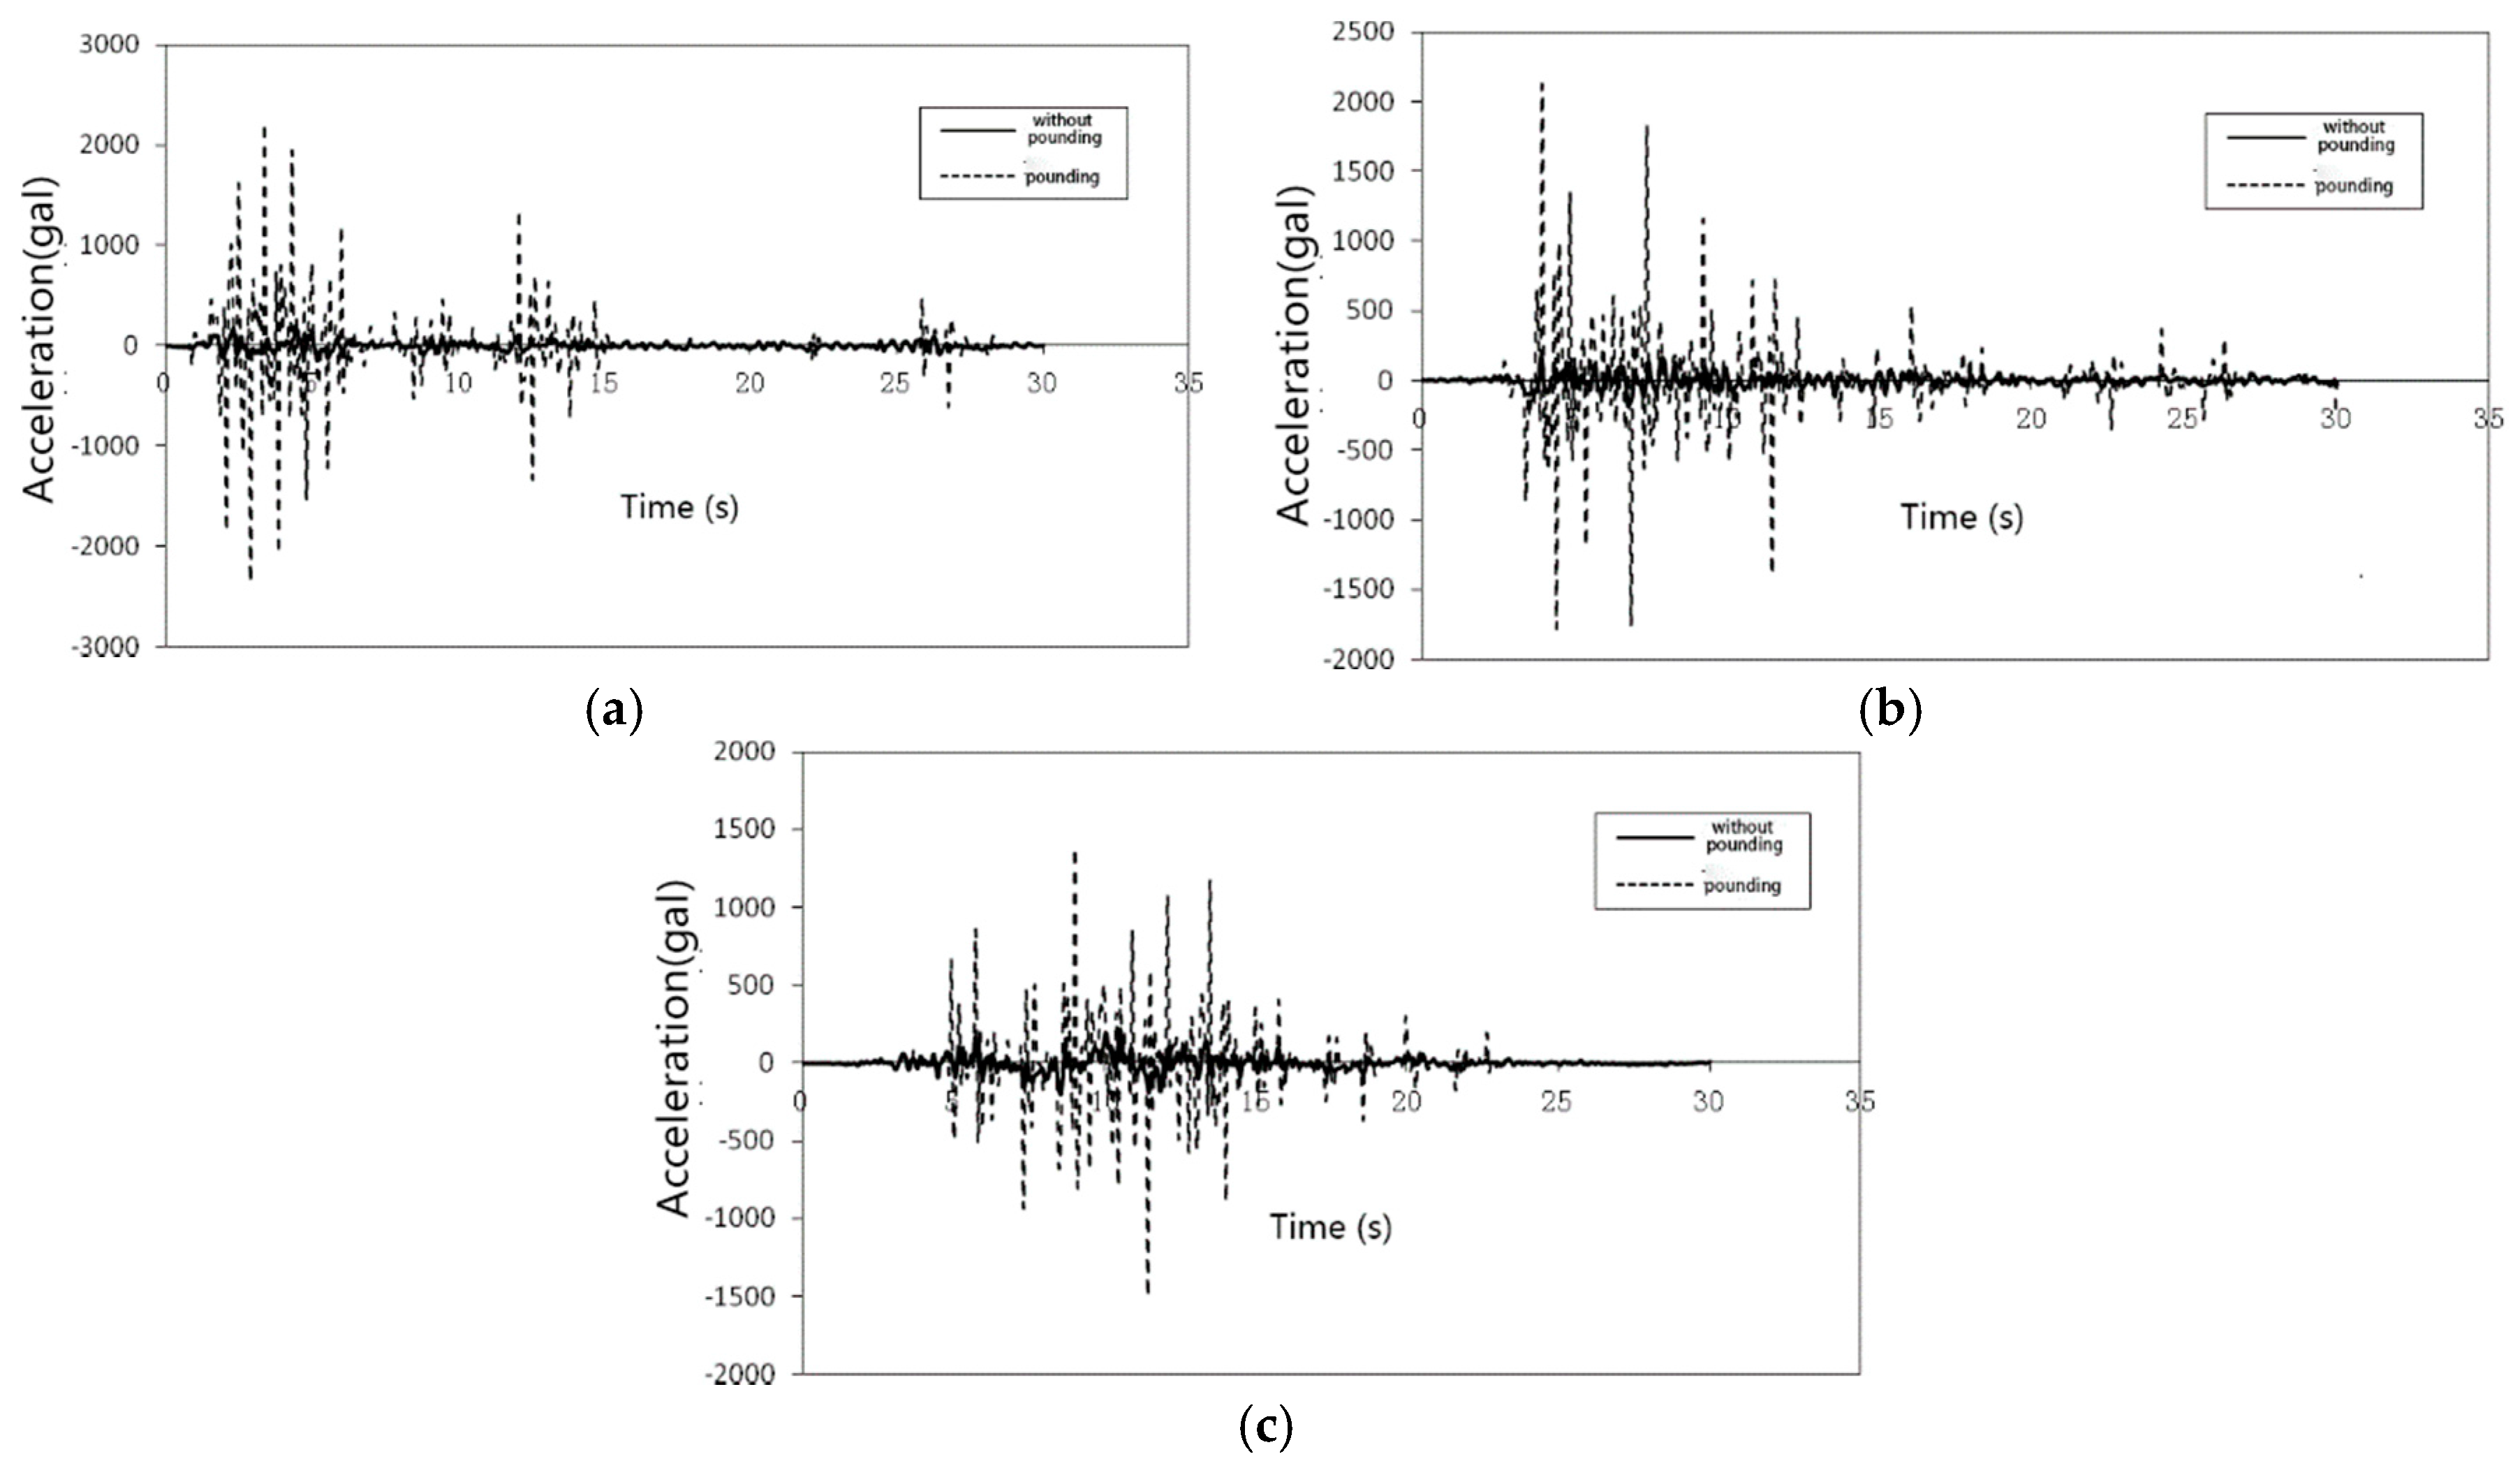
Figure 16 and Figure 17 show the acceleration time-history curves of node 858, where the maximum values of acceleration were observed, under different earthquake excitations. The maximum accelerations that were obtained in models A and B are presented in Table 4 and Table 5.
Figure 16.
Structural acceleration under different earthquakes (model A). (a) El Centro earthquake; (b) Taft earthquake; and, (c) Artificial excitation.
Figure 17.
Structural acceleration under different earthquakes (model B). (a) El Centro earthquake; (b) Taft earthquake; (c) Artificial excitation.
Table 4.
Maximum acceleration values for model A.
Table 5.
Maximum acceleration values for model B.
When compared to cases without pounding, a large amplification can be observed in both models A and B under pounding condition, according to Figure 16 and Figure 17. Furthermore, the maximum values of acceleration appear when excitations are strong.
According to Table 4 and Table 5, for model A under pounding conditions, there is a 4.88 times growth in acceleration under the El Centro earthquake, a 3.42 times growth under the Taft earthquake, and a 2.82 times growth under the Artificial earthquake. The amplification of model A is larger than that of model B, which was 12.67 times growth under the El Centro earthquake, 10.77 times growth under the Taft earthquake and 6.52 times growth under the Artificial earthquake.
There are great pounding effects on acceleration on top story acceleration of both the structure with lead-rubber bearing and the structure with friction pendulum isolation bearing. However, the acceleration amplification of the structure with friction pendulum isolation bearing is larger.
3.2.4. Velocity
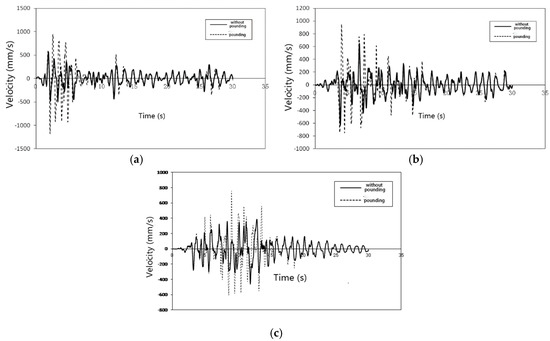
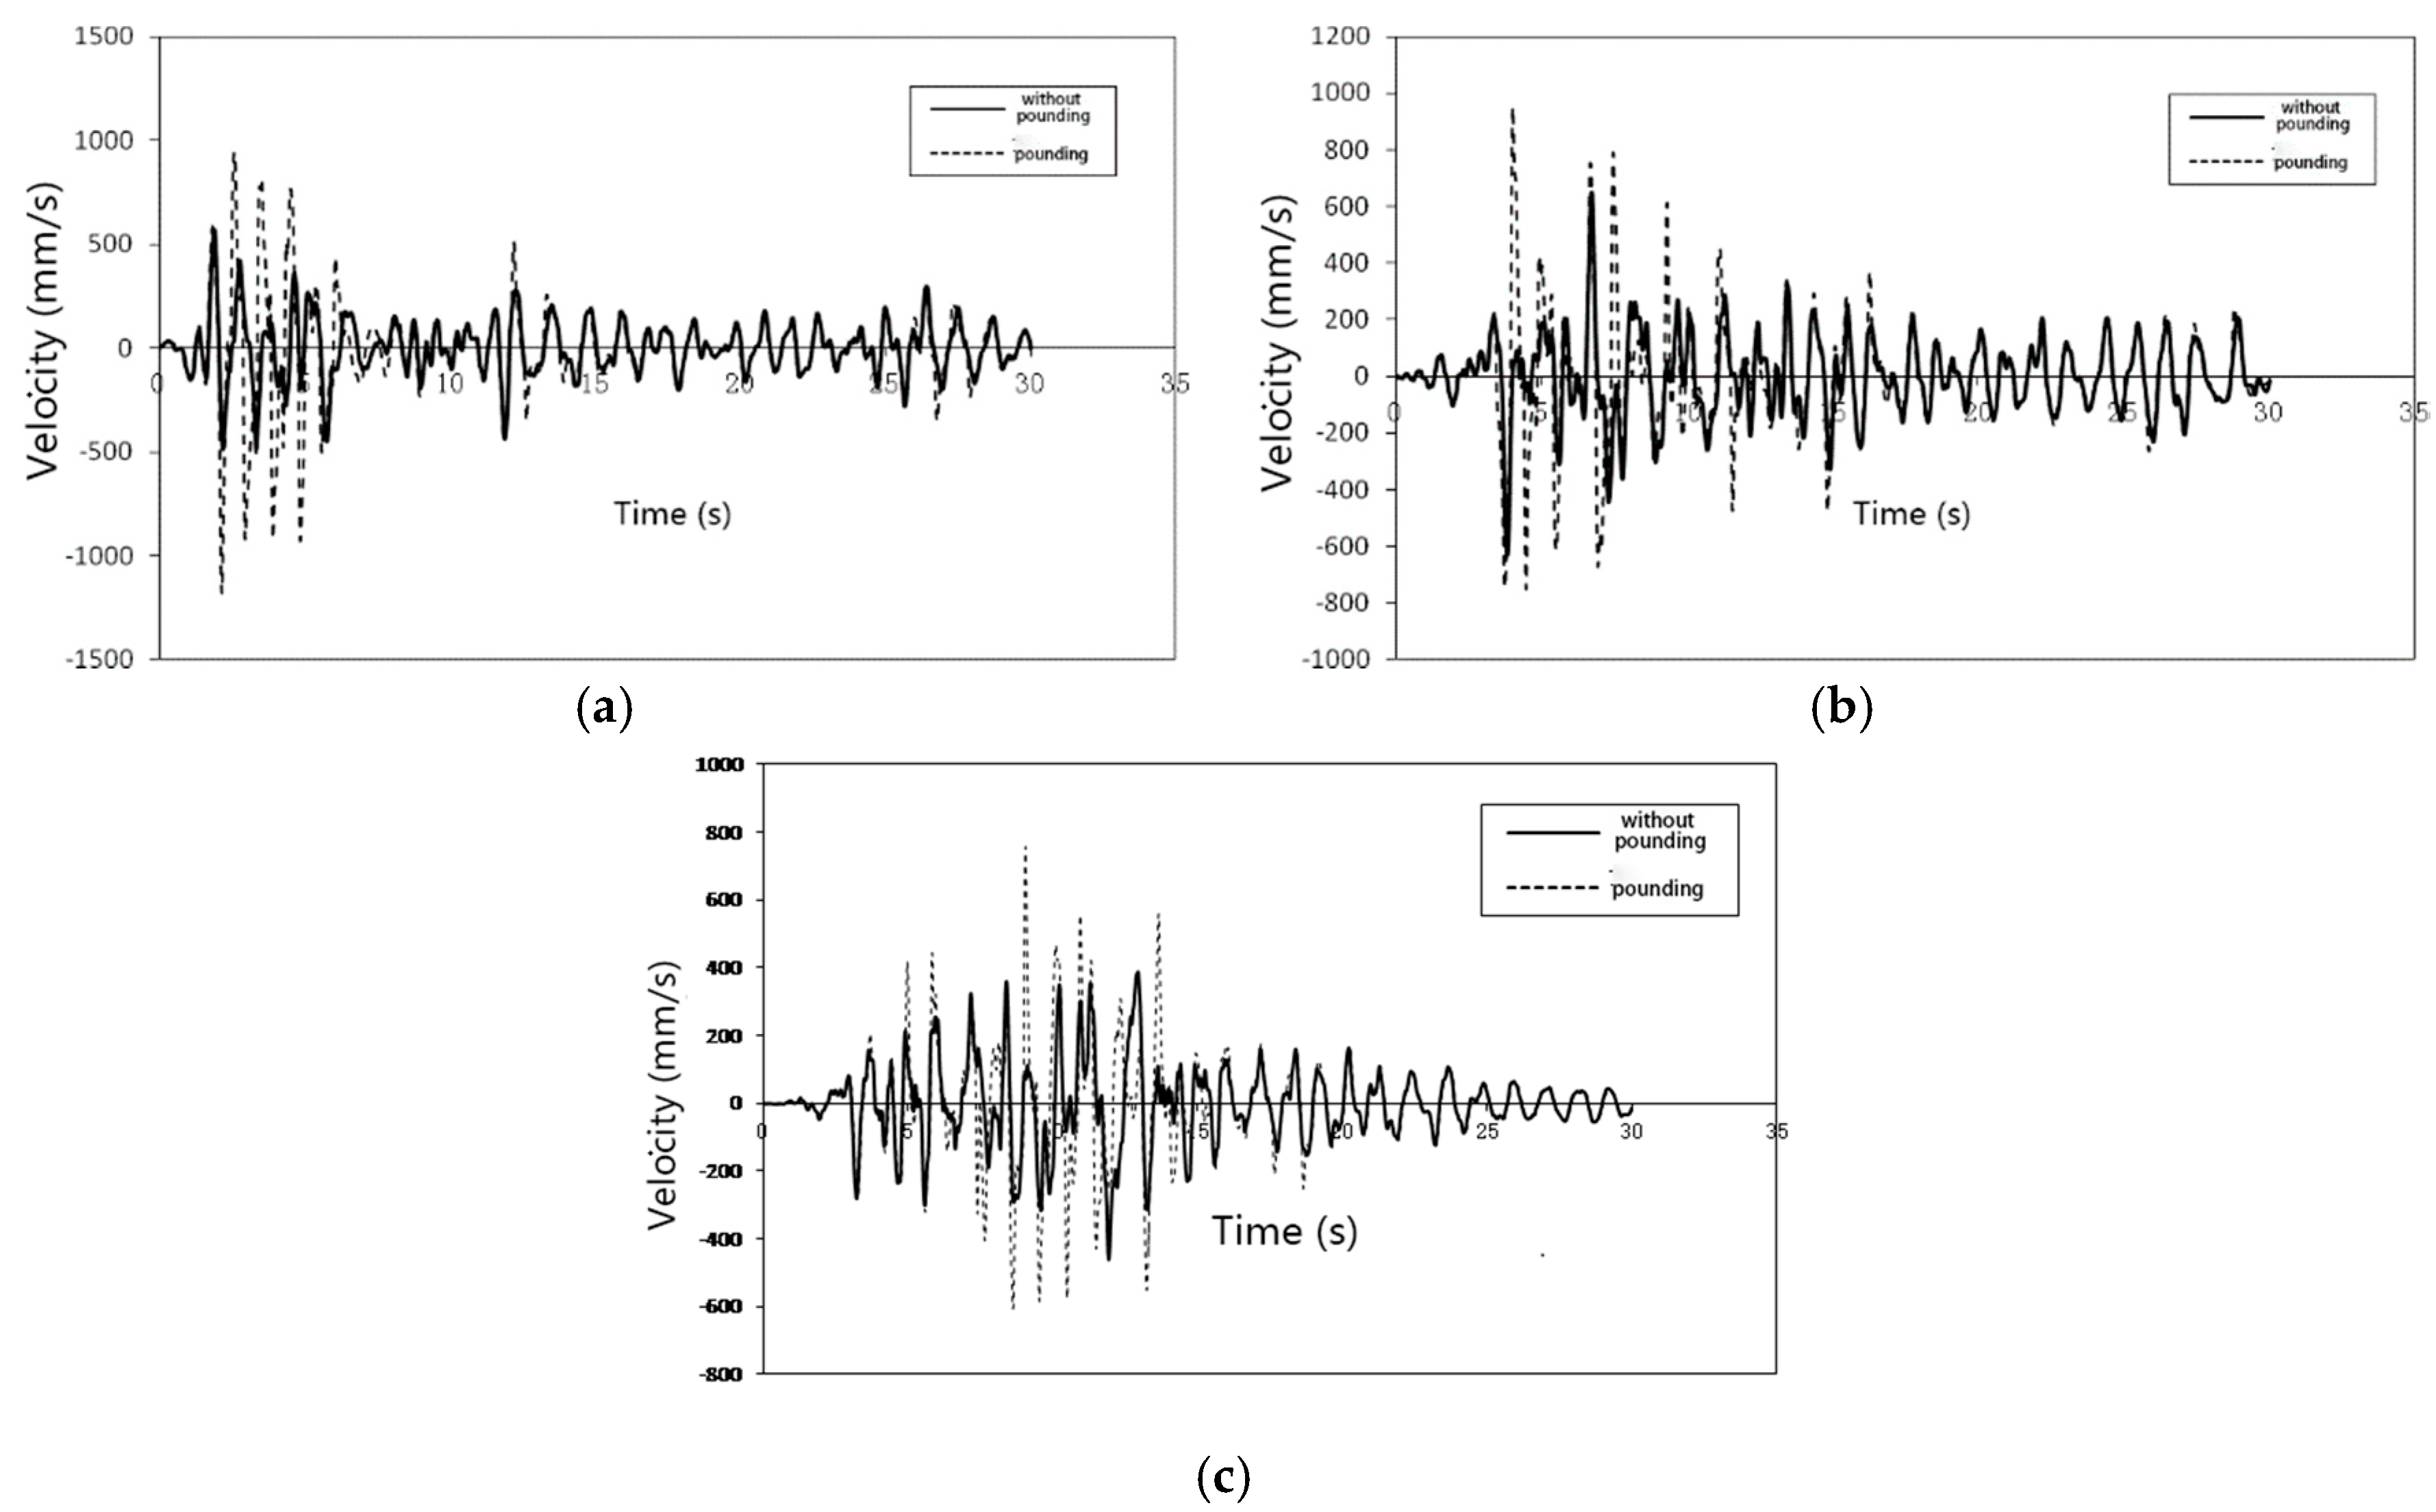
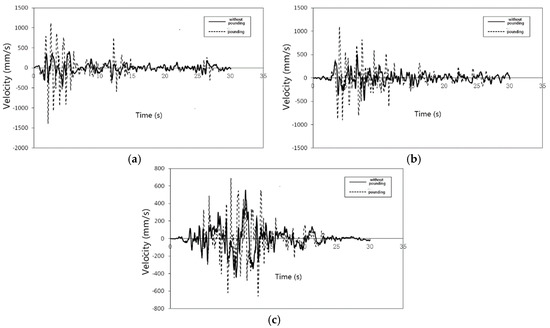
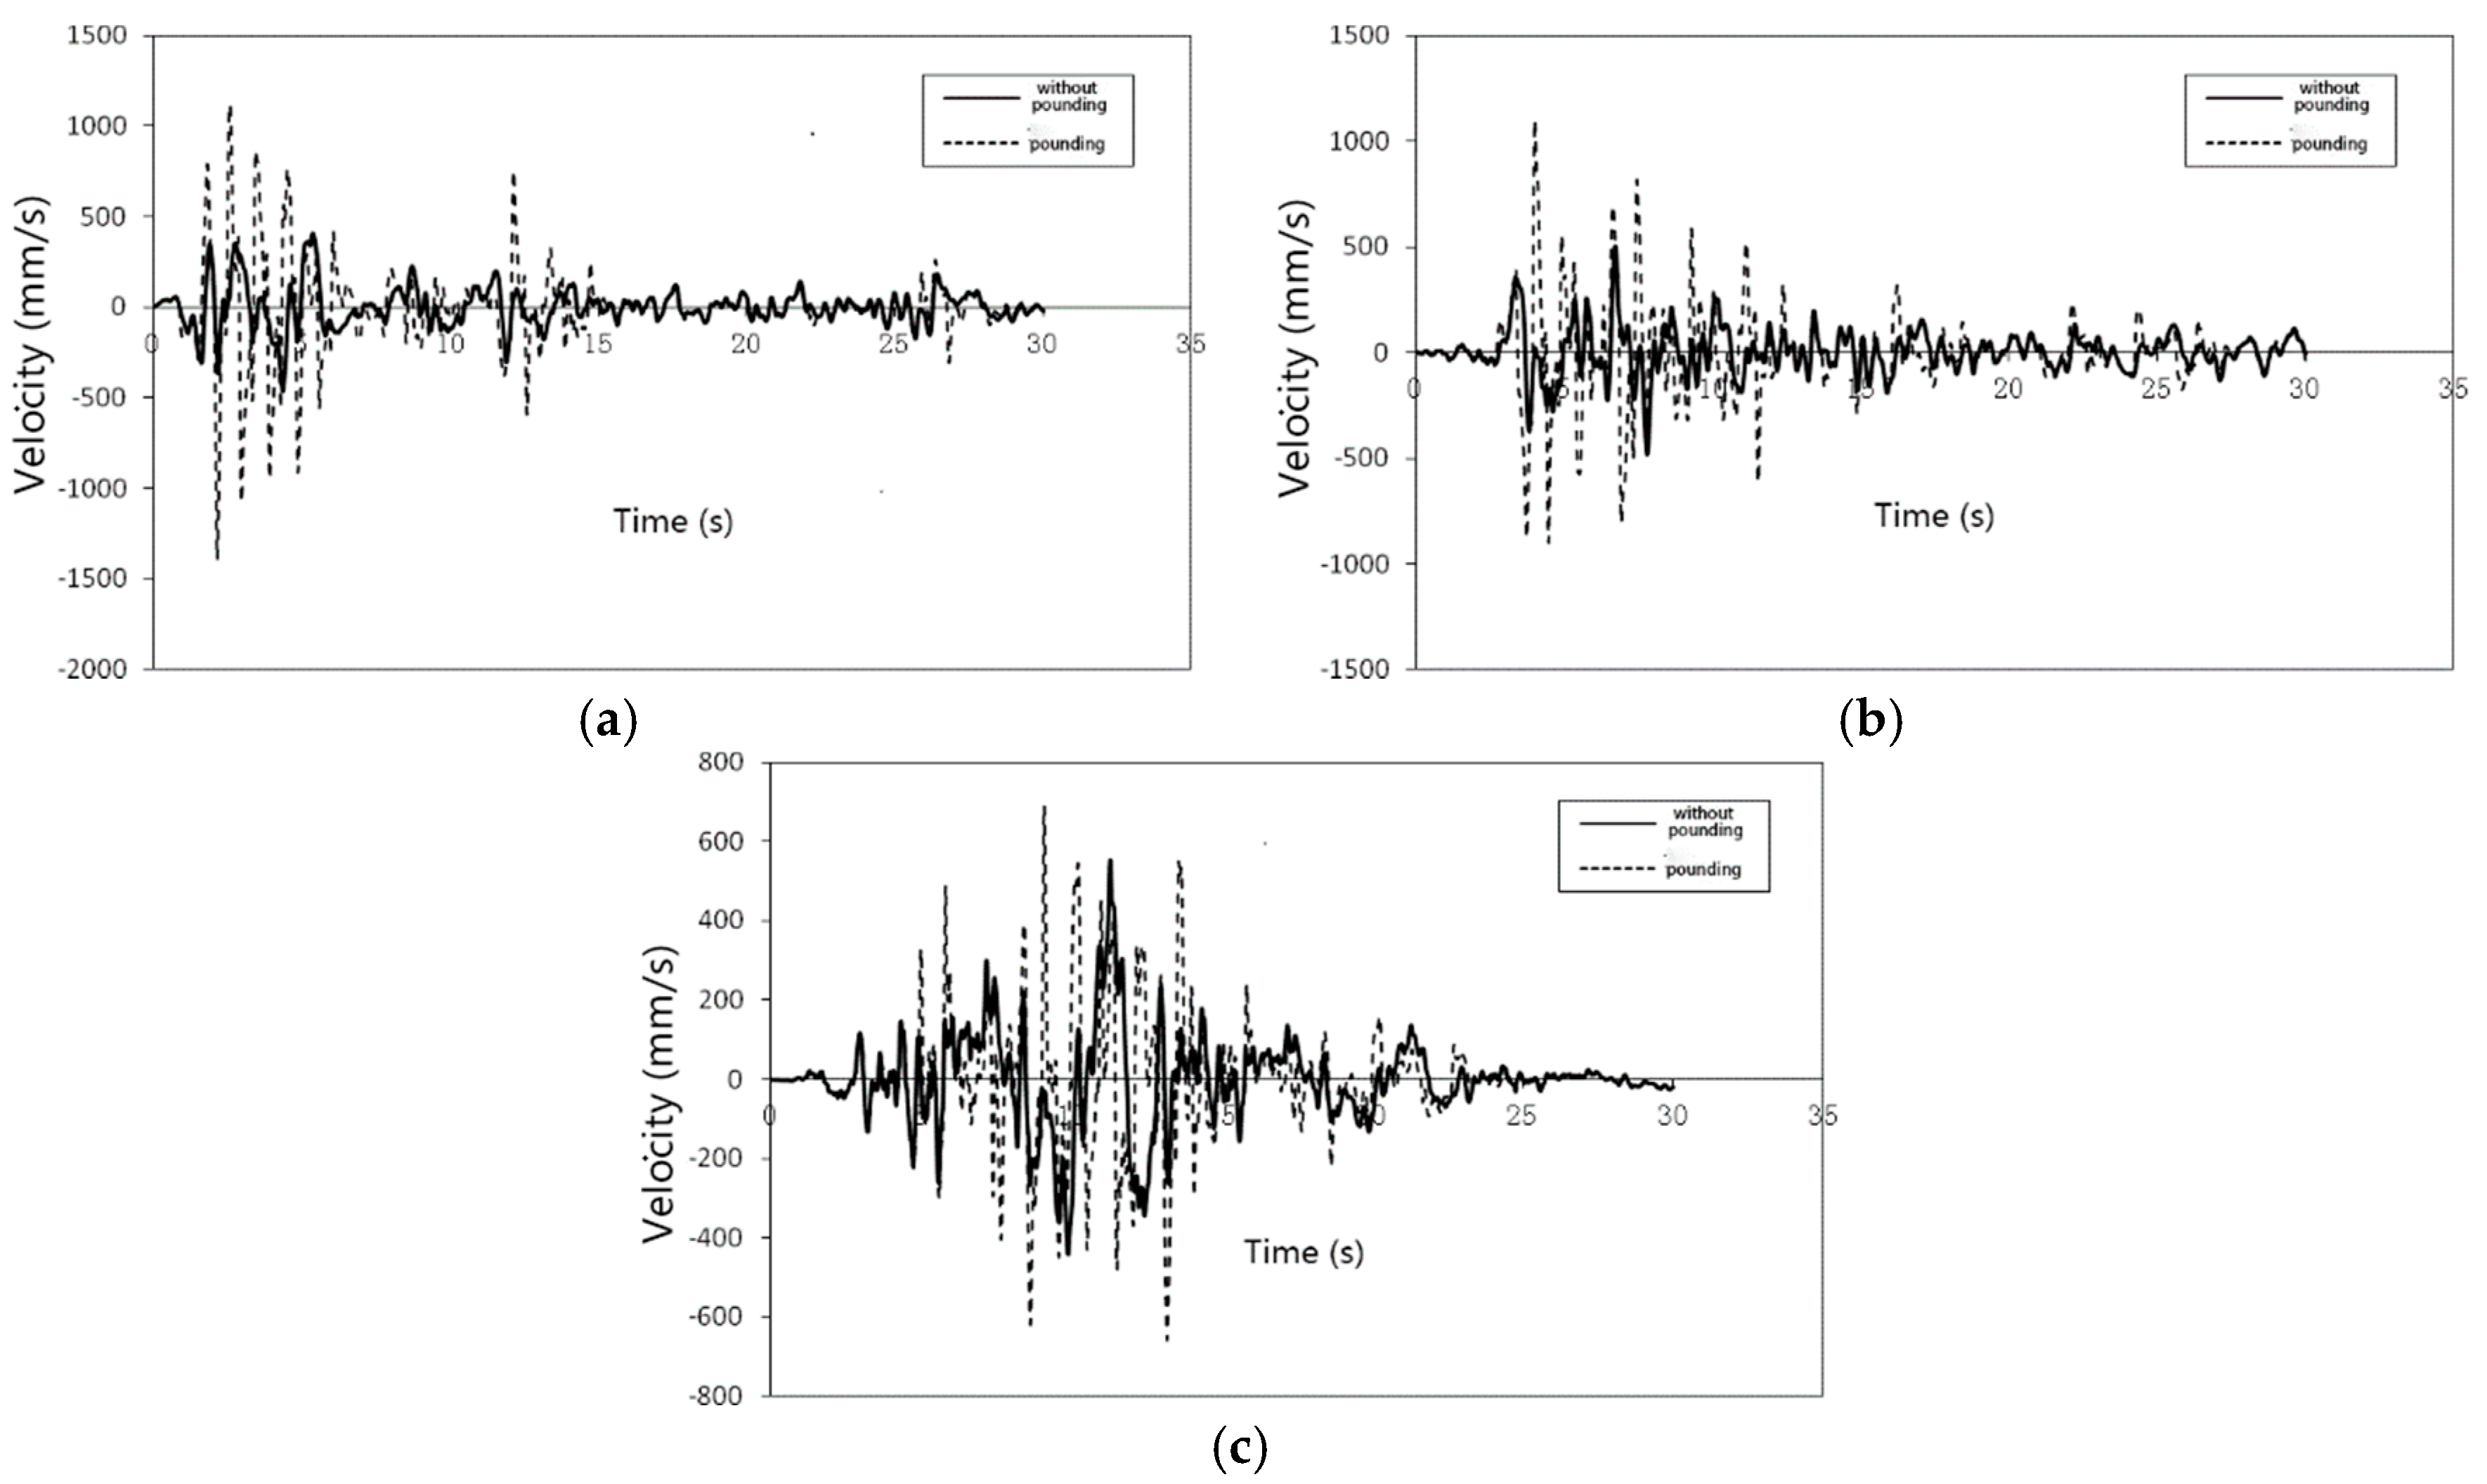
Figure 18 and Figure 19 show the velocity time-history curves of node 858 under different earthquakes. The maximum value of velocity on node 858 of models A and B can be found in Table 6 and Table 7.
Figure 18.
Structural velocity under different earthquakes (model A). (a) El Centro earthquakes; (b) Taft earthquake; and, (c) Artificial excitation.
Figure 19.
Structural velocity under different earthquakes (model B). (a) El Centro earthquakes; (b) Taft earthquake; and, (c) Artificial excitation.
Table 6.
Maximum velocity values for model A.
Table 7.
Maximum velocity values for model B.
The amplification of velocity under pounding in model A (1.07 times growth under the El Centro earthquake, 0.47 times growth under the Taft earthquake and 0.31 times growth under the Artificial earthquake) can be obtained in Table 6. The amplification can also be observed in model B (2.00 times growth under the El Centro earthquake, 1.19 times growth under the Taft earthquake and 0.25 times growth under the Artificial earthquake, Table 7).
There are some effects of pounding on velocity in the top story of both types of isolated structure. However, the amplification of acceleration is larger than that of velocity. In addition, the maximum values of velocity appear when the excitations are strong.
3.2.5. Displacement
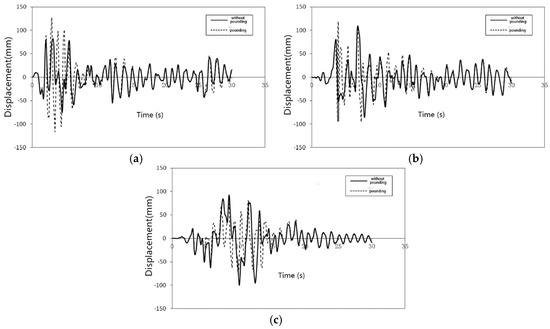
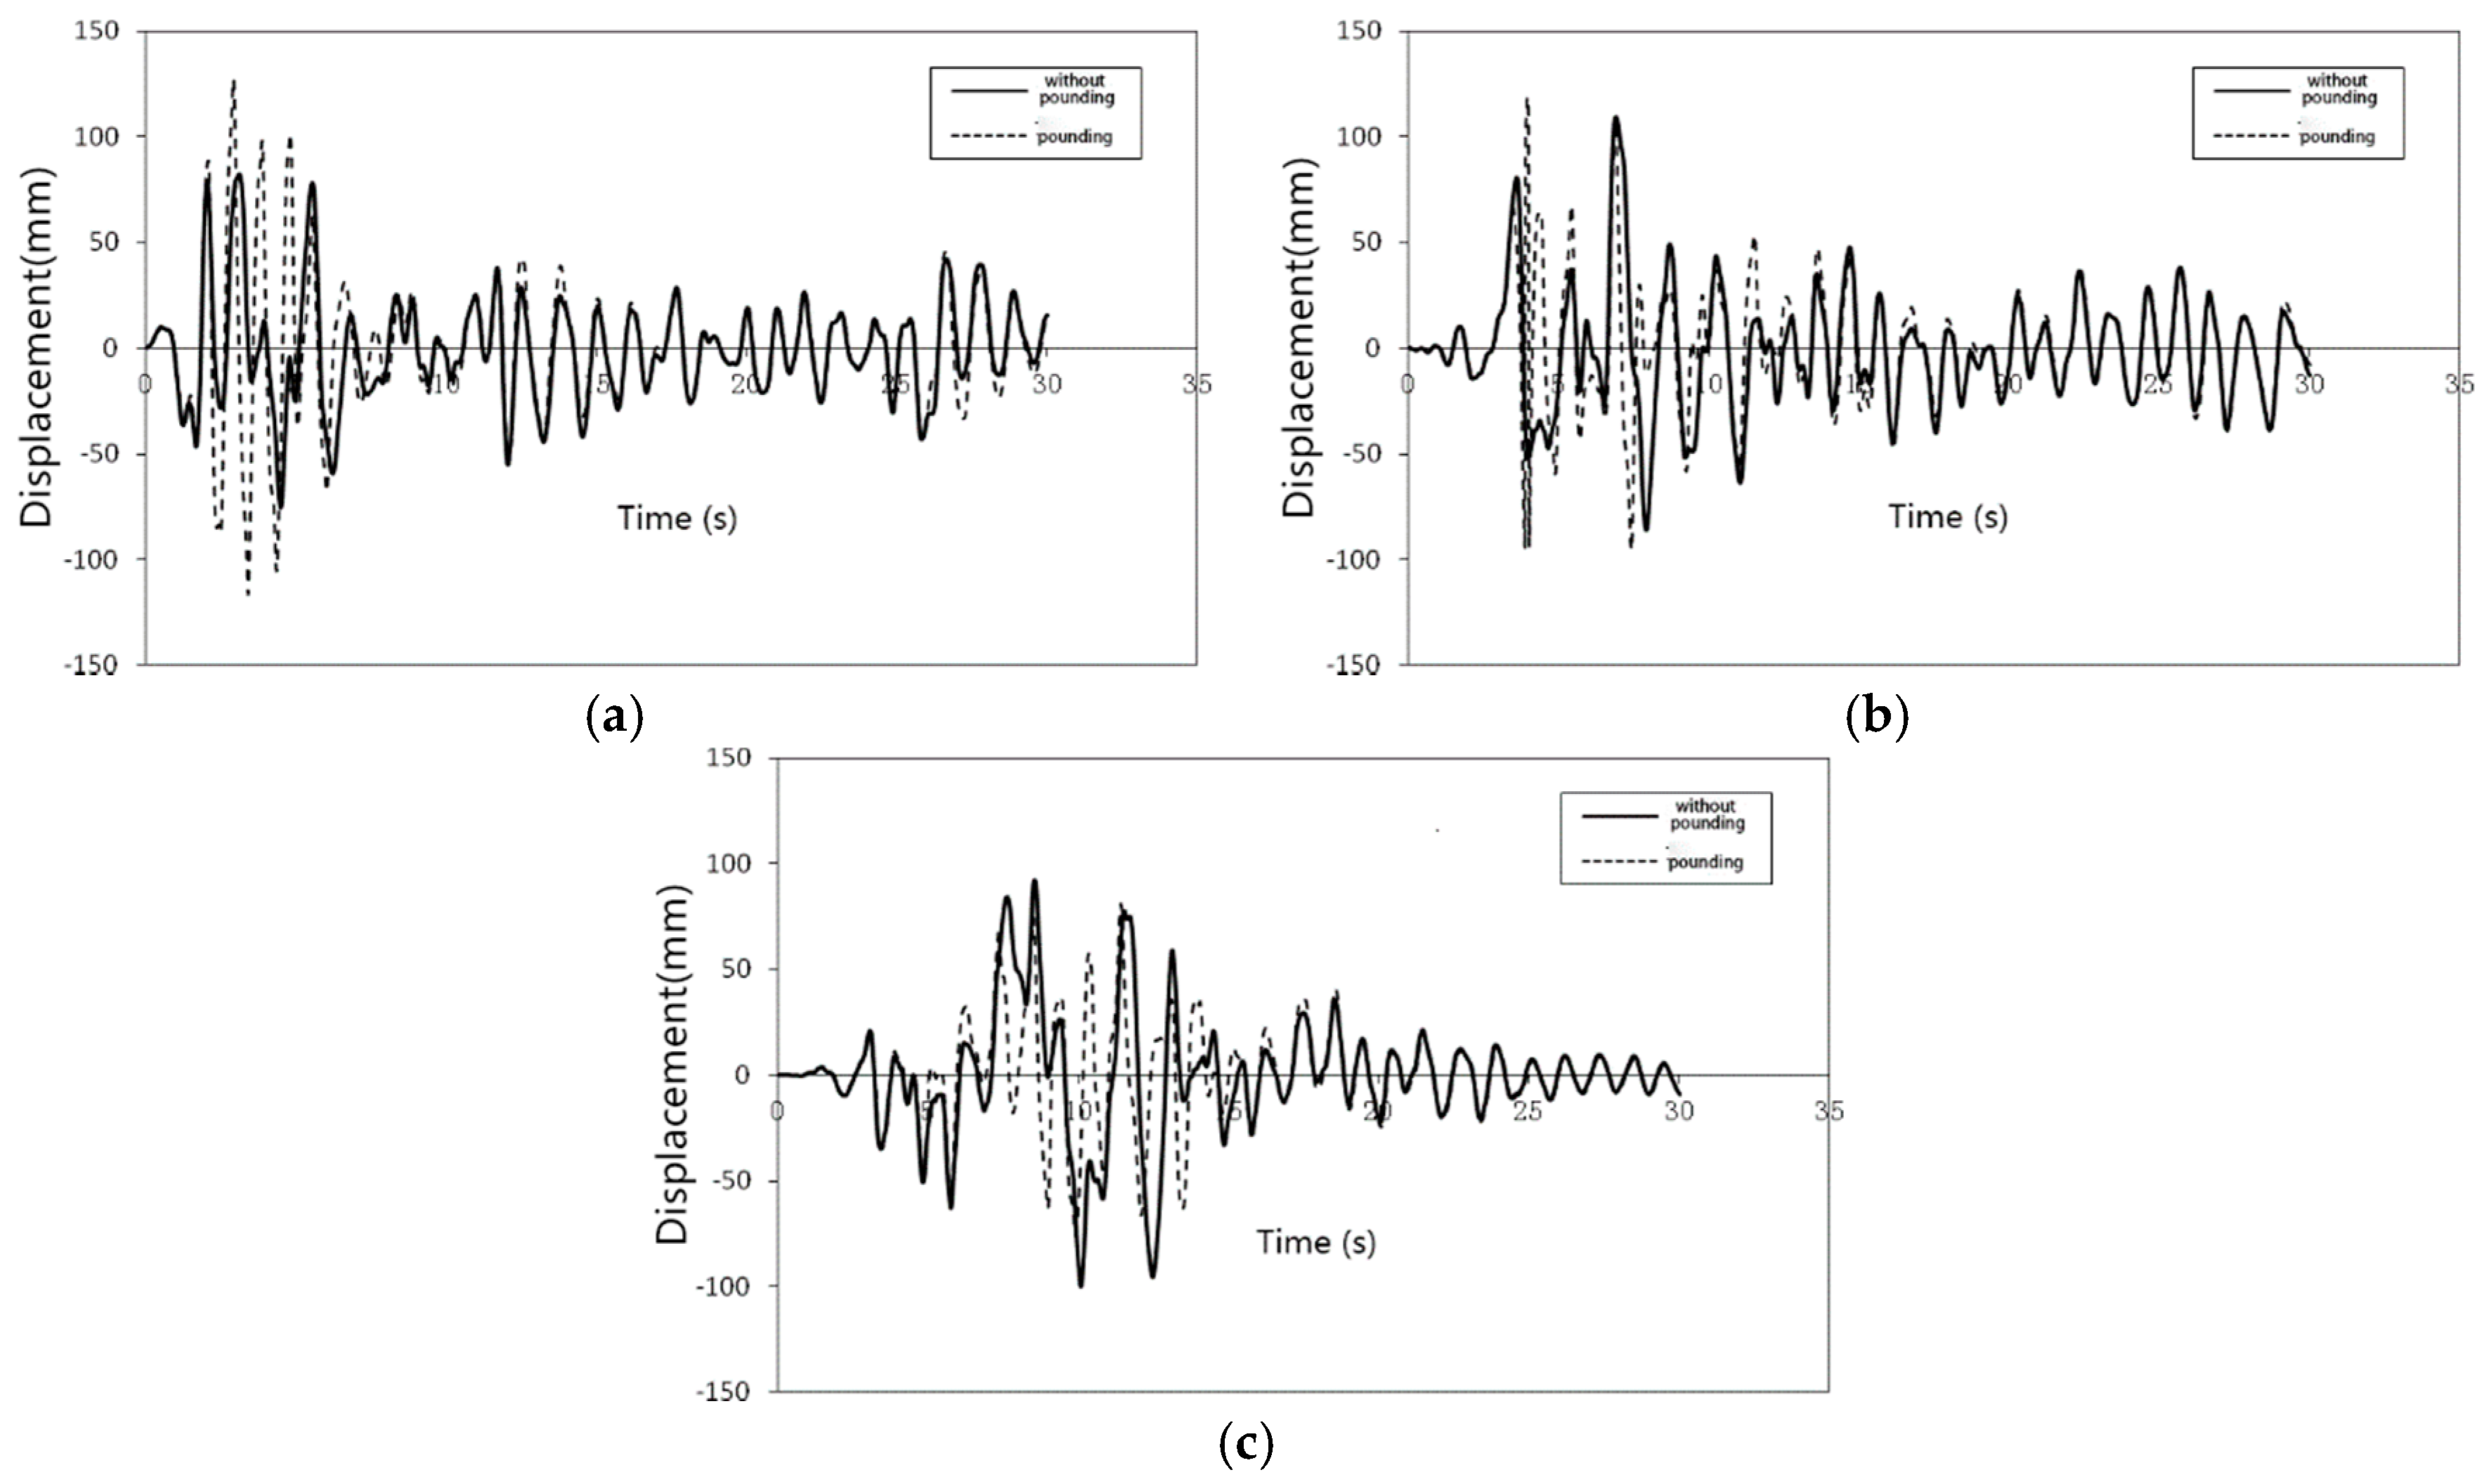
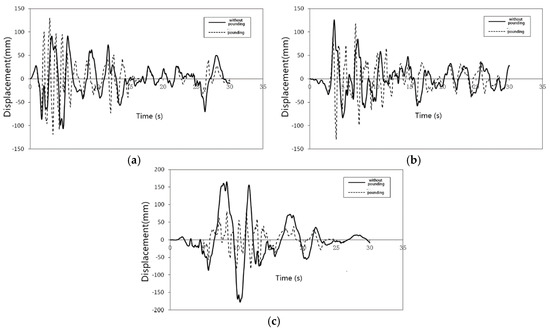
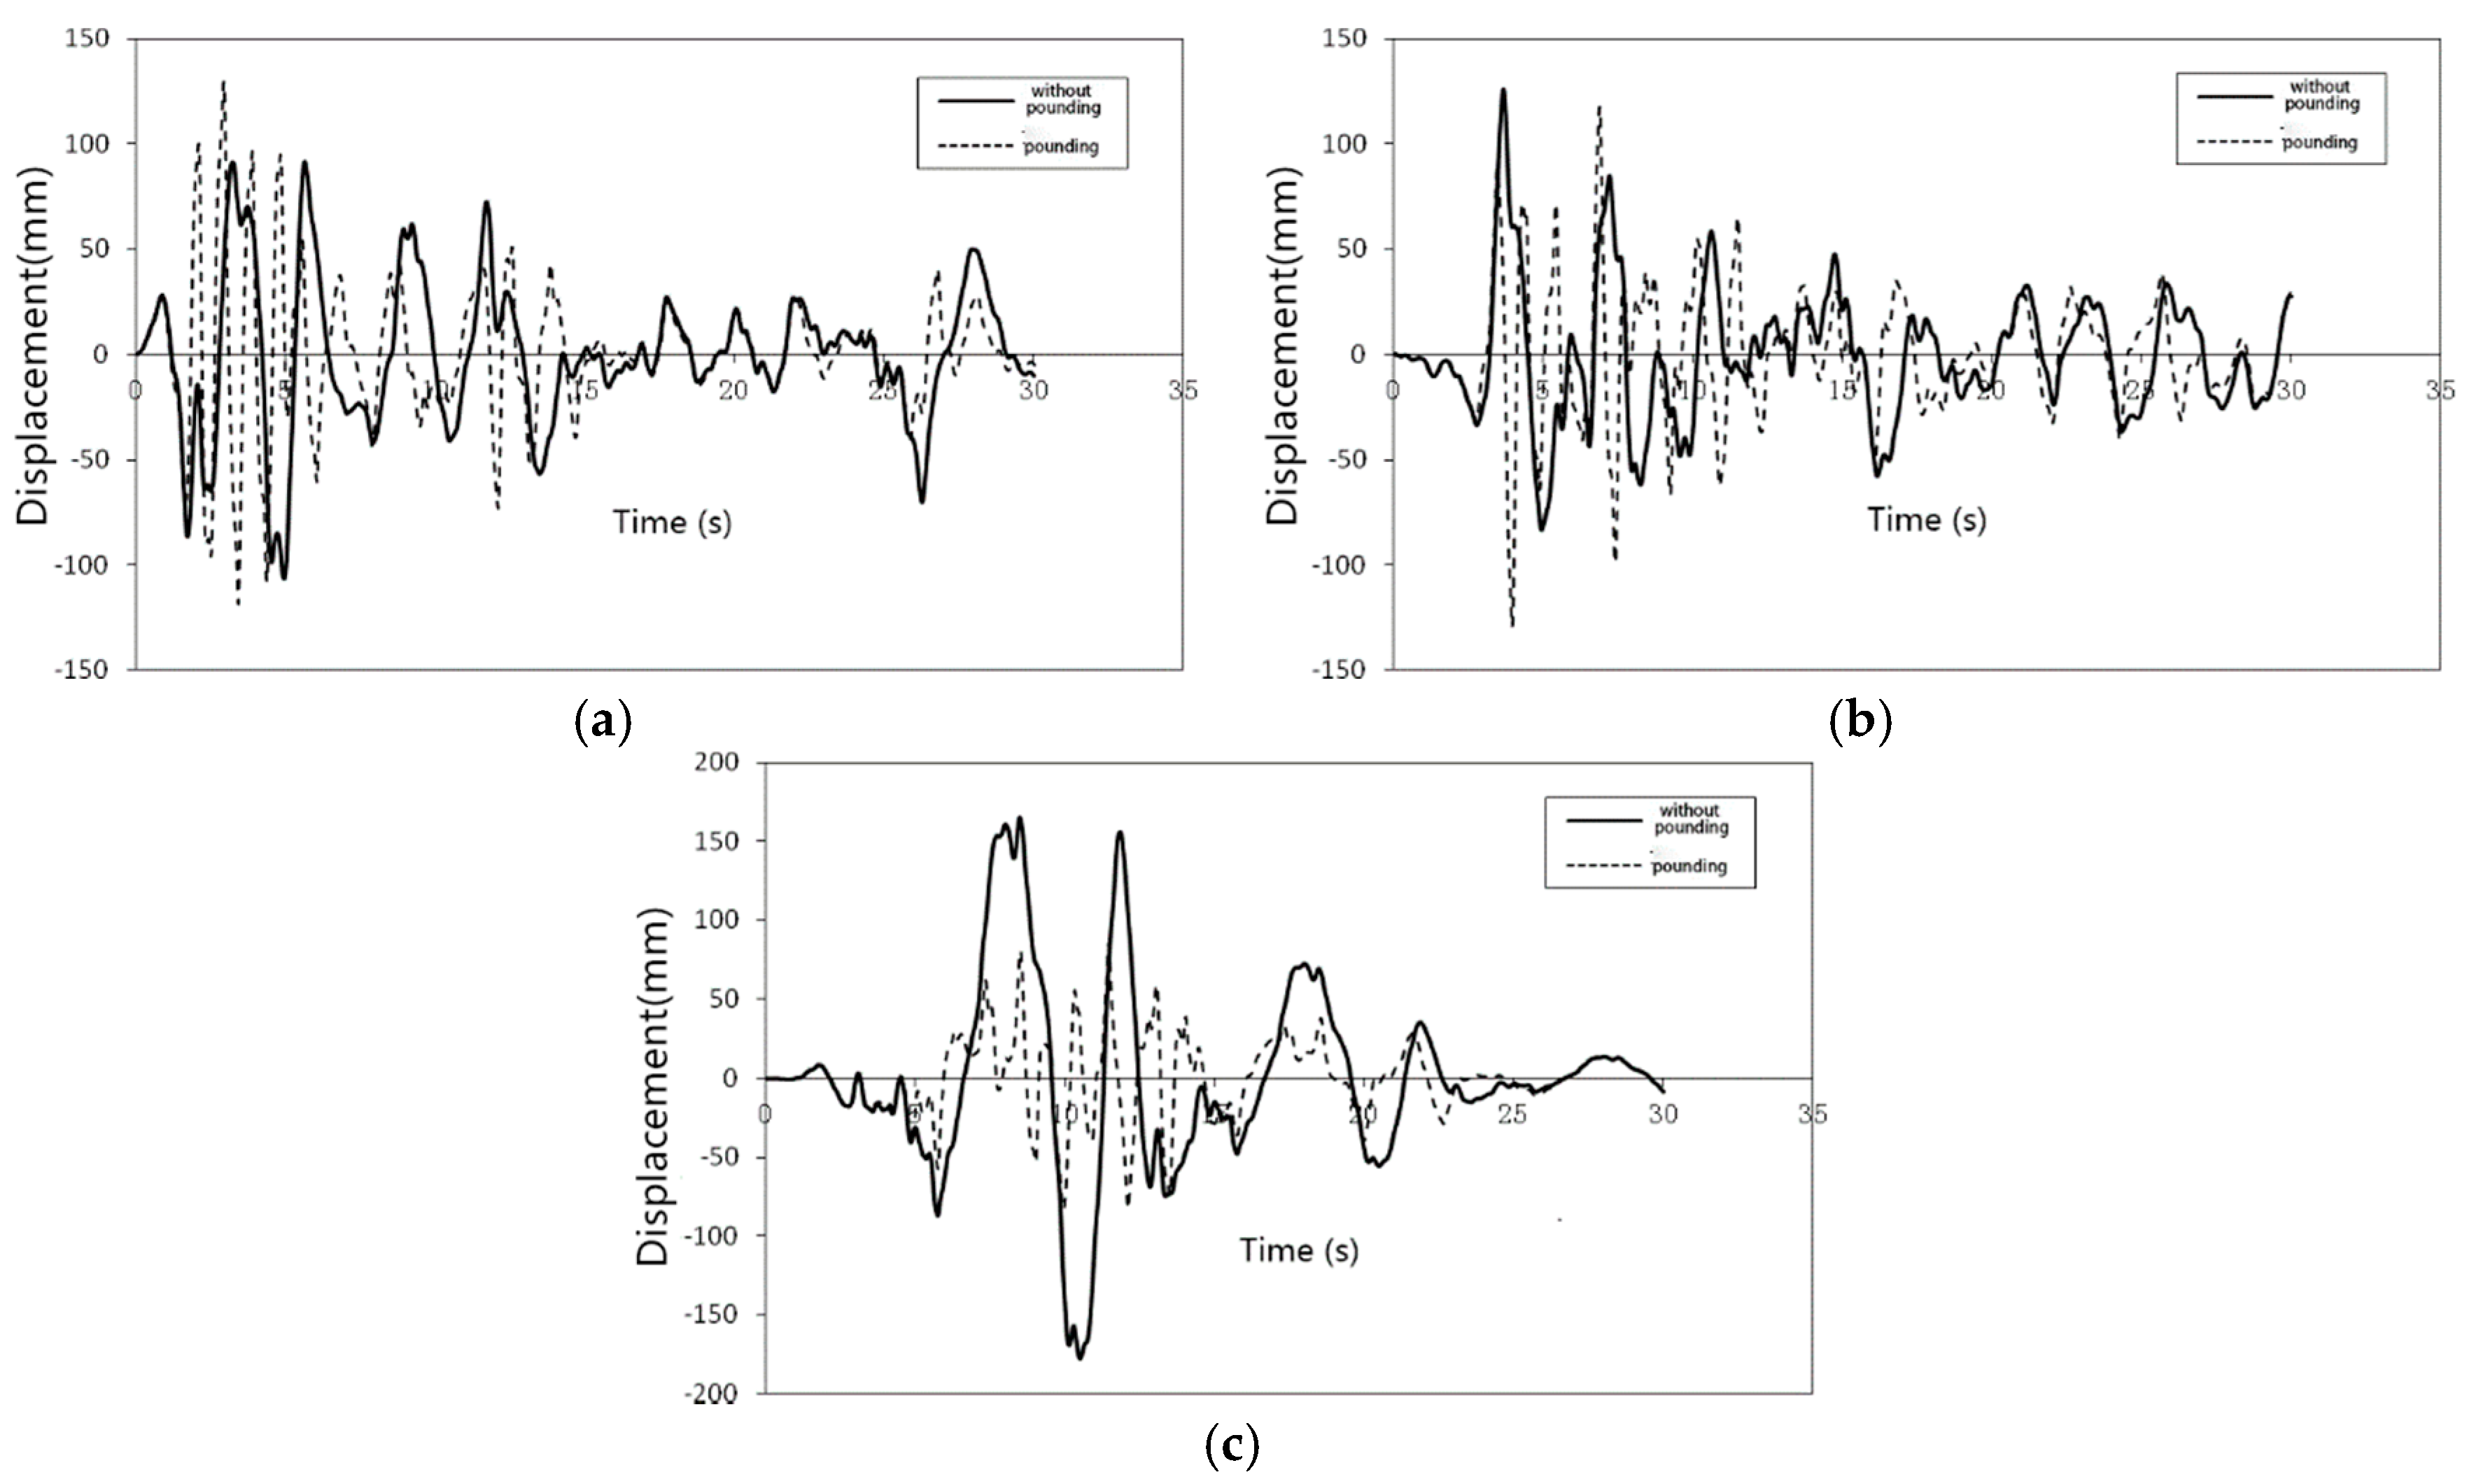
Figure 20 and Figure 21 show the displacement time-history curves of node 858 under different earthquake excitations. It can be inferred that there is little amplification of displacement, while the structure was undergoing pounding under the El Centro and the Taft earthquake excitations. Furthermore, the displacement decreased while the structure was undergoing pounding under the artificial earthquake. For model A (Table 8), 0.55 times growth was observed for the El Centro earthquake, 0.09 times growth for the Taft earthquake, and 0.19 times decrease for the Artificial earthquake). For model B (Table 9), 0.21 times growth was observed for the El Centro earthquake, 0.03 times growth for the Taft earthquake, and 0.52 times decrease for the Artificial earthquake).
Figure 20.
Structural displacement under different earthquakes (model A). (a) El Centro earthquake; (b) Taft earthquake; and, (c) Artificial excitation.
Figure 21.
Structural displacement under different earthquakes (model B). (a) El Centro earthquake; (b) Taft earthquake; and, (c) Artificial excitation.
Table 8.
Maximum structural displacements for model A.
Table 9.
Maximum structural displacements for model B.
There is little effect of pounding on displacement due to the restriction of adjacent structures.
4. Conclusions
A base pounding theoretical model with linear spring-gap element is proposed in this paper. On the basis of this theoretical model, the finite element models of a structure with lead-rubber bearing and friction pendulum isolation bearing are built to analyze their seismic response. Some meaningful conclusions obtained are as follows:
- (1)
- The base pounding theoretical model proposed in this paper can be applied easily and efficiently to analyze base-isolated structures when considering base pounding.
- (2)
- There is a most unfavorable clearance width between adjacent structures and the response of base-isolated structures increases in pounding.
- (3)
- The number of stories in a building should not be uniquely considered to estimate the magnitude of impact force. More considerable factors should be considered, such as the type of structure and the material characteristics
- (4)
- Significant amplification of the story hear-force, velocity, and acceleration were observed in the analysis, which can bring many risks to base-isolated structures. Therefore, it is necessary to consider base pounding in the seismic design of base-isolated structure.
Acknowledgments
The authors would like to express their gratitude to the support of Natural Science Foundation of China (51778538).
Author Contributions
Chengqing Liu proposed the simulation method and wrote the paper; Wei Yang performed the calculation and analyzed the data; Zhengxi Yan and Nan Luo helped analyzing the data; Zheng Lu conceived the idea, provided valuable discussions and revised the paper.
Conflicts of Interest
The authors declare no conflict of interest
References
- Lu, Z.; Wang, Z.X.; Masri, S.F.; Lu, X.L. Particle Impact Dampers: Past, Present, and Future. Struct. Control Health Monit. 2017. [Google Scholar] [CrossRef] [Scilit]
- Lu, Z.; Chen, X.Y.; Zhou, Y. An equivalent method for optimization of particle tuned mass damper based on experimental parametric study. J. Sound Vib. 2017. [Google Scholar] [CrossRef] [Scilit]
- Lu, Z.; Huang, B.; Zhou, Y. Theoretical study and experimental validation on the energy dissipation mechanism of particle dampers. Struct. Control Health Monit. 2017. [Google Scholar] [CrossRef] [Scilit]
- Dai, K.S.; Wang, J.Z.; Mao, R.F.; Lu, Z.; Chen, S.E. Experimental investigation on dynamic characterization and seismic control performance of a TLPD system. Struct. Des. Tall Spec. Build. 2017, 26, e1350. [Google Scholar] [CrossRef] [Scilit]
- Lu, Z.; Chen, X.Y.; Lu, X.L.; Yang, Z. Shaking table test and numerical simulation of an RC frame-core tube structure for earthquake-induced collapse. Earthq. Eng. Struct. Dyn. 2016, 45, 1537–1556. [Google Scholar] [CrossRef] [Scilit]
- Kelly, J.M. A seismic base isolation: Review and bibliography. Soil Dyn. Earthq. Eng. 1986, 5, 202–216. [Google Scholar] [CrossRef] [Scilit]
- Skinner, R.I.; Robinson, W.H.; Mcverry, G.H. An Introduction to Seismic Isolation; Wiley: Chichester, UK; New York, NY, USA, 1993. [Google Scholar]
- Housner, G.; Bergman, L.A.; Caughey, T.K.; Chassiakos, A.G.; Claus, R.O.; Masri, S.F.; Skelton, R.E.; Soong, T.T.; Spencer, B.F.; Yao, J.T. Structural Control: Past, Present, and Future. J. Eng. Mech. 1997, 123, 897–971. [Google Scholar] [CrossRef] [Scilit]
- Lu, Z.; Yang, Y.L.; Lu, X.L.; Liu, C.Q. Preliminary study on the damping effect of a lateral damping buffer under a debris flow load. Appl. Sci. 2017, 7, 201. [Google Scholar] [CrossRef] [Scilit]
- Kanyilmaz, A.; Castiglioni, C.A. Reducing the seismic vulnerability of existing elevated silos by means of base isolation devices. Eng. Struct. 2017, 143, 477–497. [Google Scholar] [CrossRef] [Scilit]
- Lu, Z.; Lu, X.L.; Jiang, H.J.; Masri, S.F. Discrete element method simulation and experimental validation of particle damper system. Eng. Comput. 2014, 31, 810–823. [Google Scholar] [CrossRef] [Scilit]
- Lu, Z.; Chen, X.Y.; Zhang, D.C.; Dai, K.S. Experimental and analytical study on the performance of particle tuned mass dampers under seismic excitation. Earthq. Eng. Struct. Dyn. 2017, 46, 697–714. [Google Scholar] [CrossRef] [Scilit]
- Lu, Z.; Wang, D.C.; Masri, S.F.; Lu, X.L. An experimental study of vibration control of wind-excited high-rise buildings using particle tuned mass dampers. Smart Struct. Syst. 2016, 18, 93–115. [Google Scholar] [CrossRef] [Scilit]
- Park, S.W. Simulation of the seismic performance of the bolu viaduct subjected to near-fault ground motions. Earthq. Eng. Struct. Dyn. 2004, 33, 1249–1270. [Google Scholar] [CrossRef] [Scilit]
- Yen, W.P.; Yashinski, M.; Hashash, Y.; Holub, C. Lessons in bridge damage learned from the wenchuan earthquake. Earthq. Eng. Eng. Vib. 2009, 8, 275–285. [Google Scholar] [CrossRef] [Scilit]
- Tsai, H.C. Dynamic analysis of base-isolated shear beams bumping against stops. Earthq. Eng. Struct. Dyn. 1997, 26, 515–528. [Google Scholar] [CrossRef] [Scilit]
- Malhotra, P.K. Dynamics of seismic impacts in base isolated buildings. Earthq. Eng. Struct. Dyn. 1997, 26, 797–813. [Google Scholar] [CrossRef]
- Komodromos, P. Simulation of the earthquake-induced pounding of seismically isolated buildings. Comput. Struct. 2008, 86, 618–626. [Google Scholar] [CrossRef] [Scilit]
- Polycarpou, P.C.; Papaloizou, L.; Mavronicola, E.; Komodromos, K.; Phocas, M.C. Earthquake induced poundings of seismically isolated buildings: The effect of the vertical location of impacts. In Proceedings of the Tenth Pan American Congress of Applied Mechanics, Cancun, Mexico, 7–11 January 2008. [Google Scholar]
- Komodromos, P.; Polycarpou, P.C.; Papaloizou, L.; Phocas, M.C. Response of seismically isolated buildings considering poundings. Earthq. Eng. Struct. Dyn. 2010, 36, 1605–1622. [Google Scholar] [CrossRef] [Scilit]
- Polycarpou, P.C.; Komodromos, P. On poundings of a seismically isolated building with adjacent structures during strong earthquakes. Earthq. Eng. Struct. Dyn. 2009, 39, 933–940. [Google Scholar] [CrossRef] [Scilit]
- Polycarpou, P.C.; Komodromos, P. Simulating the use of rubber shock absorbers for mitigating poundings of seismically isolated buildings during strong earthquakes. In Proceedings of the International Conference on Computational Methods in Structural Dynamics and Earthquake Engineering, Rhodes, Greece, 22–24 June 2009; pp. 22–24. [Google Scholar]
- Polycarpou, P.C.; Petros, K. Numerical investigation of potential mitigation measures for poundings of seismically isolated buildings. Earthq. Struct. 2011, 2, 1–24. [Google Scholar] [CrossRef] [Scilit]
- Polycarpou, P.C.; Komodromos, P.; Polycarpou, A.C. A nonlinear impact model for simulating the use of rubber shock absorbers for mitigating the effects of structural pounding during earthquakes. Earthq. Eng. Struct. Dyn. 2013, 42, 81–100. [Google Scholar] [CrossRef] [Scilit]
- Polycarpou, P.C.; Komodromos, P. Earthquake-induced poundings of a seismically isolated building with adjacent structures. Eng. Struct. 2010, 32, 1937–1951. [Google Scholar] [CrossRef] [Scilit]
- Polycarpou, P.C.; Papaloizou, L.; Komodromos, P. An efficient methodology for simulating earthquake-induced 3D pounding of buildings. Earthq. Eng. Struct. Dyn. 2014, 43, 985–1003. [Google Scholar] [CrossRef] [Scilit]
- Mavronicola, E.A.; Polycarpou, P.C.; Komodromos, P. The Effect of modified linear viscoelastic impact models on the pounding response of a base-isolated building with adjacent structures. In Proceedings of the Eccomas Thematic Conference on Computational Methods in Structural Dynamics and Earthquake Engineering, Crete Island, Greece, 25–27 May 2015. [Google Scholar]
- Anagnostopoulos, S.A. Pounding of buildings in series during earthquakes. Earthq. Eng. Struct. Dyn. 1988, 16, 443–456. [Google Scholar] [CrossRef] [Scilit]
- Pant, D.R.; Wijeyewickrema, A.C. Equivalent viscous damping for modeling inelastic impacts in earthquake pounding problems. Earthq. Eng. Struct. Dyn. 2004, 33, 897–902. [Google Scholar]
- Fan, J.; Lin, T.; Wei, J.J. Response and protection of the impact of base-friction-isolated structures and displacement-constraint devices under near-fault earthquake. China Civ. Eng. J. 2007, 5, 10–16. [Google Scholar]
- Ye, X.G.; Xie, Y.K.; Li, K.N. Earthquake response analysis of base-isolated structure considering side impact. J. Earthq. Eng. Eng. Vib. 2008, 4, 161–167. [Google Scholar]
- Goldsmith, W. Impact: The Theory and Physical Behaviour of Colliding Solids; Edward Arnold: London, UK, 1960; pp. 182–184. [Google Scholar]
- Lankarani, H.M.; Nikravesh, P.E. A contact force model with hysteresis damping for impact analysis of multibody systems. J. Mech. Des. 1990, 112, 369–376. [Google Scholar] [CrossRef] [Scilit]
- Susendar, M.; Reginald, D.A. Hertz contact model with non-linear damping for pounding simulation. Earthq. Eng. Struct. Dyn. 2006, 35, 811–828. [Google Scholar]
- National Standard of People’s Republic of China, Code for Seismic Design of Building; China Architecture & Building Press: Beijing, China, 2010; GB 50011–2010.

© 2017 by the authors. Licensee MDPI, Basel, Switzerland. This article is an open access article distributed under the terms and conditions of the Creative Commons Attribution (CC BY) license (http://creativecommons.org/licenses/by/4.0/).