Article

Energy Saving Potential of PCMs in Buildings under Future Climate Conditions

by
Abdo Abdullah Ahmed Gassar
and
Geun Young Yun
*
Department of Architectural Engineering, Kyung Hee University, 1732, Deogyeong-daero, Giheung-gu, Yongin si 17104, Gyeonggi-do, Korea
*
Author to whom correspondence should be addressed.
Appl. Sci. 2017, 7(12), 1219; https://doi.org/10.3390/app7121219
Submission received: 27 October 2017 / Revised: 21 November 2017 / Accepted: 22 November 2017 / Published: 25 November 2017
(This article belongs to the Special Issue Phase Change Material (PCM) 2017)

Abstract

:
Energy consumption reduction under changing climate conditions is a major challenge in buildings design, where excessive energy consumption creates an economic and environmental burden. Improving thermal performance of the buildings through support applying phase change material (PCM) is a promising strategy for reducing building energy consumption under future climate change. Therefore, this study aims to investigate the energy saving potentials in buildings under future climate conditions in the humid and snowy regions in the hot continental and humid subtropical climates of the east Asia (Seoul, Tokyo and Hong Kong) when various PCMs with different phase change temperatures are applied to a lightweight building envelope. Methodology in this work is implemented in two phases: firstly, investigation of energy saving potentials in buildings through inclusion of three types of PCMs with different phase temperatures into the building envelop separately and use weather file in the present (2017); and, secondly, evaluation of the effect of future climate change on the performance of PCMs by analyzing energy saving potentials of PCMs with 2020, 2050 and 2080 weather data. The results show that the inclusion of PCM into the building envelope is a promising strategy to increase the energy performance in buildings during both heating and cooling seasons in Seoul, Tokyo and Hong Kong under future climate conditions. The energy savings achieved by using PCMs in those regions are electricity savings of 4.48–8.21%, 3.81–9.69%, and 1.94–5.15%, and gas savings of 1.65–16.59%, 7.60–61.76%), and 62.07–93.33% in Seoul, Tokyo and Hong Kong, respectively, for the years 2017, 2020, 2050 and 2080. In addition, BioPCM and RUBITHERMPCM are the most efficient for improving thermal performance and saving energy in buildings in the tested regions and years.

1. Introduction

Reducing the cooling and heating requirements of buildings as the climate changes is one of the main challenges in buildings design worldwide [1,2]. The building sector consumes 20–40% of all energy, especially in developed countries [1,3], and nearly 50% of the energy used in buildings is consumed by Heating Ventilation and Air Conditioning (HVAC) [3,4]. In addition, 30–40% of greenhouse gas emissions are caused by energy consumption in buildings [2,5]. Therefore, in the absence of energy improvements in buildings, global energy demand will increase about 50% by 2050 [6].
Improving energy performance in buildings can be achieved by both passive means (development of the building envelope) [6] and active means (smart HVAC equipment) [7]. Investment in the building envelope is an ideal solution because a passive design can achieve long-term energy efficiency and carbon removal with the help of the sun. In addition, it will enhance thermal comfort, which increases energy savings by stabilizing the indoor air temperature [3,4]. Building envelopes are distinguished by their ability to regulate the heat exchange between the interior and exterior environments, which affects the cooling and heating requirements, occupant comfort, and the ability to integrate new building materials and systems [8].
Many technologies have been developed to reduce building energy consumption and improve thermal comfort, for example insulation materials [6], double-glazed reversible window systems [9], heat insulating solar glass [10], hybrid walls integrated with heat collectors, and solar thermal power generators [11]. Reinforcing building envelopes with thermal insulation is an effective strategy that has been widely used to reduce heat dissipation from the interior environment to the exterior environment, especially in lightweight buildings [12]. Thermal mass application in building envelopes has enhanced energy efficiency and reduced greenhouse gas emissions by allowing buildings to store heat energy as latent heat, which affects the indoor temperature, energy requirements, and thermal comfort of the occupants [12].
Systems of thermal energy storage can create a balance in the energy demand between the nocturnal and diurnal periods by storing latent heat [8]. Several studies [3,4,13,14,15,16] have been published about using phase change materials (PCMs) in buildings. PCMs are distinguished by their ability to store high amounts of energy inside short temperature ranges through their high melting temperatures [13]. They are a unique alternative for increasing energy efficiency and improving thermal comfort in buildings [14,15]. They can be included in the envelopes of buildings in different ways to achieve passive heating and cooling. In this context, a passive PCM system is a sustainable way to improve occupant comfort and energy performance, especially in the extreme weather conditions of winter and summer. Therefore, this study evaluates the effect of future climate change on the energy saving potential of applying various PCMs to lightweight building envelopes in different climatic zones (Seoul, Tokyo, and Hong Kong), analyzing the buildings’ heating and cooling loads and peak energy demands according to the phase change temperatures of the PCMs. An additional investigation considers the buildings’ thermal performance in the interior environment.

2. Background

2.1. Energy Consumption in Buildings

Population growth, comfort level, building services, building age, and the hours spent inside a building have all caused the energy consumption levels of buildings to increase until they rival the levels of the industry and transport sectors [16]. In the EU, 40% of all annual energy is consumed by the building sector, and 50% of that is consumed by HVAC systems [4]. Forty-one percent of all the annual energy used in the US is consumed by commercial and residential buildings, and, of that, 37% and 43% are consumed for heating and cooling, respectively [11]. Several studies have reported that energy consumption in developing countries relates to population growth, urbanization levels, and growing living standards, which are related to urbanization rates [10,17]. In India, 30% of the population lives in cities. In China, it is 45%, and those percentages are expected to exceed 50% and 70% in the next 25 years in India and China, respectively. In 2030, the Chinese population will reach the saturation level, whereas the Indian population is expected to grow until 2050. Meanwhile, Brazil and Russia do not expect a significant change in their populations despite urbanization that leads to high rates of new construction [10].
According to the International Energy Agency, 50% of the population living in cities consumes two-thirds of the world’s energy, and that rate will rise to 73% by 2030, at which point it will be causing 70% of global CO2 emissions Therefore, reducing the energy consumed in and by buildings is important [18,19,20]. Several researchers have predicted that global energy demand in buildings will double by 2050 because 0.8 billion people lack adequate housing, 1.3 billion people currently lack electricity, and 3 billion people around the world still depend on traditional fuels such firewood, straw, and animal waste for cooking and heating [10,21]. Meanwhile, the migration of populations to cities involves lifestyle changes that increase the living space per person and contribute to the increasing energy demand expected in the future [22,23]. Building energy consumption data in developing countries have shown high increases in recent years, an average annual growth of about 2.2% in the past decade. In China, the energy consumed in and by buildings exceeds that consumed in US buildings, and it is expected to increase significantly in the coming years, driven by demand for new buildings [24]. In Sweden, the residential and services sector consumed 40% of the country’s total energy in 2011, and 60% of that was for heating and hot water generation [1]. Nakagami et al. [25] reported that, in Asia, household energy consumption will rise in the future, which will affect developing countries in Asia as well. As shown by this review of global energy demand, existing policies are insufficient to reduce energy consumption in general.

2.2. Relationship between Climate Change and Energy Consumption

The climate is the main determinant of energy demand. Changes in the climate will alter the demand and demand patterns of energy use in buildings [26]. There is agreement that a hotter climate will increase energy demand for air conditioning [27,28]. As shown by Wang using existing buildings data in the USA, buildings in moderate climates will see increasing energy demand for cooling, whereas buildings in cold zones will reduce their energy consumption for heating systems because of warmer winters [29]. A study by Kalvelage et al. examined the effects of climate on comfort hours and energy consumption in buildings using data from five locations around the USA. The one-year results showed that the number of hours requiring heating increased, while the need for cooling decreased, along with number of the global comfort hours [30]. Another study in Spain included various climates and data from existing buildings from representative cities in Spain. It used the degree day method and concluded that cooling demand will rise between 10.7% and 29.6%, although heating demand has decreased 30–36% in some cities [31]. A study in Chile considered the optimization of annual energy demand in office buildings under the influence of climate change using the nine climatic zones that represent the country’s main inhabited areas in 2020, 2050, and 2080. That research clarifies how future climate scenarios will affect the energy demand for different types of office buildings in Chile and how their shape and enclosure can be optimized [28]. A study in the Guangdong province in southern China found that cooling and heating demands are increasing significantly because of global warming. The average increase in surface temperature has reached 0.38 °C per decade, the highest rate in 50 years [32]. Several previous studies have shown that climate change directly influences a building’s external conditions, which affects energy demand. Therefore, increasing the energy efficiency of buildings is an effective strategy for reducing energy consumption and mitigating greenhouse gas emissions. PCMs represent one main measure for adapting to climate changes in a building’s design and operational stages.

2.3. Application of PCMs in Buildings

Air conditioning systems in buildings represent a significant part of global energy use. Therefore, it is necessary to improve the energy performance of buildings, which can be achieved by passive means in the building envelope [6] or active means with smart HVAC equipment [7]. The building envelope regulates the heat exchange between the indoor and outdoor environments and greatly affects building energy requirements and the thermal comfort of occupants. In addition, it has potential to integrate new materials and systems. PCMs are a promising strategy for improving the energy performance of buildings through their high energy storage capacity. When PCMs are incorporated into a building envelope (in the walls or other components [19]), they can store and release energy as latent heat in short temperature ranges, which results in a large increase in the building’s thermal mass [33].
PCM application in buildings reduces heating and cooling loads and carbon emissions and provides excellent living comfort [20,34,35]. A considerable number of researchers have published studies about the application of PCMs in buildings. Cabeza et al. [36] investigated the use of microencapsulated PCMs on concrete walls. Their experimental results showed that the indoor temperature of the PCM-enhanced concrete building was 1 °C lower than that of the building without PCM. In addition, the maximum temperature in the space with the PCM-enhanced wall shifted by two hours. Lee et al. [37] showed that integrating a thin PCM layer into the walls of residential buildings modified the heat flow fluctuations as well as the temperature. Their experimental results showed 30–40% of the peak heat flux reductions, a 2–6 h delay in the peak heat flux, and maximum daily heat transfer reductions of 3–27%. Soares et al. [38] found that applying a PCM to the drywall in a lightweight steel-framed building improved energy efficiency by 10–60%, depending on the climate zone. Yoon-Bok Seong and Jae-Han Lim [19] reported that the peak heating and cooling loads of a building decreased depending on the type and phase change temperature of the PCM used. A study in New Zealand reported that using a high-melting-point PCM with an underfloor heating system led to an important shift in peak loads. In addition, using a low-melting-point PCM in the walls and ceiling provided the comfort needed in the building [39]. Zhu et al. [16] found that the optimal melting temperatures for internal PCMs are affected by the indoor air temperature, whereas the optimal melting temperatures for external PCMs are affected by the outdoor air temperature.
A passive PCM heating and cooling system is a sustainable way to ensure thermal comfort and reduce the heating and cooling demand in buildings. For example, a study in Australia identified the ability of PCMs to reduce HVAC demand in main Australian cities. Those results showed that applying PCMs in buildings would decrease diurnal and nocturnal temperature fluctuations and increase the thermal comfort of occupants [40]. Another study investigated the energy savings from applying PCMs to lightweight steel-framed buildings in EU climates; those results suggest that applying PCMs to the walls improved the energy performance in all EU climates [41]. Sage-Lauck et al. [42] described how using PCMs in a passive house would decrease overheating in the summer by significantly reducing the hours of overheating in a specific area and thereby improving thermal comfort. Saffari et al. [3] described applying a PCM with a high melting point to building envelope models and found that they improved the heating and cooling energy performance and achieved high energy savings. A study in Chile evaluated the influence of PCMs on energy performance in relocatable lightweight buildings under different weather conditions. Those results showed that energy saving potentials are limited in tropical and snow climate regions and acceptable in arid and warm temperate climates [4]. Goudarzi and Mostafaeipour reported that using passive techniques reduced the total energy loss through the building envelope in hot and dry regions [43]. In addition, several other previous studies have investigated the effects of PCMs on energy performance and the hours of comfort in buildings using a fixed thermostat temperature [22,44]. Although fixed thermostat temperature control could be an option for a specific climate zone and building type, but it does not consider the influences of the outdoor and indoor boundary conditions or the building characteristics.
Looking at the existing literature regarding PCMs, it is clear that PCMs provide great benefits in the context of building energy consumption. It is also clear that climatic conditions play a huge role on the performance of PCMs. As such. The current study will make two major contributions to the existing literature. First, we study energy saving potentials of three different types of PCMs in three humid regions (i.e., Seoul, Tokyo and Hong Kong) and two snowy regions (i.e., Seoul and Tokyo). Secondly, we assess the effect of future climate change on the performance of PCMs by analysis energy saving potentials of PCMs under 2020, 2050 and 2080 weather data.

3. Materials and Methods

3.1. The Simulation Model

The studied building is a Department of Energy (DOE) [45] medium office building model. It was selected from the U.S. Department of Energy Commercial Reference Building Models from the National Building Stock as the base case model for this energy simulation (Figure 1). The construction details of the lightweight building model are shown in Table 1 and Table 2. The model modified according to a previous study [3], ANSI/ASHRAE standard 140-2011 [46], and EnergyPlus [47]. Three PCMs with different melting temperatures were evaluated, taking into account the heating and cooling set point temperatures of 20 °C and 26 °C, respectively: DuPonEnergainPCM (21.6 °C), RUBITHERMPCM (25 °C) and BioPCM (29 °C). The physical properties of the PCMs are given in Table 3. A set of numerical simulations was conducted using the EnergyPlus software and assuming that each PCM was applied separately between the fiberglass quilt and plasterboard of the interior wall and roof (Figure 2). The interior environmental characteristics with and without PCM were analyzed to show the optimal method of PCM application. The PCM application in the building envelope was in a continuous layer of plastic encapsulation that looks like a mat.
Dynamic energy simulations were conducted using EnergyPlus (8.0, USA Department of Energy, Washington, DC, USA)software for three climate zones (Seoul, Tokyo, and Hong Kong) in two different climatic conditions: humid tropical and subtropical. The simulations were run for one year during the present (2017), 2020, 2050, and 2080 using the conduction finite difference algorithm (CondFD), which discretizes the building envelope (ceilings, floors, and walls) into different nodes (the user can select Crank-Nicholson or fully implicit discretization) and numerically solves the appropriate heat transfer equations using the finite difference method [18,48,49]. The current study used fully implicit discretization. To consider specific heat changes during the PCM simulation, the CondFD method is paired with the enthalpy temperature function, which reads user inputs of the enthalpies at different temperatures. The enthalpies in each node get updated in each iteration and are then used to develop the equivalent specific heat at each time step.
Assuming fixed state conditions (Figure 3), thermal conduction for the control volume “i − 1” to control volume “i” can be computed by Fourier’s equation. During a time-step, the increase in the enthalpy by the control volume “i” is summed by Equation (2). Equation (1) is included in Equation (2) to obtain Equation (3) and to expression about the specific changes in enthalpy as a temperature change multiplied by the specific heat capacity. Based on the user input data and Equation (4) the specific heat can be updated in each iteration using the Enthalpy–Temperature function. Through these processes, the node enthalpies are updated at each time step, and the changing characteristics of PCM can be accurately analyzed. In the CondFD algorithm, all elements are divided or discretized using Equation (5), which depends on a space discretization constant c, the thermal diffusivity of the material α, and the time step. The default space discretization value of three (equivalent to a Fourier number (Fo) of 1/3) has been used [19,48].
q i j + 1 = k ( j + 1 T i j + 1 T i 1 ) Δ x k ( j + 1 T i + 1 j + 1 T i ) Δ x = k   ( j + 1 T i + 1 j + 1 T i 1 ) Δ x
( ρ Δ x ( j + 1 h i j h i ) Δ t ) = ( j + 1 q i j q i )
( ρ c p Δ x ( j + 1 T i j T i ) Δ t ) = k ( T i + 1 j + 1   T i j + 1 ) Δ t + k ( T i 1 j + 1   T i j + 1 ) Δ t
C p = ( h i j + 1 h i j ) ( T i j + 1 T i j )
Δ x = C × α × Δ t = α × Δ t Fo
To ensure model accuracy with the CondFD and simulation process, the simulation time step was set to 1 min and the space discretization to 3 min. The CondFD algorithm and PCM were verified and validated analytically, through comparative testing, and empirically by Tabares-Velasco et al. [48,49]. The PCM algorithm in EnergyPlus was validated against observed data from other researchers [28,40,42] and the experimental data of Kuznik and Virgone, who investigated the thermal performance of a PCM copolymer composite wallboard in a lightweight building in a full scale test [50]. The energy and thermal performance of the DOE medium office building model was analyzed for two periods, winter and summer. Including the PCM in the wallboard reduced wall surface temperature fluctuations, enhanced thermal comfort, and achieved energy savings.

3.2. Building Description

The studied building is a DOE [45] medium office building model with a total area of 4982.19 m2. It was selected from U.S. Department of Energy Commercial Reference Building Models from the National Building Stock for the energy simulation in Building (Figure 1). It consists of three floors, each with an area of 1660.73 m2. The window to wall ratio is 33% of the total wall area per floor. The construction details of the building were based on previous studies [3,46,47]. The building models are considered as an office building space. To investigate the influences of PCMs on the heating and cooling energy performances, four building prototypes are considered. The reference model without PCM is compared to another three with PCM incorporated into its envelopes. The PCMs were installed on the interior surfaces between the fiberglass and plasterboard of the roof and all four sides of the interior walls (Figure 3). The construction details of the lightweight building model are shown in Table 1 and Table 2 and the physical properties of the used PCMs are listed in Table 3.

3.3. Phase Change Materials

Three types of the phase change materials, BioPCM [51,52], DuPonEnergainPCM [48,53] and MRUBITHRMPCM [3,54,55], were selected to serve as the PCM which is contained in the supporting materials, Table 3. Their melting points vary: 29 °C fo BioPCM; 21.6 °C for DuPonEnergainPCM); and 25 °C for RUBITHRMPCM. Moreover, they vary in their heat capacity, and, as previous studies [3,40,51,52] reported, these materials can store a large amount of energy in short temperature ranges when incorporated into a building envelope.
PCMs are derived from organic materials. It is characterized as less flammable and can be manufactured. Additionally, it is highly effective in the humid climate zones such as in Seoul, Tokyo and Hong Kong. PCMs can also be manufactured such that the melting points can vary (−22.7 °C to 78.33 °C for BioPCM; −9 °C to 80 °C for DuPonEnergainPCM; and −20 °C to 27 °C for MRUBITHRMPCM), making it easy to use in different climate zones.
PCMs were separately incorporated on the interior surfaces between the fiberglass and plasterboard of the roof and all four sides of the interior walls of the building envelope. During the day when the ambient temperature is high (the cooling season), PCM melts (changes phase from solid to liquid) storing a large amount of thermal energy, which is called the charging process. This reduces the thermal gains of the building, and hence less energy is consumed by the air conditioning system (HVAC) to cool the building. As the PCM freezes at night (i.e., changes phase from liquid to solid), the heat is dissipated into both the building and the surrounding environment. This process is called discharging process, which is useful during the heating season.

3.4. Weather Data for Climate Change

This study included humid tropical and subtropical climates according to the Köppen–Geiger classification (Table 4), and three climatic zones. The weather data files were obtained from Energy Efficiency & Renewable Energy (EERE). A representative region (Seoul, Tokyo, and Hong Kong) was chosen for each of the three climatic zones. Data were transformed into EnergyPlus weather format for use in EnergyPlus. The future climate (2020, 2050 and 2080) was modeled using the UK Met Office Hadley Centre Coupled Model HadCM3-A2 [56]. The HadCM3 model predicts future trends in average values; it has a grid resolution of 2.5° × 3.8°, which means that each simulated grid element covers around 278 × 422 km2. The weather data used in this study should be understood as probable expected climatic changes for each specific period using open boundary conditions in the selected locations with a margin of error that corresponds to the grid size of the HadCM3 model [29,57].

3.5. Simulation Method

The simulation used weather data for Tokyo, Seoul, and Hong Kong, which were obtained from Real-Time Weather Data at Energy Efficiency & Renewable Energy (EERE). All simulations were carried out using EnergyPlus for one year. In addition, the simulations took into account the climate change scenarios (2020, 2050 and 2080) for each climate zone. The PCMs were installed between the fiberglass and plasterboard of the roof and all four sides of the interior walls (Figure 3).
The thermostat cooling and heating set points and HVAC operation schedules for the different regions were assigned according to Asian building codes (APEC) [58], assuming that the simulated zone is office building. The heat balance algorithm used for the cases without and with PCM was the finite difference method, mentioned above.
The cooling and heating energy consumption were calculated using the ideal load module of EnergyPlus that is an ideal variable Air volume terminal unit with variable supply temperature and humidity. It is distinguished because of its ability to supply the necessary cooling and heating air at specified conditions to meet the zone heating or cooling load without defining water loops and air loops. In addition, the purpose of this study was to calculate the total energy requirement of the office building under various conditions, thus the Ideal System was used.
For each region, simulations have performed using PCMs with different melting temperatures and different latent heat: 29 °C and 219 kJ/kg, 25 °C and 170 kJ/kg, and 21.6 °C and 130 kJ/kg for BioPCM, RUBITHERMPCM and DuPonEnergainPCM, respectively. Most importantly, the phase change has taken into account enthalpy temperature for all PCMs. The indoor environment characteristics with and without the PCM were also analyzed during the cooling and heating periods.

4. Results

4.1. Effect of PCM on Indoor Environment

To evaluate the performance of PCMs, researchers usually look at the indoor temperature profile during a short representative period in the summer, winter, or mid-season [14,44]. The evaluation then compares the energy used with and without the PCM. Therefore, this study considers two days in August (the cooling period) and two days in January (the heating period) to evaluate the indoor environment.
Figure 4 and Figure 5 show the zone air temperature for 14–15 August and 14–15 January in Hong Kong. The figures show that integrating PCMs resulted in a reduced indoor air temperature peaks in August (Figure 4) and an indoor air temperature between 17 °C and 21.9 °C, which is near the comfort range of 18 °C–24 °C for Hong Kong, in January (Figure 5).
This model used PCMs with melting points of 21.6 °C (DuPonEnergainPCM), 25 °C (MRUBITHRMPCM), and 29 °C (BioPCM). When the zone reached the melting temperature, the PCMs melted and stored energy as latent heat through the process of melting (changing phases), which prevented the ambient temperature of the zone from rising. At night, when the temperature decreased below 21.6 °C, 25 °C, or 29 °C, the PCMs resolidified, discharging the stored heat and increasing the zone ambient temperature. Thus, incorporating PCMs reduced the average temperature of the zone by 1.2–2 °C in August (Figure 4) and increased it by 0.3–0.5 °C in January (Figure 5) in Hong Kong. Figure 4 and Figure 5 also show that integrating the PCMs decreased the time in which the zone temperature was outside the comfort zone.
Figure 6 and Figure 7 show the operative temperature with and without PCMs for 14–15 August and January in Tokyo. As shown in the figures, installing a PCM on the interior surface of the building envelope reduced the peak operative temperature about 1 °C in August in Tokyo. The PCMs also maintained the operative temperatures during both the heating and cooling seasons; for example, with a PCM, the operative temperature remained within range on both 14–15 January (17–21.2 °C) and 14–15 August (23.3–24.6 °C). In contrast, the operative temperature swung up and down from night to day without a PCM, 16.7–22.1 °C and 22.6–24.8 °C in January and August, respectively.
Moreover, a significant mitigation of the swings in daily surface temperature can be observed when using a PCM, as shown in Figure 8, Figure 9, Figure 10 and Figure 11: for example, in Figure 9, the peak surface temperature of the east wall in August decreased from 25.7 °C on the first day to 24.6 °C during the second day, and the surface temperature of the east wall in January increased from 18.1 °C on the first day to 23.5 °C during the second day, as shown in Figure 11. The differences are clear between the surface temperatures of the south and east walls with and without a PCM (Figure 8, Figure 9, Figure 10 and Figure 11).
To get a more comprehensive view of the improved sense of comfort offered by the PCMs, a deeper analysis simulated the charging and discharging processes in the building envelope (Figure 12, Figure 13, Figure 14 and Figure 15) to evaluate the indoor air temperature and operative temperature in the building. The charging and discharging processes during the night and day on the southern and eastern walls are significant, as shown by the variations between the walls with and without PCM. Including a PCM in the building envelope achieved significant benefits. Moreover, the charging and discharging processes during the night and day affected the surface temperature and operative temperature within the building, as shown in Figure 6, Figure 7, Figure 8, Figure 9, Figure 10 and Figure 11. Without PCM (Figure 12, Figure 13, Figure 14 and Figure 15), the charging and discharging processes were negligible, which explains the ups and downs in the surface temperature and operative temperature throughout the night and day.
Figure 4, Figure 5, Figure 6, Figure 7, Figure 8, Figure 9, Figure 10, Figure 11, Figure 12, Figure 13, Figure 14 and Figure 15 show that PCMs worked effectively in different regions at different times of the year. The PCMs were effective during both the cooling and heating seasons, but they were more effective from June to August because, in that period, the local climate was favorable to regular charging and discharging. From December to March, the daytime temperatures were not warm enough to melt the PCMs. However, the PCMs did seem to be active in that period (Figure 4, Figure 5, Figure 6 and Figure 7). As shown in Figure 4, Figure 5, Figure 6, Figure 7, Figure 8, Figure 9, Figure 10 and Figure 11, PCM effectiveness varied with the time of year in all regions.
The study results show that including a PCM (BioPCM, 29 °C; DuPonEnergainPCM, 21.6 °C; or RUBITHERMPCM, 25 °C) conferred significant benefits in improving the thermal conditions in the interior environment in Seoul, Tokyo, and Hong Kong during both the cooling and heating seasons under predicted future climate conditions. This significant benefit varied among the PCMs based on their melting temperature and the time of year. The BioPCM more efficiently improved the interior environment and saved more energy than the RUBITHERPCM and DuPonEnergainPCM.
Despite the high humidity in Seoul and Tokyo in the summer and the cold in winters in Hong Kong, Seoul, and Tokyo, this study’s results confirm that incorporating a PCM into a building’s envelope improved indoor thermal comfort.

4.2. Effects of PCM on Heating and Cooling Loads

The simulation results for the annual cooling and heating loads with and without a PCM are shown in Table 5, Table 6, Table 7 and Table 8. The simulation results show that integrating PCMs has significant potential to reduce those annual loads now, as well as in 2020, 2050, and 2080 in Seoul, Tokyo, and Hong Kong. Those regions could achieve reductions in energy consumption by using PCMs to significantly decrease HVAC usage. The percentage of energy savings was calculated using Formula (6). Changing climate conditions will increase the cooling load in the summer and decrease the heating load in the winter. Integrating PCMs into building envelopes could reduce the annual cooling energy demand for HVAC operation and energy used to produce cold air in the building (see percent energy savings, Table 6 and Table 8).
%   of   energy   saving = Energy   consumption   without   PCM Energy   consumption   with   PCM Energy   consumption   without   PCM × 100
The annual loads for cooling and heating with BioPCM and RUITHERPCM decreased more than with DuPonEnergainPCM because the former PCMs melt at 29 °C and 25 °C, respectively. As shown in Table 5 and Table 7, Hong Kong, followed by Tokyo and Seoul, achieved the highest percentage of heating energy savings with BioPCM and RUBTHERMPCM, whereas Seoul, followed by Tokyo and Hong Kong, had the highest percentage of cooling energy savings at the present, as well as in 2020, 2050, and 2080 (Table 6 and Table 8). The differences shown by the results are a reflection of the melting point of the PCMs, the PCM position, and the local climate in the study zones.
The melting temperatures of the PCMs used are appropriate for reducing the cooling and heating loads and thus providing significant benefits in both the cooling and heating seasons. The simulation results also show that energy requirements for HVAC system operation and the production of warm and cold air were low in 2020, 2050, and 2080 as a result of incorporating PCMs into the building envelope, which reduced the effects of climate change on energy requirements.

4.3. Effect of PCM on Energy Consumption

The simulation results for overall annual electricity and gas consumption at the present, as well as in 2020, 2050, and 2080 for the building with PCM and building without PCM are shown in Table 9 and Table 10. The percentage of energy savings (electricity and gas) was calculated using Formula (7). In all zones, the percentages of electricity and gas savings were higher at higher temperature-fluctuation rates. Incorporating PCMs into the building envelope resulted in electricity and gas savings during both the winter and summer.
%   of   energy   and   gas   saving = Energy   and   gas   consumption   without   PCM Electricty   and   gas   consumption   with   PCM Electricty   and   gas   consumption   with   PCM × 100
Similar to the trend for temperature fluctuation values, the PCM with the highest melting point worked best during the simulation years in Seoul, Tokyo, and Hong Kong. Table 9 and Figure 16 show that BioPCM (29 °C) and RUBITHERMPCM (25 °C) achieved the highest electricity savings in Tokyo, followed by Seoul and Hong Kong. DuPonEnergainPCM (21.6 °C) (Table 10 and Figure 17) achieved the highest gas savings in Hong Kong, followed by Tokyo and Seoul. In Seoul, the thermostat heating and cooling set points are 20 °C and 26 °C, respectively. When the zone temperature was above 29 °C (BioPCM), 25 °C (RUBITHERMPCM), and 21.6 °C (DuPonEnergainPCM), the PCMs were in their liquid phase. The thermostat set point for cooling indicates that energy was required to cool the zone to 26 °C, which all three PCMs did by solidifying, and that resulted in consumption reductions for electricity and gas during the cooling season. Similar cases were observed in Tokyo and Hong Kong. The higher temperature fluctuation values of the PCM 25 and PCM 29 meant that, in the thermostat range (20–26 °C), they offered the highest consumption reductions in electricity and gas at the present, as well as in 2020, 2050, and 2080.
Therefore, it is important to select a PCM melting point temperature range suited to both the local climate and local thermostat set points. A higher melting point does not always mean higher energy savings.
Figure 17 shows that DuPonEnergainPCM (21.6 °C), followed by RUBITHERMPCM (25 °C), better reduced gas consumption in Tokyo, Seoul, and Hong Kong than BioPCM (29 °C), and Figure 16 shows that, in 2050 and 2080, Hong Kong will likely depend on electrical energy instead of gas for cooling and heating (Table 10): Figure 17 shows gas savings in Hong Kong of 83.03%, 91.47%, and 92.60%, which is unreasonable when the highest electricity savings in Hong Kong is only 5%. As shown in the simulation results for Hong Kong, by 2050 and 2080, gas consumption is low (see also Table 9 and Table 10), which suggests gas will no longer be used to heat or cool buildings in the future; thus, gas savings will range 62.14–92.60%.

5. Discussion

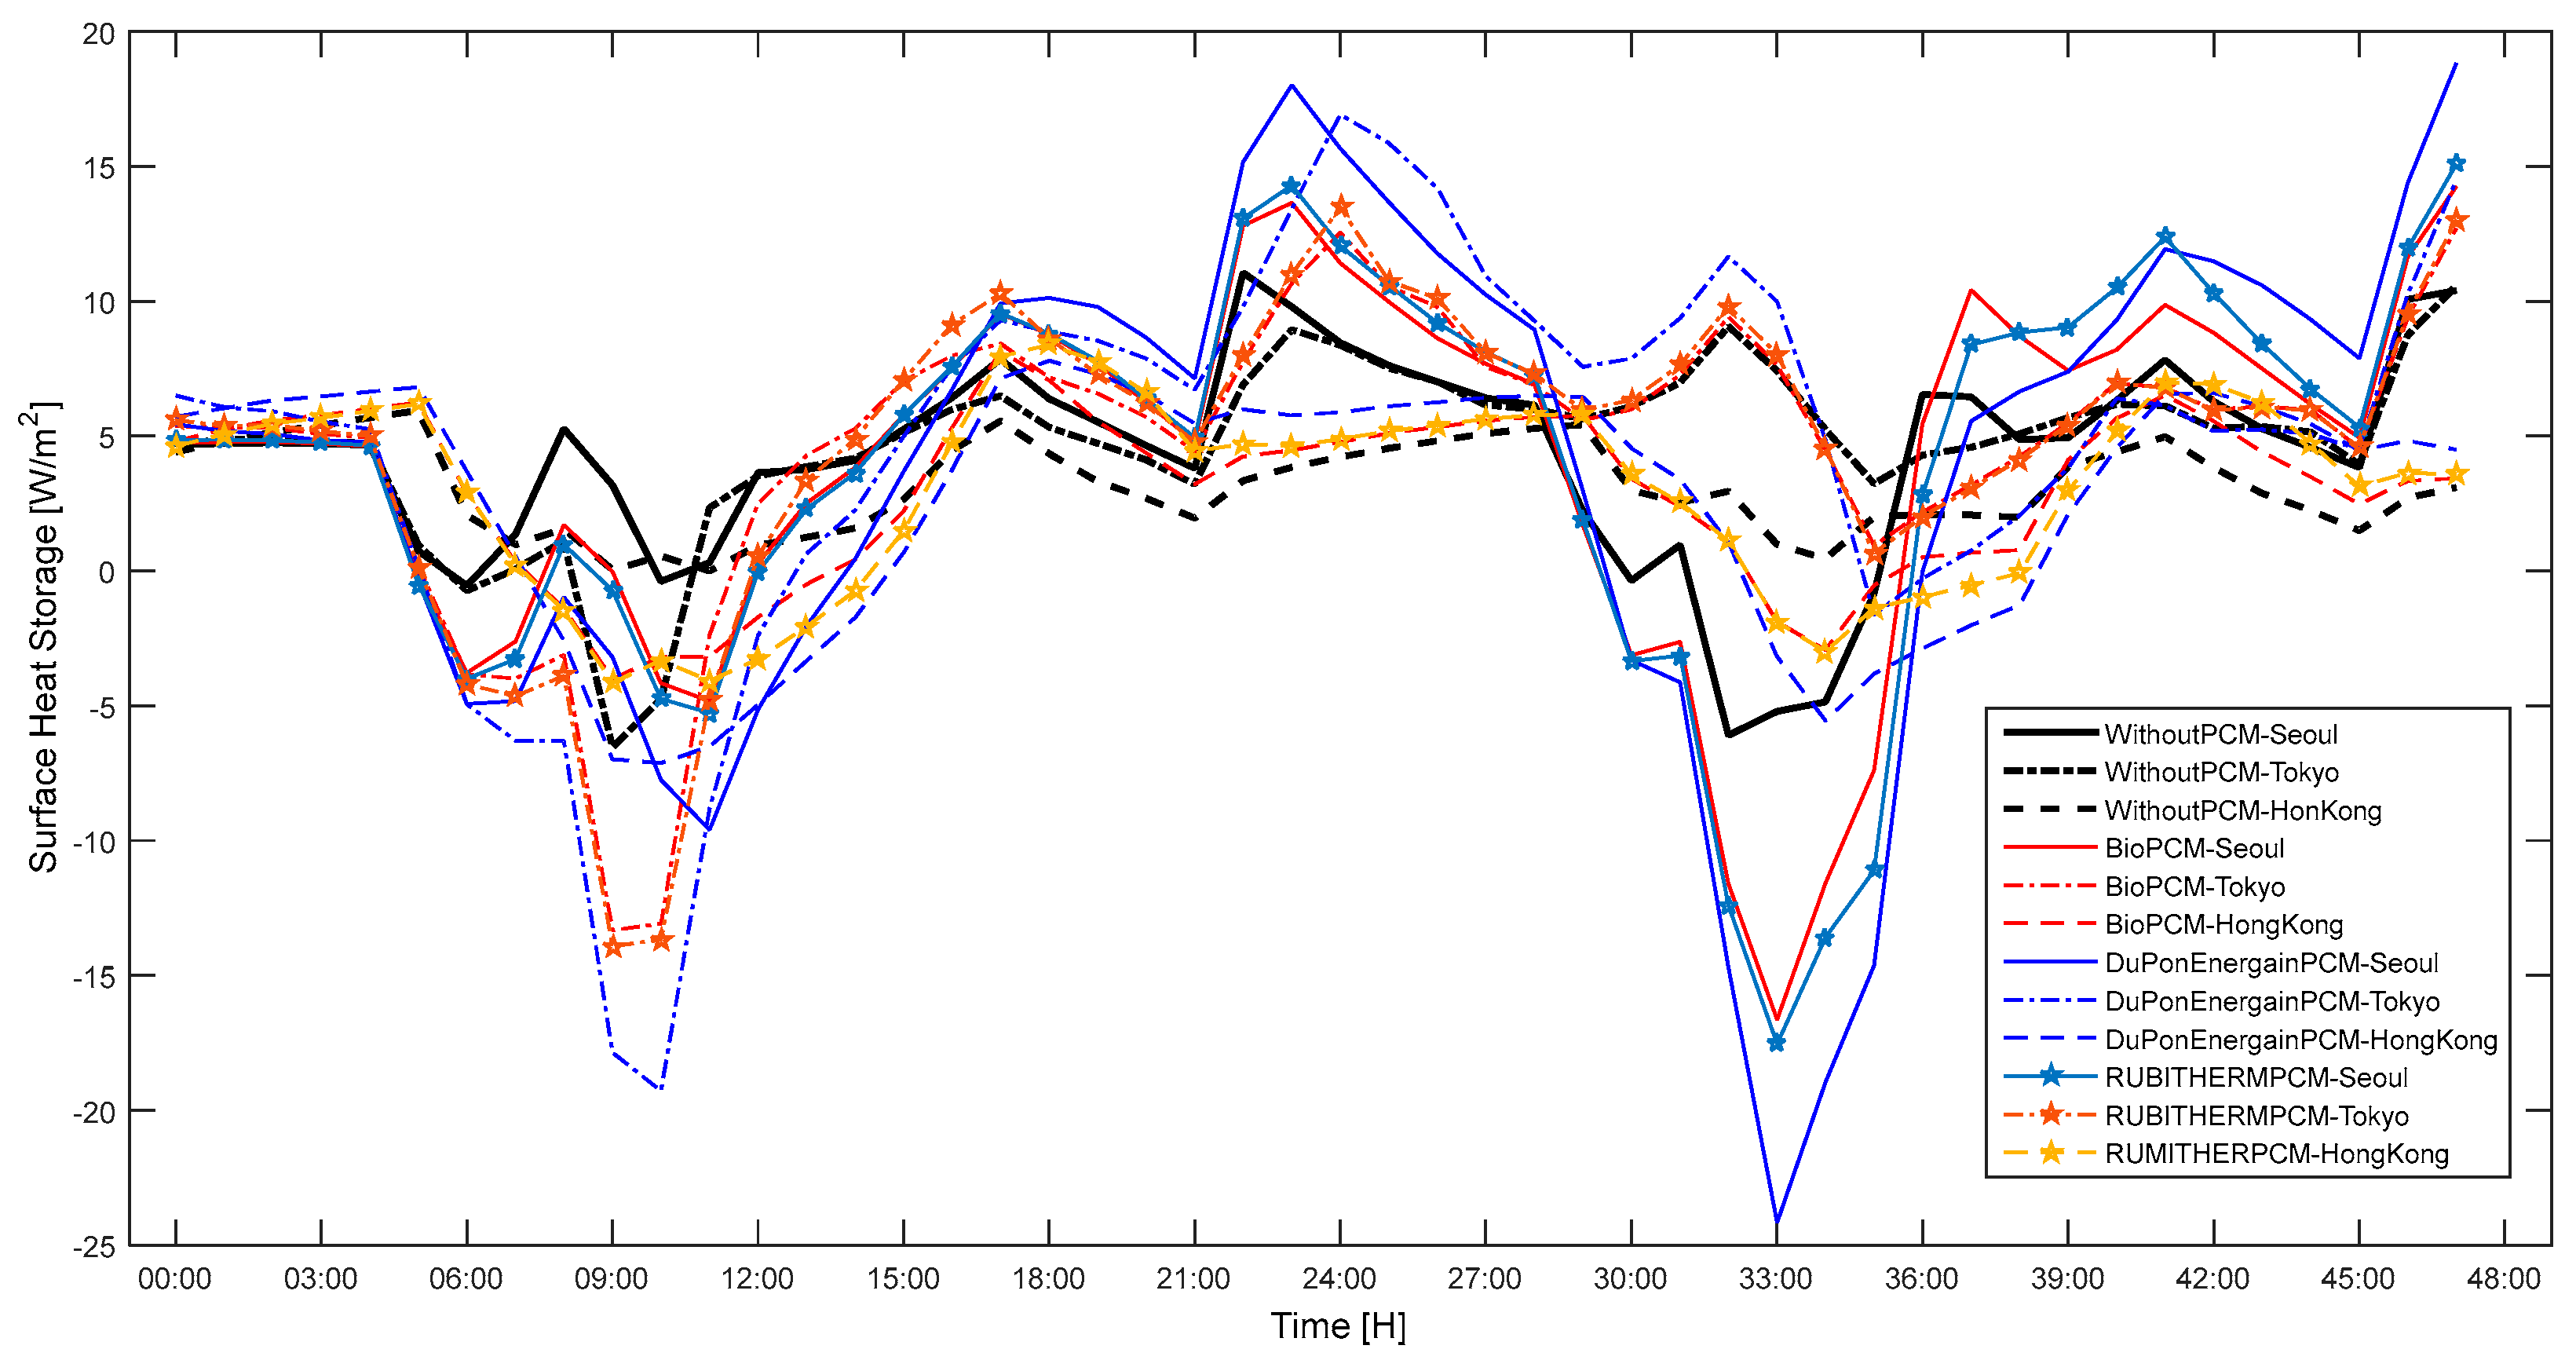
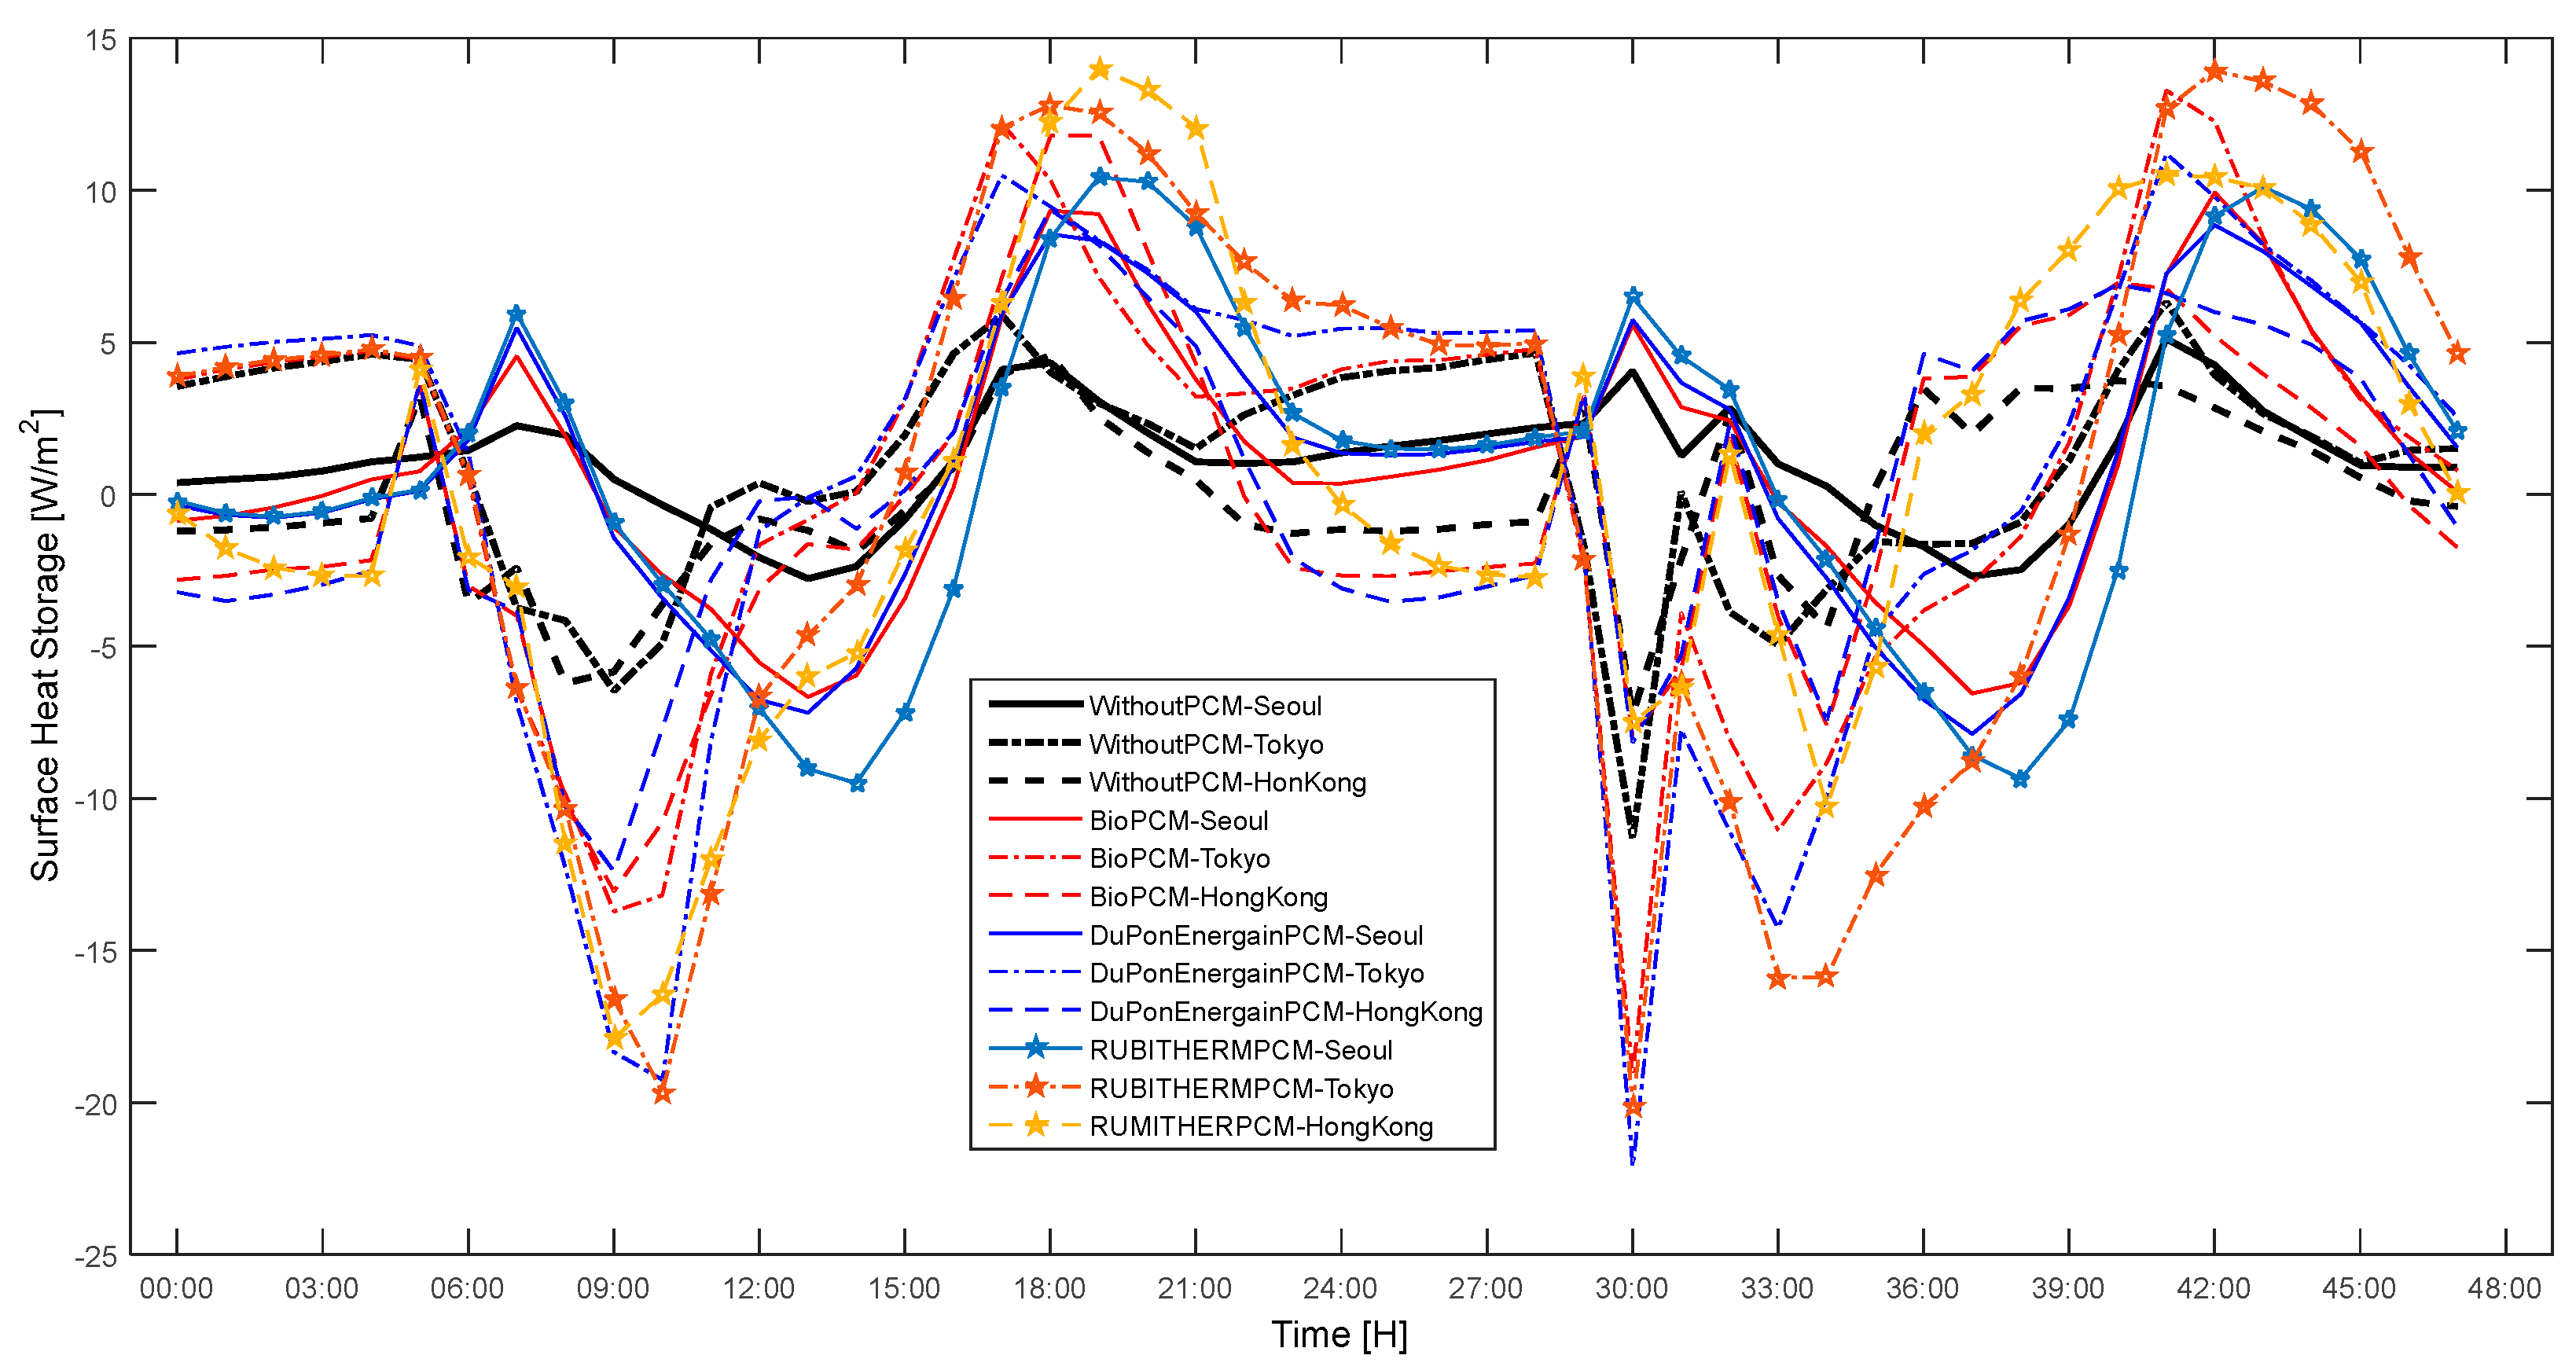
This study tested three kinds of PCMs with different melting temperatures to investigate the energy saving potential they provide under future climate conditions. The weather in Seoul and Tokyo is characterized by high humidity in the summer, which reduced the efficiency of the PCMs. The cold winters in Hong Kong, Tokyo, and Seoul also compromised the effectiveness of the PCMs. The methodology of this study uses predictions of future climate changes to determine the effectiveness of PCMs incorporated into a building envelope at the present, as well as in 2020, 2050, and 2080. Organic PCMs were chosen because they are more chemically stable than inorganic PCMs and are suitable and compatible building materials that melt congruently.
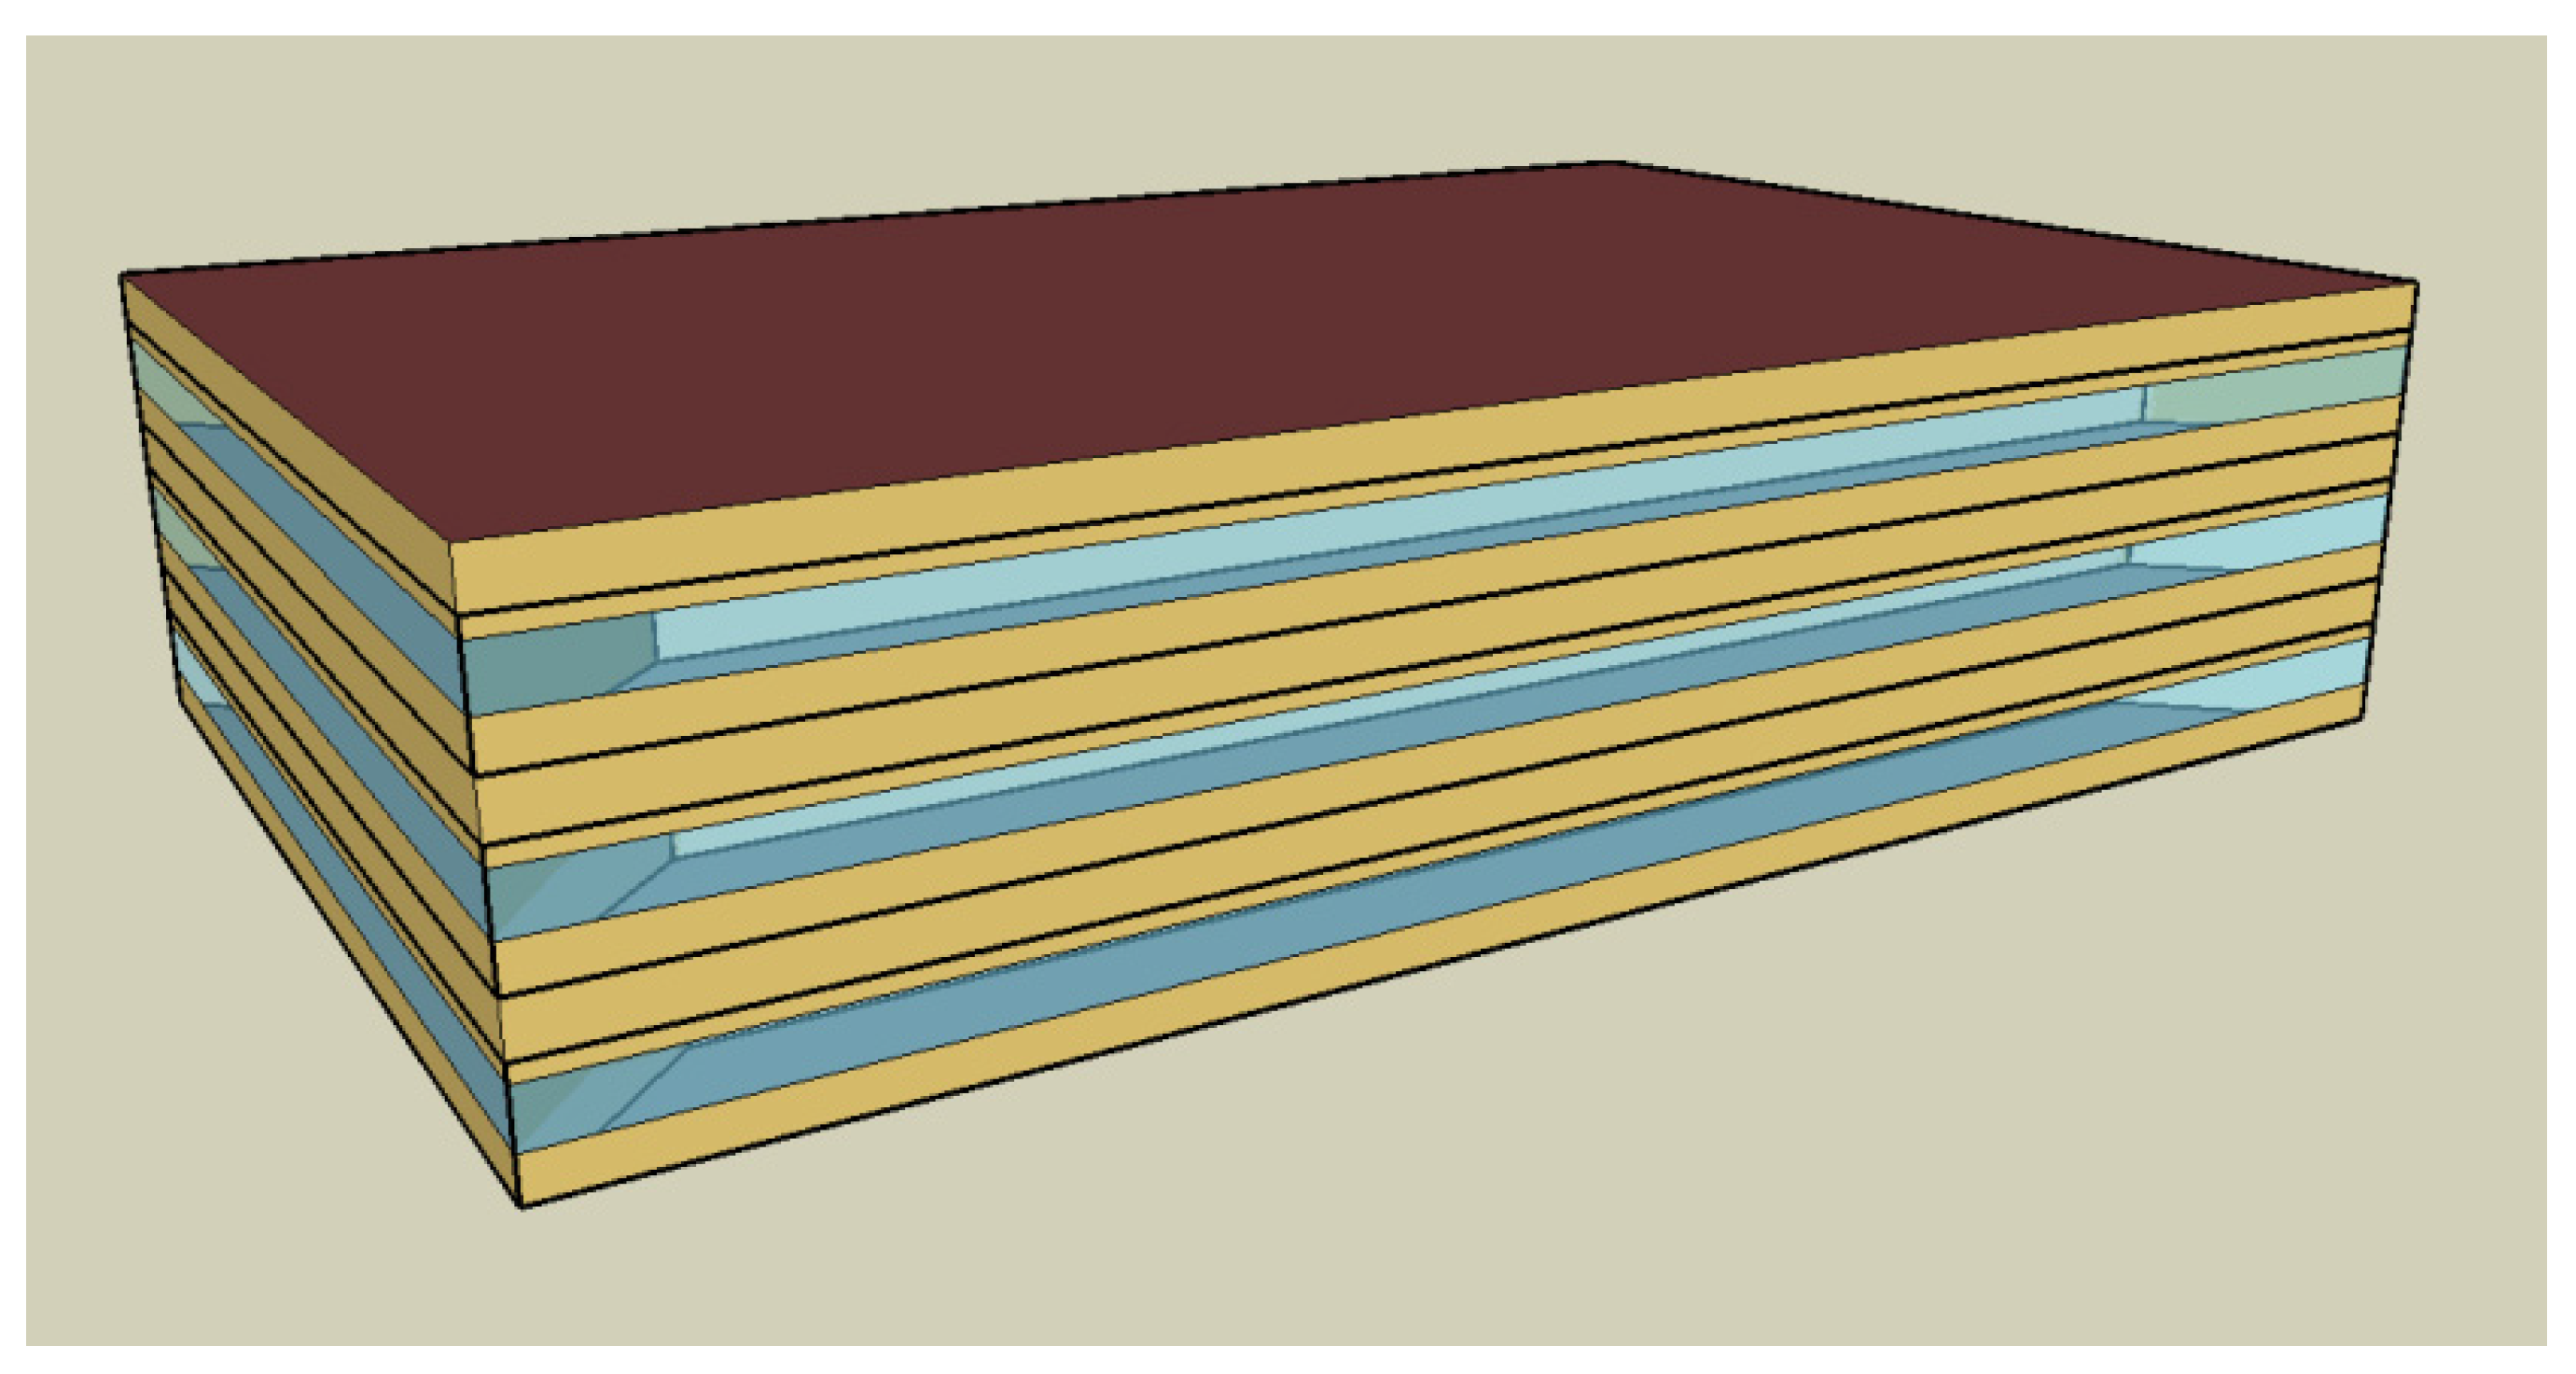
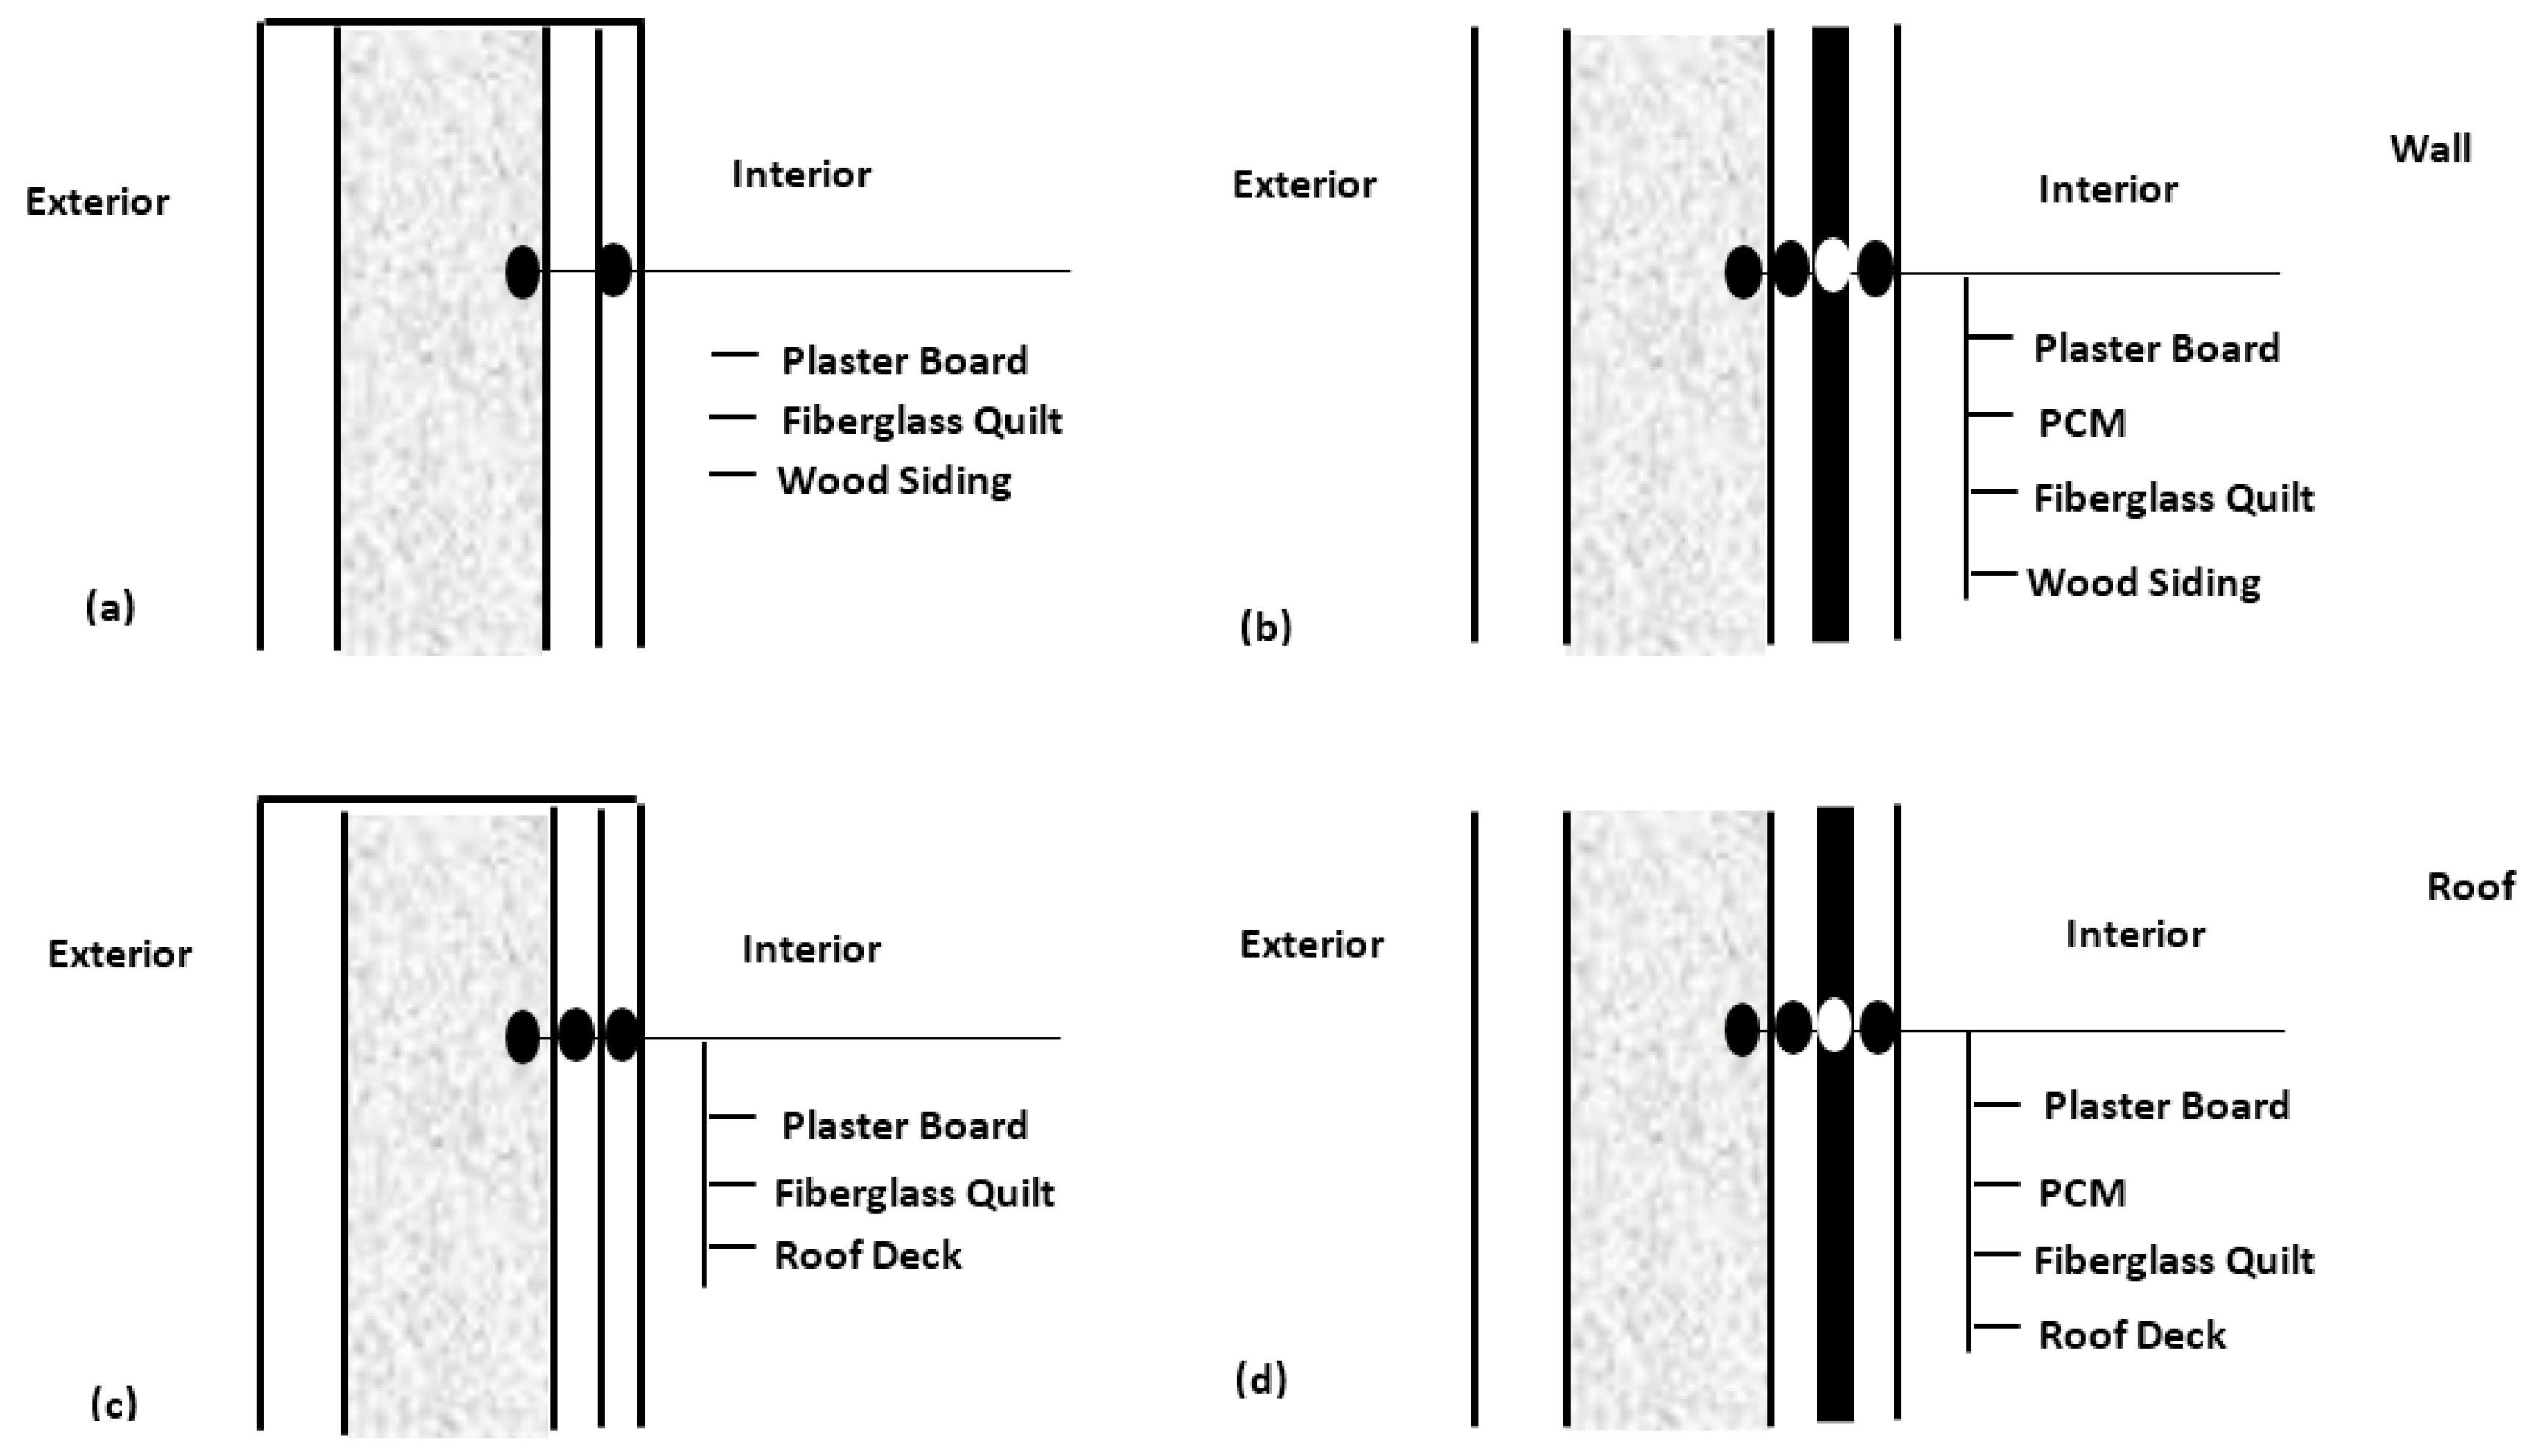
The results of this study indicate that incorporating a PCM with an appropriate melting phase temperature into a building’s envelope has significant potential to save energy during the cooling and heating periods. In this study, the PCM was positioned between the plasterboard and the fiberglass quilt of all four interior walls and in the roof.
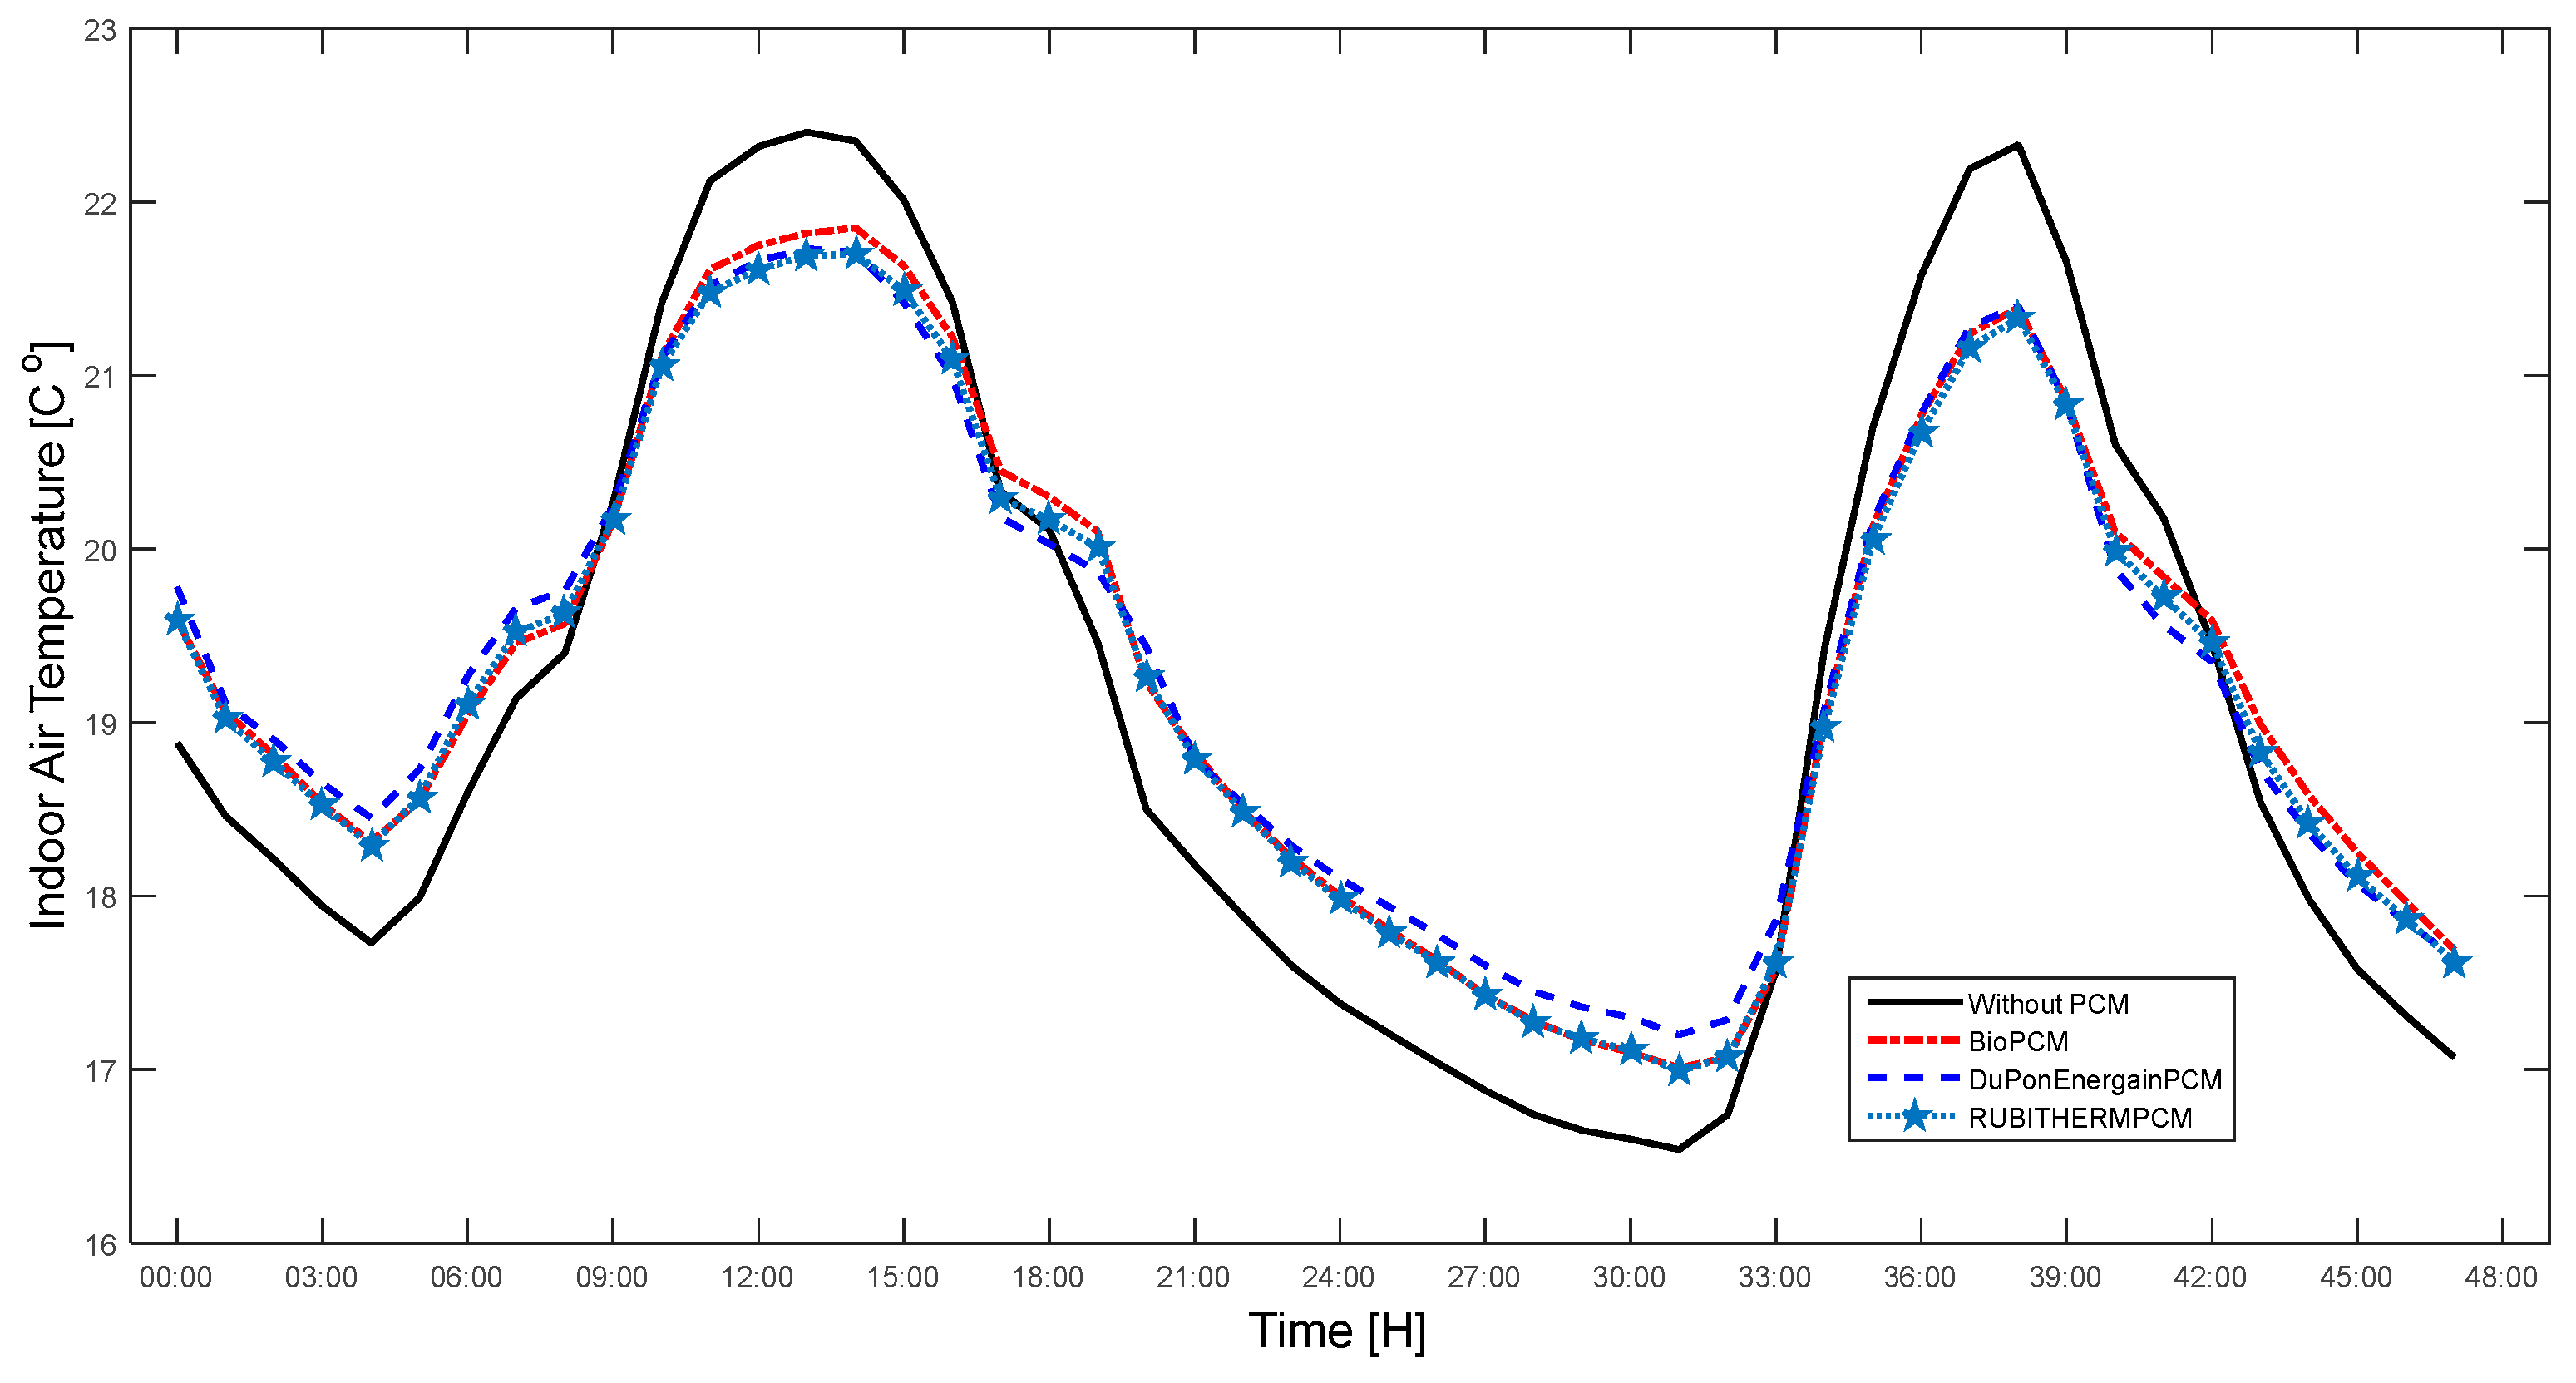
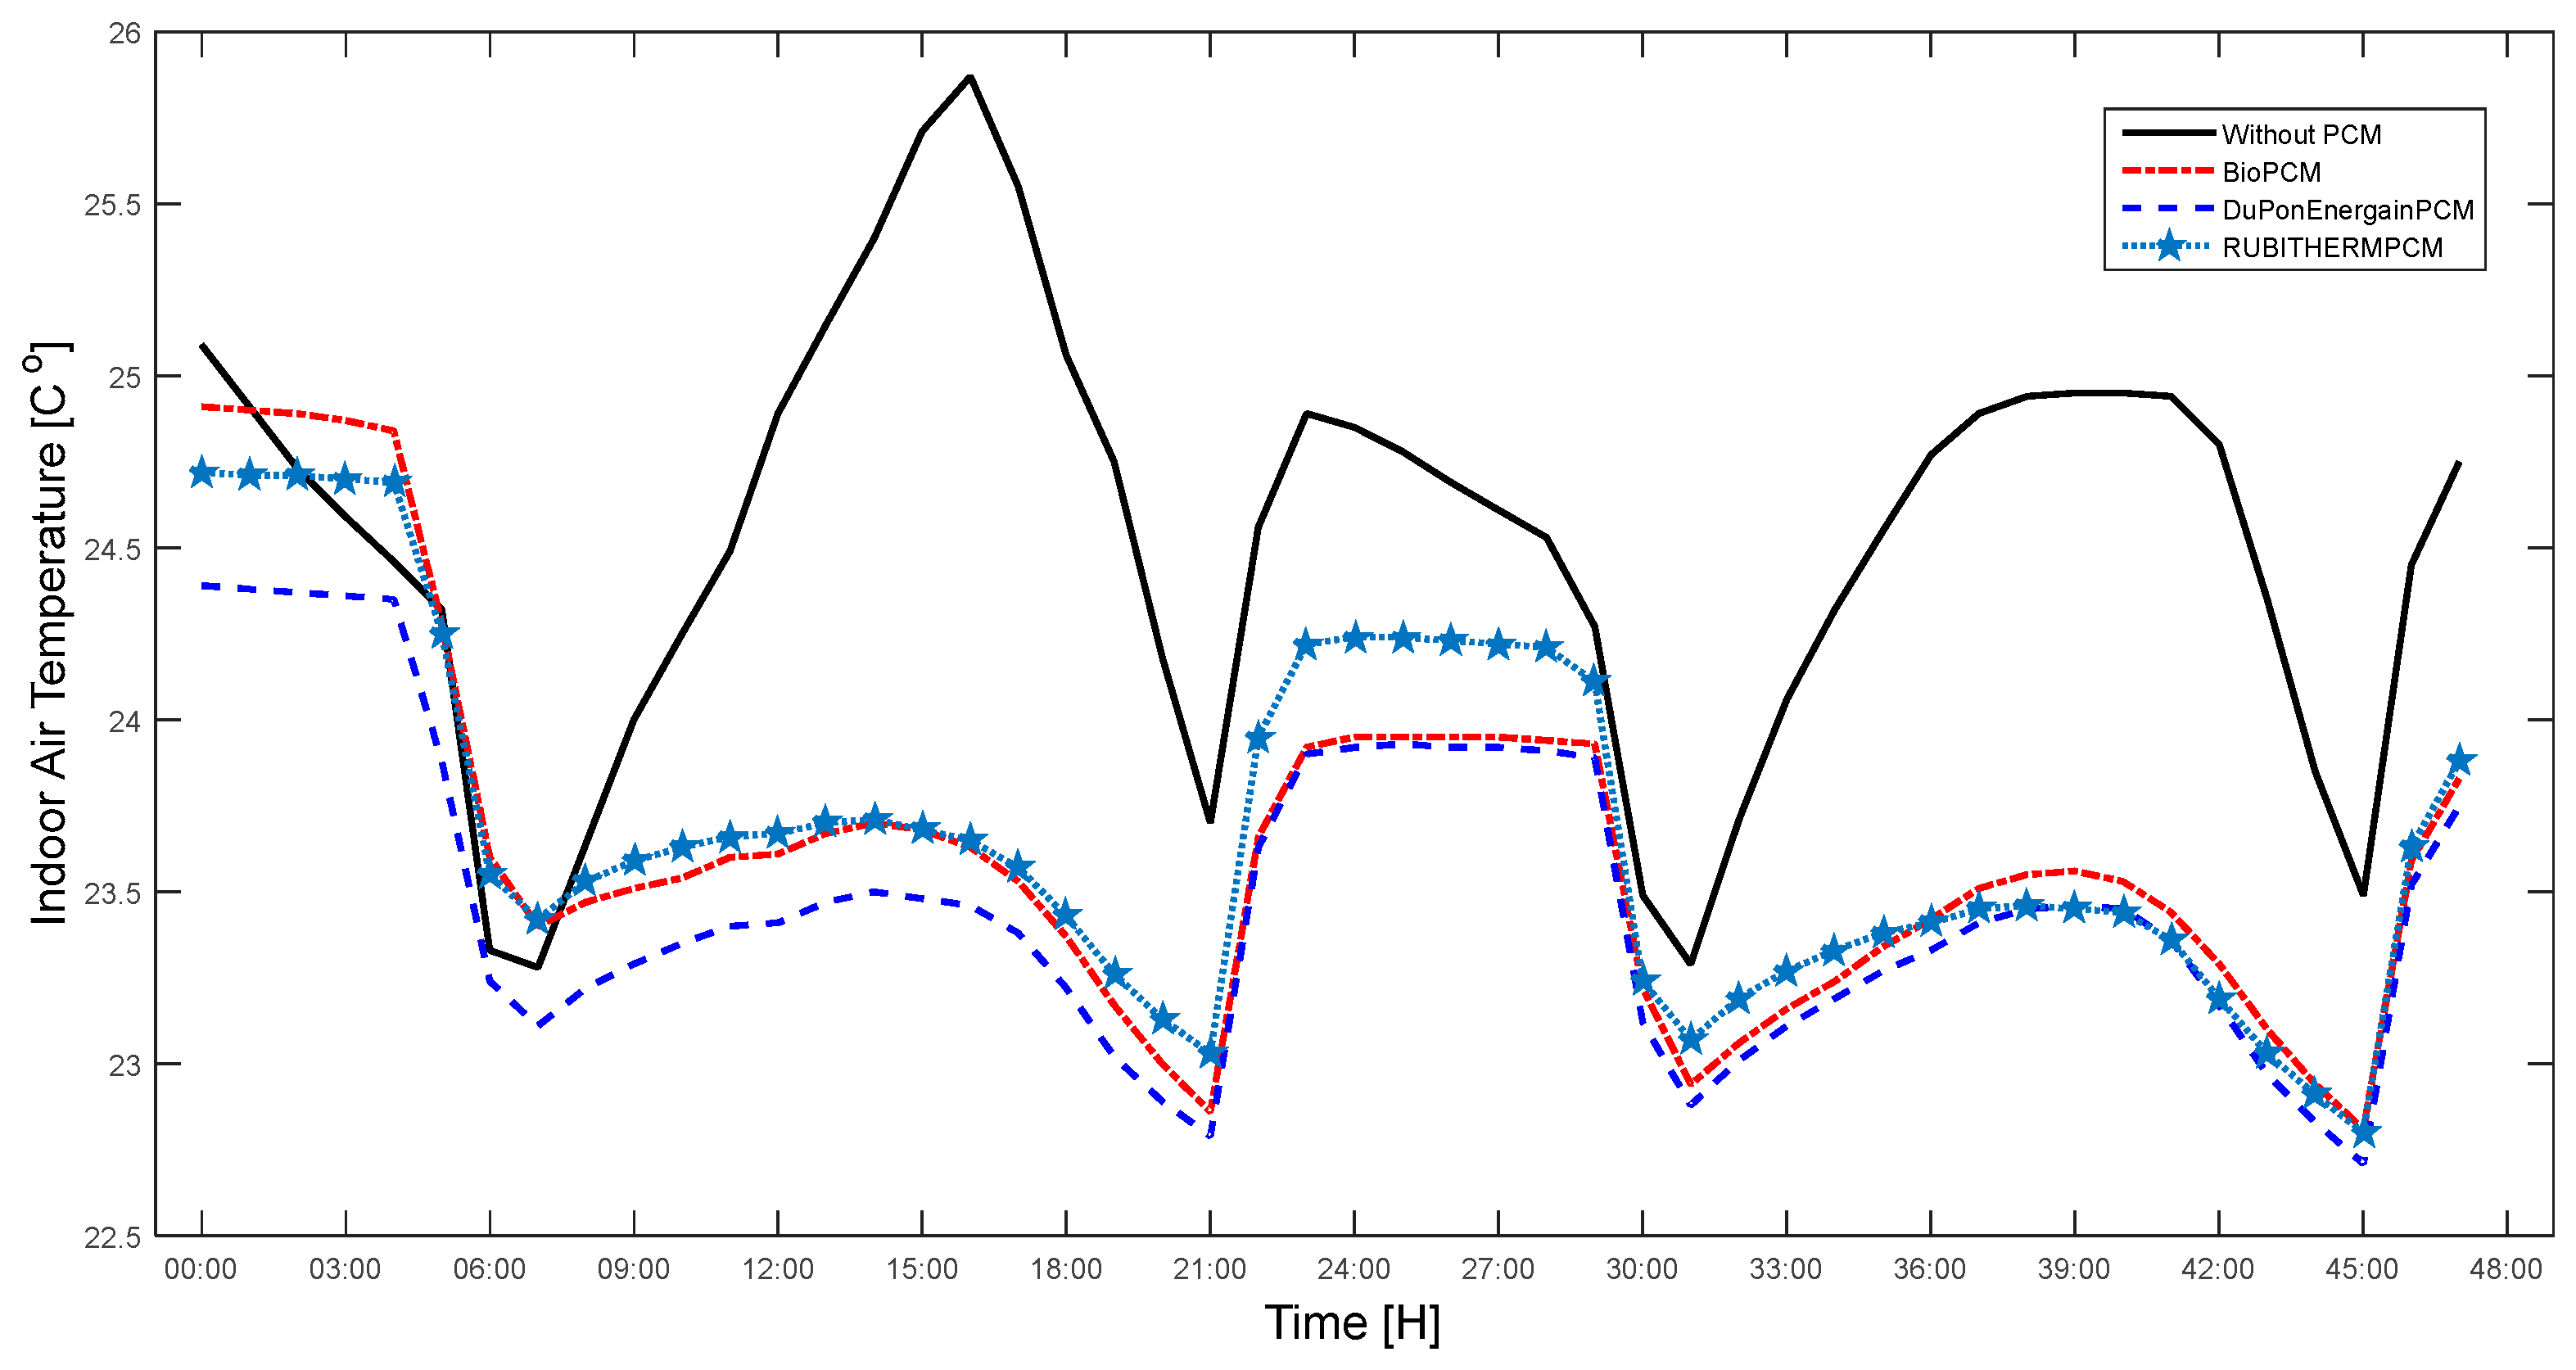
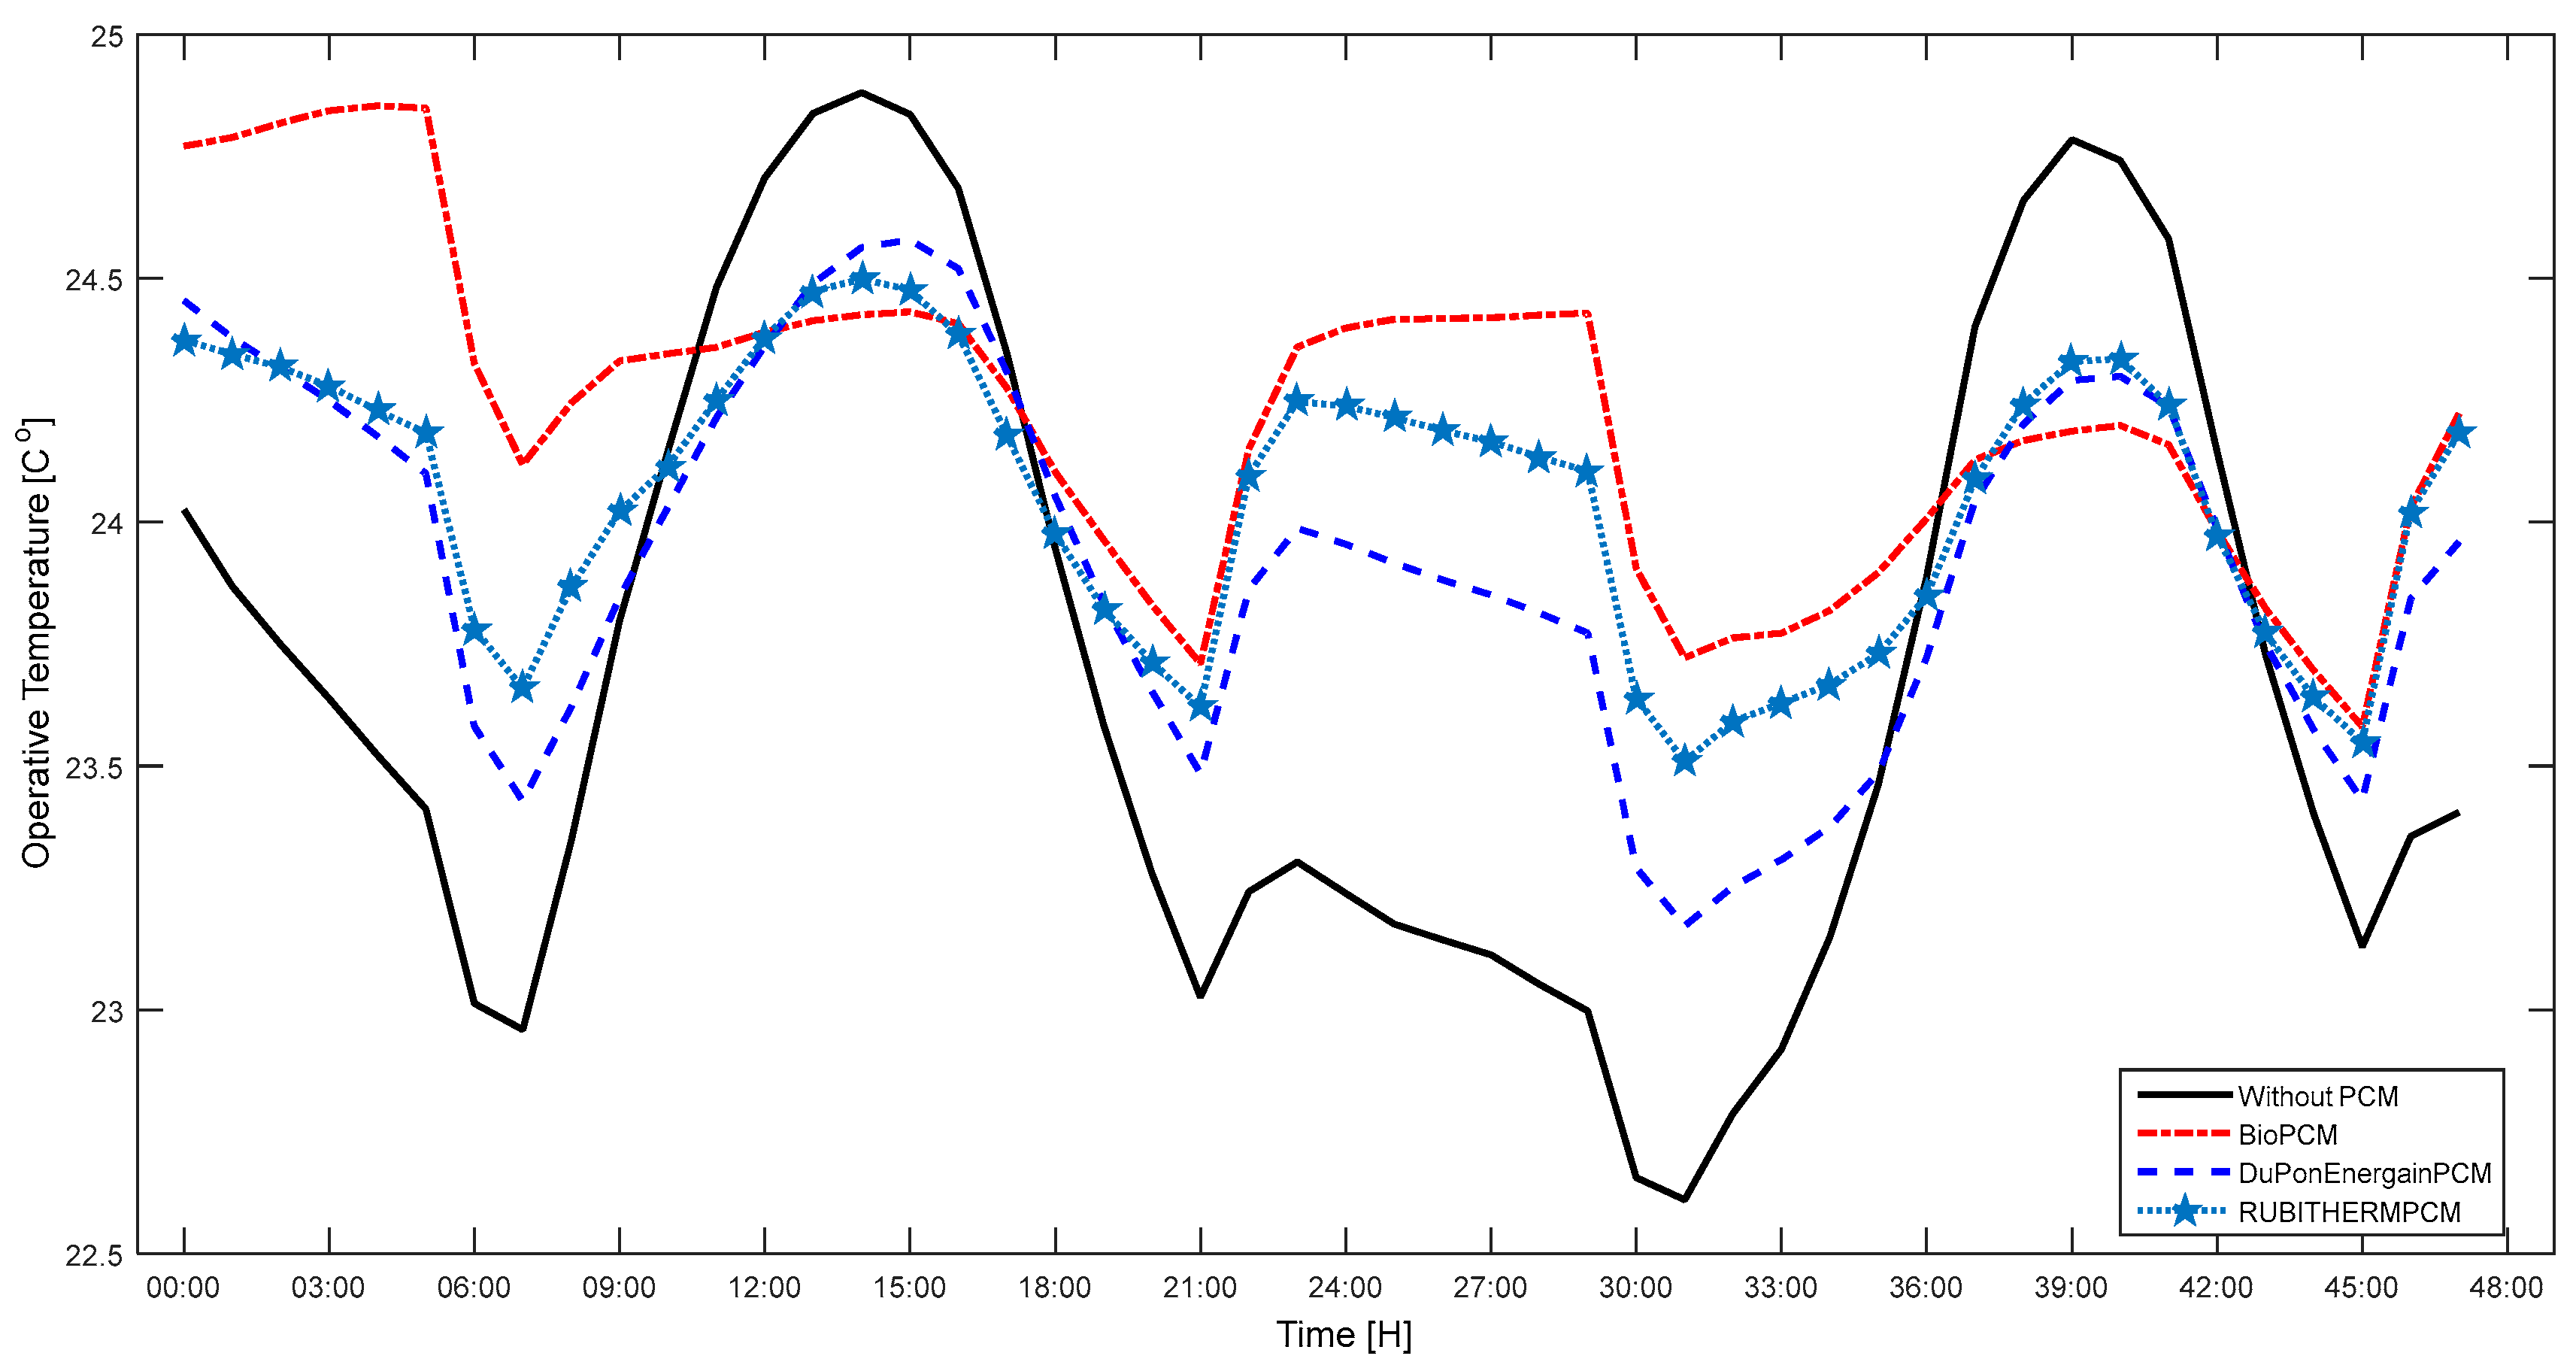
The position of the PCM reduced the number of hours that the building interior spent outside the thermal comfort zone. In addition, assuming a 24 h HVAC schedule, the PCM with a melting phase temperature of 29 °C provided the highest annual energy savings. Using a PCM under this operational schedule provided benefits during both the cooling and heating periods. The BioPCM was more efficient than the DuPonEnergainPCM and RUBITHERMPCM because of its melting temperature, which was closer to the heating and cooling set-point temperatures in the cooling and heating seasons.
The simulation results confirm the energy savings potential of the PCMs in humid climates under future climate conditions; the energy savings depend on their chemical and physical properties, their position in the building envelope, and their thickness. The organic PCMs are best for such regions because they are least effected by moisture.
The energy savings in the heating season are attributable to only partial melting of the PCMs for less of each day (noon until evening) than in the cooling season because of moderate ambient temperature, moderate solar radiation, or both. In addition, the liquid–solid transition (solidification) overnight discharged the stored heat into the interior of the office building. This additional heat helped maintain the interior environment and decreased the HVAC workload.
The important results of this study are the predicted estimates for energy consumption under future climate conditions, the effects of climate change on the efficiency of PCMs, and the effects of PCMs on energy consumption. Previous studies [4,16,19] did not investigate PCM effectiveness under future climate conditions. These results confirm that climate change will have little effect on the energy saving potential of PCMs appropriate to local climate conditions.

6. Conclusions

This study aimed to support the application of PCM technology in the building sector as passive alternative to save energy in the buildings and assess its influence on building energy performance under future climate conditions. However, use of numerical models is the fastest tool to assess applicability of specific technology or materials in the buildings, especially with regard to energy requirements under future climate conditions.
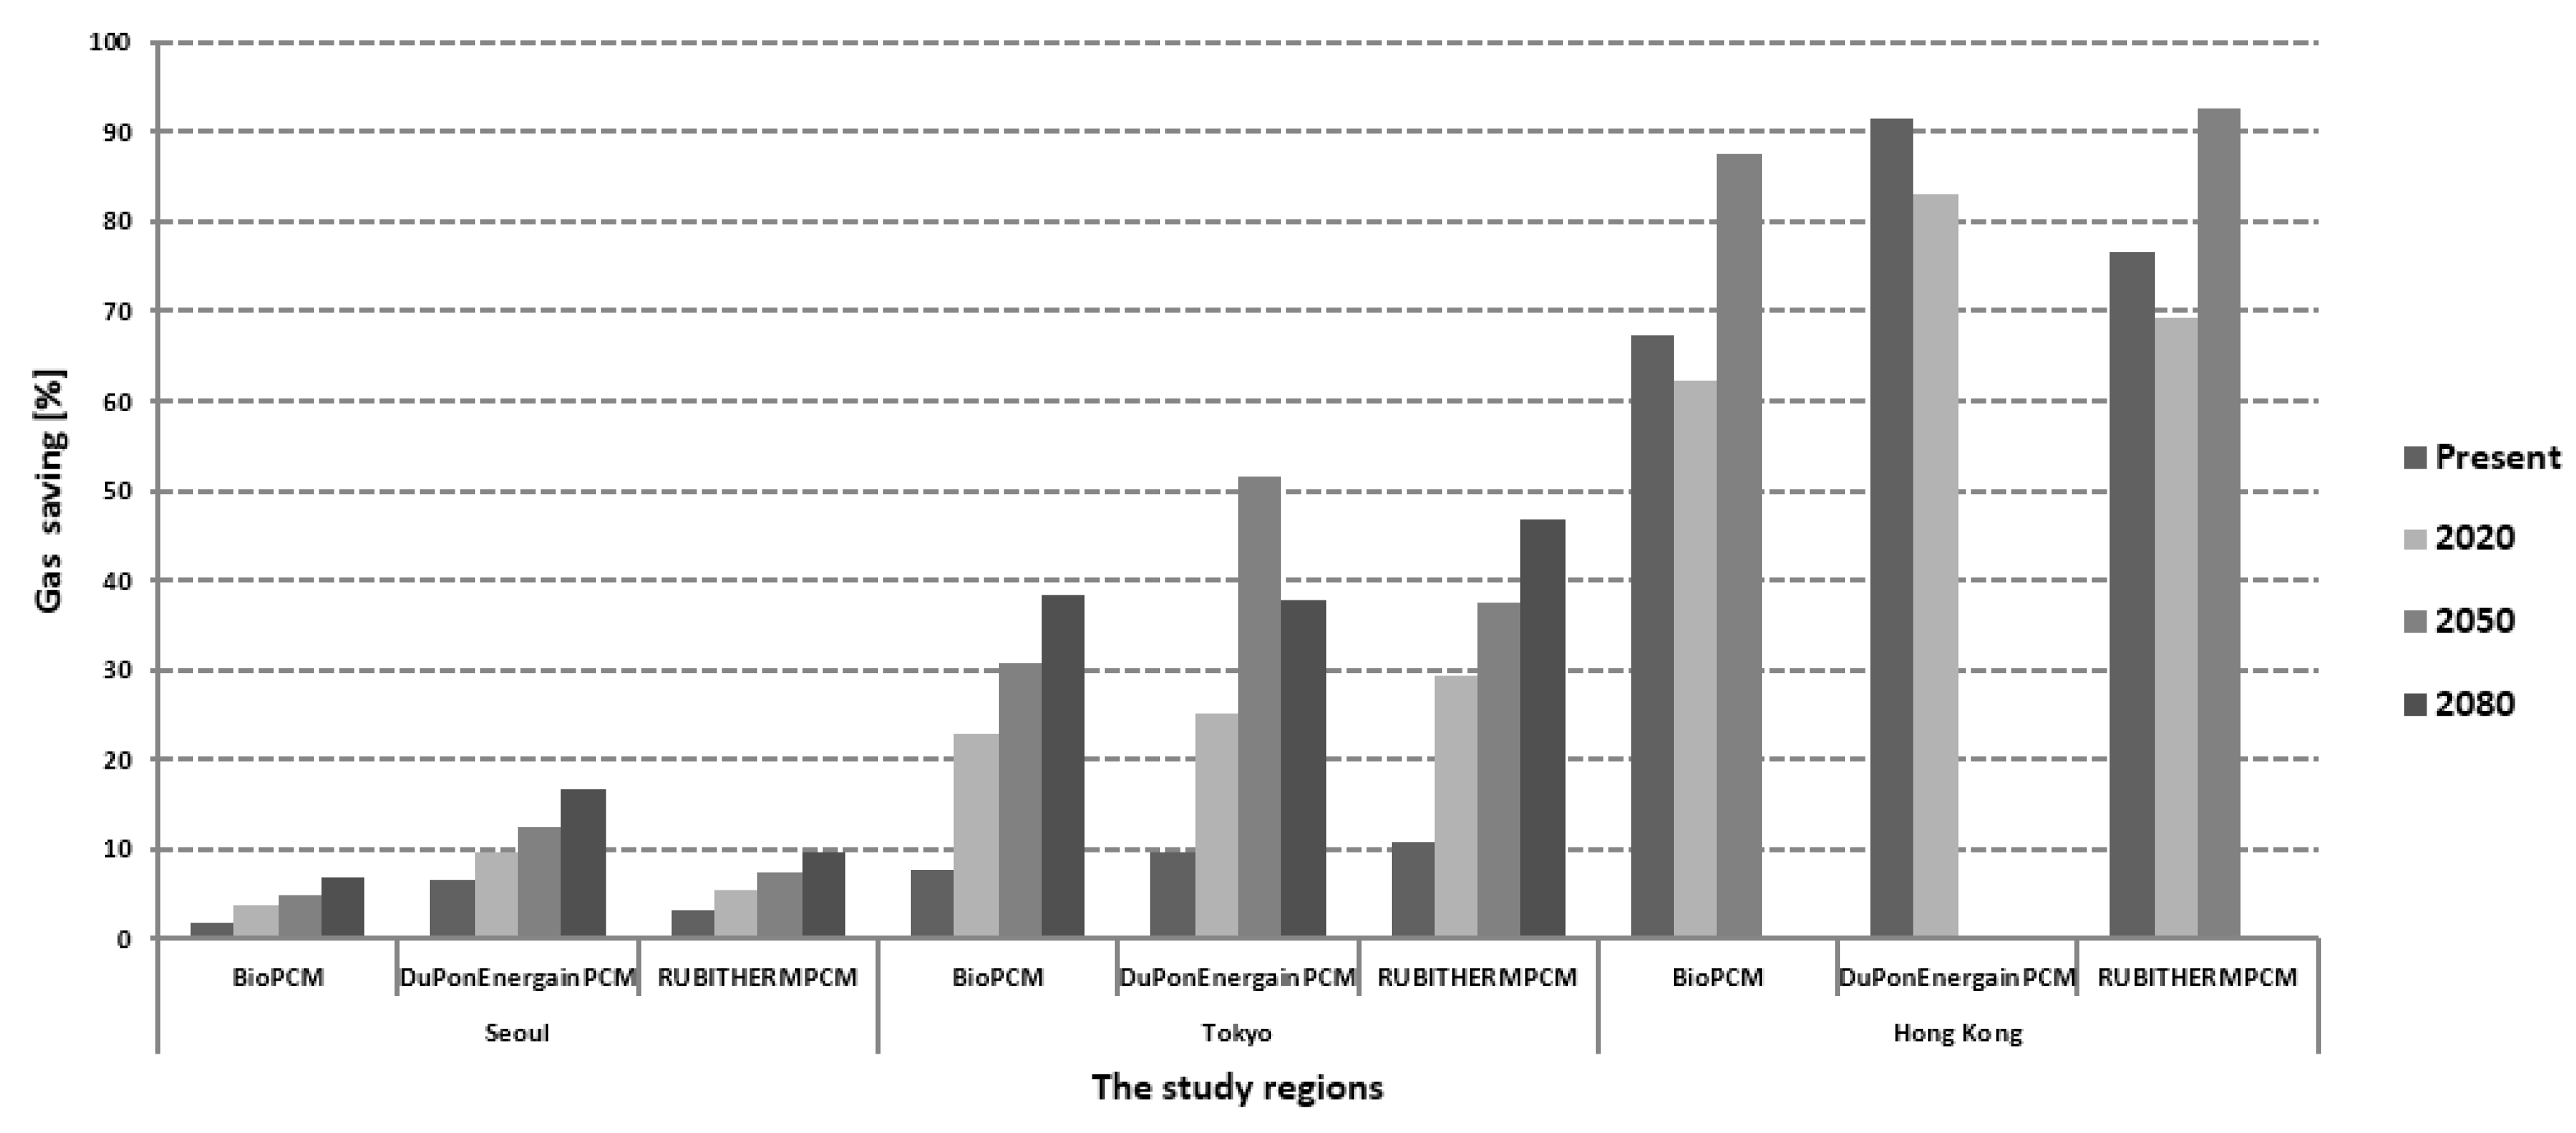
As such, results presented in this study highlight the energy saving potential due to incorporation of various PCMs with different phase temperature in the building envelopes both for cooling and heating periods in humid and snowy regions in the hot continental and humid subtropical climates of East Asia (Seoul, Tokyo and Hong Kong). Utilizing PCMs-incorporated BioPCM, DuPonEnergainPCM, RUBITHERMPCM into the building envelope was shown to be a promising strategy to increase energy performance in buildings during both heating and cooling seasons in the humid regions (Seoul, Tokyo and Hong Kong) and snowy regions (Seoul and Tokyo) under future climate conditions. The highest energy savings achieved by using PCMs in those regions are: electricity savings of 4.48–8.21%, 3.81–9.69%, and 1.94–5.15%, and gas savings of 1.65–16.59%, 7.60–61.76%, and 62.07–93.33% in Seoul, Tokyo and Hong Kong, respectively.
On the other hand, these materials (PCMs) can be used in both new buildings and existing buildings to improve their thermal performance and energy consumption reduction. PCM efficiency depends on the local climate zone, melting temperature, PCM location in the building envelope and thickness of the PCM layer. Especially, a PCM’s optimum melting temperature for energy savings depends on the details of a particular climate zone, where PCM with a melting temperature outside the thermal comfort range does not provide energy reductions regardless of large future fluctuations in the temperature. The results also showed, the PCMs implemented in the building envelopes with melting point of 29 °C (BioPCM) and 25 °C (RUBITHERMPCM) have allowed achieving important reductions of electricity and gas consumption for cooling and heating periods under future climate conditions:
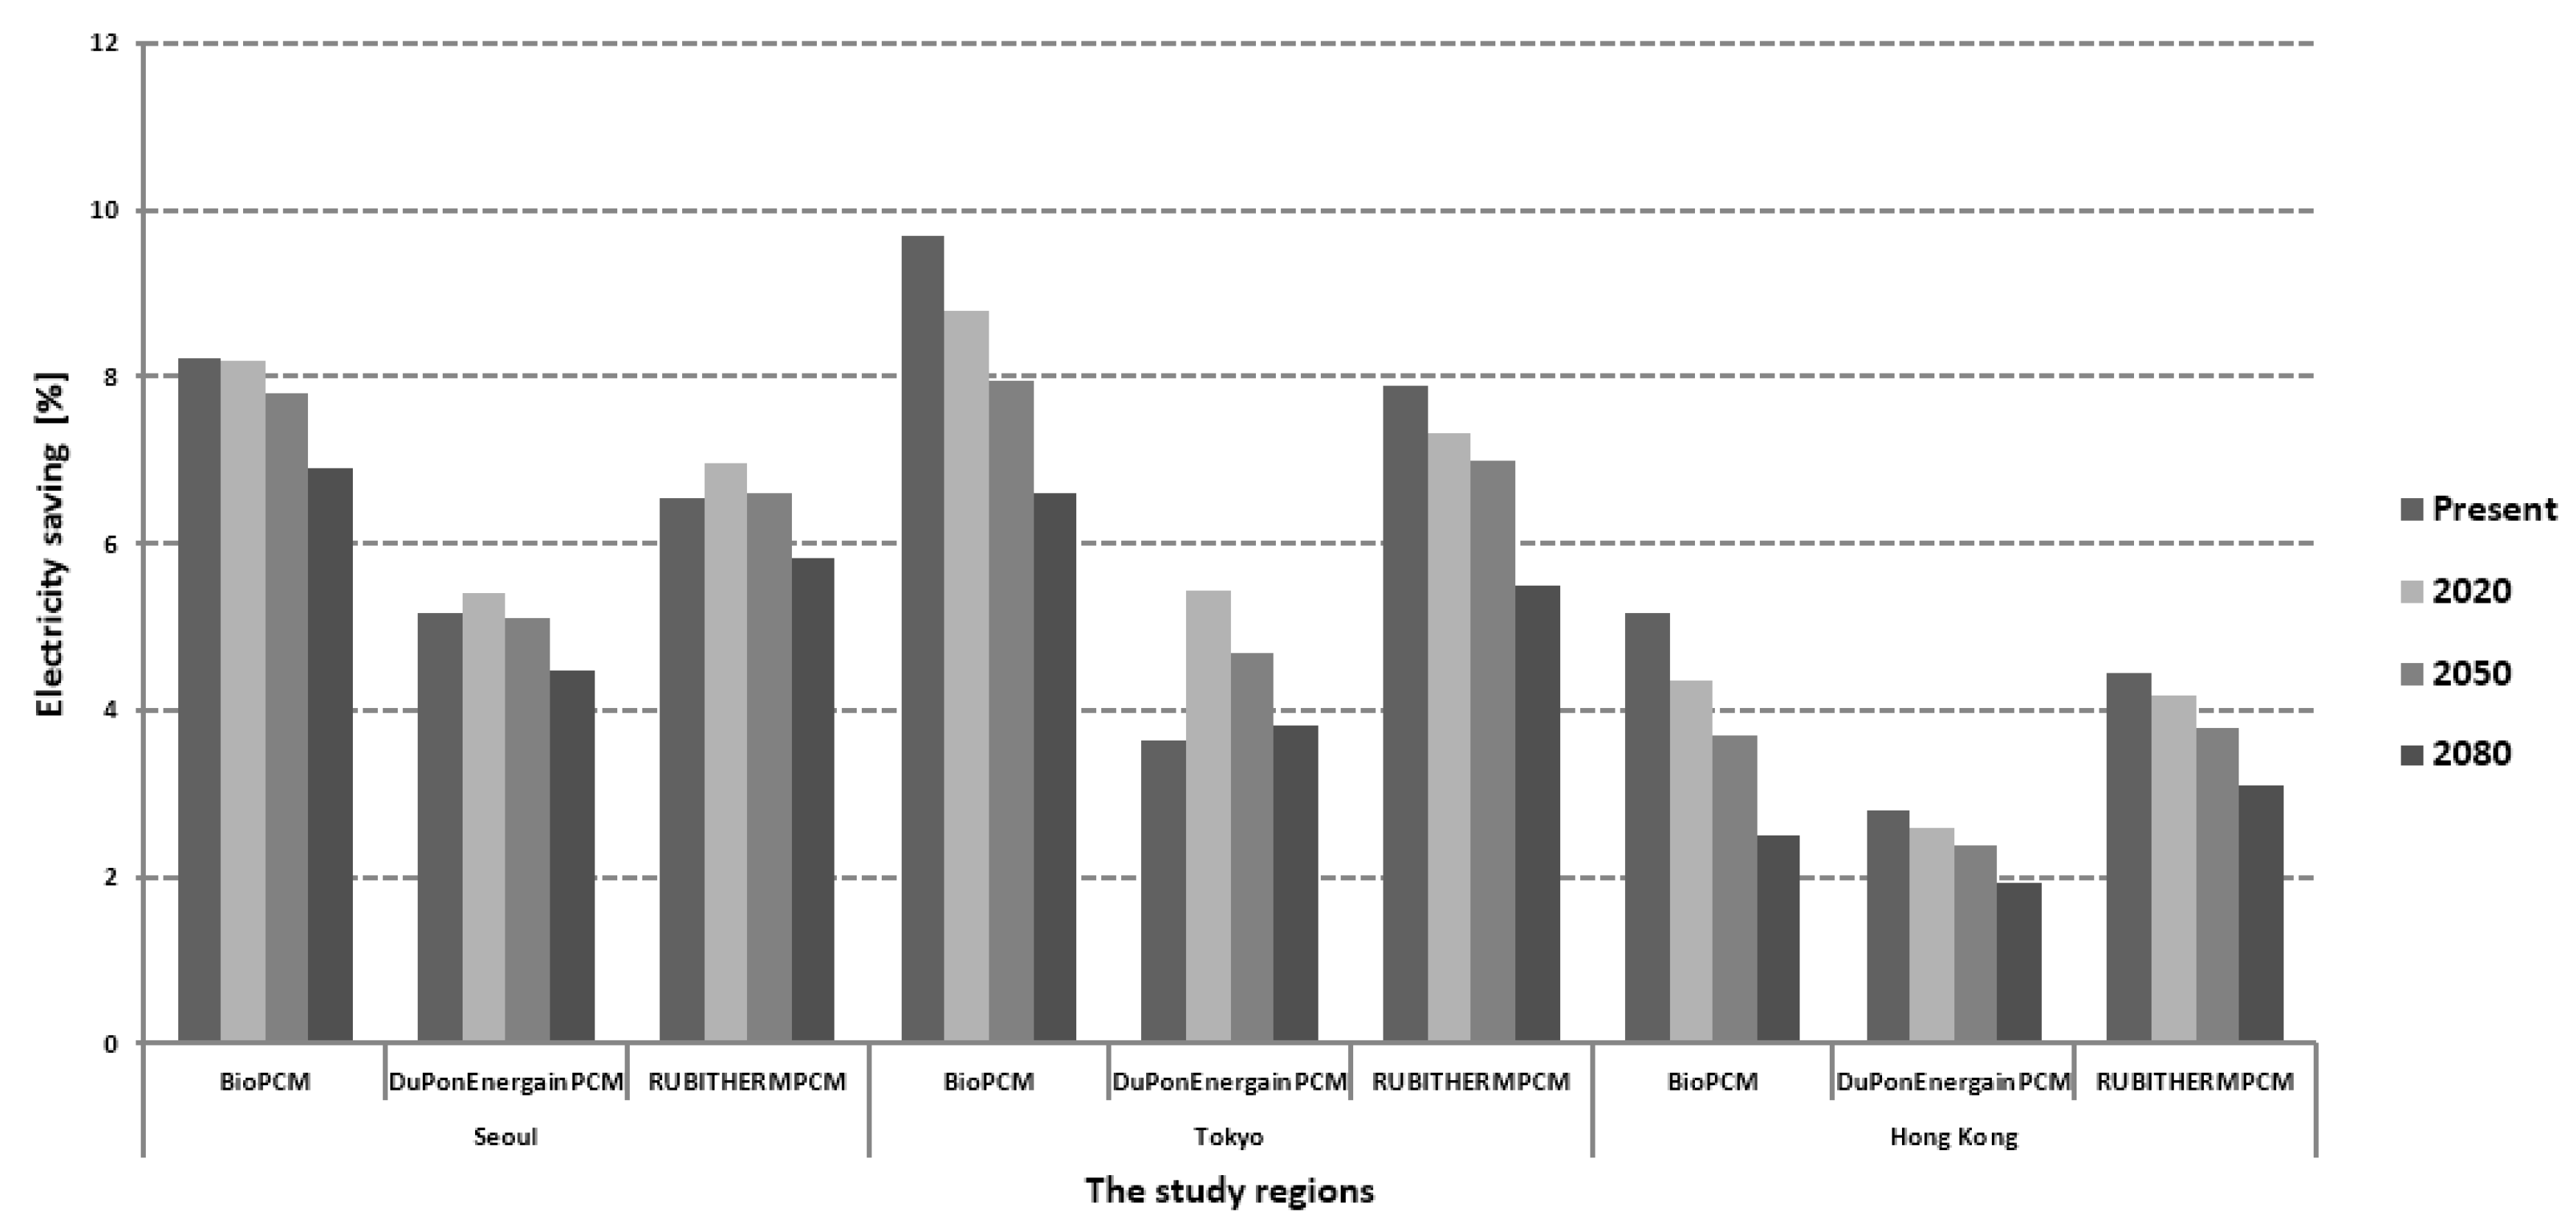
For Seoul, electricity savings by BioPCM in present, 2020, 2050 and 2080 were shown to be 8.21%, 8.18%, 7.81% and 6.91% respectively and RUBITHERMPCM in present, 2020, 2050 and 2080 were shown to be 6.53%, 6.95%, 6.62% and 5.82% respectively. For Tokyo, electricity savings by BioPCM in present, 2020, 2050 and 2080 were shown to be 9.69%, 8.78%, 7.94% and 6.60% respectively and RUBITHERMPCM in present, 2020, 2050 and 2080 were shown to be 7.89%, 7.32%, 6.53% and 5.48% respectively. For Hong Kong, electricity savings by BioPCM in present, 2020, 2050 and 2080 were shown to be 5.15%, 4.37%, 3.71% and 2.49%) respectively and RUBITHERMPCM in present, 2020, 2050 and 2080 were shown to be 4.45%, 4.17%, 3.79% and 3.10%, respectively.
For Seoul, gas savings by BioPCM in present, 2020, 2050 and 2080 were shown to be 1.65%, 3.61%, 4.75% and 6.77% respectively and RUBITHERMPCM in present, 2020, 2050 and 2080 were shown to be 3.25%, 5.51%, 7.36% and 9.72% respectively. For Tokyo, gas savings by BioPCM in present, 2020, 2050 and 2080 were shown to be 7.60%, 22.94%, 30.13% and 38.43% respectively and RUBITHERMPCM in present, 2020, 2050 and 2080 were shown to be 10.63%, 29.44%, 37.62% and 46.86% respectively. For Hong Kong, gas savings by BioPCM in present, 2020, 2050 and 2080 were shown to be 67.20%, 62.07%, 88.33% and 0.00% respectively and RUBITHERMPCM in present, 2020, 2050 and 2080 were shown to be 76.92%, 69.40%, 93.33% and 0.00%) respectively.
Finally, Future climate change will not have much effect on the energy saving potential of a PCM with characteristics appropriate to the local climate and prevailing conditions. In future work, it would be interesting to answer the questions: What are the appropriate characteristics of the PCM within the local climate prevailing conditions? What temperature ranges are the best for each day? How can these values predicted the day before so the controller can change the set ranges of the building envelope heating unit?

Acknowledgments

This work was supported by the National Research Foundation of Korea (NRF) grant funded by the Basic Science Research Program through the National Research Foundation of Korea (NRF) funded by the Ministry of Science, ICT and Future Planning (NRF-2017R1D1A1A09000639).

Author Contributions

Abdo Abdullah Ahmed Gassar performed simulations, analyzed the data and wrote the paper. Geun Young Yun designed the research methods and wrote the paper.

Conflicts of Interest

The authors declare no conflict of interest.

References

  1. Heier, J.; Bales, C.; Martin, V. Combining thermal energy storing with buildings—A review. Renew. Sustain. Energy Rev. 2015, 42, 1305–1325. [Google Scholar] [CrossRef]
  2. Hussain, S.I.; Dinesh, R.; Roseline, A.A.; Dhivya, S.; Kalaiselvam, S. Enhanced thermal performance and study the influence of sub cooling on activated carbon dispersed eutectic PCM for cold storage. Energy Build. 2017, 143, 17–24. [Google Scholar] [CrossRef]
  3. Saffari, M.; Gracia, A.D.; Ushak, S.; Cabeza, L.F. Economic impact of integrating PCM as passive system in buildings using Fanger comfort model. Energy Build. 2016, 112, 159–172. [Google Scholar] [CrossRef]
  4. Marin, P.; Saffari, M.; Gracia, A.D.; Zhu, X.; Farid, M.M.; Cabeza, L.F.; Ushak, S. Energy savings due to the use of PCM for relocatable lightweight buildings passive heating and cooling in different weather conditions. Energy Build. 2016, 129, 274–283. [Google Scholar] [CrossRef]
  5. Vicente, R.; Silva, T. Brick masonry walls with PCM macrocapsules: An experimental approach. Appl. Therm. Eng. 2014, 67, 24–34. [Google Scholar] [CrossRef]
  6. International Energy Agency. Transition to Sustainable Building Strategies and Opportunities to 2050. 2013. Available online: https://www.iea.org/publications/freepublications/publication/Building2013_free.pdf (accessed on 8 August 2017).
  7. Moreno, P.; Sole, C.; Castell, A.; Cabeza, L.F. The use of phase change materials in domestic heat pump and air-conditioning systems for short term storage: A review. Renew. Sustain. Energy Rev. 2014, 39, 1–13. [Google Scholar] [CrossRef]
  8. Reilly, A.; Kinnane, O. The impact of thermal mass on building energy consumption. Appl. Energy 2017, 198, 108–121. [Google Scholar] [CrossRef]
  9. Gugliermetti, F.; Bisegna, F. Saving energy in residential buildings: The use fully reversible windows. Energy 2007, 32, 1235–1247. [Google Scholar] [CrossRef]
  10. Cuce, E.; Cuce, P.M.; Young, C.H. Energy saving potential of heat insulation solar glass: Key results from laboratory and in-situ testing. Energy 2016, 97, 369–380. [Google Scholar] [CrossRef]
  11. Chen, X.; Zhang, Q.; Zhai, Z.J. Energy savings potential of a ventilation system with a latent heat thermal energy storage unit under different climatic conditions. Energy Build. 2016, 118, 339–349. [Google Scholar] [CrossRef]
  12. Figueiredo, A.; Figuira, J.; Vicente, R.; Maio, R. Thermal comfort and energy performance: Sensitivity climate apply the passive house concept to the Portuguese climate. Build. Environ. 2016, 103, 276–288. [Google Scholar] [CrossRef]
  13. Pielichowska, K.; Pielichowski, K. Phase change materials for thermal energy storage. Prog. Mater. Sci. 2014, 65, 67–123. [Google Scholar] [CrossRef]
  14. Evola, G.; Marletta, L.; Sicurella, F. A methodology for investigating the effectiveness of PCM wallboard for summer thermal comfort in buildings. Build. Environ. 2013, 59, 517–527. [Google Scholar] [CrossRef]
  15. Farid, M.M.; Sharrif, A. Phase change materials for energy storage and thermal comfort in buildings. In Materials for Energy Efficiency and Thermal Comfort in Buildings; Woodhead Publishing: Cambridge, UK, 2010; pp. 384–398. Available online: https://www.safaribooksonline.com/library/view/materials-for-energy/9781845695262/xhtml/B9781845695262500165.htm (accessed on 22 July 2017).
  16. Lombard, L.P.; Ortiz, J.; Pout, C. A review on buildings energy consumption information. Energy Build. 2008, 40, 394–398. [Google Scholar] [CrossRef]
  17. Sharma, S.S. The relationship between energy and economic growth: Empirical evidence from 66 countries. Appl. Energy. 2010, 87, 3565–3574. [Google Scholar] [CrossRef]
  18. IEA. International Energy Agency. CO2 Emissions from Fuel Combustion. 2016. Available online: https://www.iea:publications/freepublications/publication/CO2EmissionsfromFuelCombustion_Highlights_2016.pdf (accessed on 13 August 2017).
  19. Seong, Y.B.; Lim, J.H. Energy saving potentials of phase change materials applied to lightweight building envelopes. Energies 2013, 6, 5219–5320. [Google Scholar] [CrossRef]
  20. Barreneche, C.; Navarro, M.E.; Fernandez, A.I.; Cabeza, L.F. Improvement of the thermal interia of building materials incorporating. Appl. Energy 2013, 109, 428–432. [Google Scholar] [CrossRef]
  21. IEA. International Energy Agency. Energy Efficiency in the North American Existing Building Stock. 2009. Available online: https://www.iea.org/publications/freepublications/publication/NAM_Building_Stockpdf (accessed on 26 July 2017).
  22. Heinonen, J.; Junnila, S. Residential energy consumption patterns and the overall housing energy requirements of urban and rural households in Finland. Energy Build. 2014, 76, 295–303. [Google Scholar] [CrossRef]
  23. UN-Habitat. State of the World’s Cities 2020/2011. UN-HABITAT, 2010. Available online: https://unhabitat.org/books/state-of-the-worlds-cities-20102011-cities-for-all-bridging-the-urban-divide/ (accessed on 30 June 2017).
  24. Hong, T. A close look at the China design standard for energy efficiency of public buildings. Energy Build. 2009, 41, 426–435. [Google Scholar] [CrossRef]
  25. Nakagami, H.; Murakoshi, C.; Iwafune, Y. International Comparison of Household Energy Consumption and Its Indicator. Available online: http://aceee.org/files/proceedings/2008/data/papers/8_24.pdf (accessed on 27 June 2017).
  26. Brown, M.A.; Cox, M.; Staver, B.; Baer, P. Climate Change and Energy Demand in Buildings; Summer Study on energy efficiency in buildings (ACEEE); Georgia Institute of Technology: Atlanta, GA, USA, 2014; pp. 26–38. [Google Scholar]
  27. Toktam, B.; Abdi, H.; Peng, L.M.; Saeid, N. A study and a directory of energy consumption data sets of buildings. Energy Build. 2015, 94, 91–99. [Google Scholar]
  28. Bellido, C.R.; Fargallo, A.P.; Arcas, J.A.P. Optimization of annual energy demand in office buildings under the influence of climate change in Chile. Energy 2016, 114, 569–585. [Google Scholar] [CrossRef]
  29. Wang, H.; Chen, Q. Impact of climate change heating and cooling energy use in buildings in the United States. Energy Build. 2014, 82, 428–436. [Google Scholar] [CrossRef]
  30. Kalvelage, K.; Passe, U.; Rabideau, S.; Takle, E.S. Changing climate: The effects on energy demand and human comfort. Energy Build. 2014, 76, 373–380. [Google Scholar] [CrossRef]
  31. Gangolells, M.; Casals, M.; Forcada, N.; Marcarulla, M.; Cuerva, E. Energy mapping of existing building stock in Spain. J. Clean. Prod. 2016, 112, 3895–3904. [Google Scholar] [CrossRef]
  32. Song, X.; Ye, C. Climate change adaptation pathways for residential buildings in southern China. Energy Procedia 2017, 105, 3062–3067. [Google Scholar] [CrossRef]
  33. Guarino, F.; Athienitis, A.; Cellura, M.; Bastien, D. PCM thermal storage design in building: Experimental studies and applications to solaria in cold climates. Appl. Energy 2017, 185, 95–106. [Google Scholar] [CrossRef]
  34. Gracia, A.D.; Cabeza, L.F. Phase change materials and thermal energy storage for buildings. Energy Build. 2015, 103, 414–419. [Google Scholar] [CrossRef]
  35. Iten, M.; Liu, S.; Shukla, A. A review on the air-PCM-TES application for free cooling and heating in the buildings. Renew. Sustain. Energy Rev. 2016, 61, 175–186. [Google Scholar] [CrossRef]
  36. Cabeza, L.F.; Castellon, C.; Nogues, M.; Medrano, M. Use of microencapsulated PCM in concrete walls for energy savings. Energy Build. 2007, 39, 113–119. [Google Scholar] [CrossRef]
  37. Lee, K.O.; Medina, M.A.; Erik, R.; Sun, X. Assessing the integration of a thin phase change materials (PCM) layer in a residential building wall for heat transfer reduction and management. Appl. Energy. 2015, 137, 699–706. [Google Scholar] [CrossRef]
  38. Soares, N.; Gaspar, A.R.; Santos, P.; Costa, J.J. Multi-dimensional optimization of the incorporation of PCM-drywalls in lightweight steel-framed residential buildings in different climates. Energy Build. 2014, 70, 411–421. [Google Scholar] [CrossRef]
  39. Devaux, P.; Farid, M.M. Benefits of PCM underfloor heating with PCM wallboards for space heating in winter. Appl. Energy 2017, 191, 593–602. [Google Scholar] [CrossRef]
  40. Alam, M.; Jamil, H.; Sanjayan, J.; Wilson, J. Energy saving potential of phase change materials in major Australian cities. Energy Build. 2014, 78, 192–201. [Google Scholar] [CrossRef]
  41. Souayfane, F.; Fardoun, F.; Biwole, P.H. Phase change materials (PCM) for cooling applications in buildings: A review. Energy Build. 2016, 129, 396–431. [Google Scholar] [CrossRef]
  42. Lauck, J.S.S.; Sailor, D.J. Evaluation of phase change materials for improving thermal comfort in a super-insulated residential building. Energy Build. 2014, 79, 32–40. [Google Scholar] [CrossRef]
  43. Goudarzi, H.; Mostafaeipour, A. Energy saving evaluation of passive systems for residential buildings in hot dry regions. Renew. Sustain. Energy Rev. 2017, 68, 432–446. [Google Scholar] [CrossRef]
  44. Virgone, J.; Kuznik, F. Experimental investigation of wallboard containing phase change materials: Data for validation of Numerical Modeling. Energy Build. 2009, 41, 561–570. [Google Scholar] [CrossRef]
  45. DOE’s Commercial Reference Building Models. Available online: https://energy.gov/eere/buildings/commercial-reference-buildings (accessed on 12 July 2017).
  46. ASHRAE. ANSI/ASHRAE Standard 140-2007 Standard Method of Test for the Evaluation of Building Energy Analysis Computer Programs; ASHRAE: Atlanta, GA, USA, 2011; Available online: https://www.ashrae.org/File%20Library/docLib/StdsAddenda/140_2007_c.pdf (accessed on 26 June 2017).
  47. Henninger, R.H.; Witte, M.J. EnergyPlus Testing with Building Thermal Envelope and Fabric Load Tests from ANSI/ASHRAE Standard 140-2007. Available online: http://www.labeee.ufsc.br/sites/default/files/disciplinas/ECV4202_EnergyPlus%20testing%20with%20Ashrae140.pdf (accessed on 1 July 2017).
  48. Velasco, P.C.T.; Christensen, C.; Bianchi, M.; Booten, C. Verification and Validation of EnergyPlus Conduction Finite Difference and Phase Change Materials Models for Opaque Wall Assemblies. National Renewable Energy Laboratory; 15013 Denver West Parkway. NREL/TP-5500-55792; July 2012. Available online: https://www.nrel.gov/docs/fy12osti/55792.pdf (accessed on 5 August 2017).
  49. EnergyPlus Input Output Reference. The Encyclopedic Reference to EnergyPlus Input and Output. 2014. Available online: https://energyplus.net/sites/default/files/pdfs/pdfs_v8.3.0/InputOutputReference.pdf (accessed on 15 July 2017).
  50. Kuznik, F.; Virgone, J. Experimental assessment of a phase change materials for wall building use. Appl. Energy 2009, 86, 2038–2046. [Google Scholar] [CrossRef]
  51. Muruganantham, K. Application of Phase Change Materials in Buildings: Field Data vs. EnergyPlus Simulation. Master’s Thesis, Arizona State University, Tempe, AZ, USA, 2010. Available online: https://search.proquest.com/openview/e5307b9e61f236829dd2bc52f0d866f9/1?pq-origsite=gscholar&cbl=18750&diss=y (accessed on 25 June 2017).
  52. BioPCM. Phase change Energy Solutions. 2017. Available online: https://www.phasechange.com (accessed on 1 July 2017).
  53. Velasco, P.C.T.; Christensen, C.; Bianchi, M. Verification and Validation of EnergyPlus phase change materials model for opaque wall assemblies. Build. Environ. 2012, 54, 186–196. [Google Scholar] [CrossRef]
  54. RUBITHERM. Rubitherm Technologies GmbH. 2017. Available online: http://www.rubitherm.eu (accessed on 10 July 2017).
  55. Al-saadi, S.N.; Zhai, Z. Modeling phase materials embedded in building enclosure: A review. Renew. Sustain. Energy Rev. 2013, 21, 659–673. [Google Scholar] [CrossRef]
  56. Met Office Hadley Centre for Climate Science and Services n.d. Available online: https://www.metoffice.gov.uk/climate-guide/science/science-behind-climate-change/hadley (accessed on 25 June 2017).
  57. Pope, V.B.; Gallani, M.L.; Rowntree, P.R.; Stratton, R.A. The impact of new physical parametrizations in the Hadley center climate model: HadAM3. Clim. Dyn. 2000, 16, 123–146. Available online: https://link.springer.com/article/10.1007/s003820050009 (accessed on 1 August 2017). [CrossRef]
  58. APEC Building Codes, Regulations, and Standards, Minimum, Mandatory and Green. Asia-Pacific Economic Cooperation, August 2013. Available online: http://publications.apec.org/publication-detail.php?pub_id=1442 (accessed on 10 July 2017).
Figure 1. Building model (DOE Department Of Energy medium office building).
Applsci 07 01219 g001
Figure 2. Construction of the building envelope: (a) wall without Phase Change Material (PCM); (b) wall with PCM; (c) roof without PCM; and (d) roof with PCM. PCM: phase change material
Applsci 07 01219 g002
Figure 3. Control volume for heat condition in EnergyPlus.
Applsci 07 01219 g003
Figure 4. Effect of PCMs on indoor air temperature in summer, Hong Kong (14–15 August).
Applsci 07 01219 g004
Figure 5. Effect of PCMs on indoor air temperature in winter, Hong Kong (14–15 January).
Applsci 07 01219 g005
Figure 6. Effect of PCMs on the operative temperature profile in summer, Tokyo (14–15 August).
Applsci 07 01219 g006
Figure 7. Effect of PCMs on the operative temperature profile in winter, Tokyo (14–15 January).
Applsci 07 01219 g007
Figure 8. Effect of PCMs on the surface temperature (14–15 August), south wall, Seoul.
Applsci 07 01219 g008
Figure 9. Effect of PCMs on the surface temperature (14–15 August), east wall, Seoul.
Applsci 07 01219 g009
Figure 10. Effect of PCMs on the surface temperature (14–15 January), south wall, Seoul.
Applsci 07 01219 g010
Figure 11. Effect of PCMs on surface temperature (14–15 January), east wall, Seoul.
Applsci 07 01219 g011
Figure 12. Effect of PCMs on surface heat storage (14–15 January), south wall, Seoul.
Applsci 07 01219 g012
Figure 13. Effect of PCMs on surface heat storage (14–15 January), east wall, Seoul.
Applsci 07 01219 g013
Figure 14. Effect of PCMs on surface heat storage (14–15 August), south wall, Seoul.
Applsci 07 01219 g014
Figure 15. Effect of PCMs on surface heat storage (14–15 August), east wall, Seoul.
Applsci 07 01219 g015
Figure 16. Annual heating ventilation and air conditioning (HVAC) system electricity savings in each region according to the PCM used.
Applsci 07 01219 g016
Figure 17. Annual HVAC system gas savings in each region according to the PCM used.
Applsci 07 01219 g017
Table 1. Wall and roof construction [3,46,47].
MaterialConductivity (W/m k)Thickness (m)U (W/m2 k)R (m2 k/W)Density (kg/m3)Specific Heat (J/kg k)
WallInt. surface coeff--8.260.121--
Plaster board0.1600.01213.330.075950840
Fiberglass quilt0.0400.0660.611.65012840
Wood siding0.1400.00915.560.064530900
Ext. Surface coeff.--29.410.034--
Overall, air-to-air--0.5141.944--
RoofInt. surface coeff--8.260.121--
Plaster board0.1600.0116.000.063950840
Fiberglass quilt0.0400.11180.362.79512840
Roof deck0.1400.0197.370.136530900
Ext. Surface coeff.--29.410.034--
Overall, air-to-air--0.3183.148--
Table 2. Window construction in PCM-integrated buildings [3,46,47]. PCM: phase change material.
Window PropertyValue
Extinction Coefficient0.0196 mm
Number of panes2
Pane thickness3.175 mm
Air-gap thickness13 mm
Index of refraction1.526
Normal direct-beam transmittance through one pane0.86156
Thermal conductivity of glass1.06 W/m k
Conductance of each glass pane333 W/m2 k
Combined radiative and convective coefficient of air gap6.297 W/m2 k
Exterior combined surface coefficient21.00 W/m2 k
Interior combined surface coefficient8.29 W/m2 k
U-value from interior air to ambient air3.0 W/m2 k
Hemispherical infrared emittance of ordinary uncoated glass0.9
Density of glass2500 kg/m3
Specific heat of glass750 j/kg k
Interior shade devicesNone
Double-pane shading coefficient at normal incidence0.907
Double-pane solar heat gain coefficient at normal incidence0.789
Table 3. Physical properties of the PCMs.
PropertiesRUBITHERMPCMDuPonEnergainPCMBioPCM
Conductivity (W/m k)0.200.180.20
Thickness (m)0.010.00530.010186
Density (Kg/m3)800855860
Specific heat (J/kg k)200025001970
Latent heat (kJ/kg)170130219
Melting point (°C)2521.629
Table 4. Characterization of the climate in Seoul, Tokyo, and Hong Kong according to the Köppen–Geiger classification.
Characterization of ClimateSeoul-KoreaTokyo-JapanHong Kong-China
Latitude37°29′ N36°10′ N22°19′ N
Longitude126°38′ E140°25′ E114°10′ E
Time zone (GMT)+9.0+9.0+8.0
Elevation (m)383565
Climate descriptionHumid tropicalHumid tropicalSubtropical
Table 5. Annual HVAC system energy loads to produce hot air in the heating period. HVAC: heating ventilation and air conditioning.
RegionPCMPresent (kWh)2020 (kWh)2050 (kWh)2080 (kWh)
Seoul, KoreaWithout PCM101,73689,50678,57168,846
BioPCM93,315 (8.28%)80,903 (9.61%)70,377 (10.43%)61,116 (11.23%)
DuPonEnergainPCM95,143 (6.48%)82,154 (8.21%)71,654 (8.80%)62,450 (9.29%)
RUBITHERMPCM94,770 (6.85%)81,809 (8.60%)71,221 (9.35%)61,993 (9.95%)
Tokyo, JapanWithout PCM84,20949,92145,69342,742
BioPCM74,126(11.97%)41,594 (16.68%)37,942 (16.96%)35,617 (16.67%)
DuPonEnergainPCM75,823 (9.96%)43,833 (12.19%)40,524 (11.31%)38,375 (10.22%)
RUBITHERMPCM75,505 (10.34%)42,706 (14.45%)39,088 (14.46%)36,698 (14.14%)
Hong Kong, ChinaWithout PCM33,83333,20032,82232,918
BioPCM28,798 (14.88%)28,265 (14.87%)18,087 (44.49%)28,446 (13.59%)
DuPonEnergainPCM31,285 (7.53%)30,578 (7.90%)30,332 (7.58%)30,584 (7.09%)
RUBITHERMPCM29,809 (11.89%)28,943 (12.82%)28,574 (12.94%)28,745 (12.68%)
1 Percent energy saving with PCM.
Table 6. Annual HVAC system energy loads to produce cold air in the cooling period.
RegionPCMPresent (kWh)2020 (kWh)2050 (kWh)2080 (kWh)
Seoul, KoreaWithout PCM135,066170,994192,804232,195
BioPCM129,697 (3.98%)165,445 (3.25%)187,496 (2.75%)227,720 (1.93%)
DuPonEnergainPCM132,025 (2.25%)168,119 (1.68%)189,986 (1.46%)229,591 (1.12%)
RUBITHERMPCM130,188 (3.61%)165,851 (3.01%)187,928 (2.53%)228,015 (1.80%)
Tokyo, JapanWithout PCM157,365219,280250,501302,461
BioPCM150,701 (4.24%)213,733 (2.53%)245,170 (2.13%)298,020 (1.47%)
DuPonEnergainPCM153,566 (2.41%)216,324 (1.35%)247,546 (1.18%)299,543 (0.96%)
RUBITHERMPCM151,416 (3.78%)214,525 (2.17%)246,139 (1.74%)298,683 (1.25%)
Hong Kong, ChinaWithout PCM339,322380,804412,229459,115
BioPCM335,230 (1.21%)378,311 (0.65%)269,064 (34.73%)462,885 (-0.80%)
DuPonEnergainPCM336,022 (0.97%)377,577 (0.85%)408,977 (0.79%)456,707 (0.52%)
RUBITHERMPCM334,295 (1.48%)376,257 (1.19%)408,546 (0.89%)457,373 (0.38%)
1 Percent energy saving with PCM.
Table 7. Annual HVAC system energy loads (operation) during the heating period.
RegionPCMPresent (kWh)2020 (kWh)2050 (kWh)2080 (kWh)
Seoul, KoreaWithout PCM8384679757574743
BioPCM7844 (6.44%)6286 (7.52%)5304 (7.87%)4341 (8.47%)
DuPonEnergainPCM7624 (9.06%)6042 (11.11%)5062 (12.07%)4105 (13.45%)
RUBITHERMPCM7719 (7.93%)6142 (9.64%)5160 (10.37%)4221 (11.01%)
Tokyo, JapanWithout PCM6753295123091724
BioPCM6068 (10.14%)2505 (15.11%)1951 (15.51%)1445 (16.18%)
DuPonEnergainPCM5825 (13.75%)2329 (21.08%)1811 (21.57%)1342 (22.16%)
RUBITHERMPCM5939 (12.06%)2405 (18.50%)1867 (19.14%)1381 (19.90%)
Hong Kong, ChinaWithout PCM72211,1129,0297,096
BioPCM617 (14.54%)9198 (17.22%)7351 (18.59%)5946 (16.21%)
DuPonEnergainPCM581 (19.53%)8666 (22.01%)7152 (20.79%)5906 (16.77%)
RUBITHERMPCM583 (19.25%)8546 (23.09%)6874 (23.87%)5492 (22.60%)
1 Percent energy saving with PCM.
Table 8. Annual HVAC system energy loads (operation) during the cooling period.
RegionPCMPresent (kWh)2020 (kWh)2050 (kWh)2080 (kWh)
Seoul, KoreaWithout PCM26,10129,57630,34332,097
BioPCM25,206 (3.43%)28,693 (2.99%)29,511 (2.74%)31,342 (2.35%)
DuPonEnergainPCM25,017 (4.15%)28,539 (3.51%)29,356 (3.25%)31,195 (2.81%)
RUBITHERMPCM25,035 (4.08%)28,518 (3.58%)29,350 (3.27%)31,188 (2.83%)
Tokyo, JapanWithout PCM28,44534,48736,03041,617
BioPCM27,347 (3.86%)33,481 (2.92%)35,091 (2.61%)41,327 (0.70%)
DuPonEnergainPCM27,178 (4.45%)33,468 (2.95%)35,127 (2.51%)41,311 (0.73%)
RUBITHERMPCM27,202 (4.37%)33,391 (3.18%)35,033 (2.77%)41,173 (1.07%)
Hong Kong, ChinaWithout PCM34,58638,24639,71741,617
BioPCM34,098 (1.41%)37,738 (1.33%)39,273 (1.12%)41,327 (0.70%)
DuPonEnergainPCM34,149 (1.26%)37,815 (1.13%)39,332 (0.97%)41,311 (0.73%)
RUBITHERMPCM33,994 (1.71%)37,634 (1.60%)39,170 (1.38%)41,173 (1.07%)
1 Percent energy saving with PCM.
Table 9. Peak annual electricity demand by the HVAC system in each region.
RegionPCMPresent (kWh)2020 (kWh)2050 (kWh)2080 (kWh)
Seoul, KoreaWithout PCM340,661339,128338,961356,690
BioPCM312,676 (8.21%)311,373 (8.18%)312,477 (7.81%)332,044 (6.91%)
DuPonEnergainPCM323,097 (5.16%)320,756 (5.42%)321,654 (5.11%)340,715 (4.48%)
RUBITHERMPCM318,423 (6.53%)315,552 (6.95%)316,537 (6.62%)335,950 (5.82%)
Tokyo, JapanWithout PCM327,679310,043327,410365,575
BioPCM295,918 (9.69%)282,812 (8.78%)301401 (7.94%)341,450 (6.60%)
DuPonEnergainPCM306,854 (6.36%)293,228 (5.42%)312102 (4.68%)351,656 (3.81%)
RUBITHERMPCM301,838 (7.89%)287,355 (7.32%)306020 (6.53%)345,558 (5.48%)
Hong Kong, ChinaWithout PCM356,171387,911412889452,682
BioPCM337,832 (5.15%)370,962 (4.37%)397,553 (3.71%)441,416 (2.49%)
DuPonEnergainPCM346,177 (2.81%)377,858 (2.59%)403,101 (2.37%)443,918 (1.94%)
RUBITHERMPCM340,316 (4.45%)371,729 (4.17%)397,256 (3.79%)438,635 (3.10%)
1 Percent electricity saving with PCM.
Table 10. Peak annual gas demand by the HVAC system in each region.
RegionPCMPresent (kWh)2020 (kWh)2050 (kWh)2080 (kWh)
Seoul, KoreaWithout PCM82,26573,73454,85838,369
BioPCM80,906 (1.65%)71,076 (3.61%)52,254 (4.75%)35,769 (6.77%)
DuPonEnergainPCM76,832 (6.60%)66,583 (9.70%)48,036 (12.44%)32,002 (16.59%)
RUBITHERMPCM79,595 (3.25%)69,672 (5.51%)50,822 (7.36%)34,641 (9.72%)
Tokyo, JapanWithout PCM53,32210,49556222573
BioPCM49,268 (7.60%)8087 (22.94%)3928 (30.13%)1584 (38.43%)
DuPonEnergainPCM44,557 (16.44%)6049 (42.36%)2723 (51.57%)984 (61.76%)
RUBITHERMPCM47,653 (10.63%)7405 (29.44%)3507 (37.62%)1367 (46.86%)
Hong Kong, ChinaWithout PCM65232600.4
BioPCM21 (67.20%)88 (62.07%)07 (88.33%)0.0 (0.00%)
DuPonEnergainPCM06 (90.77%)39 (83.19%)00 (00.00%)0.0 (0.00%)
RUBITHERMPCM15 (76.92%)71 (69.40%)04 (93.33%)0.0 (0.00%)
1 Percent gas saving with PCM.

