Article

Effects of Viewing Displays from Different Distances on Human Visual System

by
Mohamed Z. Ramadan
1,
Mohammed H. Alhaag
1,* and
Mustufa Haider Abidi
2
1
Industrial Engineering Department, King Saud University, Riyadh 11421, Saudi Arabia
2
Raytheon Chair for Systems Engineering (RCSE), Advanced Manufacturing Institute, King Saud University, Riyadh 11421, Saudi Arabia
*
Author to whom correspondence should be addressed.
Appl. Sci. 2017, 7(11), 1153; https://doi.org/10.3390/app7111153
Submission received: 3 October 2017 / Revised: 1 November 2017 / Accepted: 6 November 2017 / Published: 9 November 2017
(This article belongs to the Special Issue Socio-Cognitive and Affective Computing)

Abstract

:
The current stereoscopic 3D displays have several human-factor issues including visual-fatigue symptoms such as eyestrain, headache, fatigue, nausea, and malaise. The viewing time and viewing distance are factors that considerably affect the visual fatigue associated with 3D displays. Hence, this study analyzes the effects of display type (2D vs. 3D) and viewing distance on visual fatigue during a 60-min viewing session based on electroencephalogram (EEG) relative beta power, and alpha/beta power ratio. In this study, twenty male participants watched four videos. The EEGs were recorded at two occipital lobes (O1 and O2) of each participant in the pre-session (3 min), post-session (3 min), and during a 60-min viewing session. The results showed that the decrease in relative beta power of the EEG and the increase in the alpha/beta ratio from the start until the end of the viewing session were significantly higher when watching the 3D display. When the viewing distance was increased from 1.95 m to 3.90 m, the visual fatigue was decreased in the case of the 3D-display, whereas the fatigue was increased in the case of the 2D-display. Moreover, there was approximately the same level of visual fatigue when watching videos in 2D or 3D from a long viewing distance (3.90 m).

1. Introduction

Numerous studies have been conducted to evaluate the visual fatigue caused because of watching 3D displays using electroencephalogram (EEG) [1,2,3,4,5,6,7,8,9,10,11,12,13,14,15,16]. The EEG method is selected as it is the most significant and reliable physiological measure for evaluating mental fatigue [17,18,19,20,21]. The EEG signals detect the slight electrical potentials (generally less than 300 μV) produced by the brain as a continuous graphical distribution of spatiotemporal of voltage over time. Using the frequency domain of the EEG signals, particularly frequency bandwidths, help in revealing the functional states of the brain [22,23]. De Waard [22], and Fisch and Spehlmann [23] classified the EEG signal into four characteristic waves based on their frequency, namely delta wave (δ, 0–4 Hz), theta wave (θ, 4–8 Hz), alpha wave (α, 8–13 Hz), and beta wave (β, 13–30 Hz). The delta (δ) wave is usually related to the depth of sleep; moreover, this wave is associated with specific encephalopathic diseases and underlying lesions [13]. The theta (θ) wave is related to drowsiness. The wave is associated with cases observed during hypnogogic states, light sleep, clear dreaming, preconscious state just before falling asleep; and just after waking up. The alpha (α) wave is related to an alert, relaxed state of consciousness, which decreases with increase in visual flow; and with open eyes and extreme sleepiness. The beta (β) wave is often related to various states such as busy, active, or active concentration and worried thinking [24].
Studies have been conducted on visual fatigue using EEG signals, because in-depth information associated with the physiological states is included in the analysis of EEG signals. Evaluating the β-power frequency of the EEG is one of the methods used to measure visual fatigue. Kim and Lee [1], and Li et al. [9] used this method to measure the visual fatigue of participants after viewing three dimensional (3D) television (TV). Kim and Lee [1], and Li et al. [9] showed that the β-power frequencies (frequency band >12 Hz) were negligible in the 2D cases, but not in the 3D cases; the frequencies increased with the increase in the viewing duration. The results showed that watching a 3D movie increased the EEG power compared to the case of watching a 2D movie. In particular, Kim and Lee [1] revealed that α band had less significance compared to the β band concerning comparative viewing of 2D and 3D movies. Tran et al. [25] explained that the four characteristic waves of the EEG signals are closely associated with brain activity, and the level of visual fatigue changed with the change in the energy of the EEG waves. Belyavin and Wright [26] observed increases in the δ and θ wave frequency bands and decreases in the β frequency waveband during fatigue; the results were in good agreement with the study conducted by Subasi [27], who showed that θ frequency waveband increased with fatigue.
In other studies, the power indices of the EEG were used to evaluate visual fatigue. Cheng et al. [17] used EEG power indices (α, θ, θ/α, β/α, and ((α + θ)/β)) to evaluate the mental fatigue caused during a visual-display terminal task. The EEG power indices were significantly different before and after performing the task, and the amplitude significantly reduced after the task was performed. The results showed that after three hours of watching the visual-display terminal task, the participants appeared mentally fatigued to a significant extent. Jap et al. [28] presented four ratio algorithms to evaluate the fatigue, which were (α + θ)/β, α/β, (α + θ)/(α + β), and θ/β. The ratios increased with increase in fatigue. In addition, the algorithms show that the β wave decreased, but the change was more than α wave with respect to the fatigue. Similarly, Eoh et al. [29] showed that (α + θ)/β and α/β significantly increased whereas α and β waves were reduced. Chen et al. [6] used the four algorithms and four frequency wavebands to evaluate the visual fatigue associated with viewing 3D TVs. The results showed that in some regions in the brain, the indicators for participants watching 3D TV varied more significantly than when the participants watched 2D TV, except for the θ rhythm. When the participants were viewing 3D TV, the energy of α and β frequency bands significantly decreased, while the energy of the δ wave band significantly increased. The energy of the θ waveband remained stable.
Park et al. [5] assessed the connection between the emotional states of a teenager and relative β-band power at occipital lobe region while viewing 3D TV using some active and some passive glasses. The results showed that the relative β-band power was relatively higher while using passive (filter) glasses when compared to using active (shutter) glasses. Active 3D glasses interact wirelessly with images on a screen to enhance 3D viewing, whereas passive glasses do not [5]. With passive 3D glasses, the TV screen is coated so that light from alternate scan lines is polarized differently. The TV then interlaces two images on the screen, one for each eye.
Chen et al. [7] showed that the power spectral entropy is strongly correlated to visual fatigue. The results showed that the power spectral entropy reduced significantly after viewing 3D TV for a long time, thus indicating the decrease in the attention level of the participants. Hsu and Wang [10] investigated whether the EEG power indices (α, β, θ/α, β/α, and (α + θ)/β) were useful measures of visual fatigue when playing TV video games. The results revealed that the power indices of the EEG were valid indicators to measure visual fatigue. Hsu and Wang [10] found that β/α, β, and α EEG power were good choices to measure visual fatigue, but β/α was the best. The decreases in β/α and β power indices and increase in α power index were related to visual fatigue.
The current stereoscopic 3D displays have several human-factor issues, including visual-fatigue symptoms such as eyestrain, headache, fatigue, nausea, and malaise. The viewing distance and viewing time are considered significant contributing factors to the visual fatigue associated with 3D displays [30,31,32,33]. The viewing distance is considered an essential environmental condition and is described in the guidelines for video display terminals (VTDs) [30]. Park and Mun [34] showed that discomfort due to negative and positive conflicts in binocular disparity depends strongly on viewing distance. In addition, prolonged viewing of a 3D display increases the degree of visual fatigue [31]. Matthews [35] studied the long-term effects of visual fatigue from watching chromatic displays. The American Optometric Association found that prolonged use of visual systems could result in inefficient visual processing functions, which they considered visual fatigue [36].
Previous studies have focused on spectral variations in the various EEG frequency bands [5,6,7,8,9,10,17,25,26,27]. It has often been hypothesized that through changes in attention or onset of visual fatigue, the low-frequency waves in the EEG such as δ, θ, and α will increase, while the higher frequency waves such as β will decrease. In previous studies on the physiological responses for watching display images, responses were recorded in only pre- and post-watching periods and were then compared in order to obtain reliable methods for measuring visual fatigue. Hence, the physiological responses that occurred during watching TV displays were neglected in literature. Hence, this study investigated the effects of the display type, viewing distance, and viewing time on the visual fatigue based on the EEG relative β power of the occipital lobe (O1), α/β power of EEG, and total subjective visual discomfort score.

2. Materials and Methods

2.1. Participants

Twenty male university students with normal vision acuity with no medical history participated in this study as volunteers. The average age was 27.7 years, and the standard deviation was 2.53 years. The participants gave their informed consent before participating in the experiment, which was approved by the Human Participants Review Sub-committee of the Institutional Review Board (IRB) of King Saud University, College of Medicine, and King Khalid University Hospital (project identification code E-14-1182).

2.2. Experimental Design

In this study, four independent variables were selected: two within-subject variables and two between-subject variables. Thus, a mixed design (i.e., A × B (C × D × S)) was used to represent the experiment. The two independent between-subject variables were (A) viewing distance (3H vs. 6H, where H is the height of the screen) and (B) the display type (2D vs. 3D). Thus, it was a 2 × 2 × 8 × 4 design. Each of the (A) and (B) = 2 × 2 = 4 distance–display conditions contained S = 5 participants, and each participant watched all four movies for one hour. Two types of displays were chosen because they have been used in previous studies [6,8,11,37,38], thus allowing comparison. Moreover, the viewing distance is selected as three times and six times of the display height based on the recommendation made by the International Telecommunication Union (ITU) standards [39]. The two independent variables based on the repeated measures or within the subject variable were (C) viewing time (pre-test, T10, T20, T30, T40, T50, T60, and post-test) and (D) movies (Jurassic World, Avengers, San Andreas, and Godzilla). Park et al. [5,40] selected the viewing duration to be 45 min; however, Chen et al. [41] used 10 min, and Park et al. [38] used 1 h as the viewing period. Hence, in this study, it was decided to perform the experiment for 60 min. The EEG signal was continuously recorded starting at pre-test (3 min prior to the experiment), T10 (first 10-min period), T20 (second 10-min period), T30 (third 10-min period), T40 (fourth 10-min period), T50 (fifth 10-min period), T60 (sixth and final 10-min period), and post-test (3 min period after the experiment). The dependent variables included the relative β power and α/β power of the EEG, and total subjective visual discomfort score. Pairwise comparisons were performed to investigate the source of any significant effect considering the time factor.

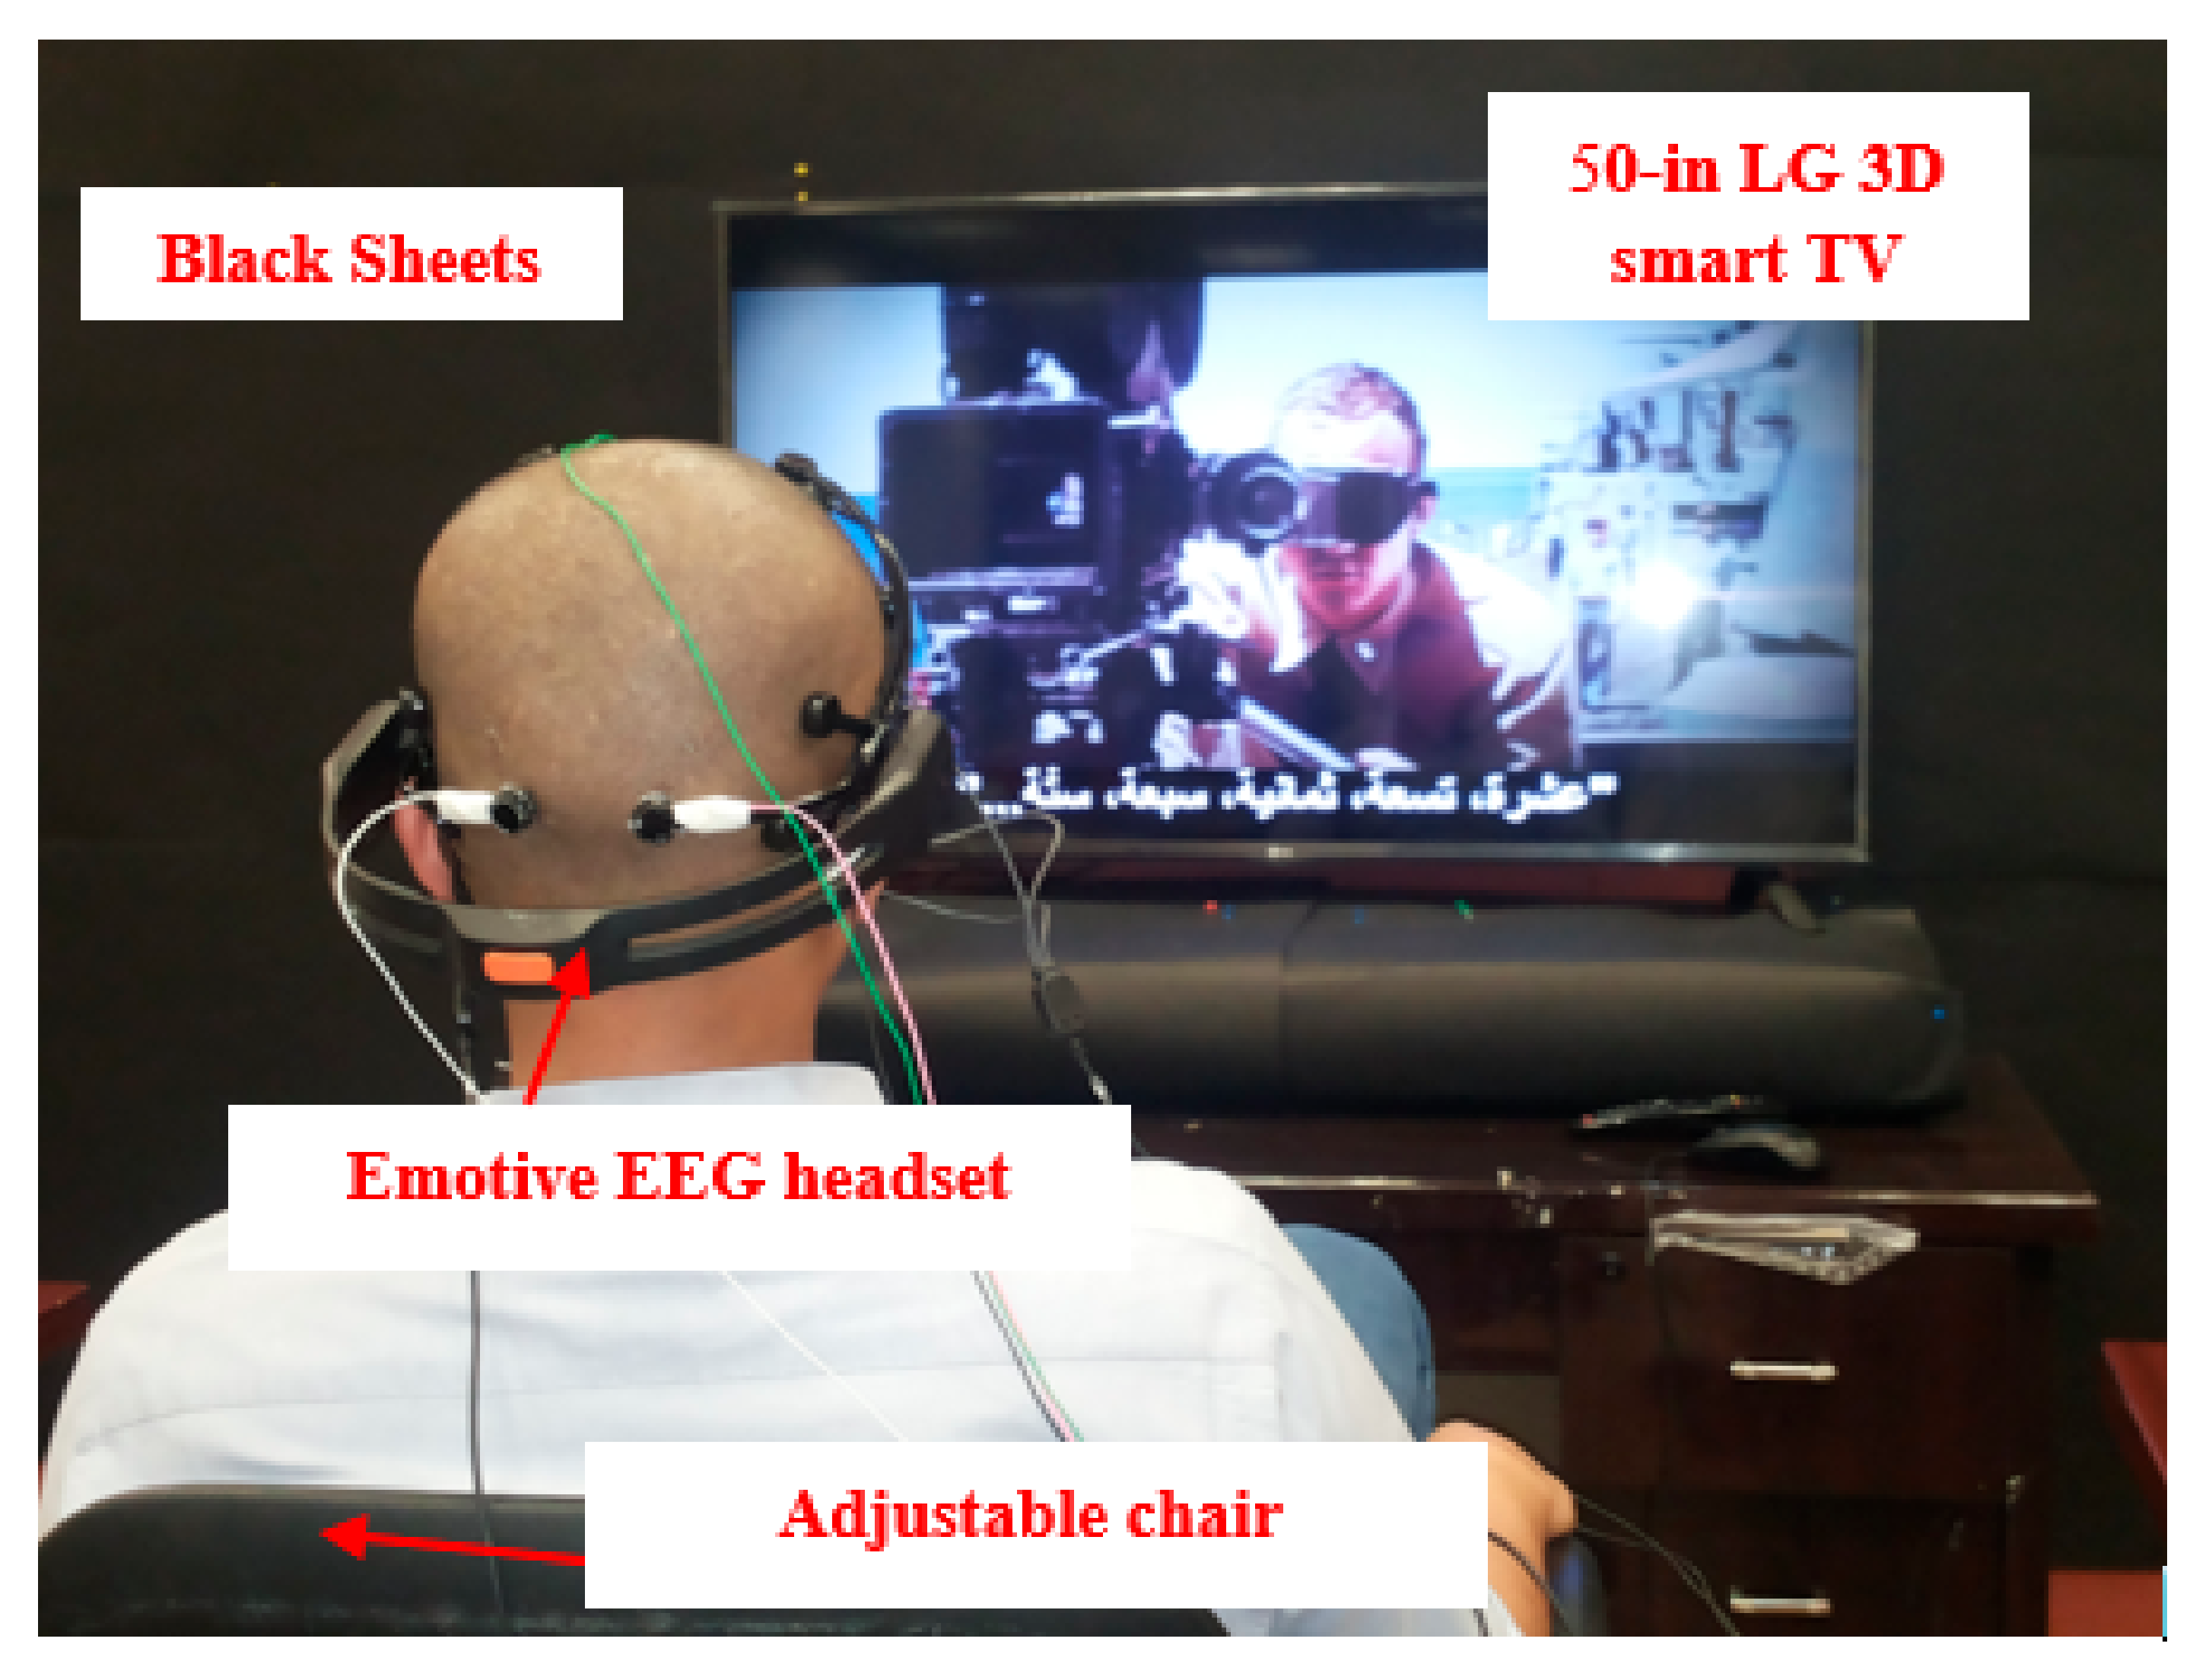
2.3. Experimental Setup

The equipment used in this study included a commercial 50-in LG 3D smart TV (50LF650T) (LG Electronics Inc., Seoul, South Korea). An eight-channel Biomonitor ME6000 (Mega Electronics Ltd., Kuopio, Finland) was used with four channels to record the EEG signals. A Snellen chart, GPM Vernier calipers (DKSH, Zürich, Switzerland), and measuring tape were used to test visual acuity, inter pupillary distance, and head dimensions, respectively. A visual discomfort questionnaire, and neurophysiological and cardiovascular assessment were used to obtain general information history. An emotive EEG headset was used to place the EEG electrodes. The software system used to record signals was Mega Win 3.0.1 (Mega Electronics Ltd.). Other materials include 70%-isopropyl-alcohol swab, cotton squares, band aid, Ag/AgCl disk electrodes for EEG, and high-viscosity electrolyte gel for active electrodes.

2.4. Experimental Procedures

First, the experimental procedure was started by setting up the environment and experimental variables. The LG 3D smart TV (50LF650T) with passive row interlaced technology was used to display the 2D and 3D videos. Table 1 lists the main specifications of the LG 3D smart TV.
The TV was placed at a height of 96 cm, and the center of the display height was at 129 cm from the lab floor. The viewing distances were set at 195 and 390 cm (3H and 6H). The background distance from the screen to the wall was 0.12 m. To avoid any disturbance to the participant’s surrounding, black sheets were pasted on the wall around the TV, as shown in Figure 1. All experiments were performed in the human-factors laboratory with an average dry-bulb temperature and relative humidity of 23.8 °C and 30.6%, respectively. The experimental zone was ensured to have no vibrations or strong odors during the test. The lighting conditions were maintained constant in the sessions. The environmental illuminance at the screen center was approximately 250 lux. The participants were seated on an adjustable chair placed in front of the display and were asked to direct their heads toward the display. To control the head movement, each participant’s back was laid on the chair, while the head was supported by the chair so that the center of the display would be at the same level as the participant’s eye position at a viewing distance of 195 or 390 cm.
Before performing the experiment, participants were introduced and welcomed to the experimental room. The participants were instructed to have a rest of a full night and avoid cigarettes or caffeine for 6 h prior to the experiment. Each participant was asked to visit the lab four times on different days for approximately 2 h each time. This allowed the physical stress associated with the four films to be evaluated on separate days without interference from other movies. The time between visits was at least 48 h. The participants were then given the opportunity to ask any questions about the study. They were informed about their rights to refuse or stop participating before or during the experiment. Each participant was then given a consent form to read and sign. Each participant filled out a demographic questionnaire. Visual acuity and color blindness tests were then conducted. During the pre-test (first visit), each participant was briefed about the objective of the study and experimental procedure as well as the time required for each visit before the experiment was performed. During the test session, they were instructed to avoid moving their head as much as possible. In addition, to avoid low blood sugar levels that may influence the experiment outcomes, each participant performed the experiment of watching 2D/or 3D movies at least two hours after having a meal. The participants agreed to placing electrodes on their skin to record the EEG. To comparatively evaluate the visual fatigue, the 20 participants were randomly allocated to one of the four groups: “View the four videos in 3D from a distance of 195 cm (3D3H)”; “View the four videos in 3D from a distance of 390 cm (3D6H.)”; “View the four videos in 2D from a distance of 195 cm (2D3H.)”; and “View the four videos in 2D from a distance of 390 cm (2D6H)”.
The four movies were randomly assigned to the participants. None of the participants were allowed to participate under more than one group to avoid bias and learning effect. In other words, if a participant watched the same movie in more than one group, the participant may become drowsy or bored, which could affect the EEG response. The configuration of the LG TV could be changed from 2D to 3D mode. The participants who watched the 3D movies wore passive 3D glasses with lenses having circular-polarizing filters. The participants were asked to answer a visual discomfort questionnaire (VDQ) involving 41 symptoms to rate their perceptions of visual fatigue twice [42,43]. The first VDQ was given before participating in the experiment, and the other was given after participation. Several measurements were performed on the participants before, during, and immediately after viewing the display. The EEG signal was recorded for 3 min (pre-test). The participants then watched the assigned movie from the designated distance in the assigned mode (2D or 3D) for 1 h while the EEG signal was continuously recorded for 60 min (this was later divided into six 10-min sessions). After the participants finished watching the movie, the EEG signal was recorded continuously for another 3 min (post-test). Finally, the participants were asked once again to rate their perceptions of visual fatigue.

2.5. Response Measures

2.5.1. Subjective Visual Discomfort Evaluation

Most early studies measured visual fatigue using questionnaires, which are not only affected by the feeling of visual fatigue but also by individual bias resulting from the emotional state of the participant. The subjective evaluation method used in this study included a total of 41 questions obtained from the studies conducted by Li [42] and Kennedy et al. [43]. The participants were asked to fill out a VDQ to rate their perceptions of visual fatigue. The total visual discomfort score was used to evaluate visual fatigue.

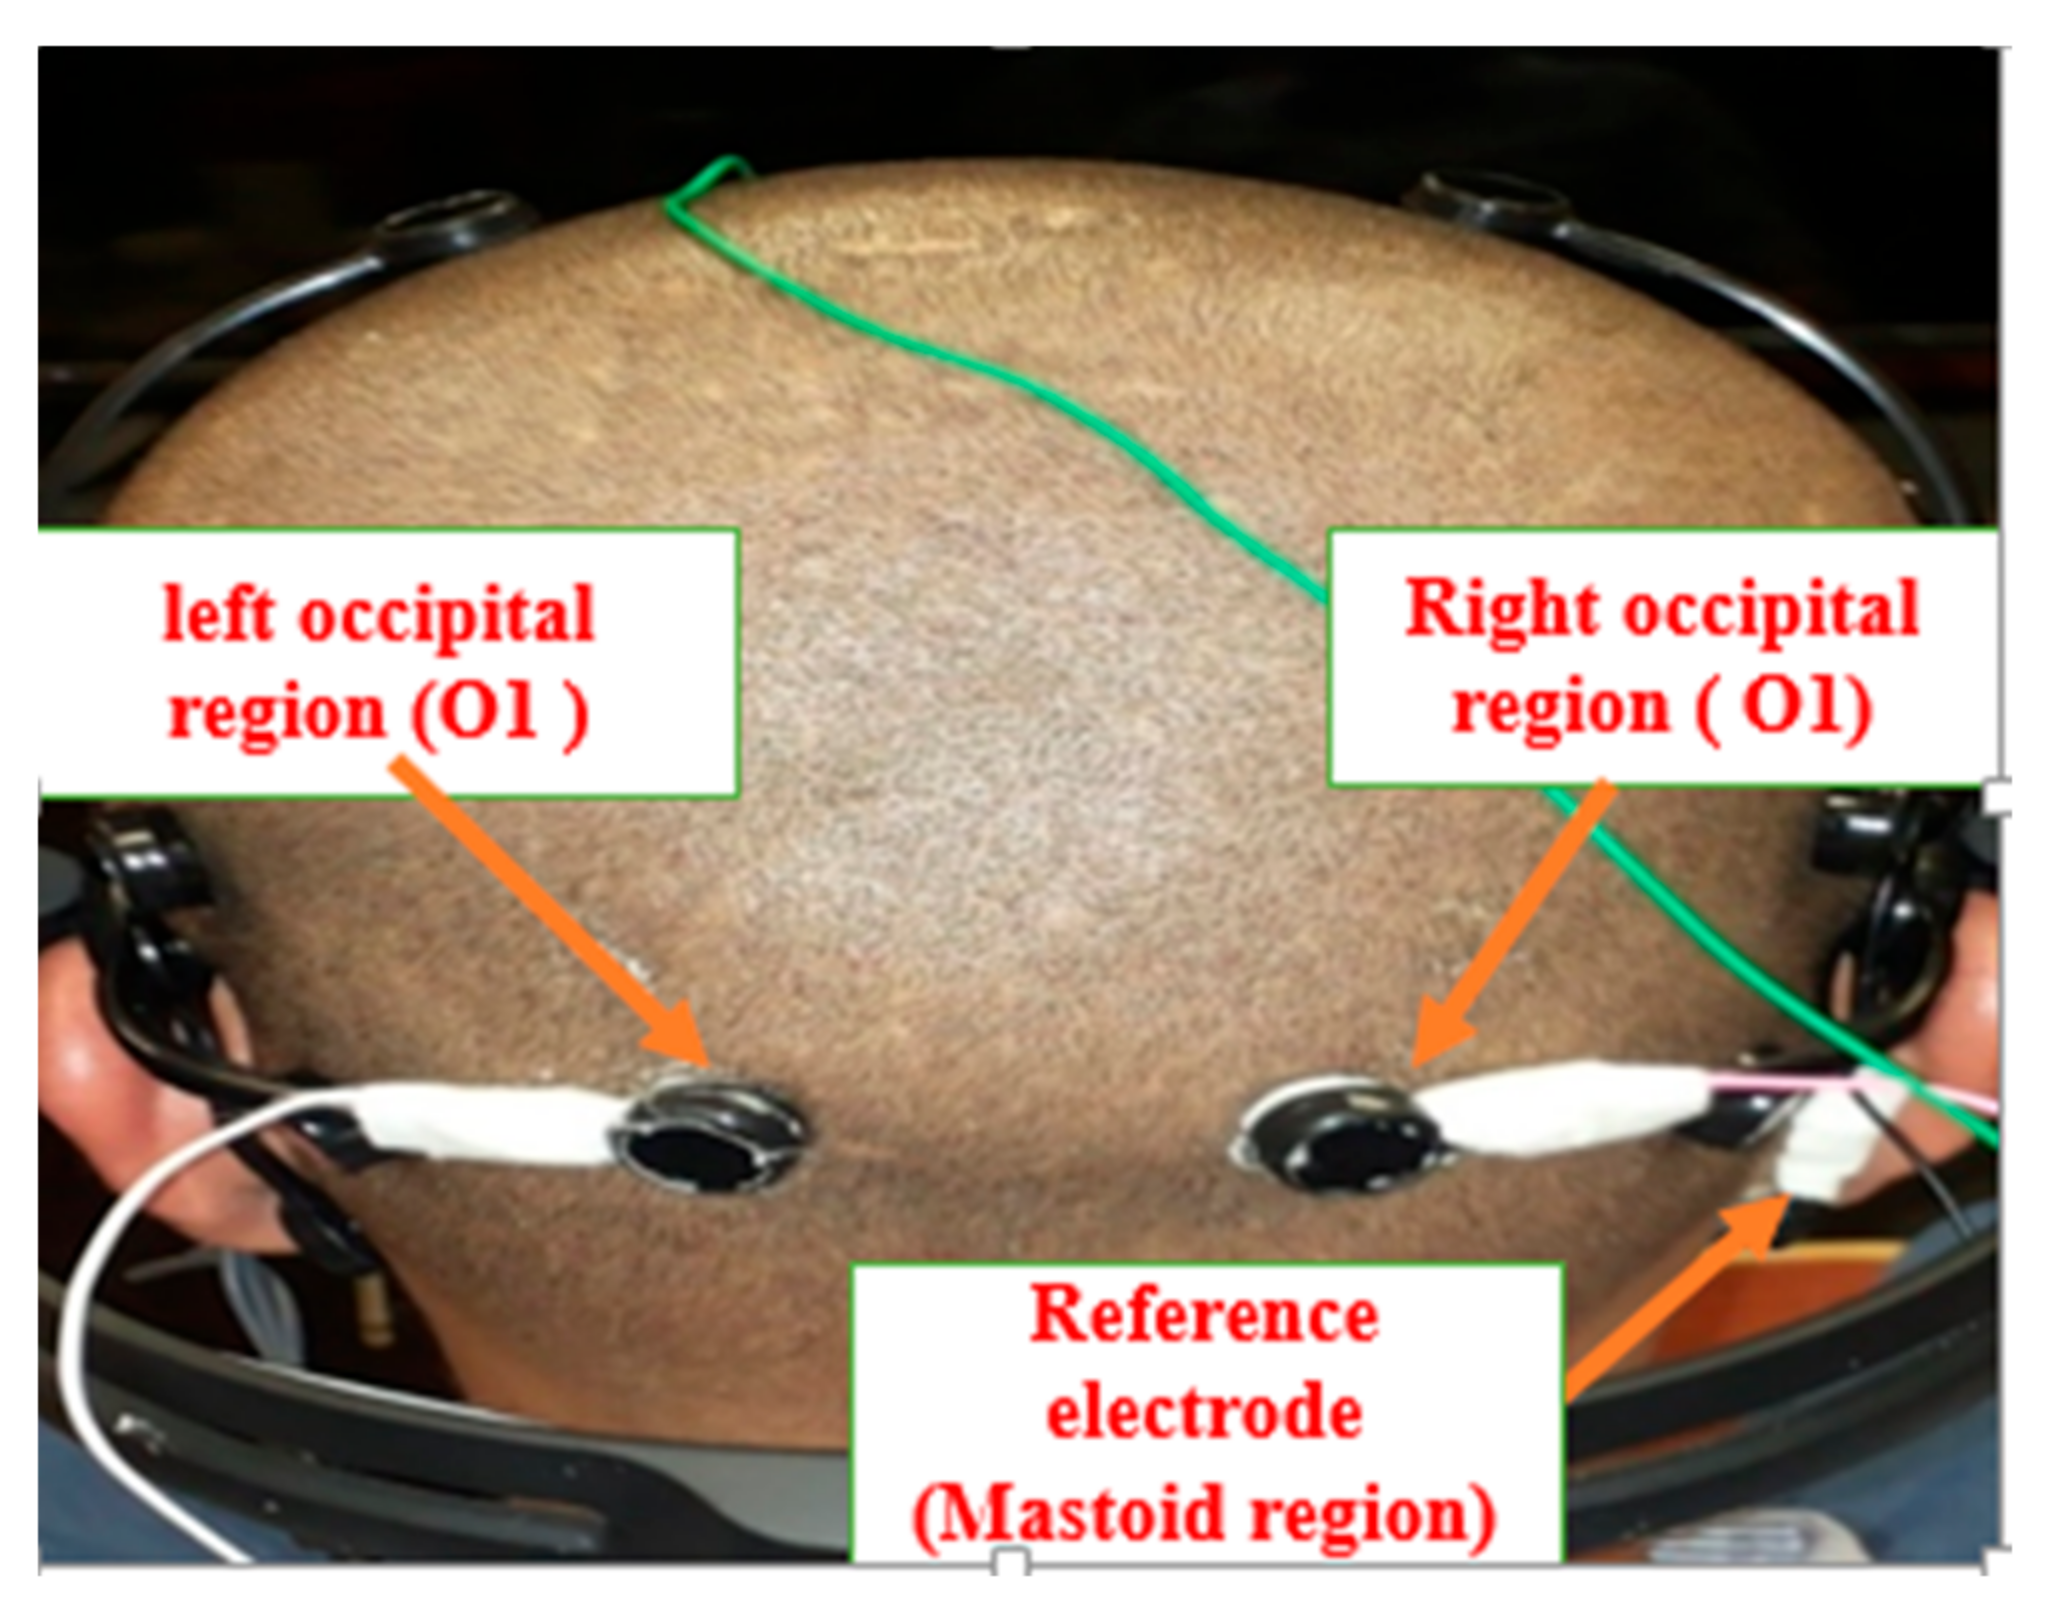
2.5.2. EEG Signal Response

The electrical activity in the brain is generated by billions of brain cells called neurons [44]. Hsu and Wang [10] suggested that the EEG data recorded from the occipital lobe, either left or right occipital lobes (either O1 or O2) are suitable to measure visual fatigue. Moreover, Iwasaki and Kurimoto [45] found that the inhibition function and the electrical activity of the cerebral cortex are relevant to visual fatigue. In this study, the EEG signals were recorded from the occipital lobes (O1 or O2). The positions of the occipital lobes (O1 and O2) were determined by calculating 10% for Oz from inion and at 5% from Oz on the left and right hemisphere of the head as O1 and O2, respectively, by adhering to the 10–20 international standard for EEG electrode placement [44]. Before placing the Ag/AgCl electrodes, the electrode sites (occipital lobes, forehead, and mastoid) were cleaned using 70% isopropyl alcohol swab, and subsequently, air dried for two minutes before performing the experiment. Thereafter, the Ag/AgCl disk electrodes were filled with super gel and placed on the prepared sites, which were held in place using the emotive headset. The reference and ground electrodes were placed over the mastoid region (behind right ear) and on the forehead of the participant, respectively [5]. Figure 2 shows the placement of the EEG electrodes. The ground, reference, O1, and O2 electrodes were connected to a four-channel EEG preamplifier for ME 6000; GND port, Ref port, ch-3, and ch-4, respectively. The four-channel EEG preamplifier was connected to ch1 and ch2 of ME 6000 device.
The EEG data were amplified and recorded by Mega win 3.1b-13 system (Mega Electronics Ltd., Kuopio, Finland), with a high-quality four-channel digital EEG amplifier for ME 6000. The EEG data was recorded from occipital lobes (both O1 and O2) with a sampling rate of 1000 Hz. Before performing any analysis on the EEG waves, the noise was separated to eliminate undesired signals. The noise was filtered using a low-pass filter (four poles Elliptic filter was used) with a cut-off frequency of 32 Hz to remove the power-line noise and another high-frequency noise. Subsequently, the signal amplitude was carefully adjusted. The EEG waves were extracted by decomposition of the EEG data using multilevel discrete wavelet transform (DWT), where DWT contains sub-band of the signal. Four levels of DWT using Debauches 4 were implemented and the information about the frequencies of the EEG waves is divided into several wavelet levels. Moreover, a Fast Fourier transform (FFT) was employed to identify the frequency contained in each level. The relative powers of the β band and α/β power ratio were the responses selected as the indicators of visual fatigue, which are response variables related to the EEG based on previous studies [28,29]. The relative power of the β band was calculated using the integrated power of a particular band divided by the sum of the integrated powers of the θ, α, and β rhythms. For example, the basic index formula of β rhythm is expressed as a basic index β = 100 × (power of β)/(power of α + power of β + power of θ). The ratio indices are defined as the proportion of the basic indices, i.e., β/α, (α + θ)/β [17,29].

2.6. Statistical Analysis

A four-way mixed repeated measures design (ANOVA) was implemented to examine the effects of the time, films, display, and distance on the response variables (EEG relative β power and α/β power ratio). The effects of watching 2D and 3D displays from particular distances on the total subjective visual discomfort score were evaluated using multivariate analysis of variance (MANOVA): a two-way multivariate analysis of variance helped compare the effect of independent variables on pre and post visual discomfort as dependent variables. Finally, pairwise comparisons were used to investigate the source of any significant effects. Statistical analysis was performed using SPSS Version 23. Specific assumptions should be met before performing the ANOVA, including homogeneity of variance in the data, normality, and continuous data (not dichotomous). Moreover, not only was the statistical significance calculated, but also, the effect size based on the partial eta-squared value (ƞ2). The partial eta-squared indicates the percentage of the variance in the dependent variables attributable to the particular independent variables [46].

3. Results

3.1. Subjective Visual Discomfort Rating

After the test, overall results showed that only the display type had a significant effect on the subjective visual discomfort as depicted in Table 2. The results revealed a significant difference in the display type pre- and post-test in term of the total subjective visual discomfort score: Wilks’ lambda = 0.864, F(2, 75) = 5.911, p = 0.004, partial eta squared = 0.136. Given the significance of the overall tests, the univariate main effects were examined. The display type was significant for conducting pre- and post-tests. As presented in Table 2, after the participants watched videos on 2D and 3D displays, individuals under the 3D condition had higher scores [total subjective visual discomfort score: F (1, 76) = 11.752, p = 0.001, partial eta squared = 0.134. The scores before the participants watched any videos were not significantly different for those watching 2D and 3D displays.

3.2. EEG Signals Response Analysis

In this research work, only the signal from the occipital lobes (O1) was analyzed because both have the same values. The responses relative β-power band and α/β power ratio were selected as the indicators of visual fatigue.

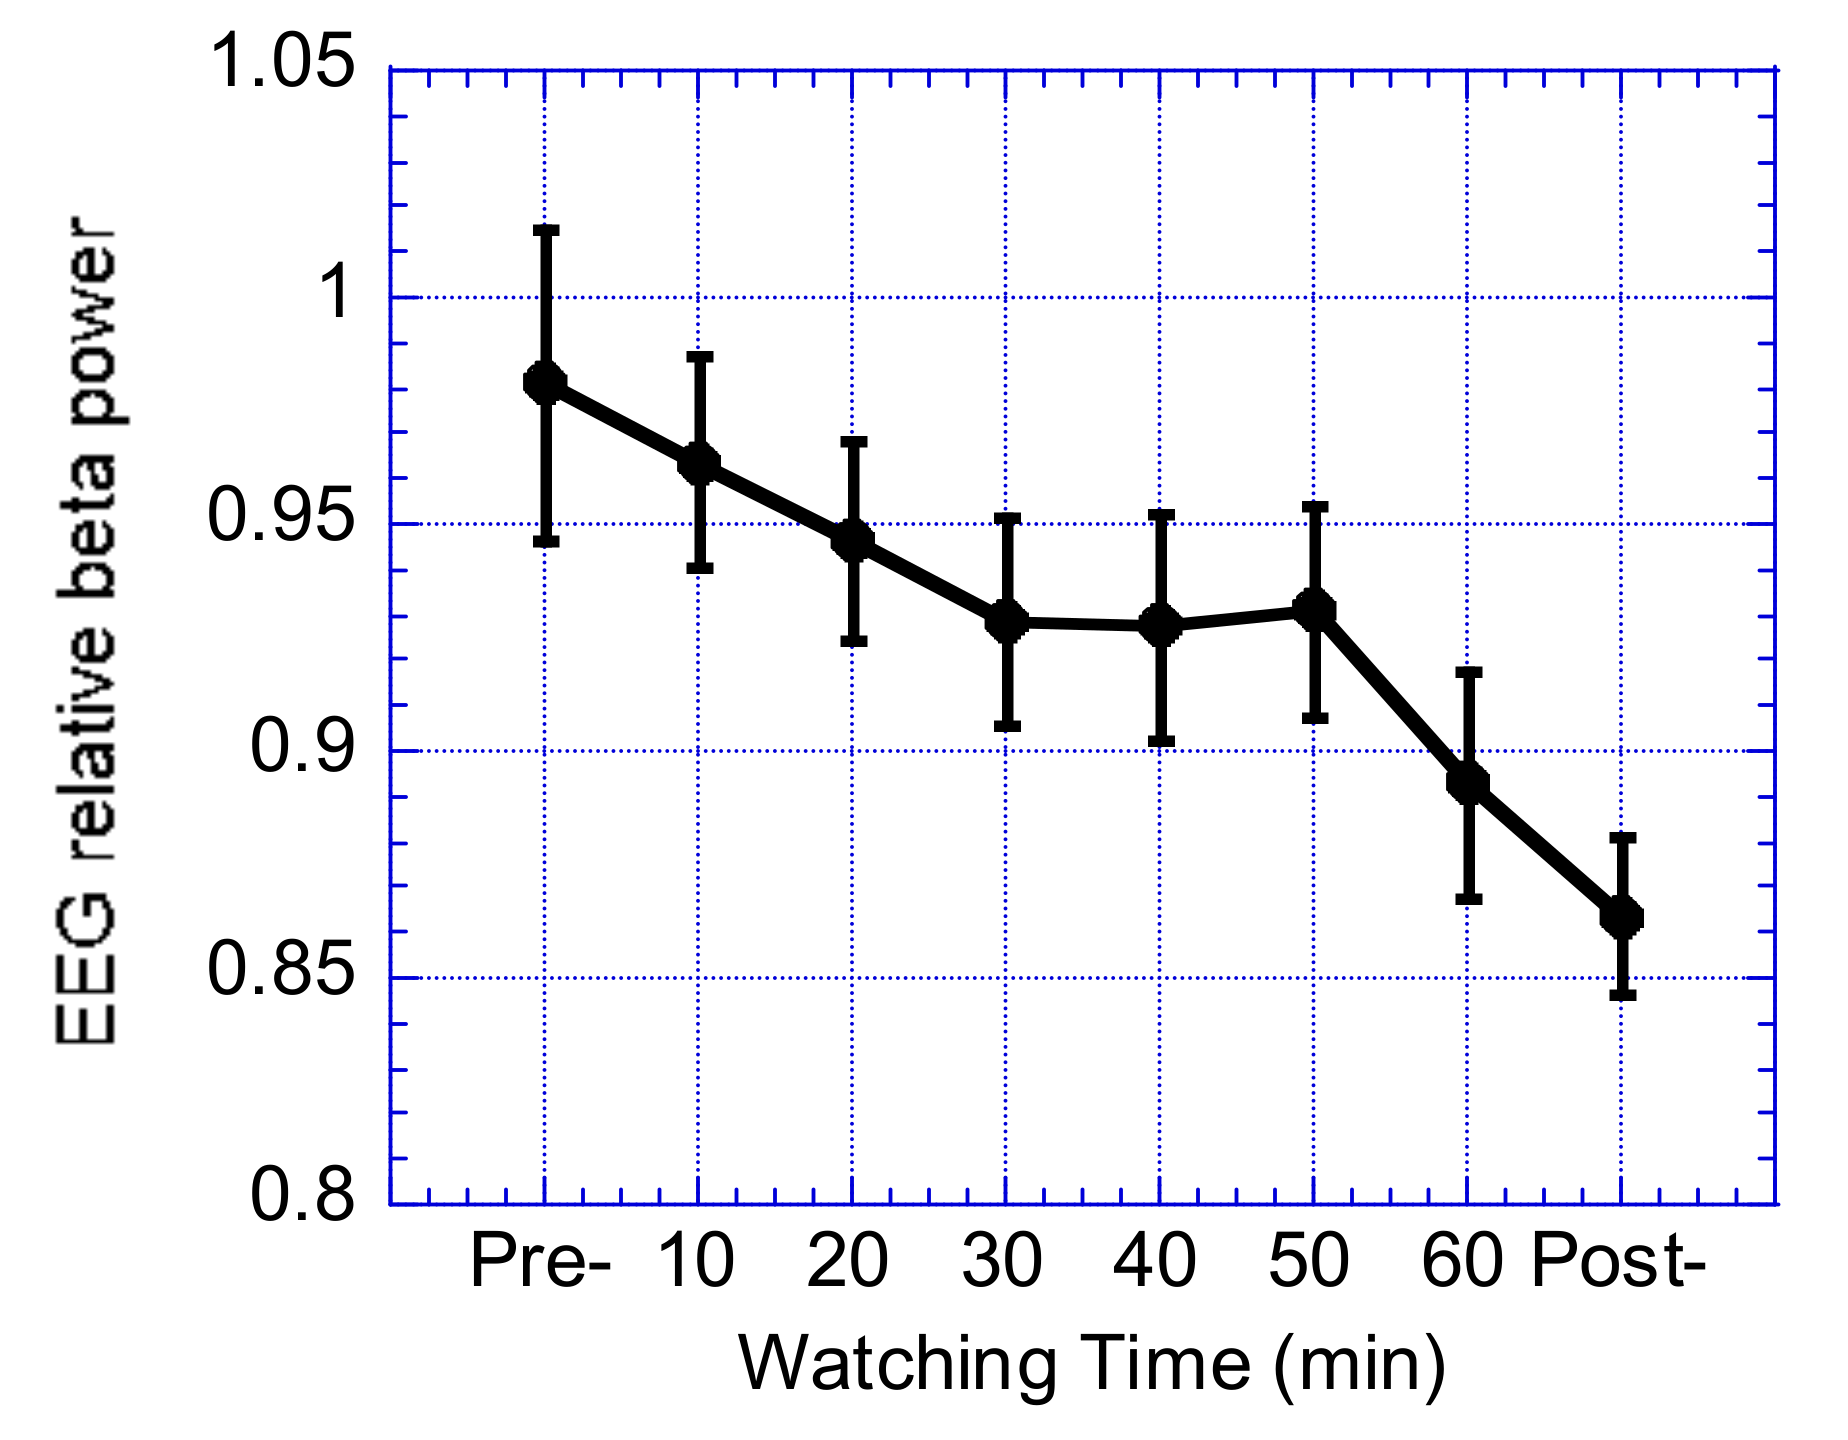
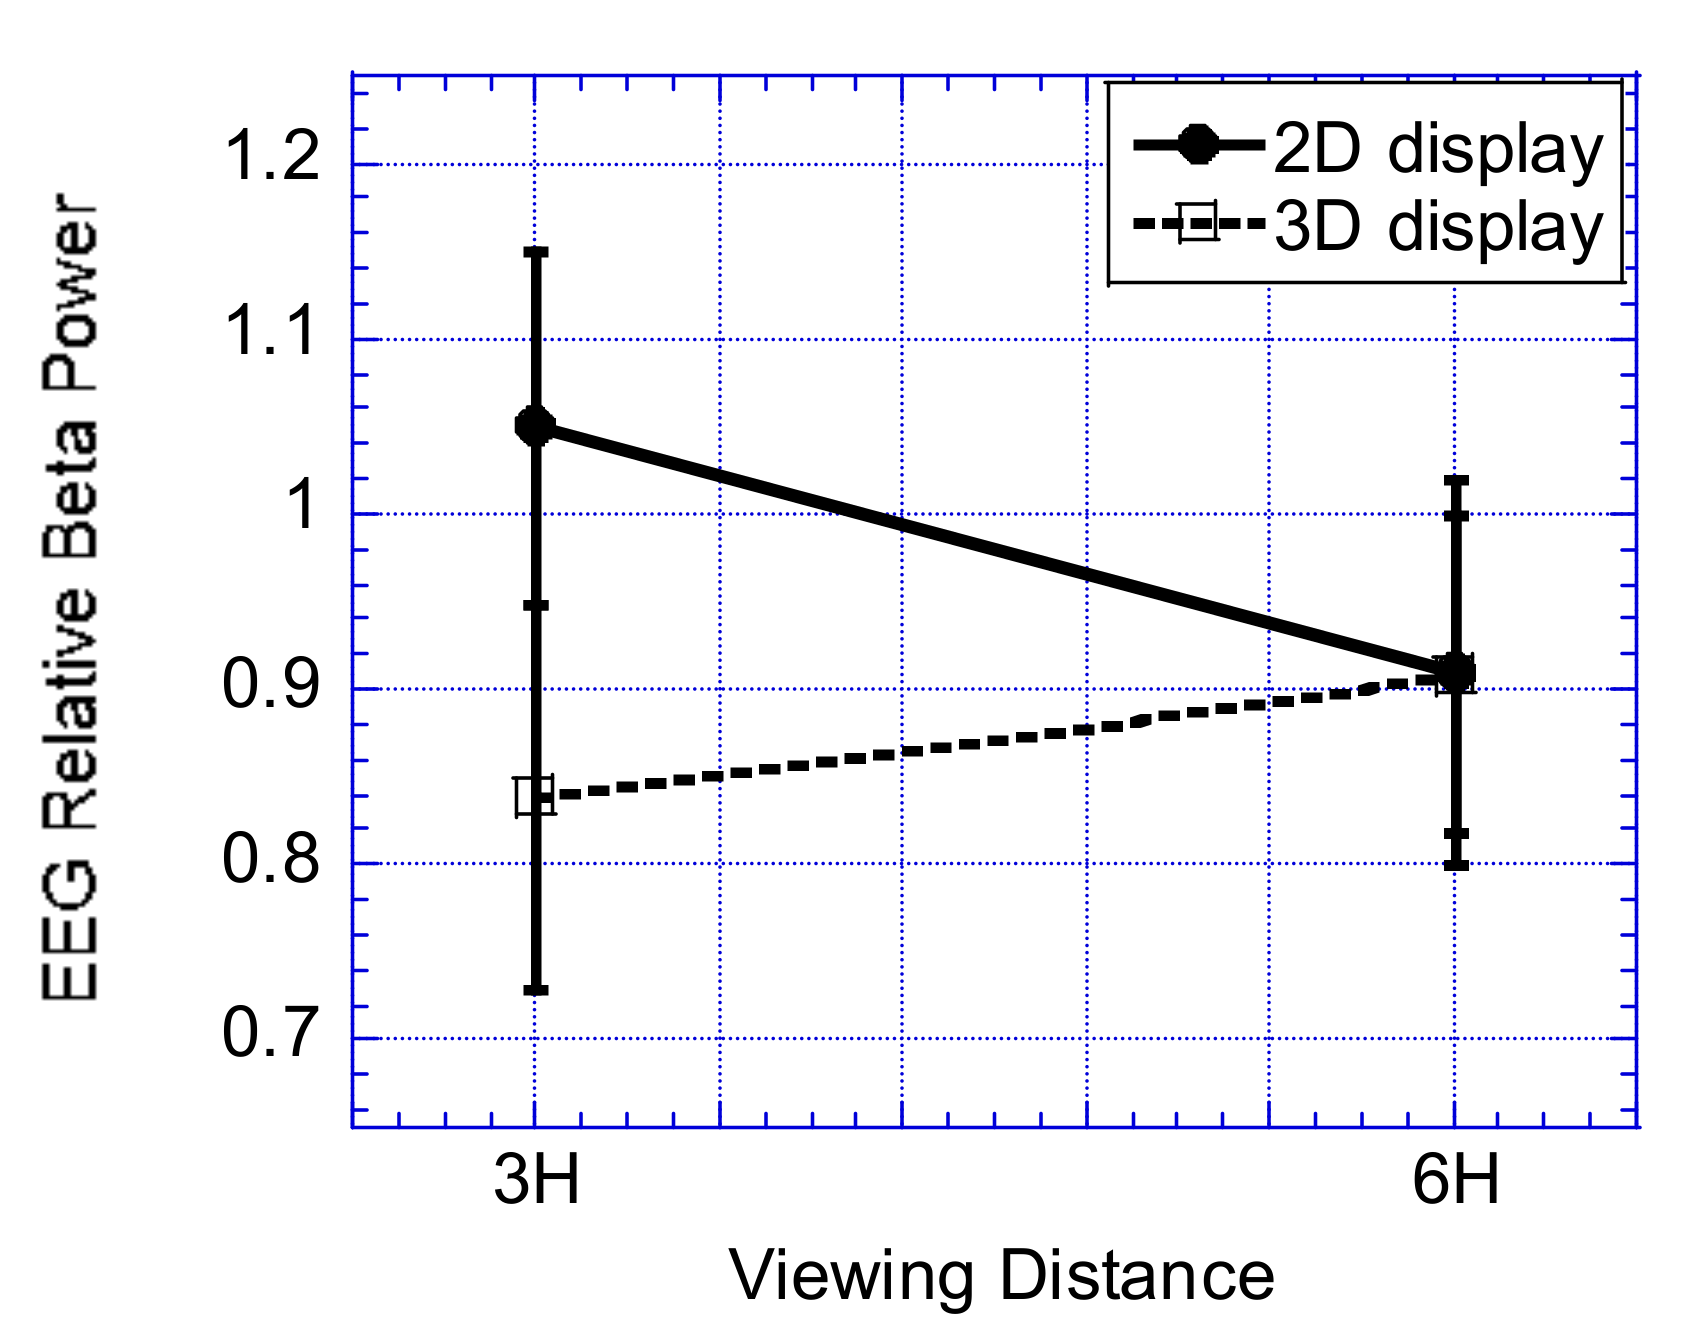
3.2.1. Relative β Power

The relative β power band (β rhythm) is expressed as relative β power band = 100 × (power of β/(power of α + power of β + power of θ)). The results showed that the viewing time has a significant effect on the relative β power of the EEG, F (7, 448) = 3.982, p < 0.0001, partial eta squared = 0.059. Moreover, the display type has a significant effect on the relative β power of the EEG, F (1, 64) = 9.332, p < 0.003, partial eta squared = 0.127. In addition, the viewing distance in terms of the display-type interaction had a significant effect on the relative β power of the EEG, F (1, 64) = 8.526, p < 0.005, partial eta squared = 0.118.
Figure 3 shows the relationship between the EEG relative β power and viewing time. The results show that the relative β power of EEG decreases slightly with the increase in viewing time from previewing to thirty minutes (session 4), and subsequently, remains stable for up to fifty minutes (session 6). Thereafter, it significantly decreases from session six until the end of the movies, p < 0.05.
Figure 4 shows the effect of the viewing distance (3H and 6H) with respect to the display type (2D and 3D) on the relative β power of the EEG. As shown in the Figure 4, the relative β power is significantly higher when watching videos in the 2D display from a short viewing distance when compared with watching the videos in 3D, F (1, 38) = 23.662, p < 0.0001, partial eta squared = 0.384. Moreover, there is no significant difference between watching the videos in 2D or 3D from a long viewing distance (6H). Moreover, when the viewing distance is changed from 3H to 6H, the relative β power was increased in case of 3D-display, while it was decreased in case of 2D-display. The difference between watching the 3D display from near or far viewing distance is insignificant (3H or 6H), F (1, 38) = 2.564, p = 0.118, partial eta squared = 0.063. In addition, there is a significant difference between watching the 2D display from different viewing distances (3H or 6H), F (1, 38) = 7.097, p = 0.011; partial eta squared = 0.157. The results show that watching the 3D display from a short viewing distance resulted in a high visual fatigue while watching the 2D display from a short viewing distance resulted in a low visual fatigue.

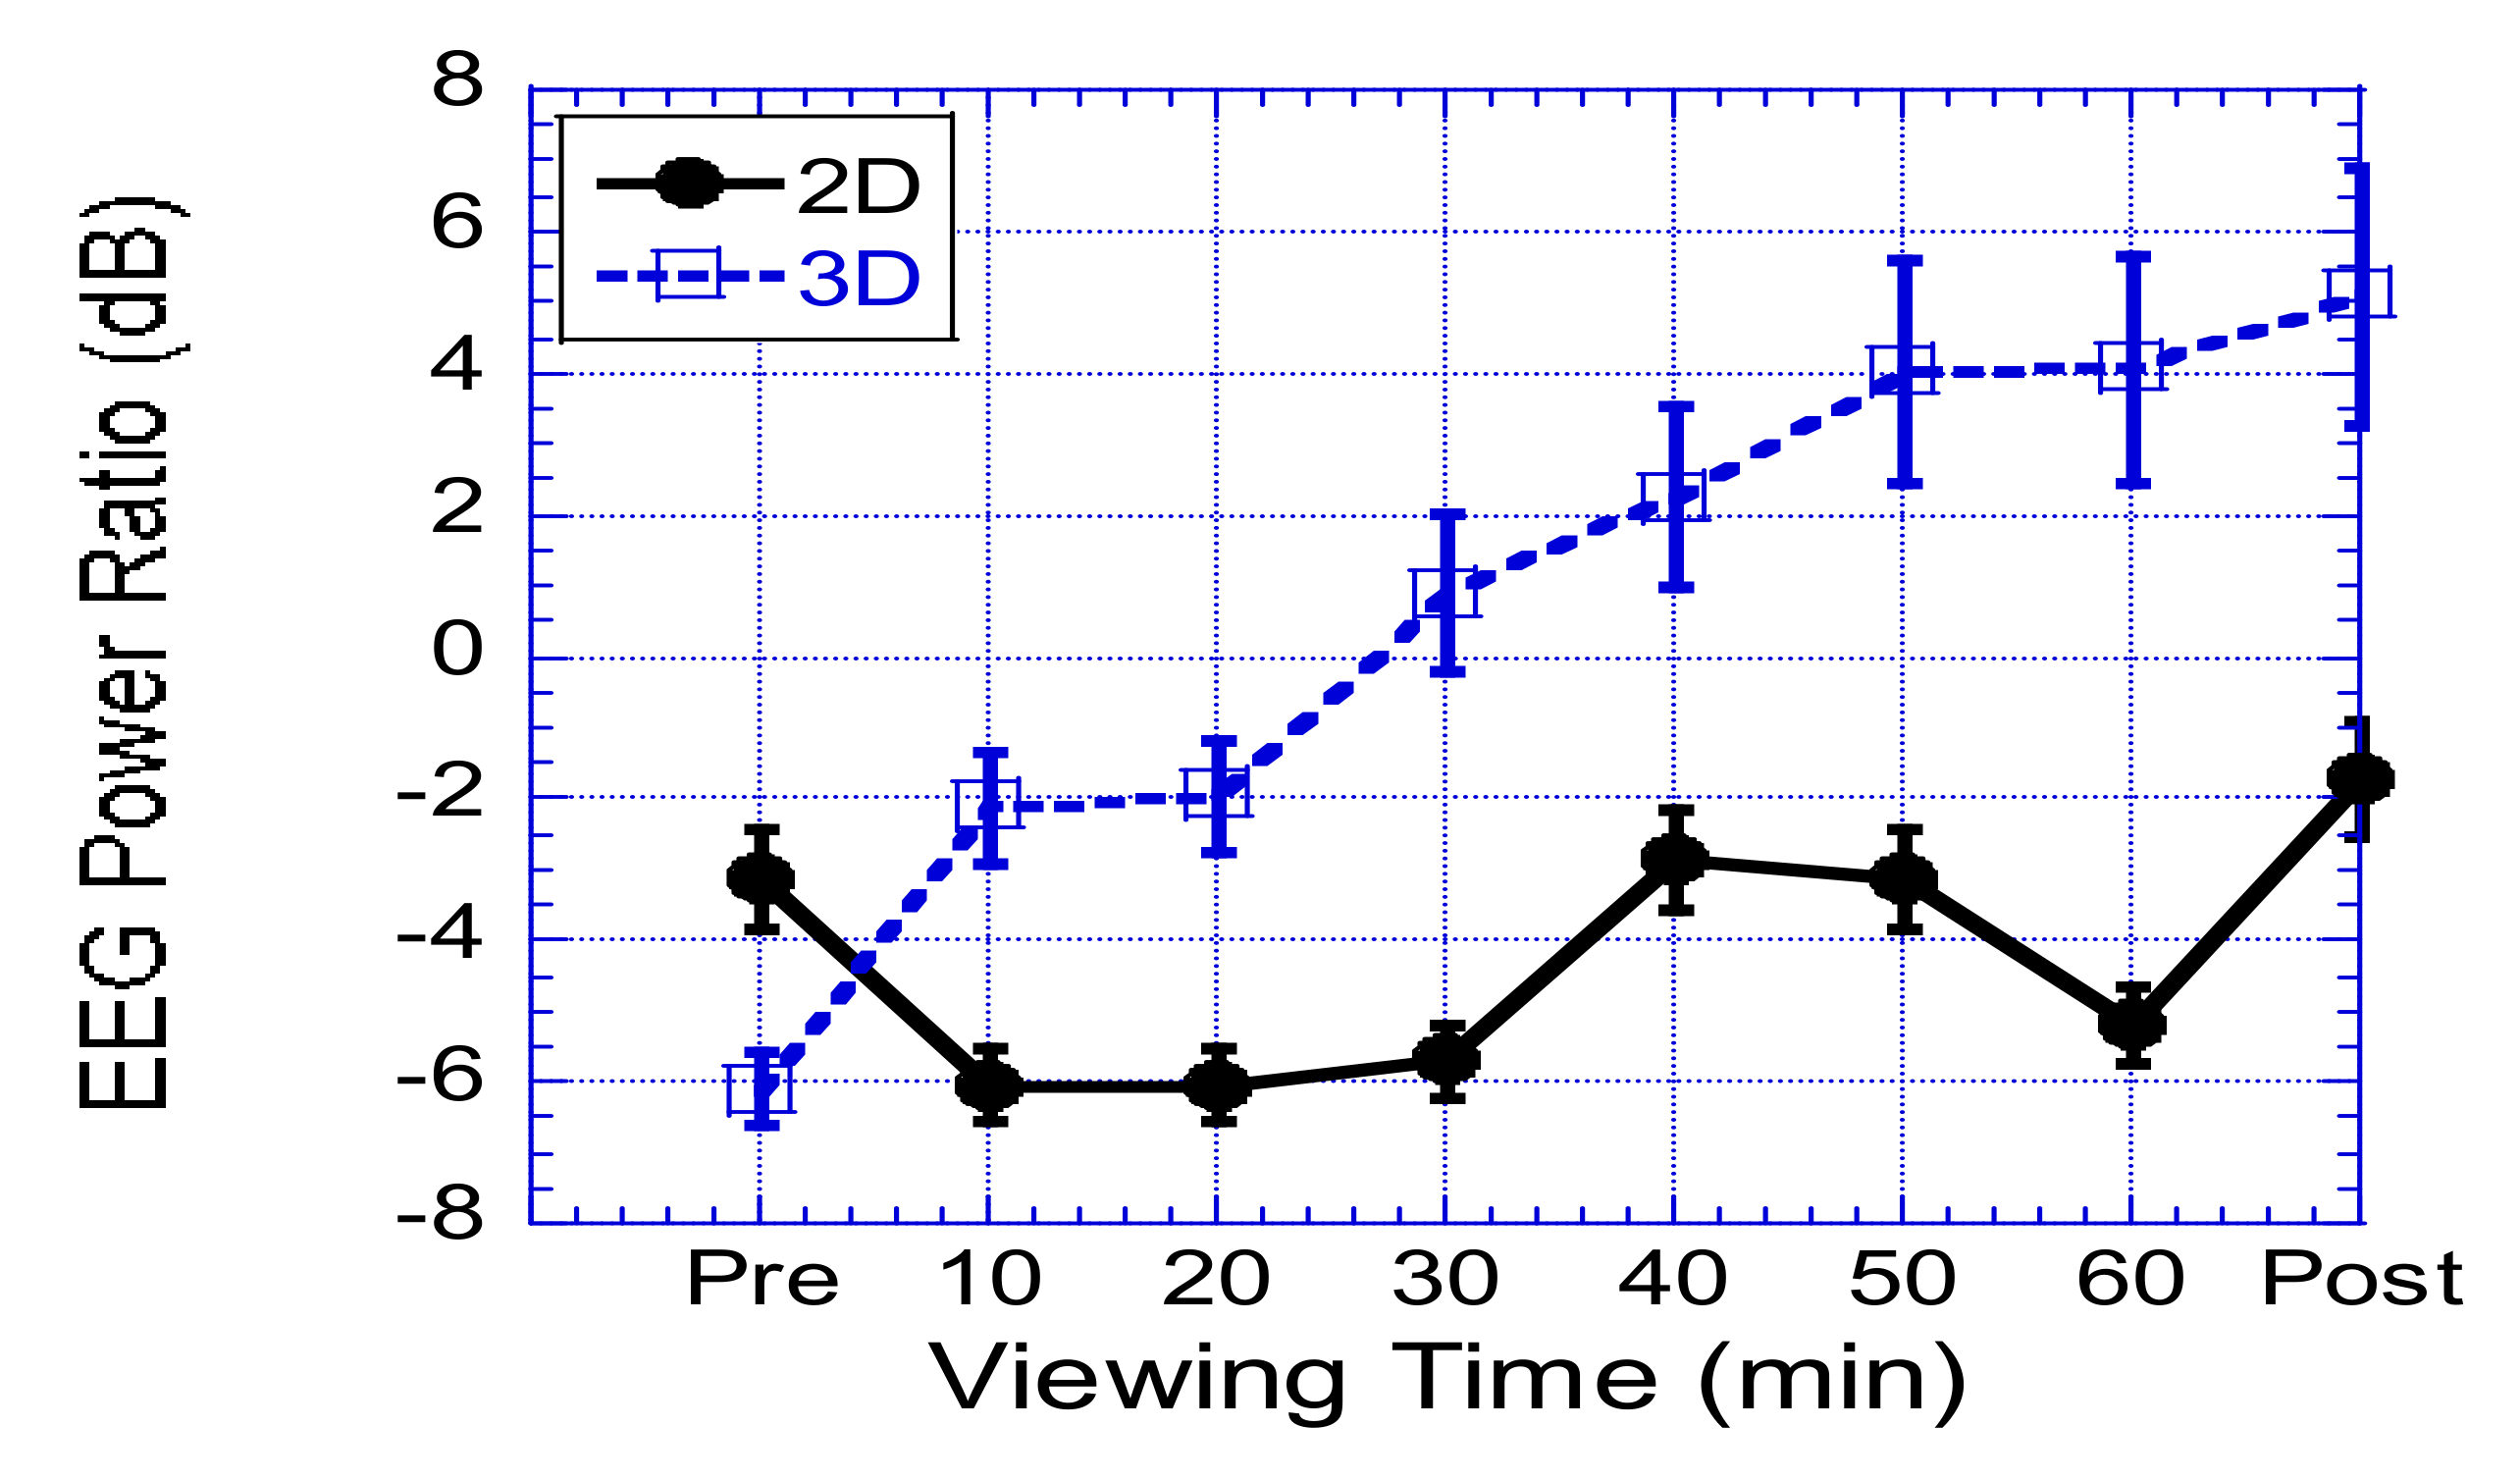
3.2.2. α/β Power Ratio

The results showed that the viewing time has a significant effect on α/β power ratio, F (7, 448) = 8.947, p < 0.001, partial eta squared = 0.123. In addition, the viewing time with respect to the type of display has a significant effect on the α/β power ratio, F (7, 448) = 5.667, p < 0.001.
Figure 5 shows the effect of the viewing time with respect to the display type on the α/β power ratio in decibel (dB). The results show that while watching the 3D display, the α/β ratio increases over viewing time while the α/β power ratio remains stable when the participants watched the 2D display over time. There is a significant difference between watching the 2D and 3D displays at time intervals of 4, 5, 6, 7, and 8 on the α/β power ratio at p < 0.05 based on the pairwise comparisons. When watching the 3D display, the differences between the time intervals 1 and 2; 2 and 3; 4 and 5; 5, 6, and 7; 6 and 7 are insignificant, p > 0.05. It can be concluded that when watching videos in 3D display, the participants were visually fatigued between ten and twenty minutes of watching the 3D display. Subsequently, the fatigue increases significantly for 10 min (at 30 min of watching). Thereafter, the fatigue increases gradually for the next 10 min (at 40 min of watching), and then, increases gradually for the next twenty minutes (at 60 min of watching).

4. Discussion

The subjective visual discomfort, relative β power of EEG, and α/β power ratio of EEG are used to evaluate the effect of watching videos on 2D and 3D displays associated with viewing distances (3H vs. 6H) over a viewing time of 60 min. In terms of the visual discomfort, it is revealed that watching the 3D display clearly caused more visual discomfort than watching the 2D display, regardless of the viewing distance. These results are consistent with those of previous studies [9,33,38,42,47,48,49].
The mental responses of the participants were analyzed while watching different films on 2D and 3D displays over sixty minutes from long and short viewing distances. The results show that the relative β power of the EEG decreases slightly with the increase in the viewing time. Moreover, watching the 3D display contributes more to the decrease in the relative β power of the EEG than watching the 2D display, which causes more visual fatigue than that evident in the case of the 2D-display. These results are consistent with the study conducted by Chen et al. [6], who found that for most participants watching the 3D TV, the energy in the β frequency bands significantly decreases. Moreover, when the viewing distance was switched from 3H to 6H, the relative β power increased in the 3D-display case, while it decreased in the 2D-display case. In addition, the same levels of visual fatigue were observed when watching videos at 2D or 3D from a long viewing distance (6H). These results show that watching the 3D display from a short viewing distance resulted in a high visual fatigue. Viewing the 2D display from a short viewing distance resulted in a low visual fatigue as the viewing distance gets longer, resolution will be higher (pixels on the display will be imaged on a smaller region on viewer's retina, making the image harder to resolve), field of view will be smaller (hence the sense of immersion gets weaker), and binocular disparity will get smaller (even though the disparity is the same on the screen, the angular disparity with respect to the viewer will be smaller—therefore, the viewer will experience smaller amounts of vergence–accommodation conflict). Moreover, the type of display was found to have the most contribution to the visual fatigue compared to other variables (12.7%), followed by distance*display (11.8%), time (5.9%), and distance (1.4%).
The results of the α/β power ratio show that watching the 3D display contributes to increase in the α/β power ratio over viewing time while it remains stable when the participants watched the 2D display over time. Moreover, the type of display has the most contribution to the visual fatigue compared to other variables (13.1%), followed by time (12.3%), and time*display (8.1%). It can be concluded that when watching videos in 3D display, visual fatigue increased between ten and twenty minutes. Subsequently, it increased significantly for 10 min (at 30 min of watching). Thereafter, the increase was gradual for the next 10 min (at 30 min of watching), and then further increases gradually for the next 20 min (at sixty min of watching). Moreover, watching the 3D display contributes to increase the α/β power ratio more than watching videos in 2D display. This result was in agreement with that obtained by Hsu and Wang [10], where the increase in α/β was associated with visual fatigue. The results of this study showed that there were certain discrepancies between the subjective measure of visual fatigue and the objective metric. Because the subjective measure is one of the conventional methods which might be affected by the personal variation, practical experience, and familiarity, has a significant effect on conscious experience with both positive and negative consequence.
Shibata et al. [33] observed more discomfort and fatigue with a given vergence–accommodation conflict at longer distances. This finding is in agreement with the study conducted by Shibata et al. [33], wherein the viewing distance had a significant effect on visual fatigue. In stereoscopic 3D displays, the accommodation distance is fixed at a particular distance from the eyes to the display screen so the viewer needs to accommodate to the screen. However, the vergence distance varies depending on the distance being simulated on the display so the viewer needs to converge at a point located in front of or behind the display plane. Moreover, Wee et al. [50] and Wee and Moon [51] identified that accommodation and convergence may conflict in the participant viewing programs on 3D displays because of an increase in the near visual tasks, which in turn, may lead to eventual deterioration of the capability to accommodate and converge, thereby increasing the visual fatigue. Watching contents on 3D displays from short viewing distance contributes to eventual deterioration of the capability to accommodate and converge, which in turn, may lead to the development of visual fatigue. This result helps support the findings of the study conducted by Wee et al. [50] and Wee and Moon [51].
There are other methods of 3D displays such as integral photography, which is a promising method to display 3D optical images by reproducing exactly the same light rays as emitted from real objects [52]. This method duplicates the conditions of viewing real objects. Therefore, the convergence and accommodation responses have been predicted to be consistent with the depth position of the 3D target. The accommodation response to integral 3D displays has been theoretically investigated by many researchers [53,54,55,56]. The reports indicate that satisfying the super multi-view (SMV) condition is the most important requirement for obtaining a proper accommodation response. The SMV condition means that two or more light rays from the point lights of the reconstructed 3D objects reach the pupil of an observer. Hiura et al. [56] showed that six of the ten observers did not have an accommodation-convergence conflict in viewing integral photography in the range. Moreover, the required resolution was found to be 0.7 or more and less than 1.4 cycles per degree for inducing accommodation. Hiura et al. [56], concluded that integral photography can provide a natural 3D image that looks like a real object.
Alhaag and Ramadan [57] investigated the effects of display type (2D versus 3D), viewing distance (3H versus 6H) and viewing time on visual fatigue based on percentage of maximum electromyography (EMG) contraction (%MVC) of orbicularis oculi (OO) muscle activity. They reported that viewing time and distance had significant effects on the %MVC and OO muscle activity with the details depending on the display type. The OO muscle activity of the participants watching the 3D display from a long distance (6H) did not change over the viewing time. Alhaag and Ramadan [52] suggested that watching 3D display from a short viewing distance contributed to the eventual deterioration of the capability to accommodate and converge. This, in turn, likely caused development of greater visual fatigue watching the 3D display as compared to watching the 2D display from an equivalent short viewing distance. The reason offered for increasing visual fatigue while viewing 3D display from short viewing distance is that doing so increases the field of view.
Ukai and Howarththe [58], Suzuki et al. [59], and Fujikado [60] showed that the reason of conflict between the accommodation and vergence in 3D displays, which results in visual fatigue, is accommodation that should respond to the screen position but disparity in the two images for both the vergence stimulus of the eyes varies over time. These problems occur only for short viewing distances in the range of 31.1–53.6 cm in a volumetric display [49] because of the depth of field of the human eye [56]. The results of this study are in good agreement with those obtained by Alhaag and Ramadan [57], Ukai and Howarth [58], Suzuki et al. [59], and Fujikado [60]. In addition, it was explained that a wide field of view could cause more cyber sickness [61,62,63,64]. Visual fatigue increases while viewing 3D display from short viewing distance because the field of view increases, causing high strain. The result of this study is in good agreement with those obtained by Alhaag and Ramadan [56], Seay et al. [62] and Lin et al. [63]. Lee et al. [64] studied the effects of display type (2D versus 3D) and viewing distances (60 cm versus 90 cm) on the amount of eyestrain using a near-infrared pupil detection device. They found that watching the 3D display from a short distance (60 cm) caused high eyestrain. This result agrees with the one concluded in this study.

5. Conclusions

Watching 3D TV has different effects on the brain as compared against watching 2D TV. The brain is relaxed while watching 2D TV from short viewing distances, while watching 3D display from short viewing distances requires participants to utilize more cognitive loads for processing three-dimensional information compared to 2D displays. Hence, watching 3D displays from short viewing distances caused visual fatigue, which may decrease the cognitive capacity of the participants for processing visual information. In addition, the brain is relaxed while watching 3DTV from longer viewing distances. While watching 2D displays from long distances, the cognitive load increases because of low level of attentional focusing ability and regulates occipital lobe required by the brain to process the information. The results show that in case of 3D mode, the decrease in the relative β power of EEG and increase in the α/β power ratio were significantly higher from the start till the end of the test. It was found that the “type of display” has most significant factor for visual fatigue compared to other variables (12.7%), followed by interaction of distance and display (11.8%), time (5.9%), and distance (1.40%). In addition, when the viewing distance was switched from 3H to 6H, the relative β power was increased in case of 3D-display, while it was decreased in case of 2D display. Moreover, the level of visual fatigue was the same when watching videos in 2D or 3D mode from a long viewing distance (6H).

Acknowledgments

The authors are grateful to the Raytheon Chair for Systems Engineering for funding. Also, the authors would like to acknowledge reviewers for their constructive comments and suggestions. Based on those comments, the manuscript is further enhanced and improved.

Author Contributions

Ramadan and Alhaag conceived the idea, and designed the experiments; Alhaag performed the experiments; Ramadan and Alhaag analyzed the data; all authors contributed materials/analysis tools; Ramadan and Alhaag organized the contents for the manuscript preparation and wrote the paper. All authors reviewed and approved the final version.

Conflicts of Interest

The authors declare no conflict of interest.

References

  1. Kim, Y.J.; Lee, E.C. EEG based comparative measurement of visual fatigue caused by 2D and 3D. Commun. Comput. Inf. Sci. 2011, 174, 289–292. [Google Scholar]
  2. Mun, S.C.; Park, M.C.; Park, S.I.; Whang, M.C. SSVEP and ERP measurement of cognitive fatigue caused by stereoscopic 3D. Neurosci. Lett. 2012, 525, 89–94. [Google Scholar] [CrossRef] [PubMed]
  3. Jung, Y.J.; Kim, D.; Sohn, H.; Lee, S.I.; Park, H.W.; Ro, Y.M. Subjective and objective measurements of visual fatigue induced by excessive disparities in stereoscopic images. Proc. SPIE 2013, 8648, 86480M. [Google Scholar]
  4. Cho, H.; Kang, M.-K.; Yoon, K.-J.; Jun, S.C. Feasibility Study for Visual Discomfort Assessment on Stereo Images Using EEG. In Proceedings of the International Conference on 3D Imaging, Liège, Belgium, 3–5 December 2012; pp. 1–6. [Google Scholar]
  5. Park, S.J.; Subramaniyam, M.; Moon, M.K.; Kim, D.G. Physiological responses to watching 3D on television with active and passive glasses. In International Conference on Human-Computer Interaction; Springer: Berlin/Heidelberg, Germany, 2013; pp. 498–502. [Google Scholar]
  6. Chen, C.; Li, K.; Wu, Q.; Wang, H.; Qian, Z.; Sudlow, G. EEG-based detection and evaluation of fatigue caused by watching 3DTV. Displays 2013, 34, 81–88. [Google Scholar] [CrossRef]
  7. Chen, C.; Wang, J.; Li, K.; Wu, Q.; Wang, H.; Qian, Z.; Gu, N. Assessment visual fatigue of watching 3DTV using EEG power spectral parameters. Displays 2014, 35, 266–272. [Google Scholar] [CrossRef]
  8. Chen, C.; Wang, J.; Li, K.; Liu, Y.; Chen, X. Visual fatigue caused by watching 3DTV: An fMRI study. Biomed. Eng. Online 2015, 14, S12. [Google Scholar] [CrossRef] [PubMed]
  9. Li, H.C.; Seo, J.H.; Kham, K.T.; Lee, S.H. Measurement of 3D Visual Fatigue Using Event-related Potential: 3D Oddball Paradigm. In Proceedings of the 3DTV Conference: The True Vision—Capture, Transmission and Display of 3D Video, Istanbul, Turkey, 28–30 May 2008; pp. 213–216. [Google Scholar]
  10. Hsu, B.W.; Wang, M.J.J. Evaluating the effectiveness of using electroencephalogram power indices to measure visual fatigue. Percept. Mot. Skills 2013, 116, 235–252. [Google Scholar] [CrossRef] [PubMed]
  11. Wang, Y.; Liu, Y.; Zou, B.; Huang, Y. Study on issues of visual fatigue of display devices. In Signal Recovery and Synthesis; Optical Society of America: Washington, DC, USA, 2014. [Google Scholar]
  12. Wang, Y.; Liu, T.; Li, S.; Wang, J. Using electroencephalogram spectral components to assess visual fatigue caused by sustained prism-induced diplopia. In Proceedings of the 2016 9th International Congress on Image and Signal Processing, BioMedical Engineering and Informatics (CISP-BMEI), Datong, China, 15–17 October 2016; pp. 1551–1556. [Google Scholar]
  13. Bang, J.W.; Heo, H.; Choi, J.S.; Park, K.R. Assessment of eye fatigue caused by 3D displays based on multimodal measurements. Sensors 2014, 14, 16467–16485. [Google Scholar] [CrossRef] [PubMed]
  14. Guo, M.; Liu, Y.; Zou, B.; Wang, Y. Study of electroencephalography-based objective stereoscopic visual fatigue evaluation. In Proceedings of the 2015 International Symposium on Bioelectronics and Bioinformatics (ISBB), Beijing, China, 14–17 October 2015; pp. 160–163. [Google Scholar]
  15. Hou, C.; Yue, G.; Shen, L. Assessing the visual discomfort of compressed stereoscopic images using ERP. In International Conference on Human Centered Computing; Springer: Cham, Switzerland, 2016; pp. 127–137. [Google Scholar]
  16. Frey, J.; Appriou, A.; Lotte, F.; Hachet, M. Classifying EEG signals during stereoscopic visualization to estimate visual comfort. Comput. Intell. Neurosci. 2016, 2016, 2758103. [Google Scholar] [CrossRef] [PubMed]
  17. Cheng, S.; Lee, H.; Shu, C.; Hsu, H. Electroencephalographic study of mental fatigue in visual display terminal tasks. J. Med. Biol. Eng. 2007, 27, 124. [Google Scholar]
  18. Xie, X.; Hu, J.; Liu, X.; Li, P.; Wang, S. The EEG changes during night-time driver fatigue. In Proceedings of the 2009 IEEE Intelligent Vehicles Symposium, Xi’an, China, 3–5 June 2009; pp. 935–939. [Google Scholar]
  19. Lal, S.K.; Craig, A.; Boord, P.; Kirkup, L.; Nguyen, H. Development of an algorithm for an EEG-based driver fatigue countermeasure. J. Saf. Res. 2003, 34, 321–328. [Google Scholar] [CrossRef]
  20. Liu, J.; Zhang, C.; Zheng, C. EEG-based estimation of mental fatigue by using KPCA–HMM and complexity parameters. Biomed. Signal Process. Control 2010, 5, 124–130. [Google Scholar] [CrossRef]
  21. Kar, S.; Bhagat, M.; Routray, A. EEG signal analysis for the assessment and quantification of driver’s fatigue. Transp. Res. Part F 2010, 13, 297–306. [Google Scholar] [CrossRef]
  22. De Waard, D. The Measurement of Drivers’ Mental Workload; Groningen University, Traffic Research Center: Groningen, The Netherlands, 1996. [Google Scholar]
  23. Fisch, B.J.; Spehlmann, R. (Eds.) Fisch and Spehlmann’s EEG Primer: Basic Principles of Digital and Analog EEG; Elsevier Health Sciences: Amsterdam, The Netherlands, 1999. [Google Scholar]
  24. Cheng, S.-Y.; Hsu, H.-T. Mental Fatigue Measurement Using EEG. In Risk Management Trends; Intech: Rijeka, Croatia, 2011. [Google Scholar]
  25. Tran, Y.; Thuraisingham, R.A.; Wijesuriya, N.; Nguyen, H.T.; Craig, A. Detecting neural changes during stress and fatigue effectively: A comparison of spectral analysis and sample entropy. In Proceedings of the 2007 3rd International IEEE/EMBS Conference on Neural Engineering, Kohala Coast, HI, USA, 2–5 May 2007; pp. 350–353. [Google Scholar]
  26. Belyavin, A.; Wright, N.A. Changes in electrical activity of the brain with vigilance. Electroencephalogr. Clin. Neurophysiol. 1987, 66, 137–144. [Google Scholar] [CrossRef]
  27. Subasi, A. Automatic recognition of alertness level from EEG by using neural network and wavelet coefficients. Expert Syst. Appl. 2005, 28, 701–711. [Google Scholar] [CrossRef]
  28. Jap, B.T.; Lal, S.; Fischer, P.; Bekiaris, E. Using EEG spectral components to assess algorithms for detecting fatigue. Expert Syst. Appl. 2009, 36, 2352–2359. [Google Scholar] [CrossRef]
  29. Eoh, H.J.; Chung, M.K.; Kim, S.H. Electroencephalographic study of drowsiness in simulated driving with sleep deprivation. Int. J. Ind. Ergon. 2005, 35, 307–320. [Google Scholar] [CrossRef]
  30. Patterson, R. Human factors of 3D displays. J. Soc. Inf. Disp. 2007, 15, 861–871. [Google Scholar] [CrossRef]
  31. Lambooij, M.; Fortuin, M.; Heynderickx, I.; IJsselsteijn, W. Visual discomfort and visual fatigue of stereoscopic displays: A review. J. Imaging Sci. Technol. 2009, 53, 1–14. [Google Scholar] [CrossRef]
  32. Shibata, T.; Kim, J.; Hoffman, D.M.; Banks, M.S. The zone of comfort: Predicting visual discomfort with stereo displays. J. Vis. 2011, 11, 11. [Google Scholar] [CrossRef] [PubMed]
  33. Shibata, T.; Kim, J.; Hoffman, D.M.; Banks, M.S. Visual discomfort with stereo displays: Effects of viewing distance and direction of vergence-accommodation conflict. Proc. SPIE Int. Soc. Opt. Eng. 2011, 7863, 78630P1–78630P9. [Google Scholar] [PubMed]
  34. Park, M.C.; Mun, S. Overview of measurement methods for factors affecting the human visual system in 3D displays. J. Disp. Technol. 2015, 11, 877–888. [Google Scholar] [CrossRef]
  35. Matthews, M.L.; Lovasik, J.V.; Mertins, K. Visual performance and subjective discomfort in prolonged viewing of chromatic displays. Hum. Factors 1989, 31, 259–271. [Google Scholar] [CrossRef] [PubMed]
  36. American Optometric Association. Guide to the Clinical Aspects of Computer Vision Syndrome; American Optometric Association: St. Louis, MO, USA, 1995. [Google Scholar]
  37. Kim, C.J.; Park, S.; Won, M.J.; Whang, M.; Lee, E.C. Autonomic Nervous System Responses Can Reveal Visual Fatigue Induced by 3D Displays. Sensors 2013, 13, 13054–13062. [Google Scholar] [CrossRef] [PubMed]
  38. Park, S.; Won, M.J.; Mun, S.; Lee, E.C.; Whang, M. Does visual fatigue from 3D displays affect autonomic regulation and heart rhythm? Int. J. Psychophysiol. 2014, 92, 42–48. [Google Scholar] [CrossRef] [PubMed]
  39. Assembly, I.R. Methodology for the Subjective Assessment of the Quality of Television Pictures; International Telecommunication Union: Geneva, Switzerland, 2003. [Google Scholar]
  40. Park, S.J.; Oh, S.B.; Subramaniyam, M.; Lim, H.K. Human impact assessment of watching 3D television by electrocardiogram and subjective evaluation. In Proceedings of the XX IMEKO World Congress—Metrology for Green Growth, Busan, Korea, 9–14 September 2012. [Google Scholar]
  41. Chen, C.Y.; Ke, M.D.; Wu, P.J.; Kuo, C.D.; Pong, B.J.; Lai, Y.Y. The influence of polarized 3D display on autonomic nervous activities. Displays 2014, 35, 196–201. [Google Scholar] [CrossRef]
  42. Li, H.C.O. Human factor research on the measurement of subjective three dimensional fatigue. J. Broadcast. Eng. 2010, 15, 607–616. [Google Scholar] [CrossRef]
  43. Kennedy, R.S.; Lane, N.E.; Berbaum, K.S.; Lilienthal, M.G. Simulator sickness questionnaire: An enhanced method for quantifying simulator sickness. Int. J. Aviat. Psychol. 1993, 3, 203–220. [Google Scholar] [CrossRef]
  44. Andreassi, J.L. Psychophysiology: Human Behavior & Physiological Response; Taylor & Francis: Mahwah, NJ, USA, 2009. [Google Scholar]
  45. Iwasaki, T.; Kurimoto, S. Objective evaluation of eye strain using measurements of accommodative oscillation. Ergonomics 1987, 30, 581–587. [Google Scholar] [CrossRef] [PubMed]
  46. Brown, J.D.; Hilgers, T.; Marsella, J. Essay prompts and topics minimizing the effect of mean differences. Writ. Commun. 1991, 8, 533–556. [Google Scholar] [CrossRef]
  47. Yano, S.; Ide, S.; Mitsuhashi, T.; Thwaites, H. A study of visual fatigue and visual comfort for 3D HDTV/HDTV images. Displays 2002, 23, 191–201. [Google Scholar] [CrossRef]
  48. Park, S.; Won, M.J.; Lee, E.C.; Mun, S.; Park, M.C.; Whang, M. Evaluation of 3D cognitive fatigue using heart–brain synchronization. Int. J. Psychophysiol. 2015, 97, 120–130. [Google Scholar] [CrossRef] [PubMed]
  49. Hoffman, D.M.; Girshick, A.R.; Akeley, K.; Banks, M.S. Vergence–accommodation conflicts hinder visual performance and cause visual fatigue. J. Vis. 2008, 8, 33. [Google Scholar] [CrossRef] [PubMed]
  50. Wook Wee, S.; Moon, N.J.; Lee, W.K.; Jeon, S. Ophthalmological factors influencing visual asthenopia as a result of viewing 3D displays. Br. J. Ophthalmol. 2012, 96, 1391–1394. [Google Scholar]
  51. Wook Wee, S.; Moon, N.J. Clinical evaluation of accommodation and ocular surface stability relavant to visual asthenopia with 3D displays. BMC Ophthalmol. 2014, 14, 1. [Google Scholar]
  52. Lippmann, M.G. Epreuves reversibles donnant la sensation du relief. J. Phys. Theor. Appl. 1908, 7, 821–825. [Google Scholar] [CrossRef]
  53. Jung, J.H.; Hong, K.; Lee, B. Effect of viewing region satisfying super multi-view condition in integral imaging. SID Symp. Dig. Tech. Pap. 2012, 43, 883–886. [Google Scholar] [CrossRef]
  54. Maimone, A.; Wetzstein, G.; Hirsch, M.; Lanman, D.; Raskar, R.; Fuchs, H. Focus 3D: Compressive accommodation display. ACM Trans. Graph. 2013, 32, 1–13. [Google Scholar] [CrossRef]
  55. Deng, H.; Wang, Q.-H.; Luo, C.-G.; Liu, C.-L.; Li, C. Accommodation and convergence in integral imaging 3D display. J. Soc. Inf. Disp. 2014, 22, 158–162. [Google Scholar] [CrossRef]
  56. Hiura, H.; Komine, K.; Arai, J.; Mishina, T. Measurement of static convergence and accommodation responses to images of integral photography and binocular stereoscopy. Opt. Express 2017, 25, 3454–3468. [Google Scholar] [CrossRef] [PubMed]
  57. Alhaag, M.H.; Ramadan, M.Z. Using electromyography responses to investigate the effects of the display type, viewing distance, and viewing time on visual fatigue. Displays 2017, 49, 51–58. [Google Scholar] [CrossRef]
  58. Ukai, K.; Howarth, P.A. Visual fatigue caused by viewing stereoscopic motion images: Background, theories, and observations. Displays 2008, 29, 106–116. [Google Scholar] [CrossRef]
  59. Suzuki, Y.; Onda, Y.; Katada, S.; Ino, S.; Ifukube, T. Effects of an eyeglass-free 3D display on the human visual system. Jpn. J. Ophthalmol. 2004, 48, 1–6. [Google Scholar] [CrossRef] [PubMed]
  60. Fujikado, T. Asthenopia from the viewpoint of visual information processing-effect of watching 3D images. J. Eye 1997, 14, 1295–1300. [Google Scholar]
  61. Patterson, R. Review Paper: Human factors of stereo displays: An update. J. Soc. Inf. Disp. 2009, 17, 987–996. [Google Scholar] [CrossRef]
  62. Seay, A.F.; Krum, D.M.; Hodges, L.; Ribarsky, W. Simulator sickness and presence in a high field-of-view virtual environment. In CHI’02 Extended Abstracts on Human Factors in Computing Systems, Proceedings of the CHI’02 Human Factors in Computing Systems, Minneapolis, MN, USA, 20–25 April 2002; ACM: New York, NY, USA, 2002; pp. 784–785. [Google Scholar]
  63. Lin, J.W.; Duh, H.B.L.; Parker, D.E.; Abi-Rached, H.; Furness, T.A. Effects of field of view on presence, enjoyment, memory, and simulator sickness in a virtual environment. In Proceedings of the IEEE Virtual Reality, Orlando, FL, USA, 24–28 March 2002; pp. 164–171. [Google Scholar]
  64. Lee, E.C.; Heo, H.; Park, K.R. The comparative measurements of eyestrain caused by 2D and 3D displays. IEEE Trans. Consum. Electron. 2010, 56, 1677–1683. [Google Scholar] [CrossRef]
Figure 1. Experimental setup.
Applsci 07 01153 g001
Figure 2. Electroencephalogram (EEG) electrodes positions.
Applsci 07 01153 g002
Figure 3. Effect of viewing time on relative β power (%).
Applsci 07 01153 g003
Figure 4. Effect of viewing distance by display type interaction on relative β power (%).
Applsci 07 01153 g004
Figure 5. Effect of viewing time by display type on α/β power ratio.
Applsci 07 01153 g005
Table 1. Specifications of 3D LG Smart Television.
VariablesSpecificationsVariablesSpecifications
Size50 inDiagonal126 cm
Resolution1920 × 1080 pixelsWidth112.7 cm
Height65 cmRefresh rate100 Hz
Aspect ratio16:9Picture modeVivid dynamic
Backlight100 ntContrast100 nt
Brightness50 ntColor70 nt
Sharpness50 ntAudio output20 W
in = inches; cm = centimeters; nt = nit; W = Watt.
Table 2. Score means (standard deviation) for total subjective visual discomfort score.
Mean (SD)Statistics
Display2D3DFapaFbpbȠ2Ƞ2
Pre1.18 (0.958)1.23 (1.03)0.0510.8225.9110.0040.1360.001
Post8.30 (7.94)16.20 (12.02)11.7520.0010.134
Distance3H6HFapaFbpbȠ2Ƞ2
Pre1.35 (1.00)1.05 (0.994)1.8260.1810.9230.4020.0240.023
Post12.8 (11.3)11.70 (10.5)0.2280.6350.03
a Comparison between watching films at 2D or 3D TV for both pre and post (univariate test). b Comparison between watching films at pre and post (overall test).

