Downdraft Assessment of Glass Curtain Wall Buildings with a Radiant Floor Heating System


Abstract
:1. Introduction
2. Background on Downdraft Assessment
2.1. Definition of Downdraft
2.2. Downdraft Assessment Criteria
2.3. Preliminary Study of Downdraft Assessment
3. Assessment Parameters
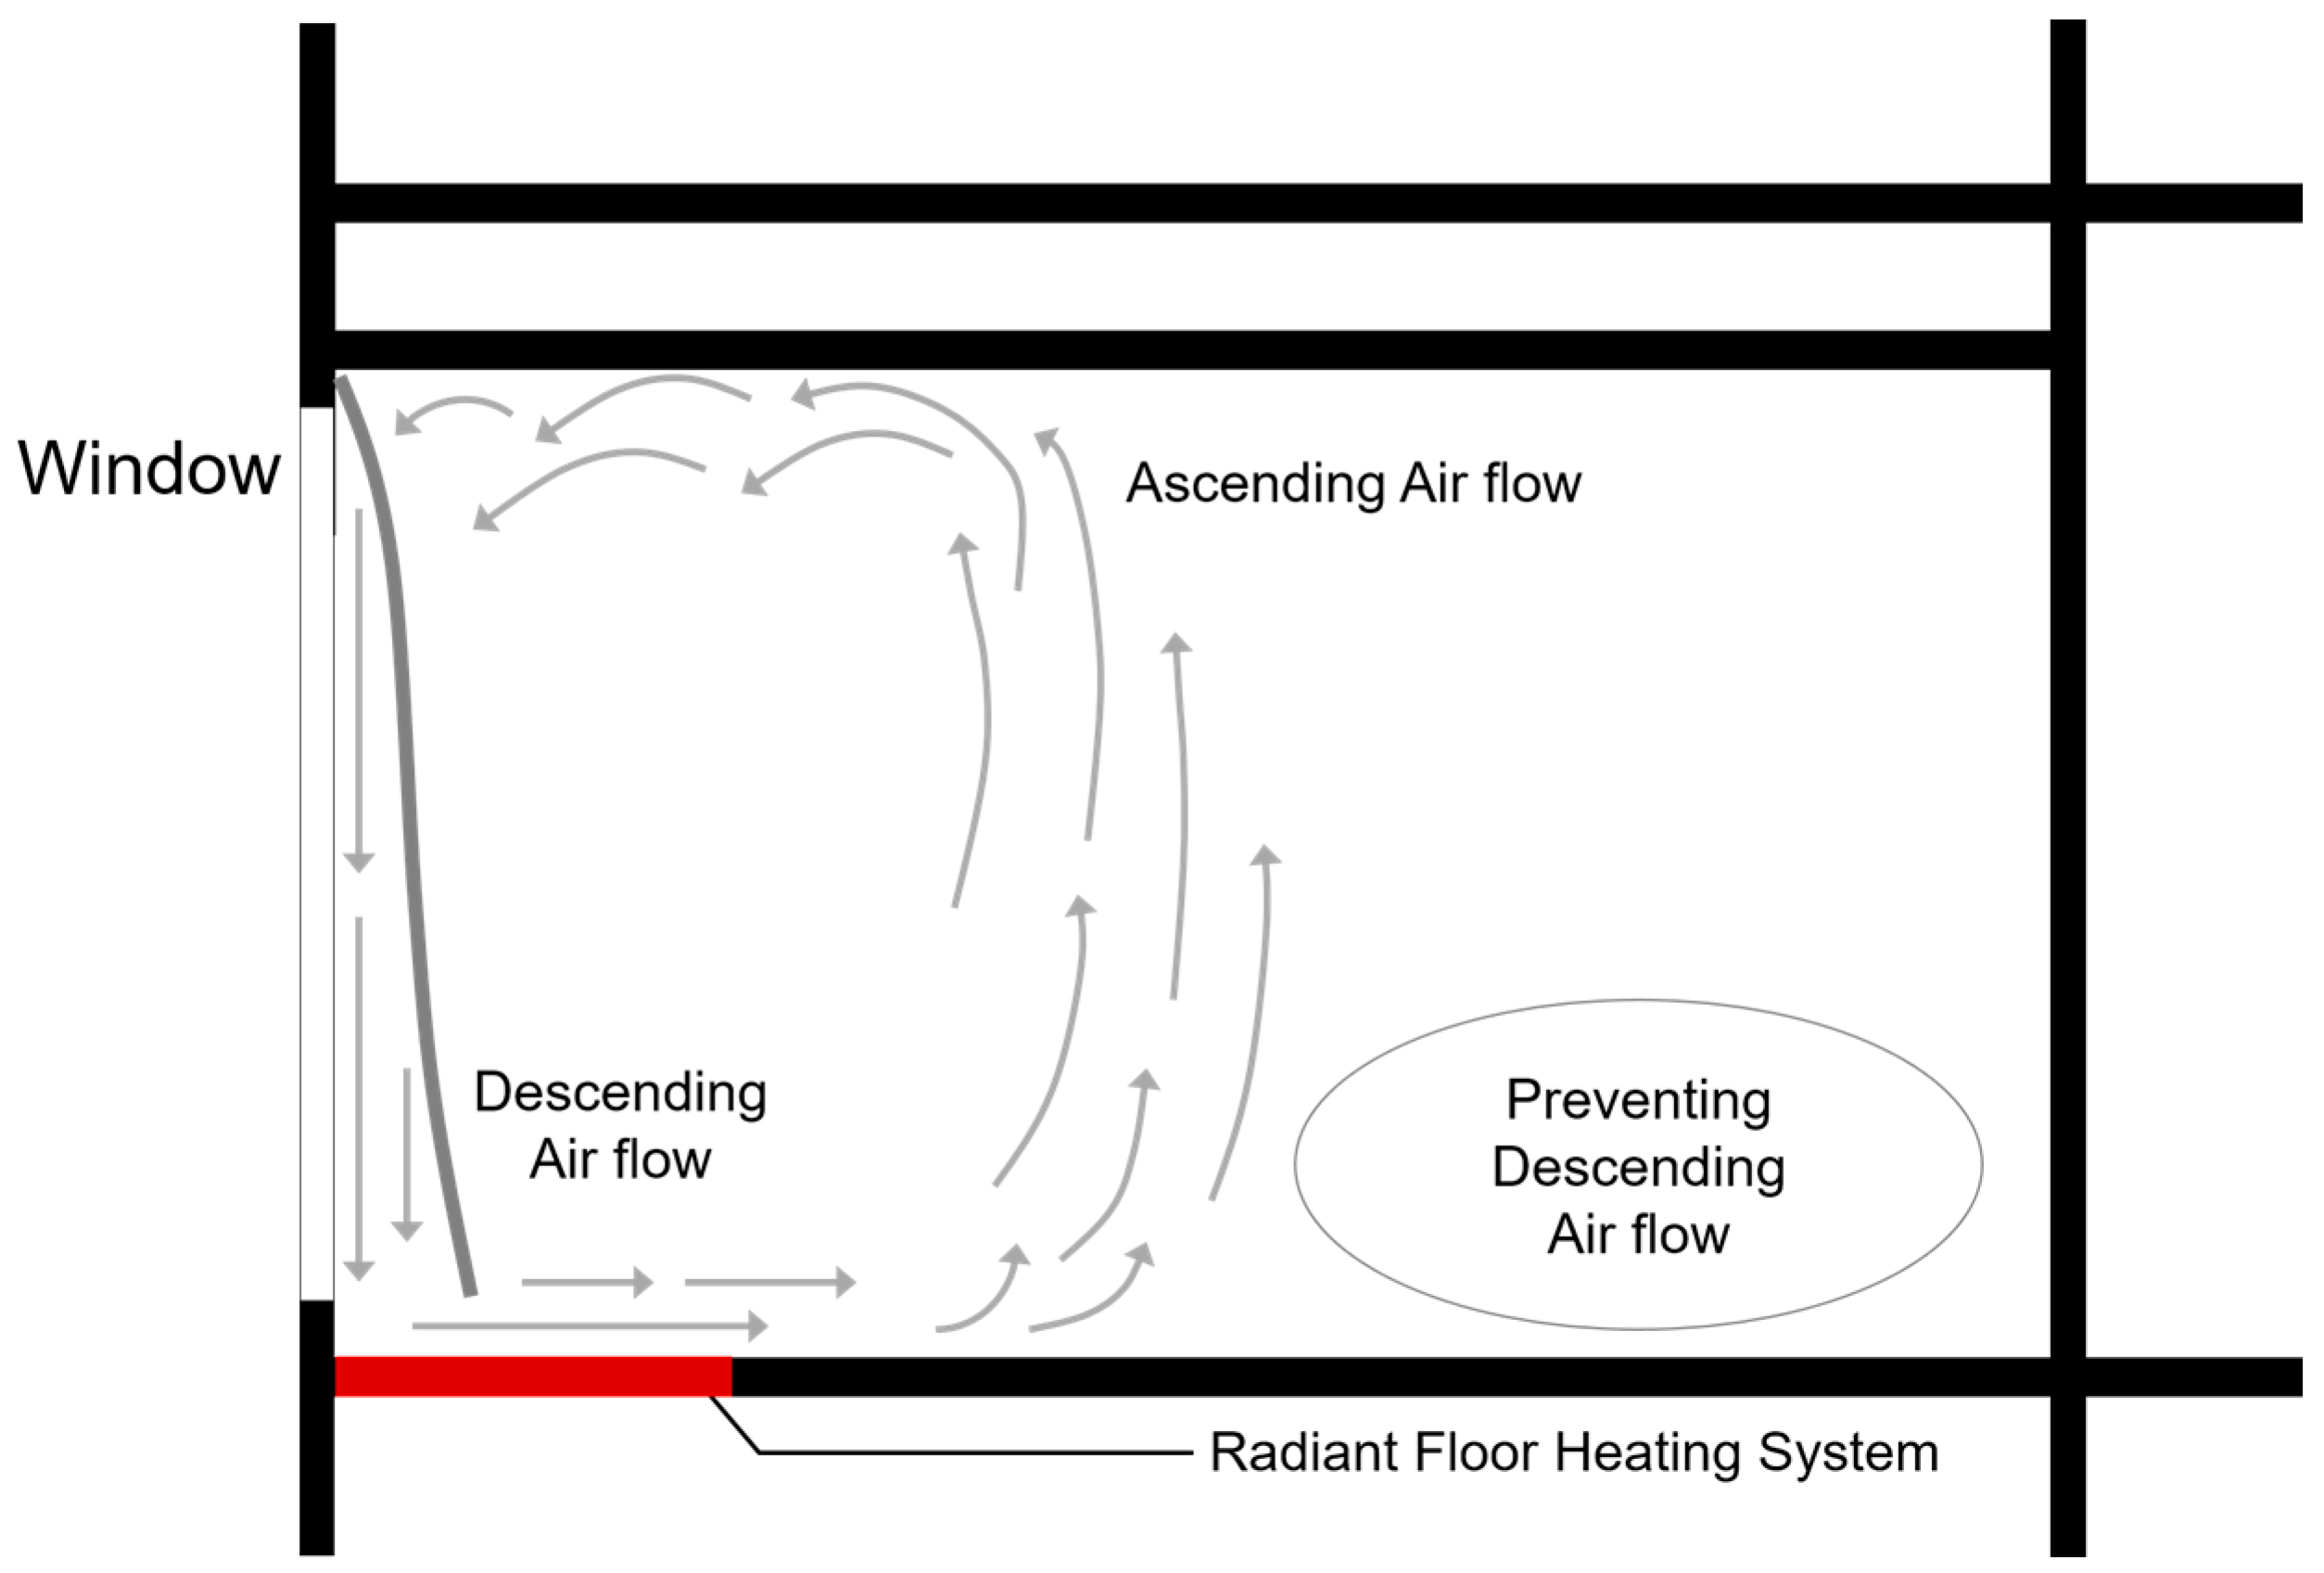
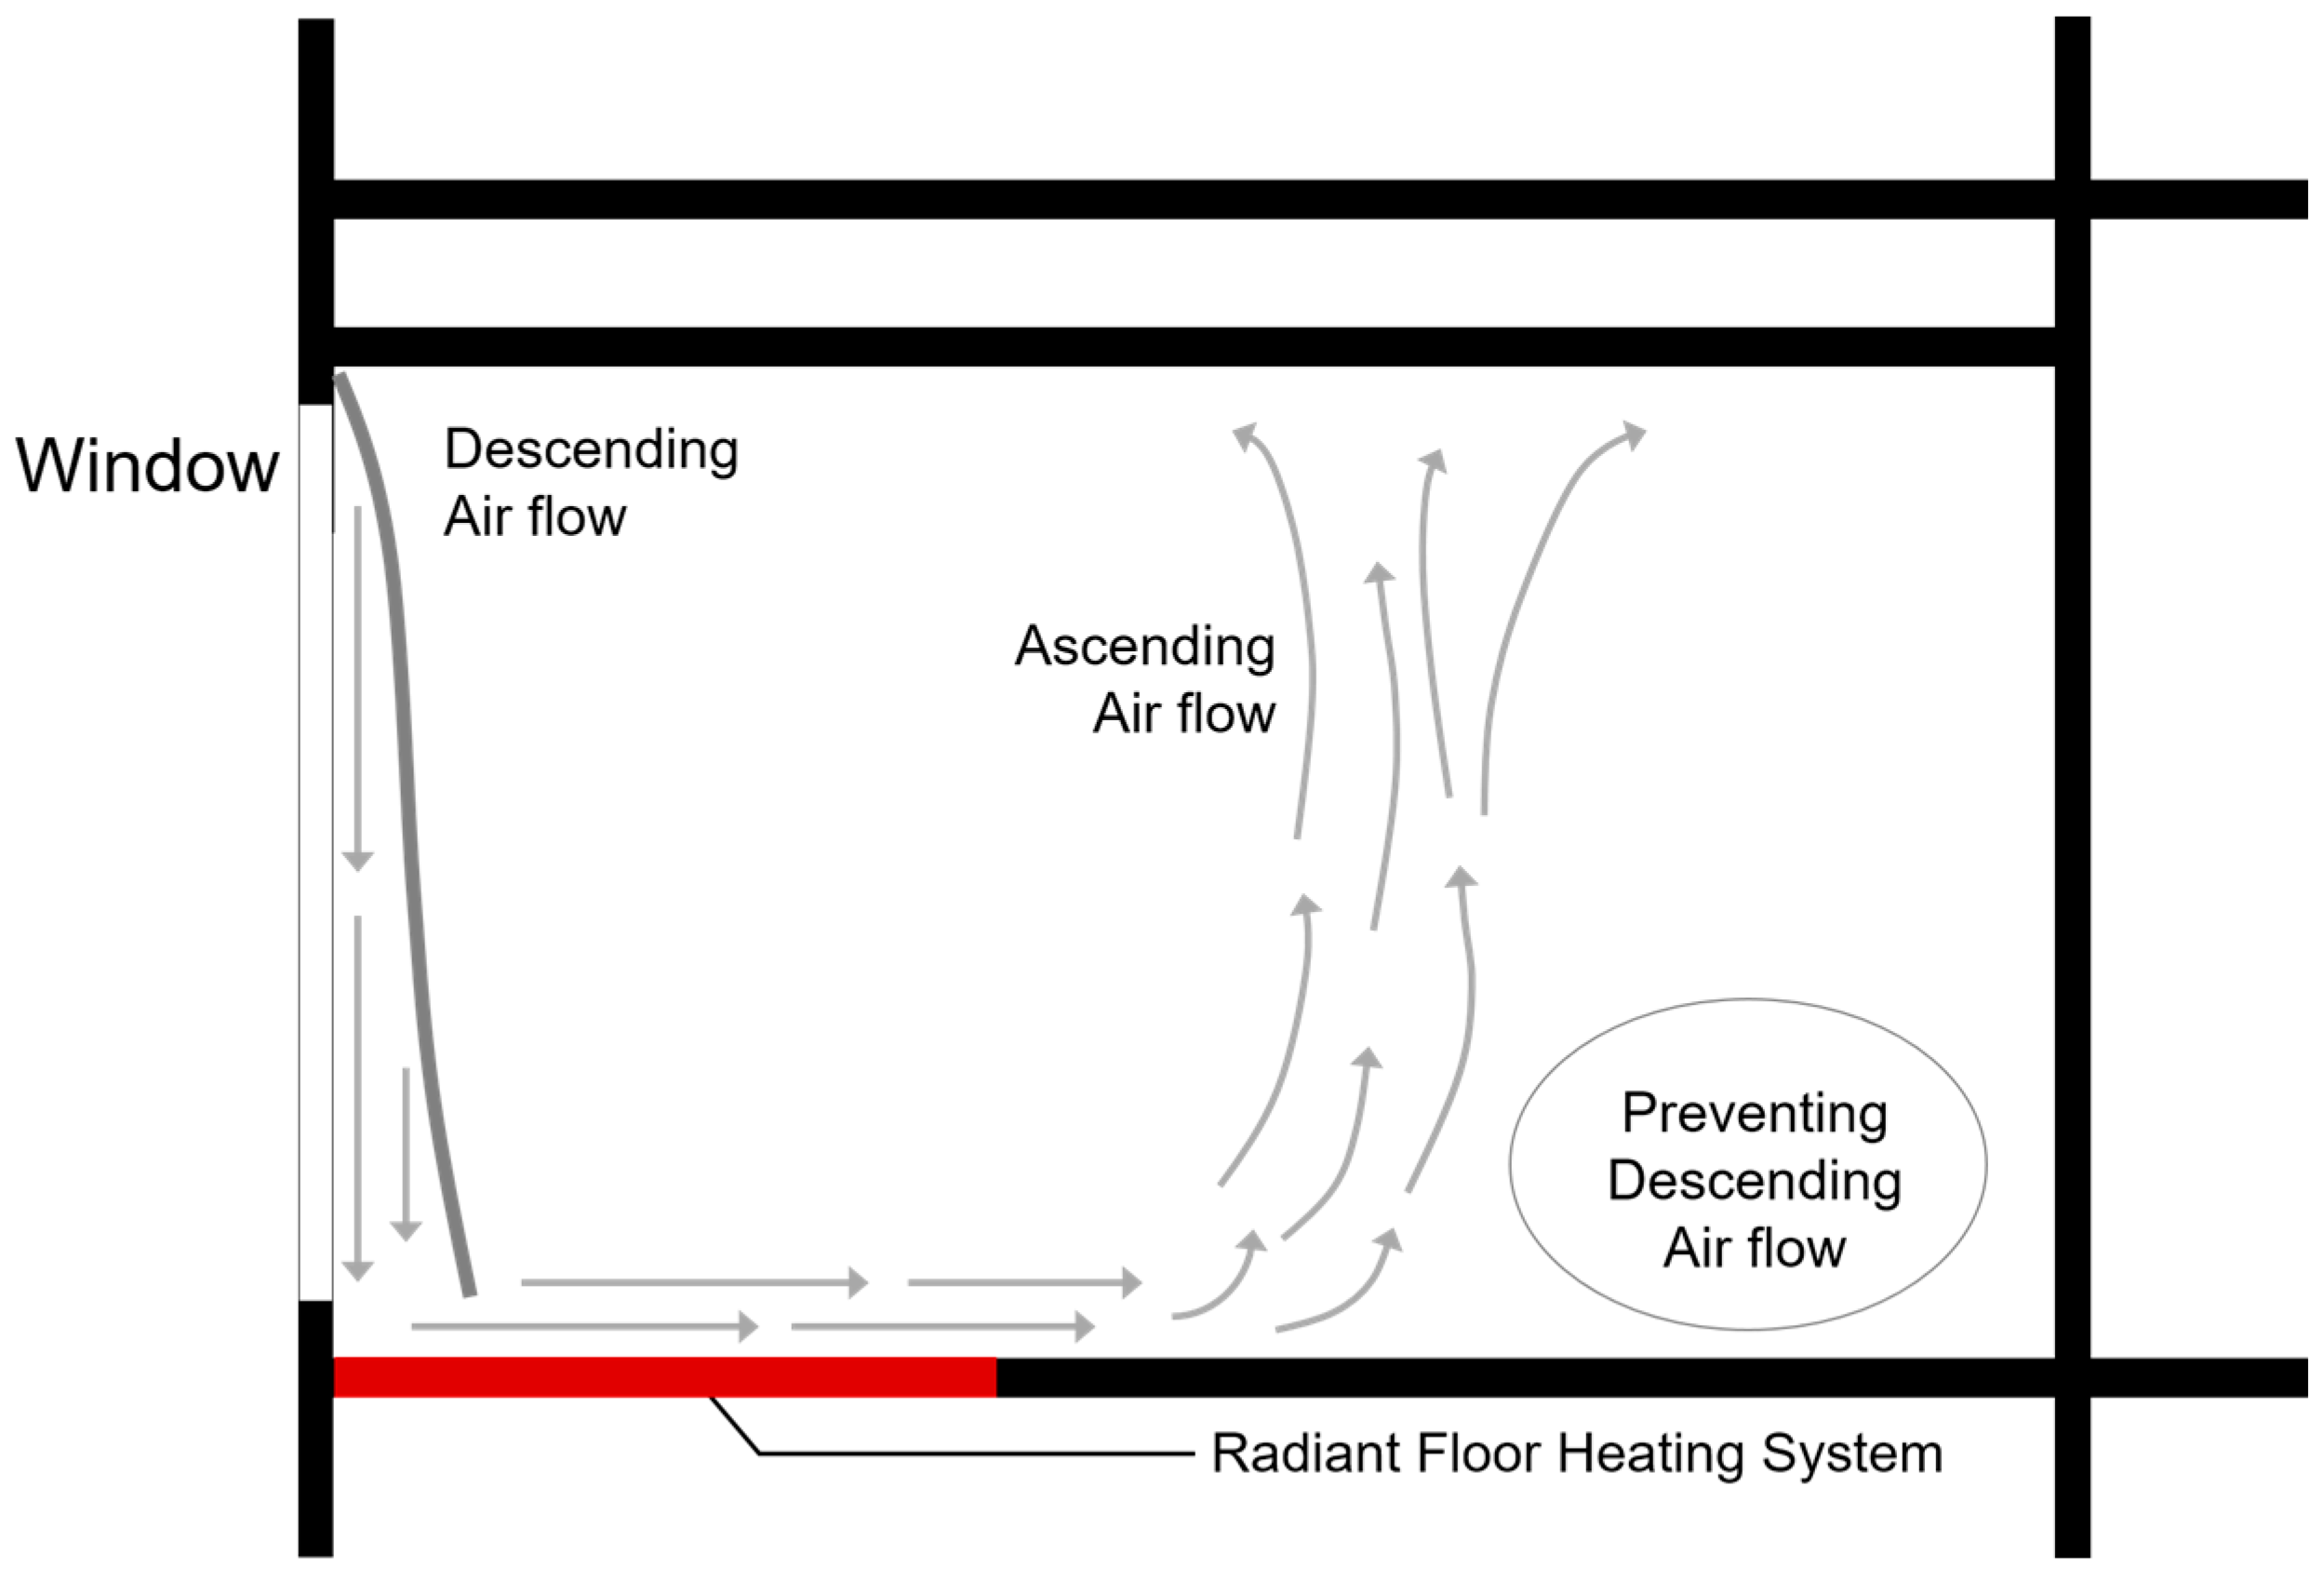
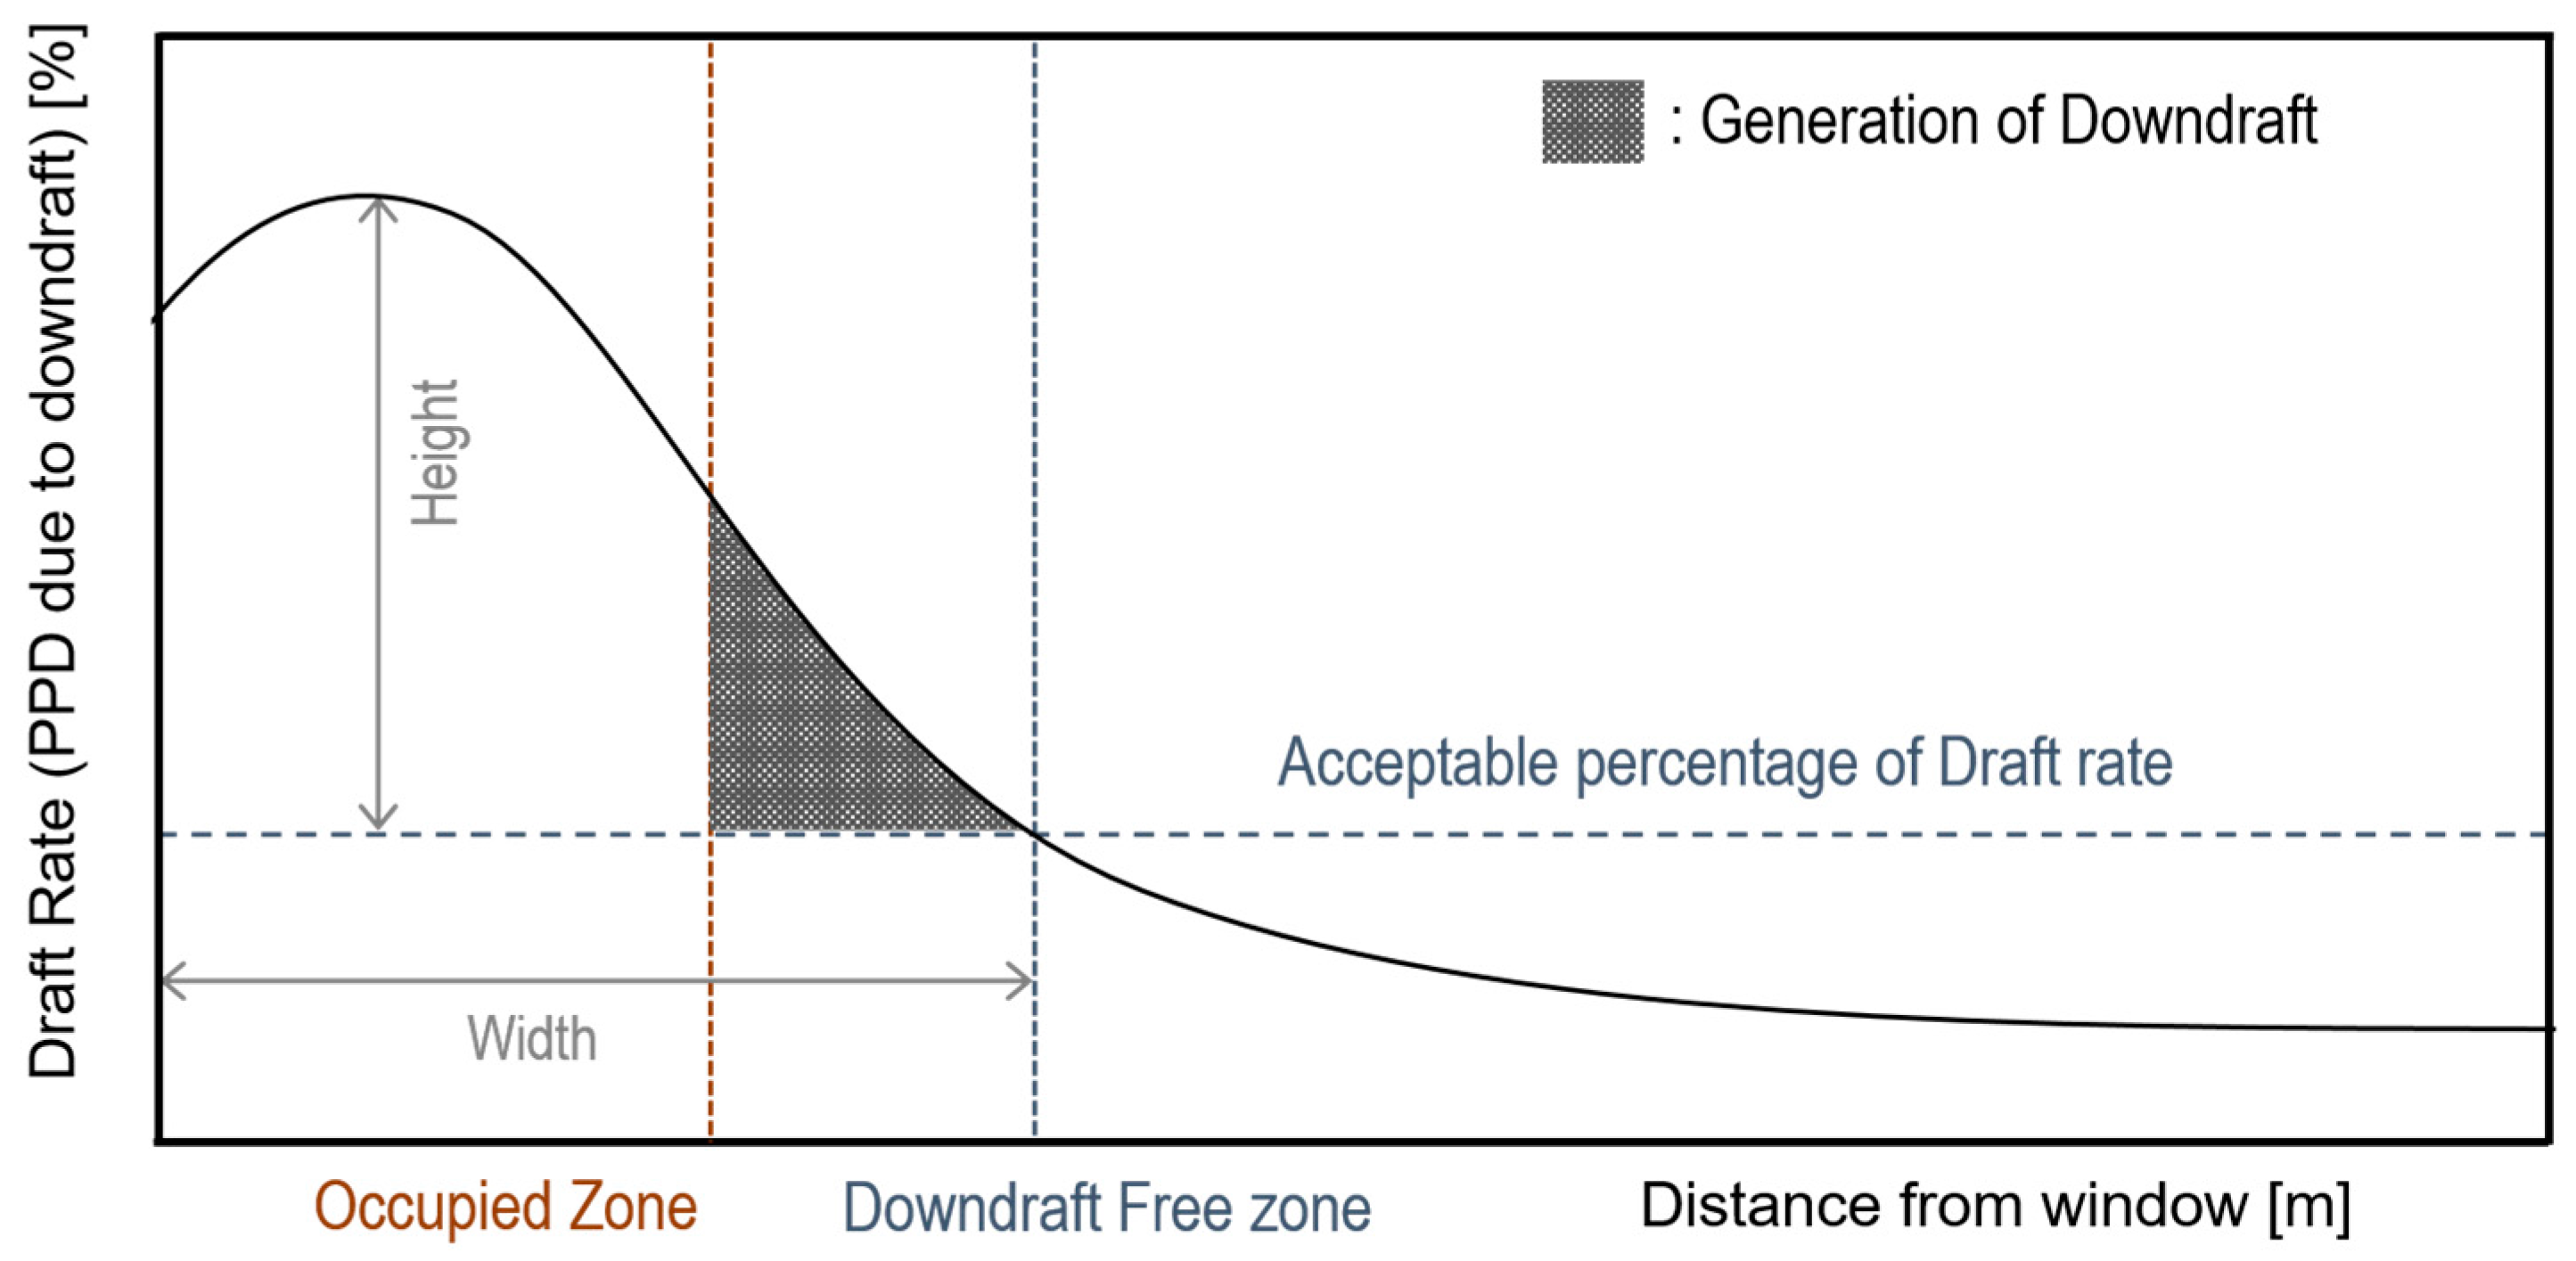
3.1. Mechanism of Downdraft Prevention
3.2. Method for Downdraft Assessment
3.3. Parameters for Downdraft Assessment
4. CFD Simulation
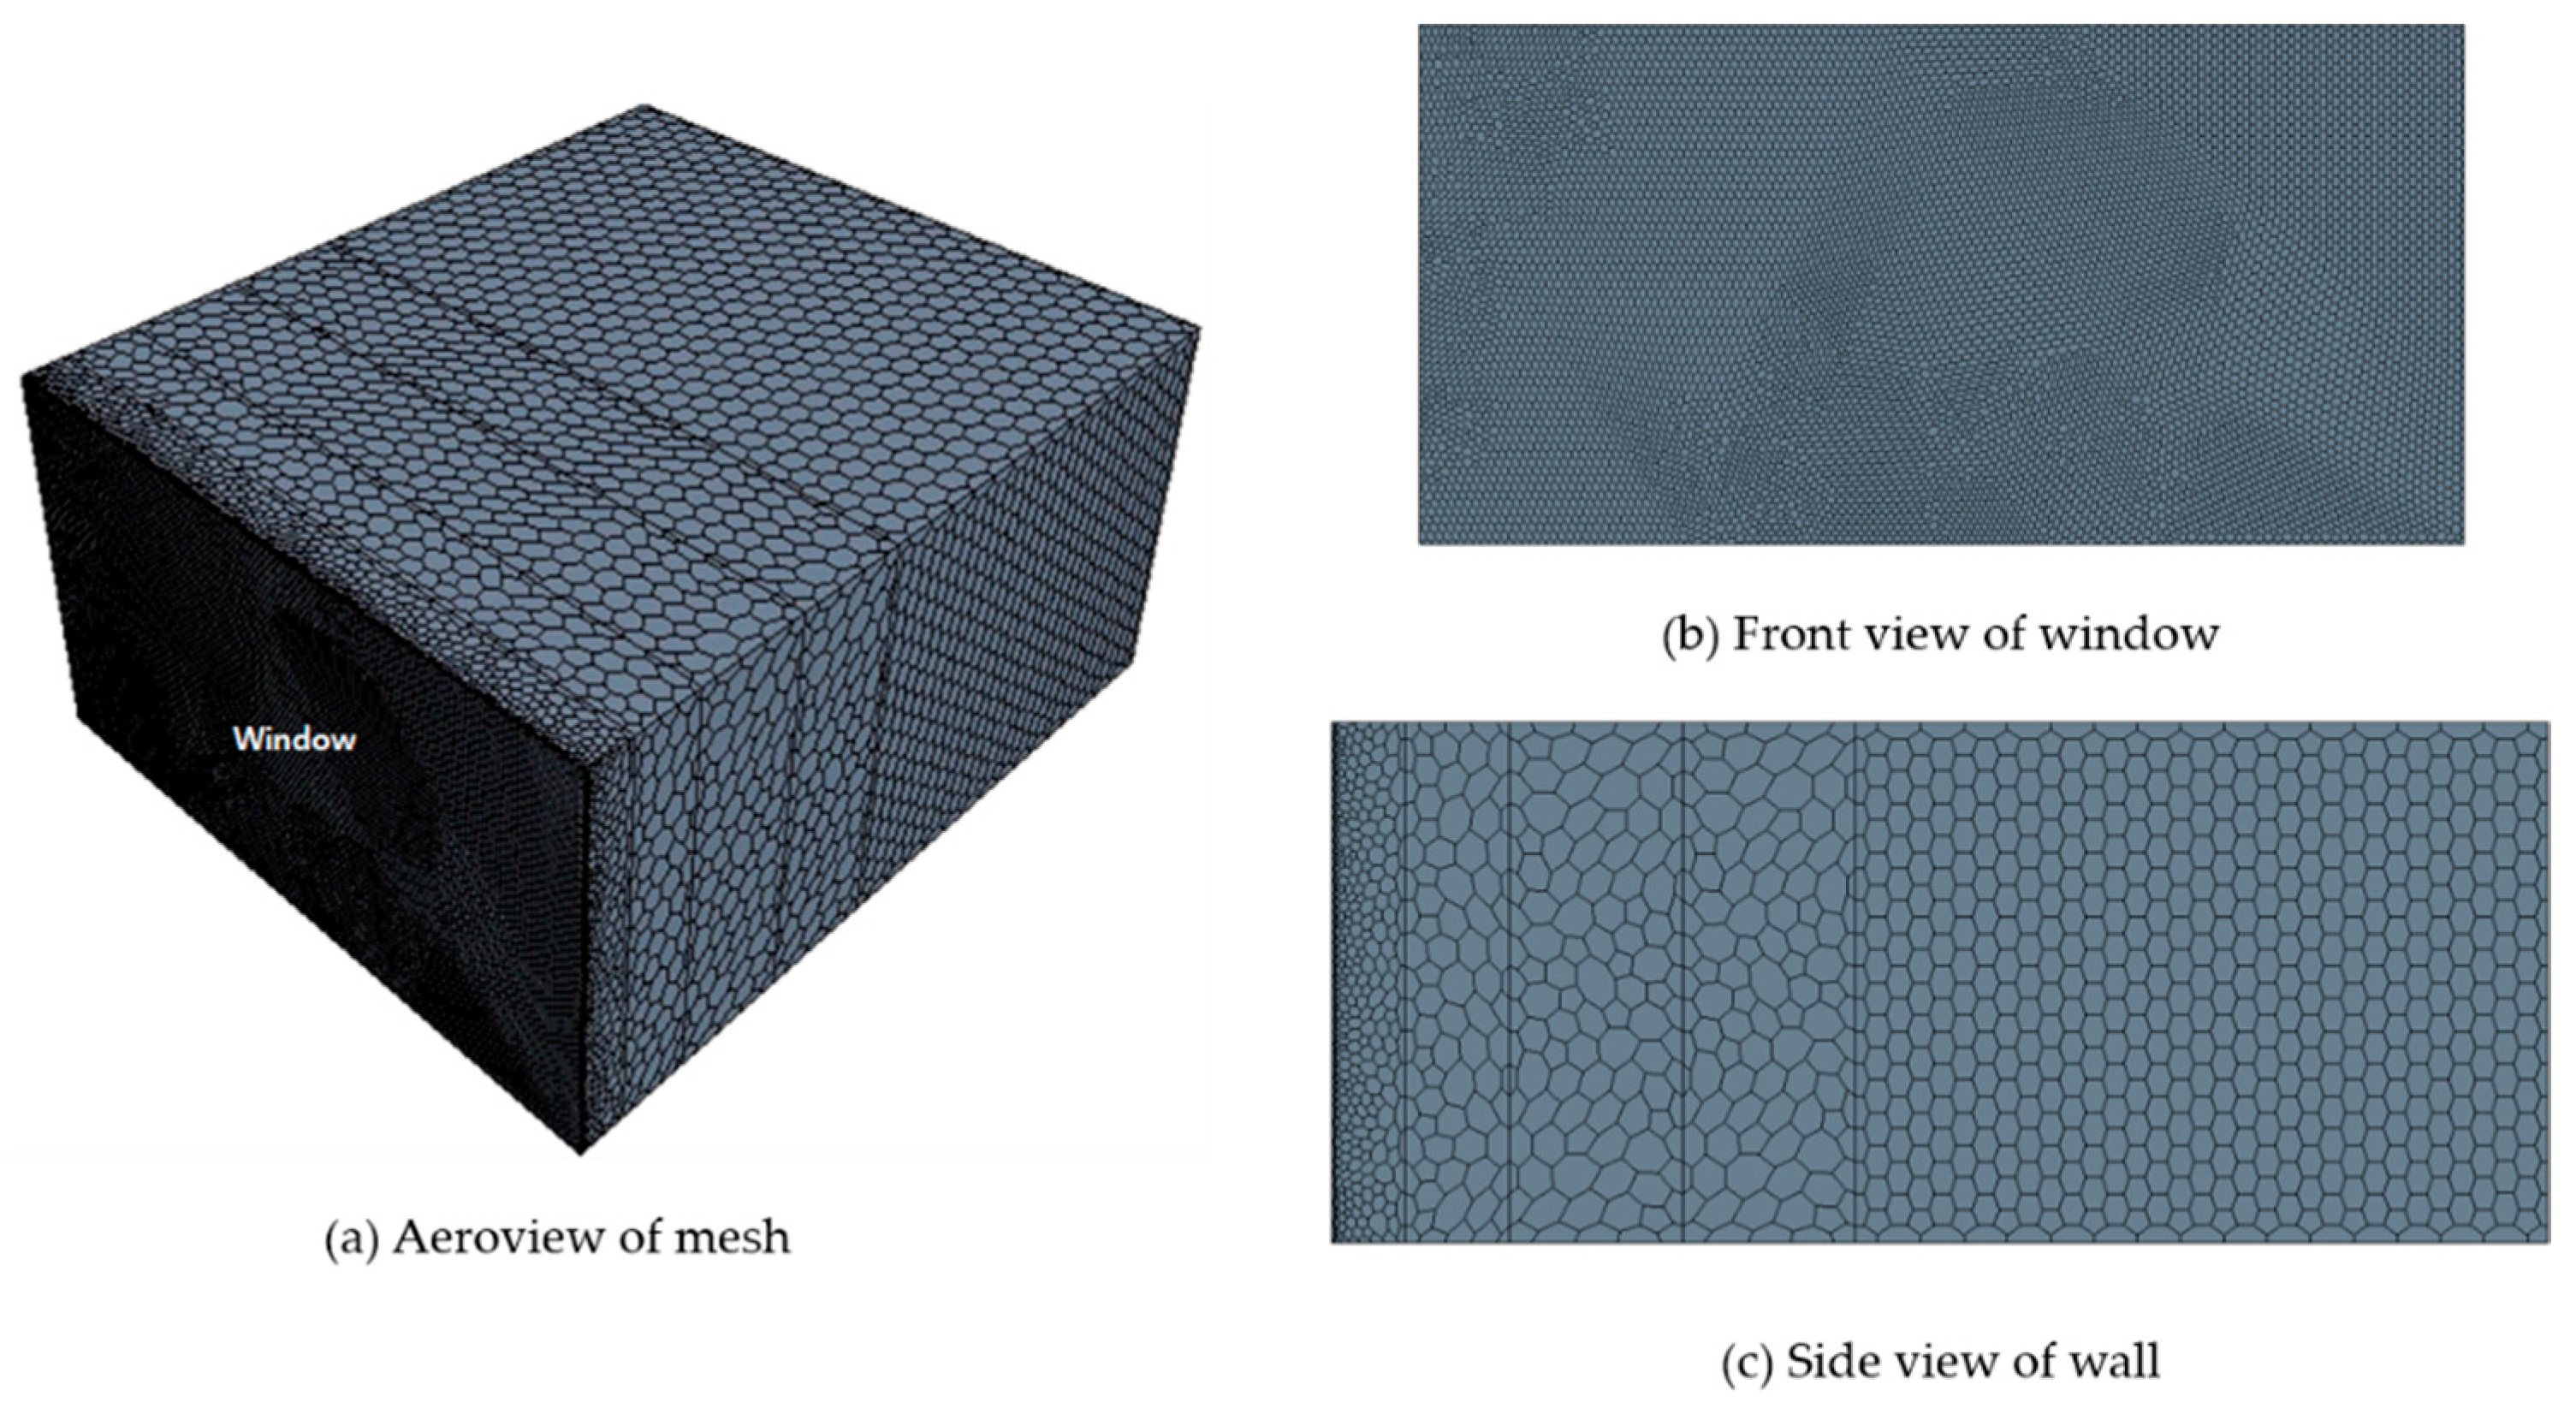
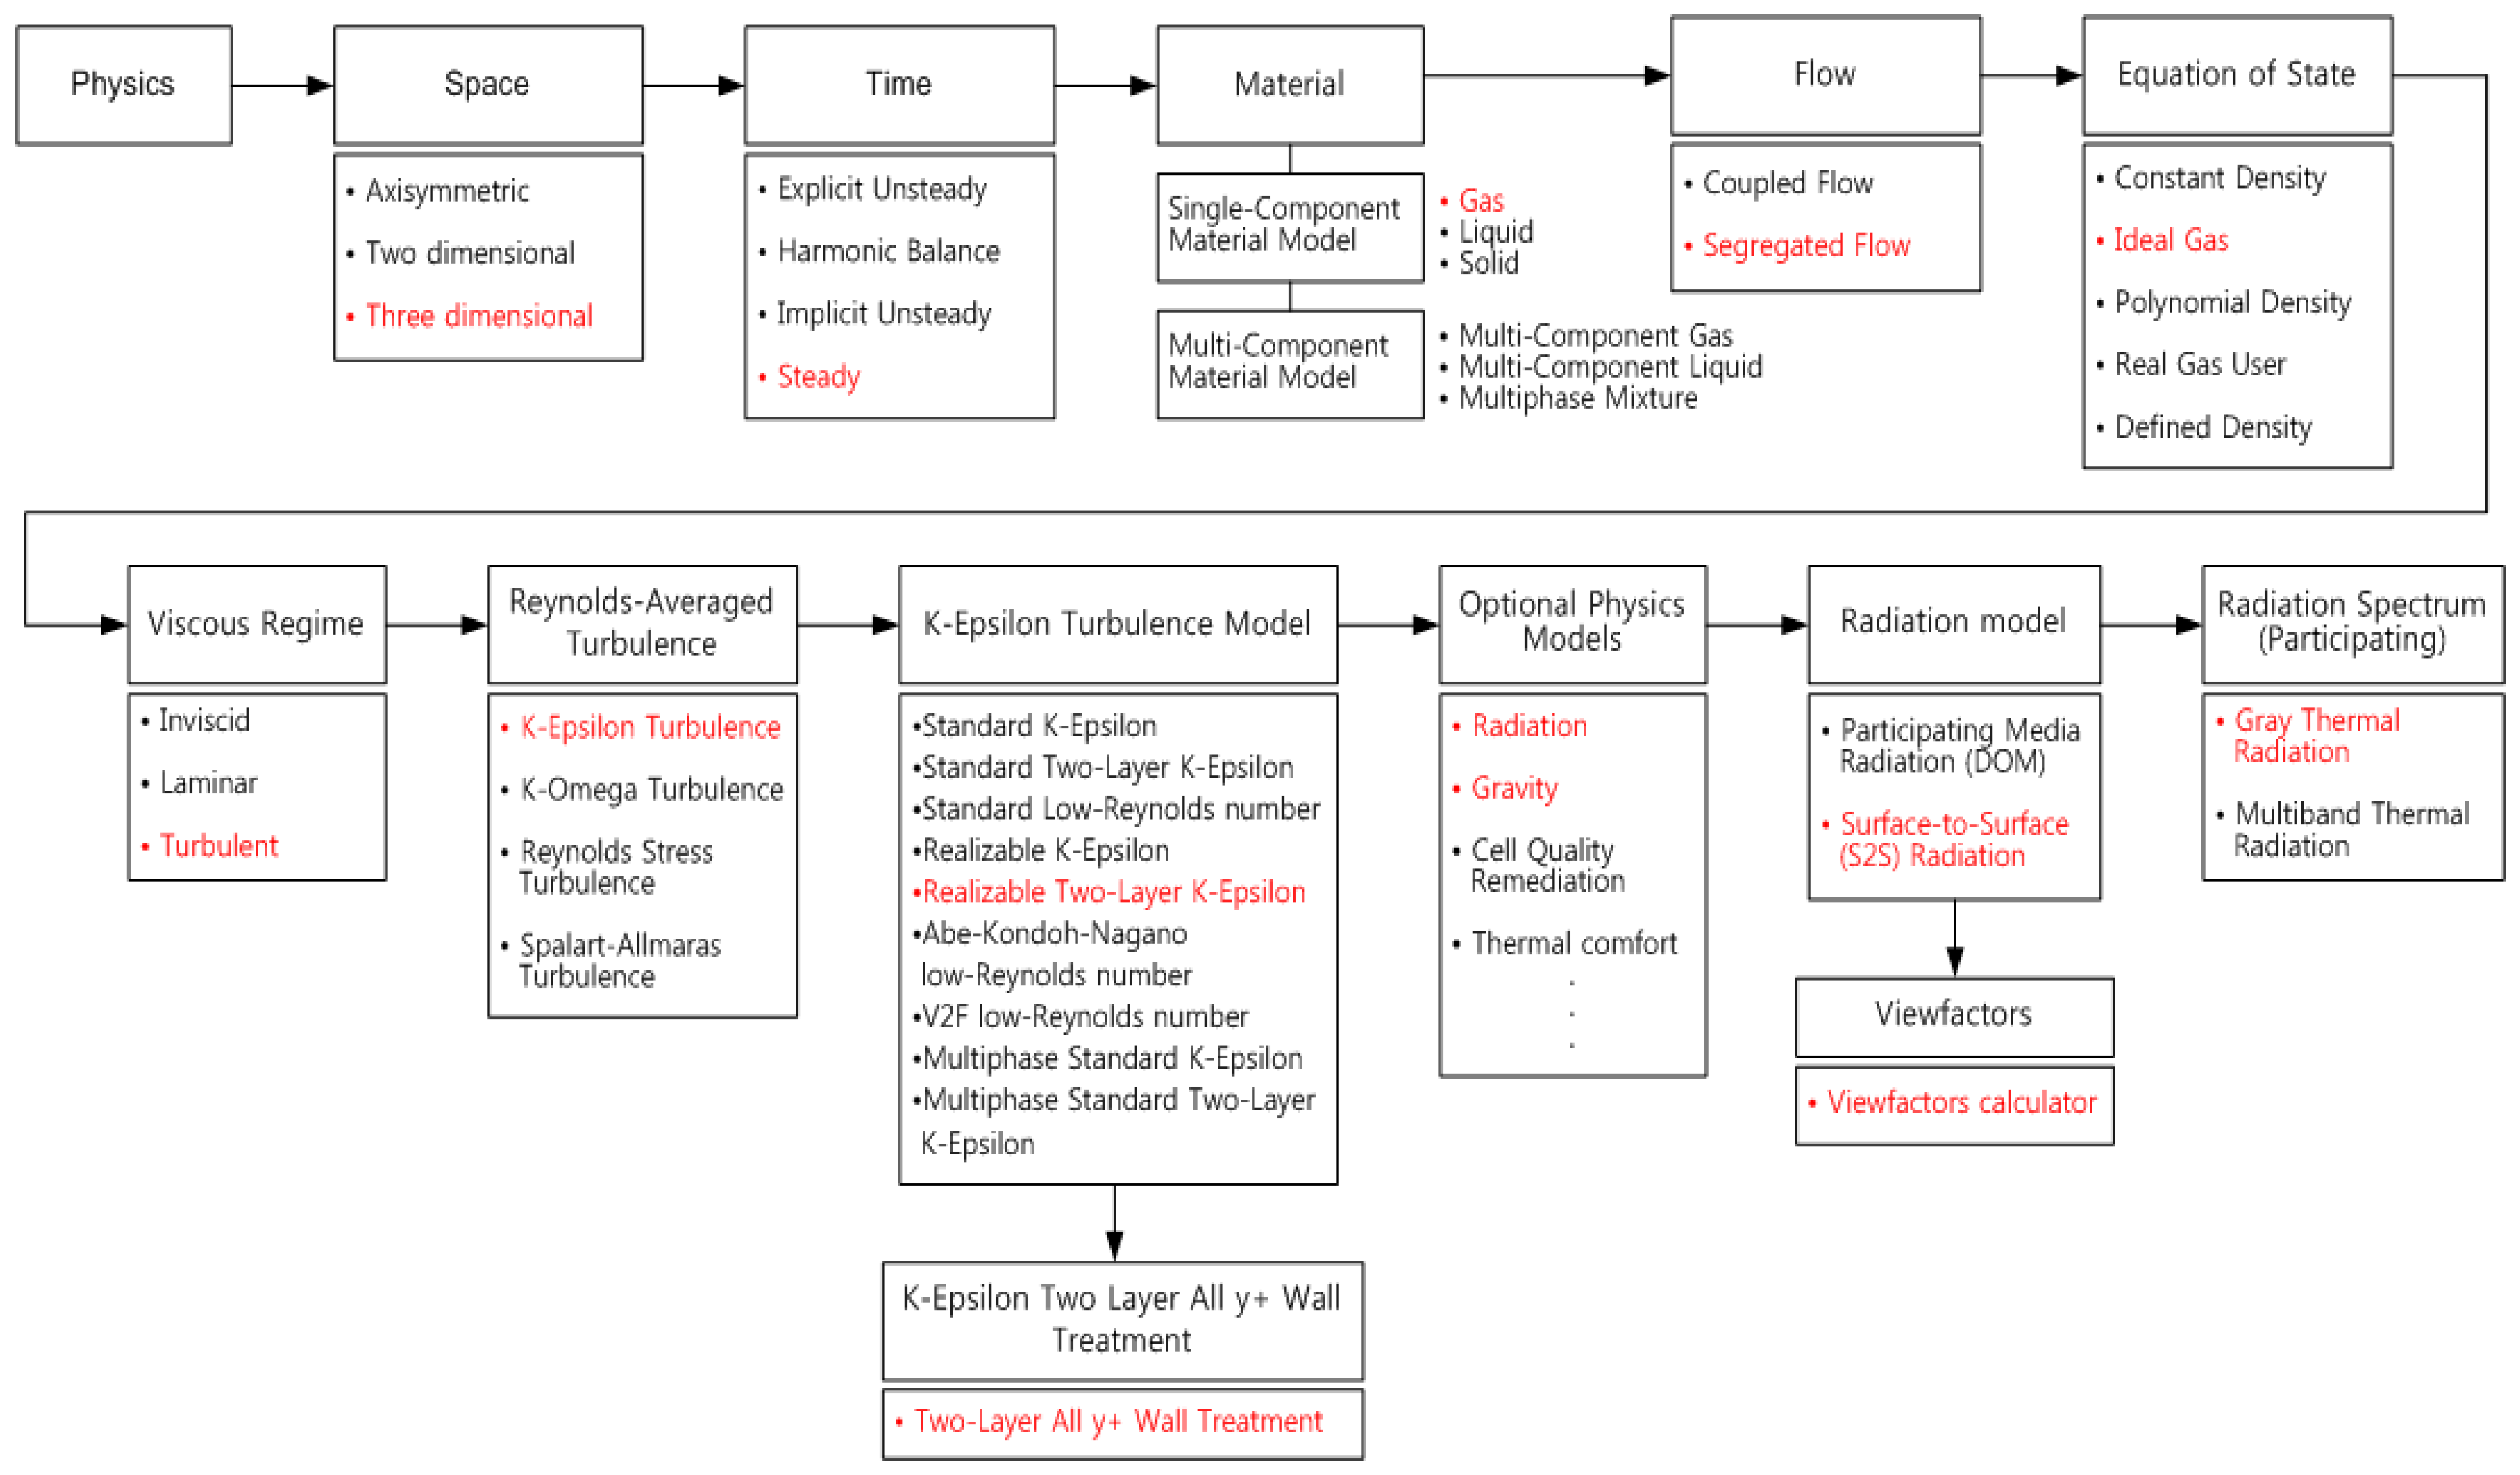
4.1. Description
4.2. Boundary Conditions
4.3. Simulation Cases
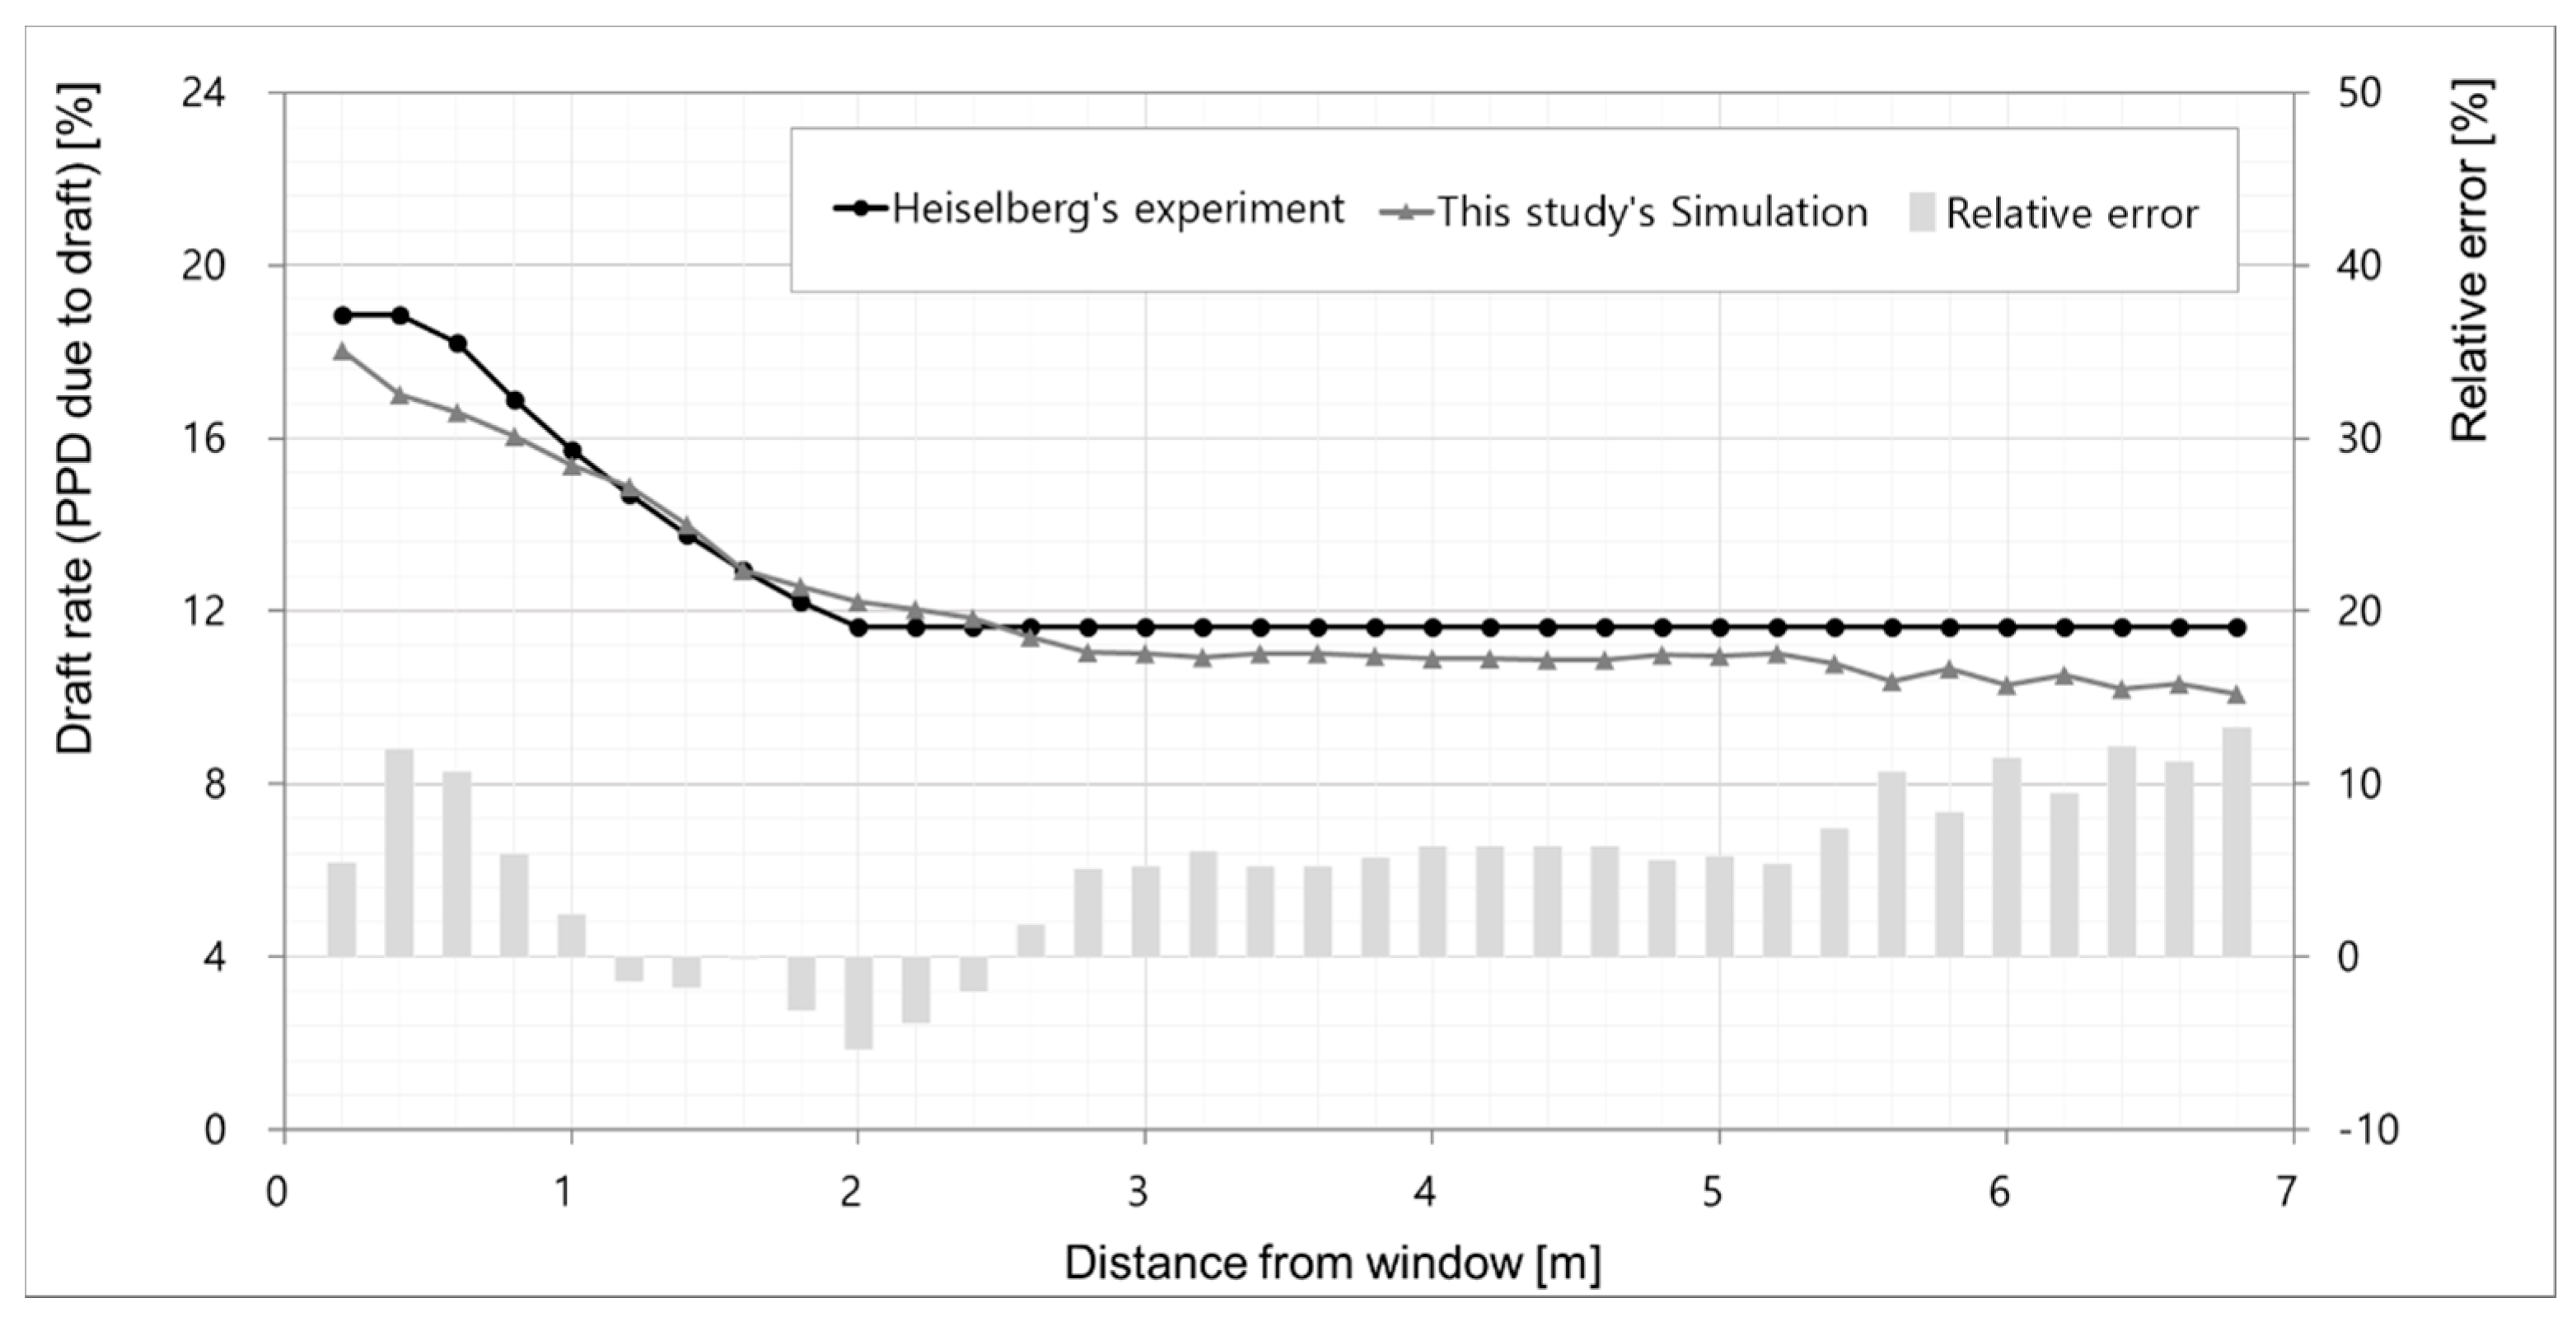
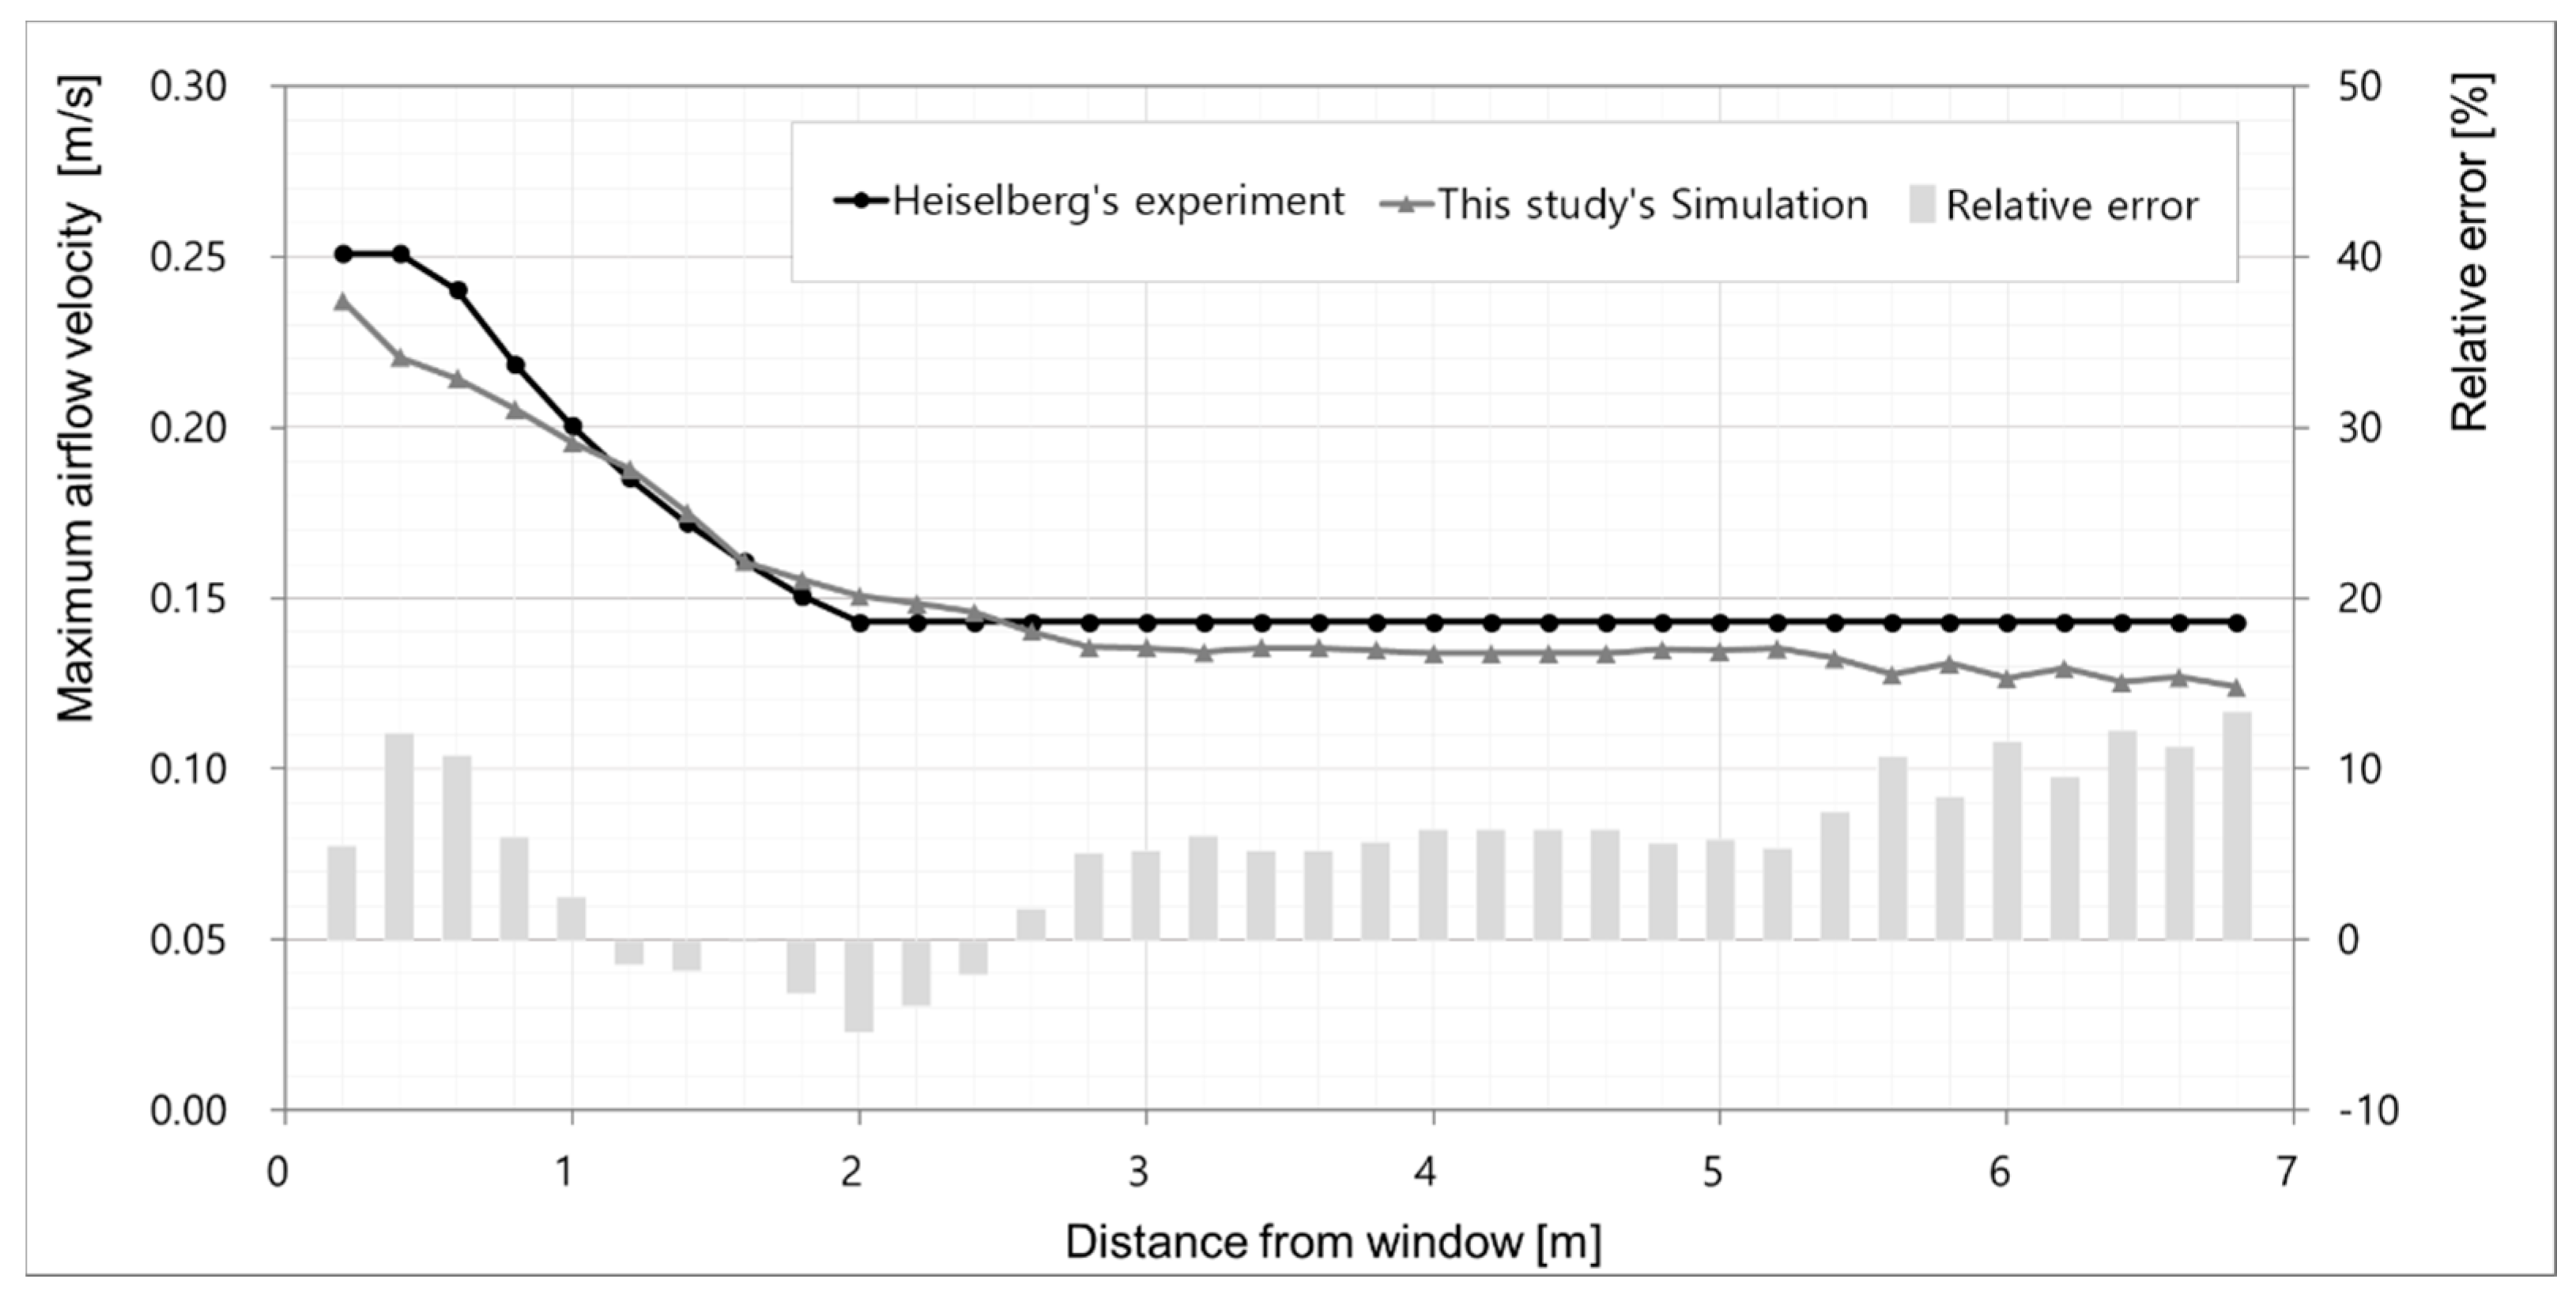
4.4. Validation
5. Results and Discussion
5.1. Effect of Floor Temperature and RFHS Radiant Area
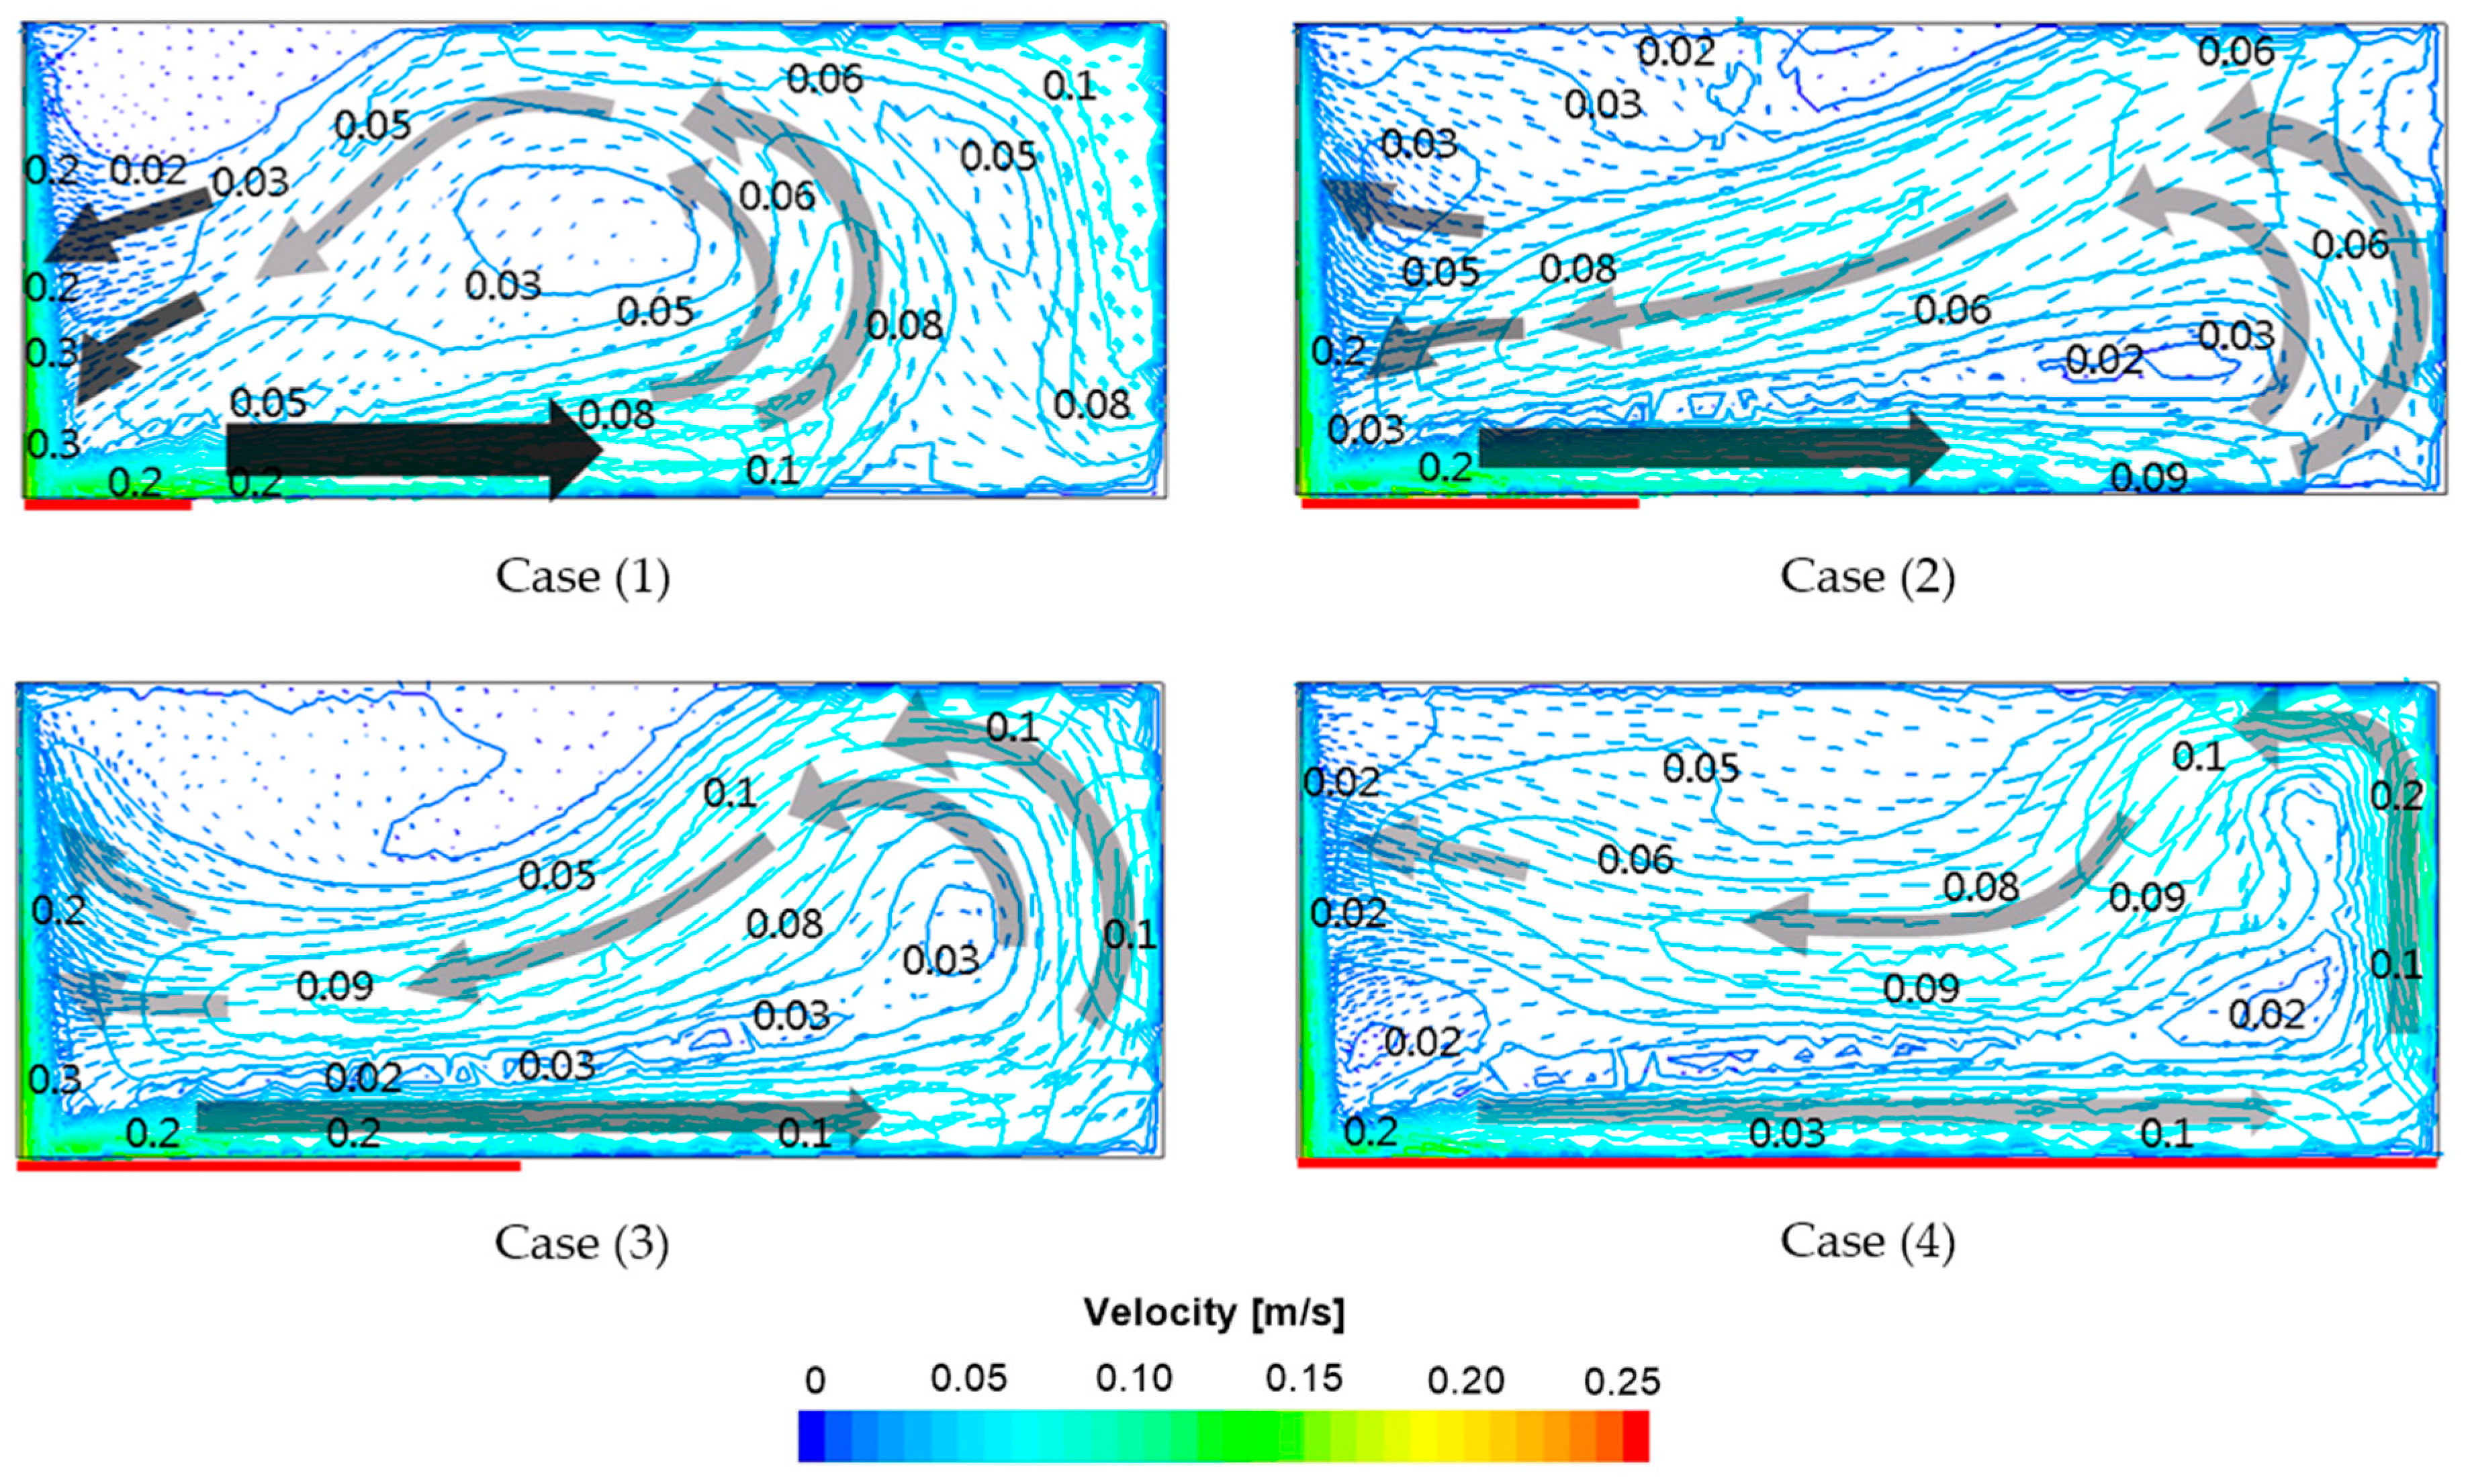
5.1.1. Velocity Profiles
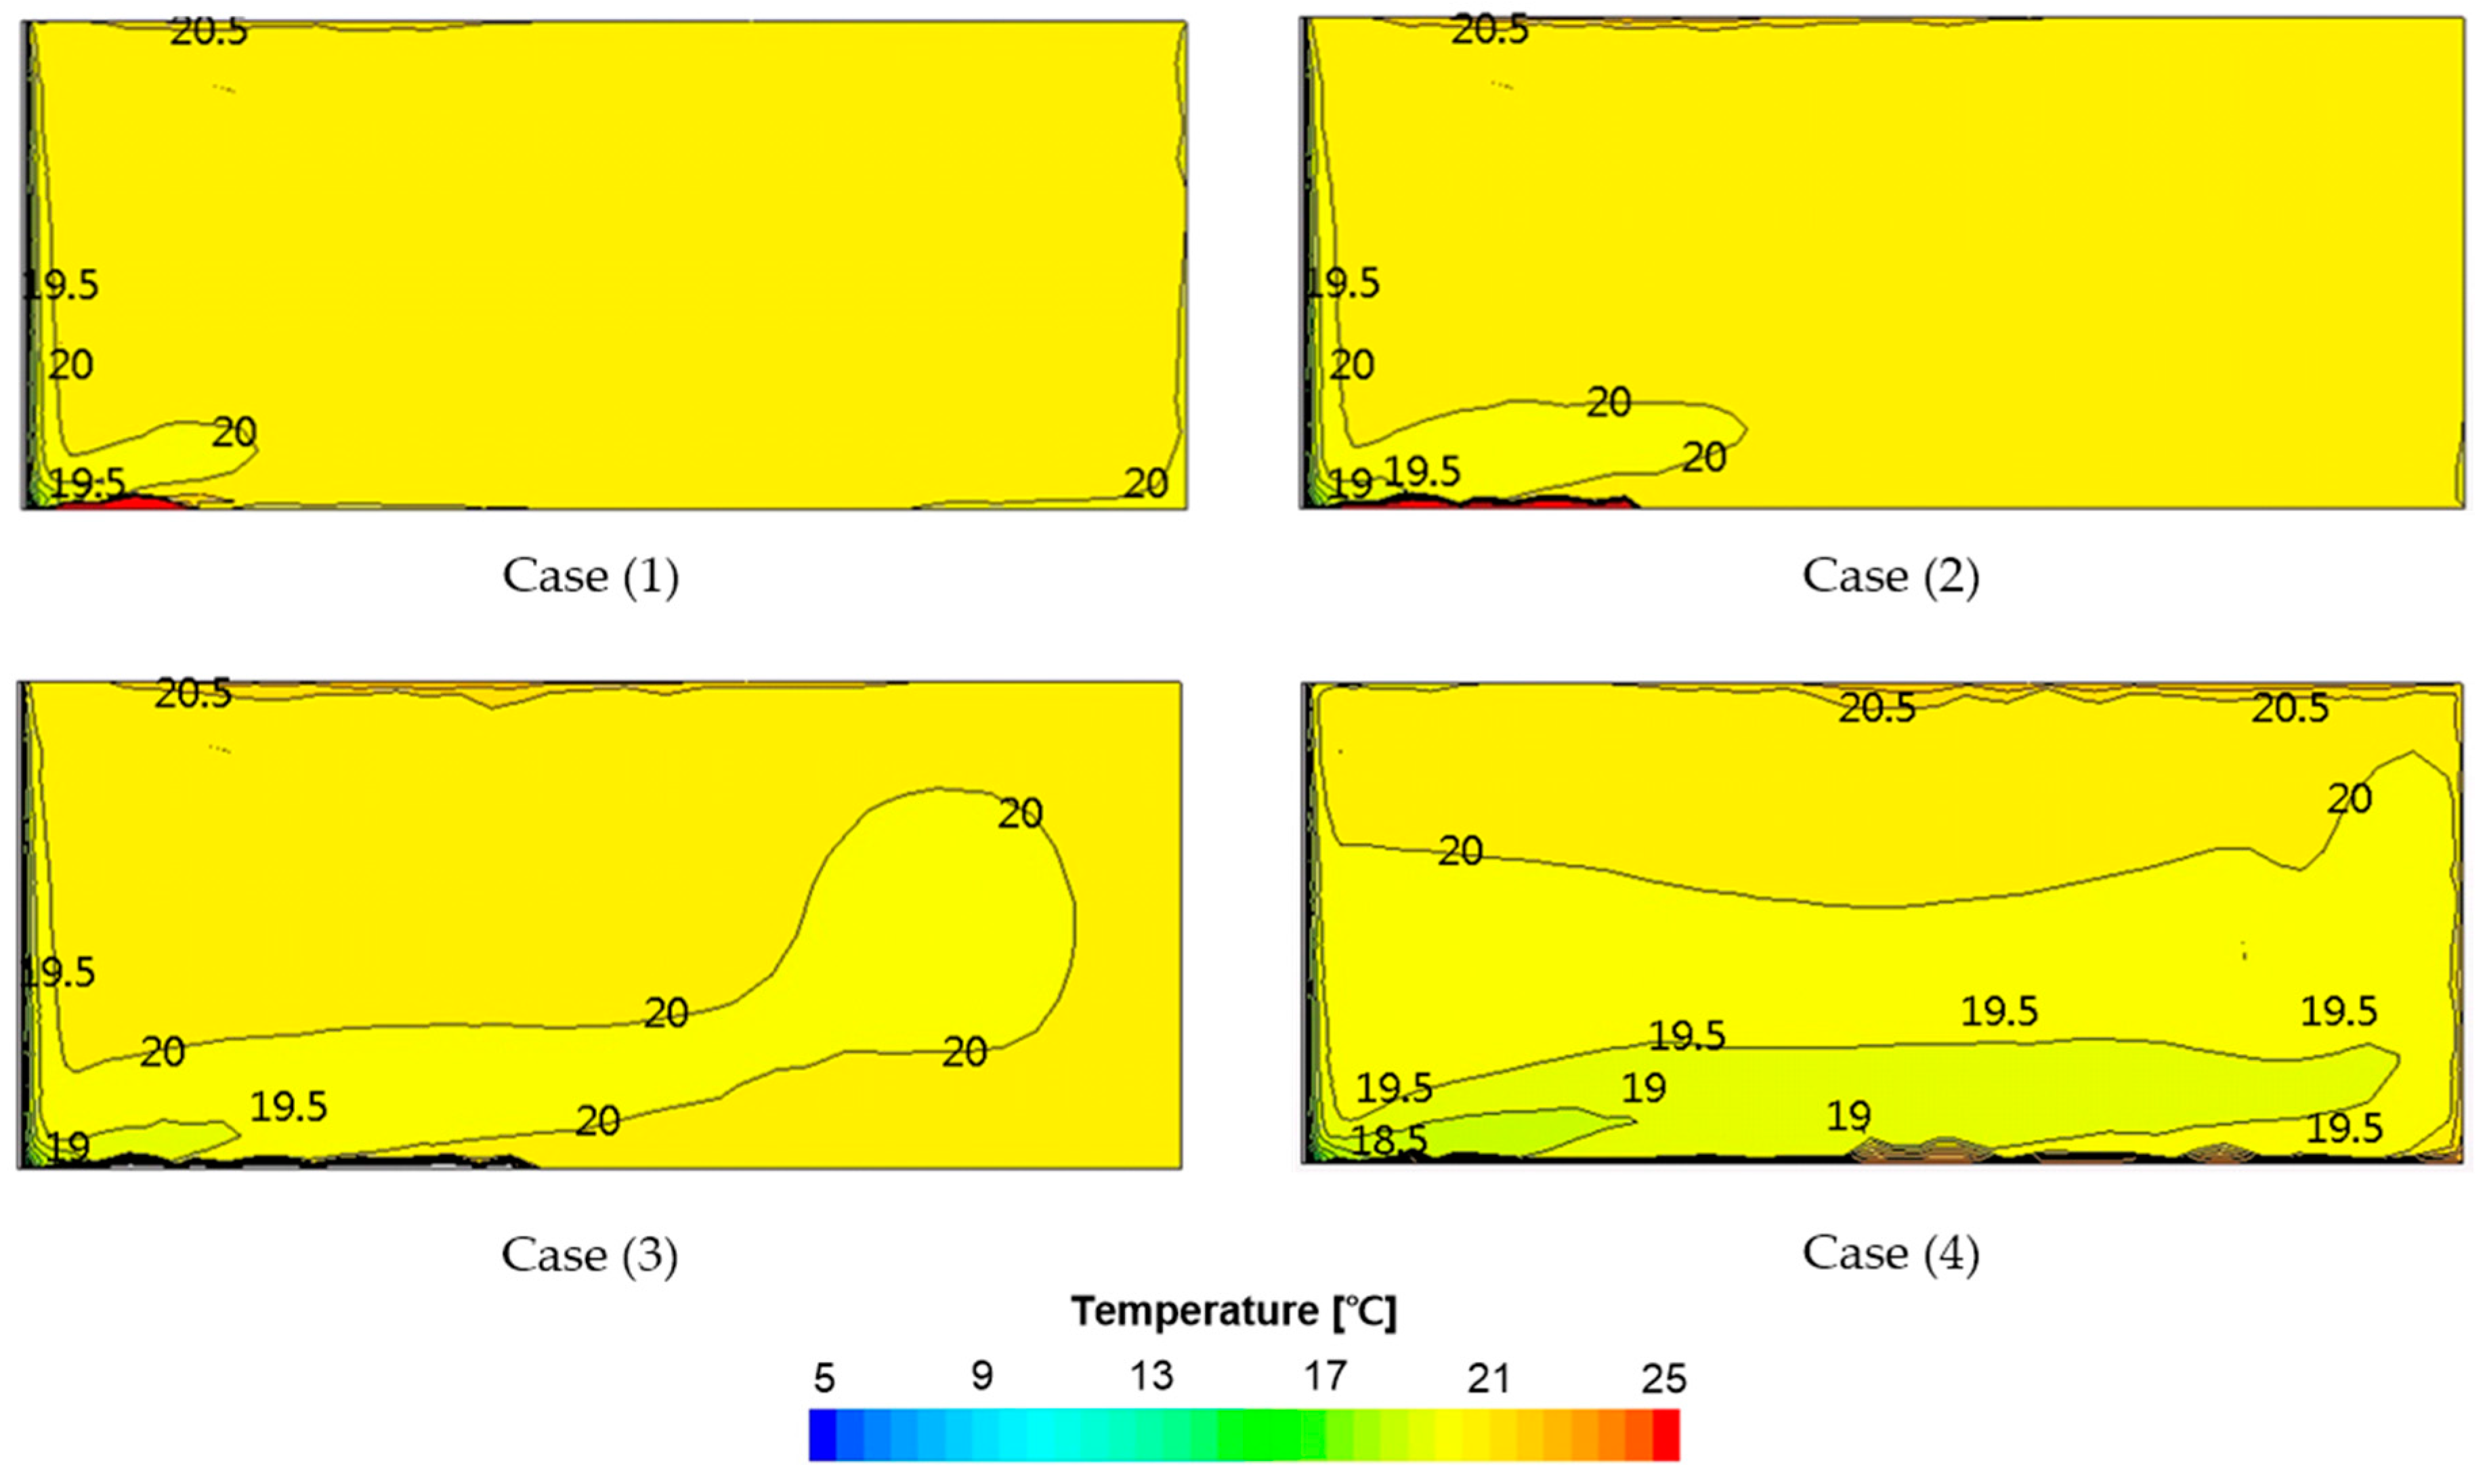
5.1.2. Temperature Distribution
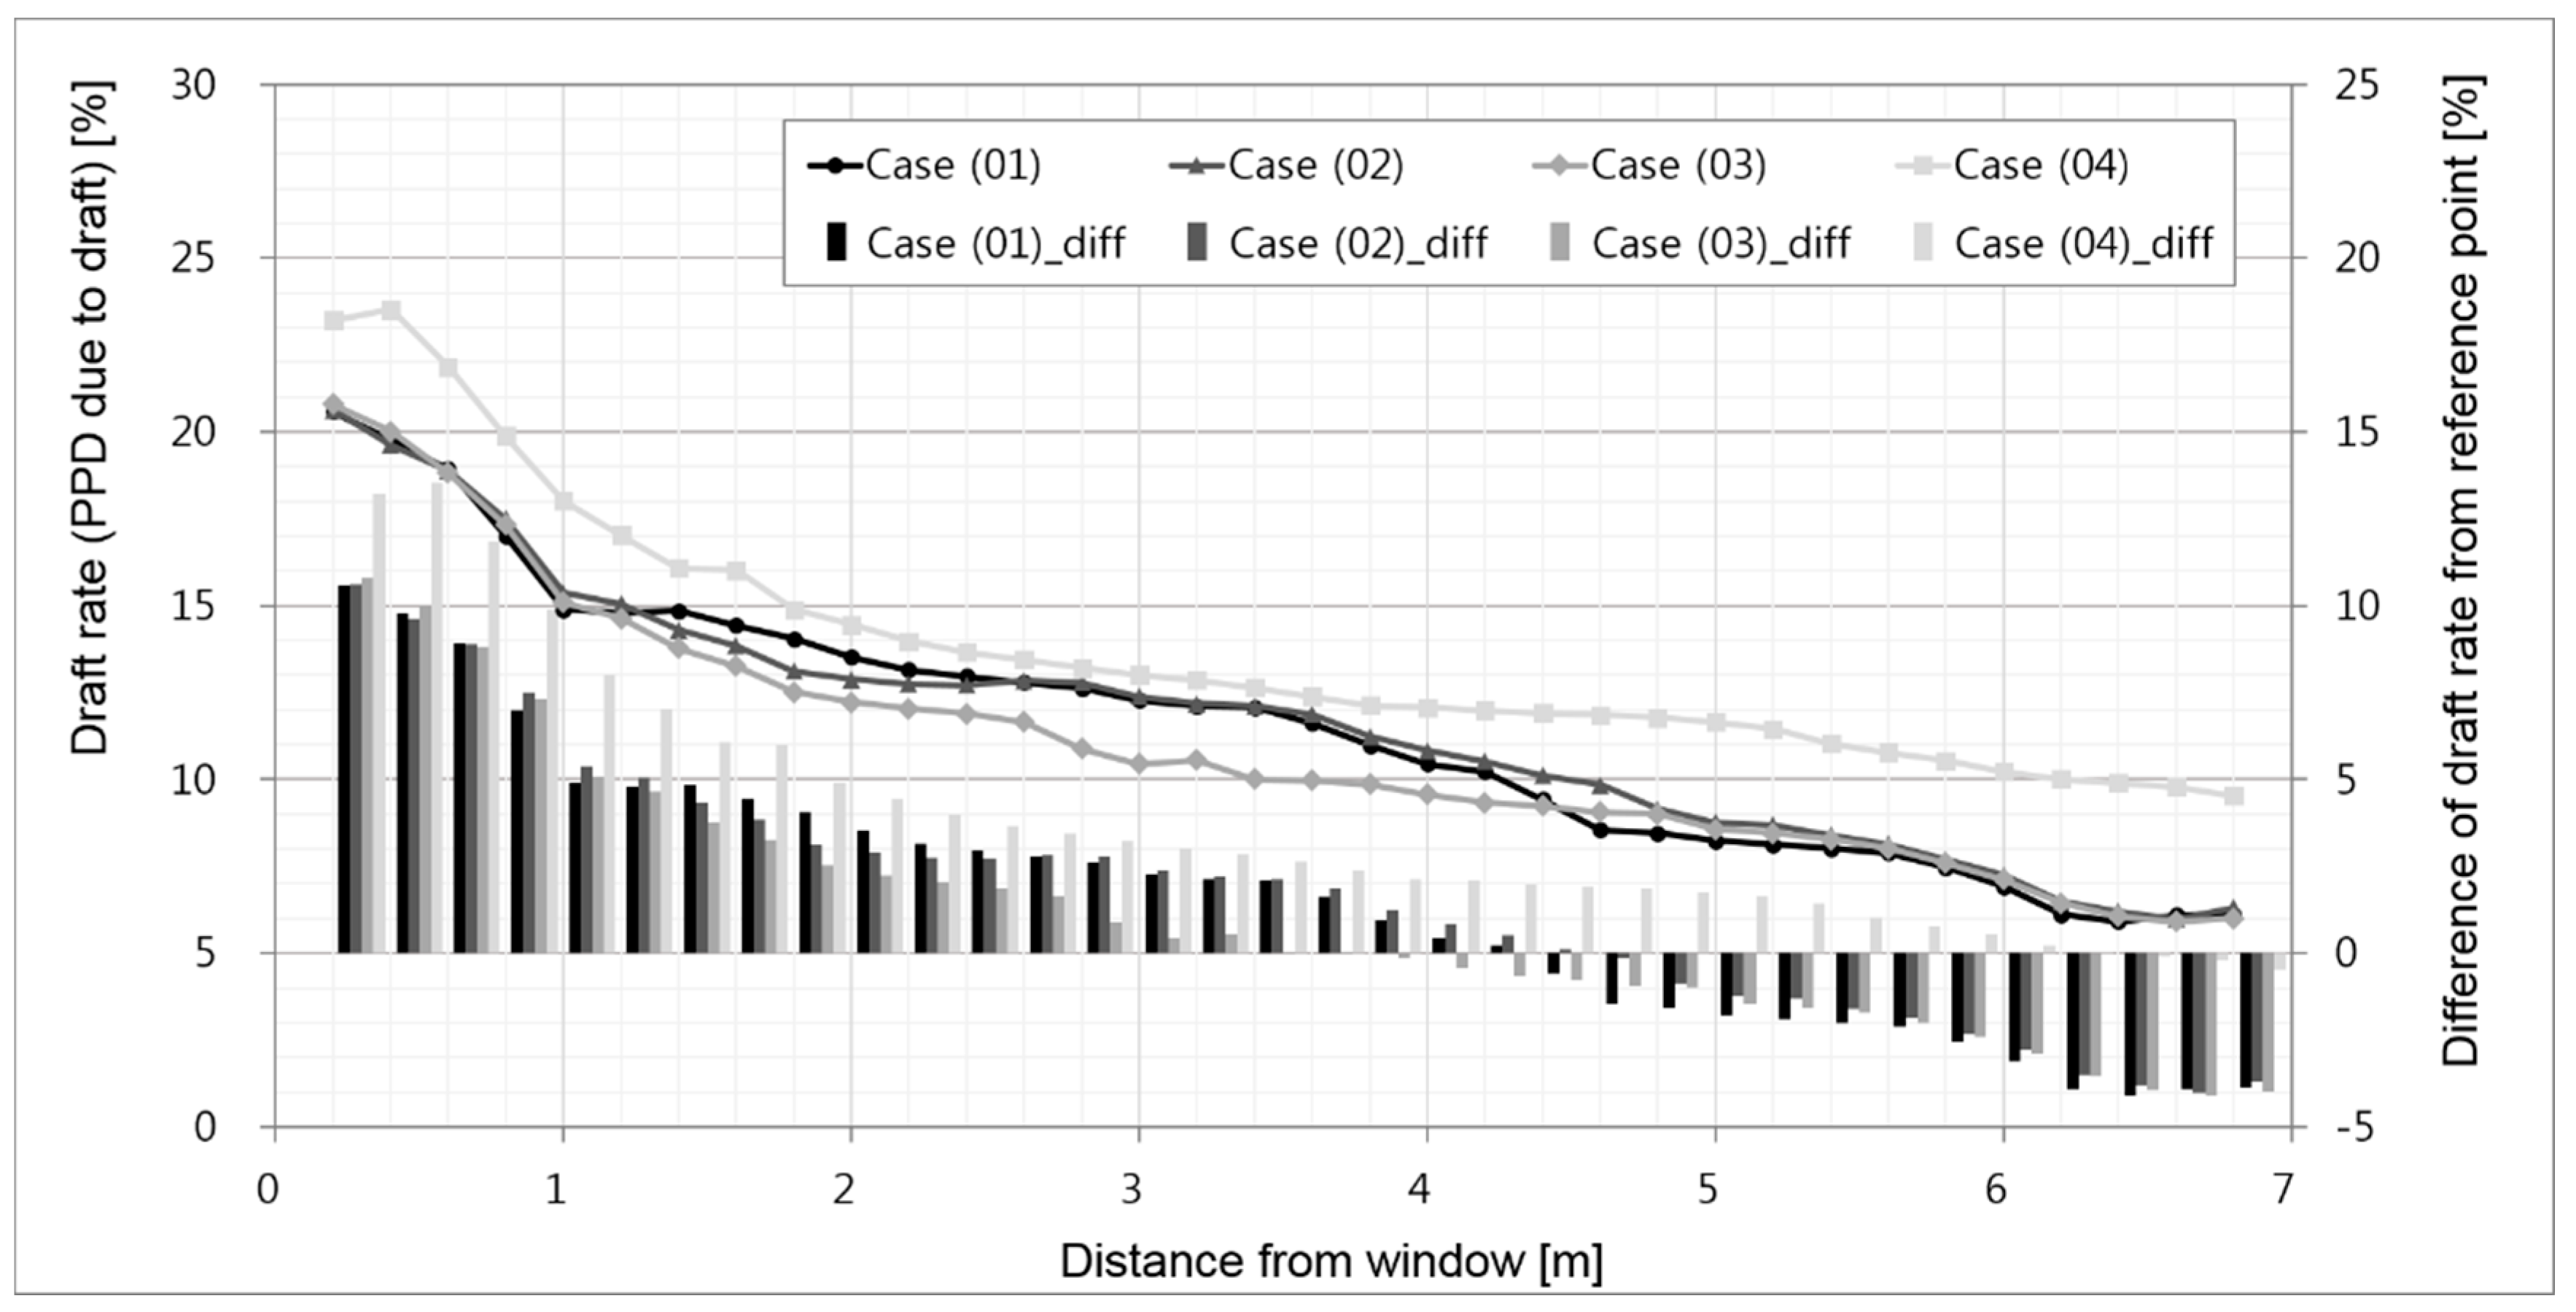
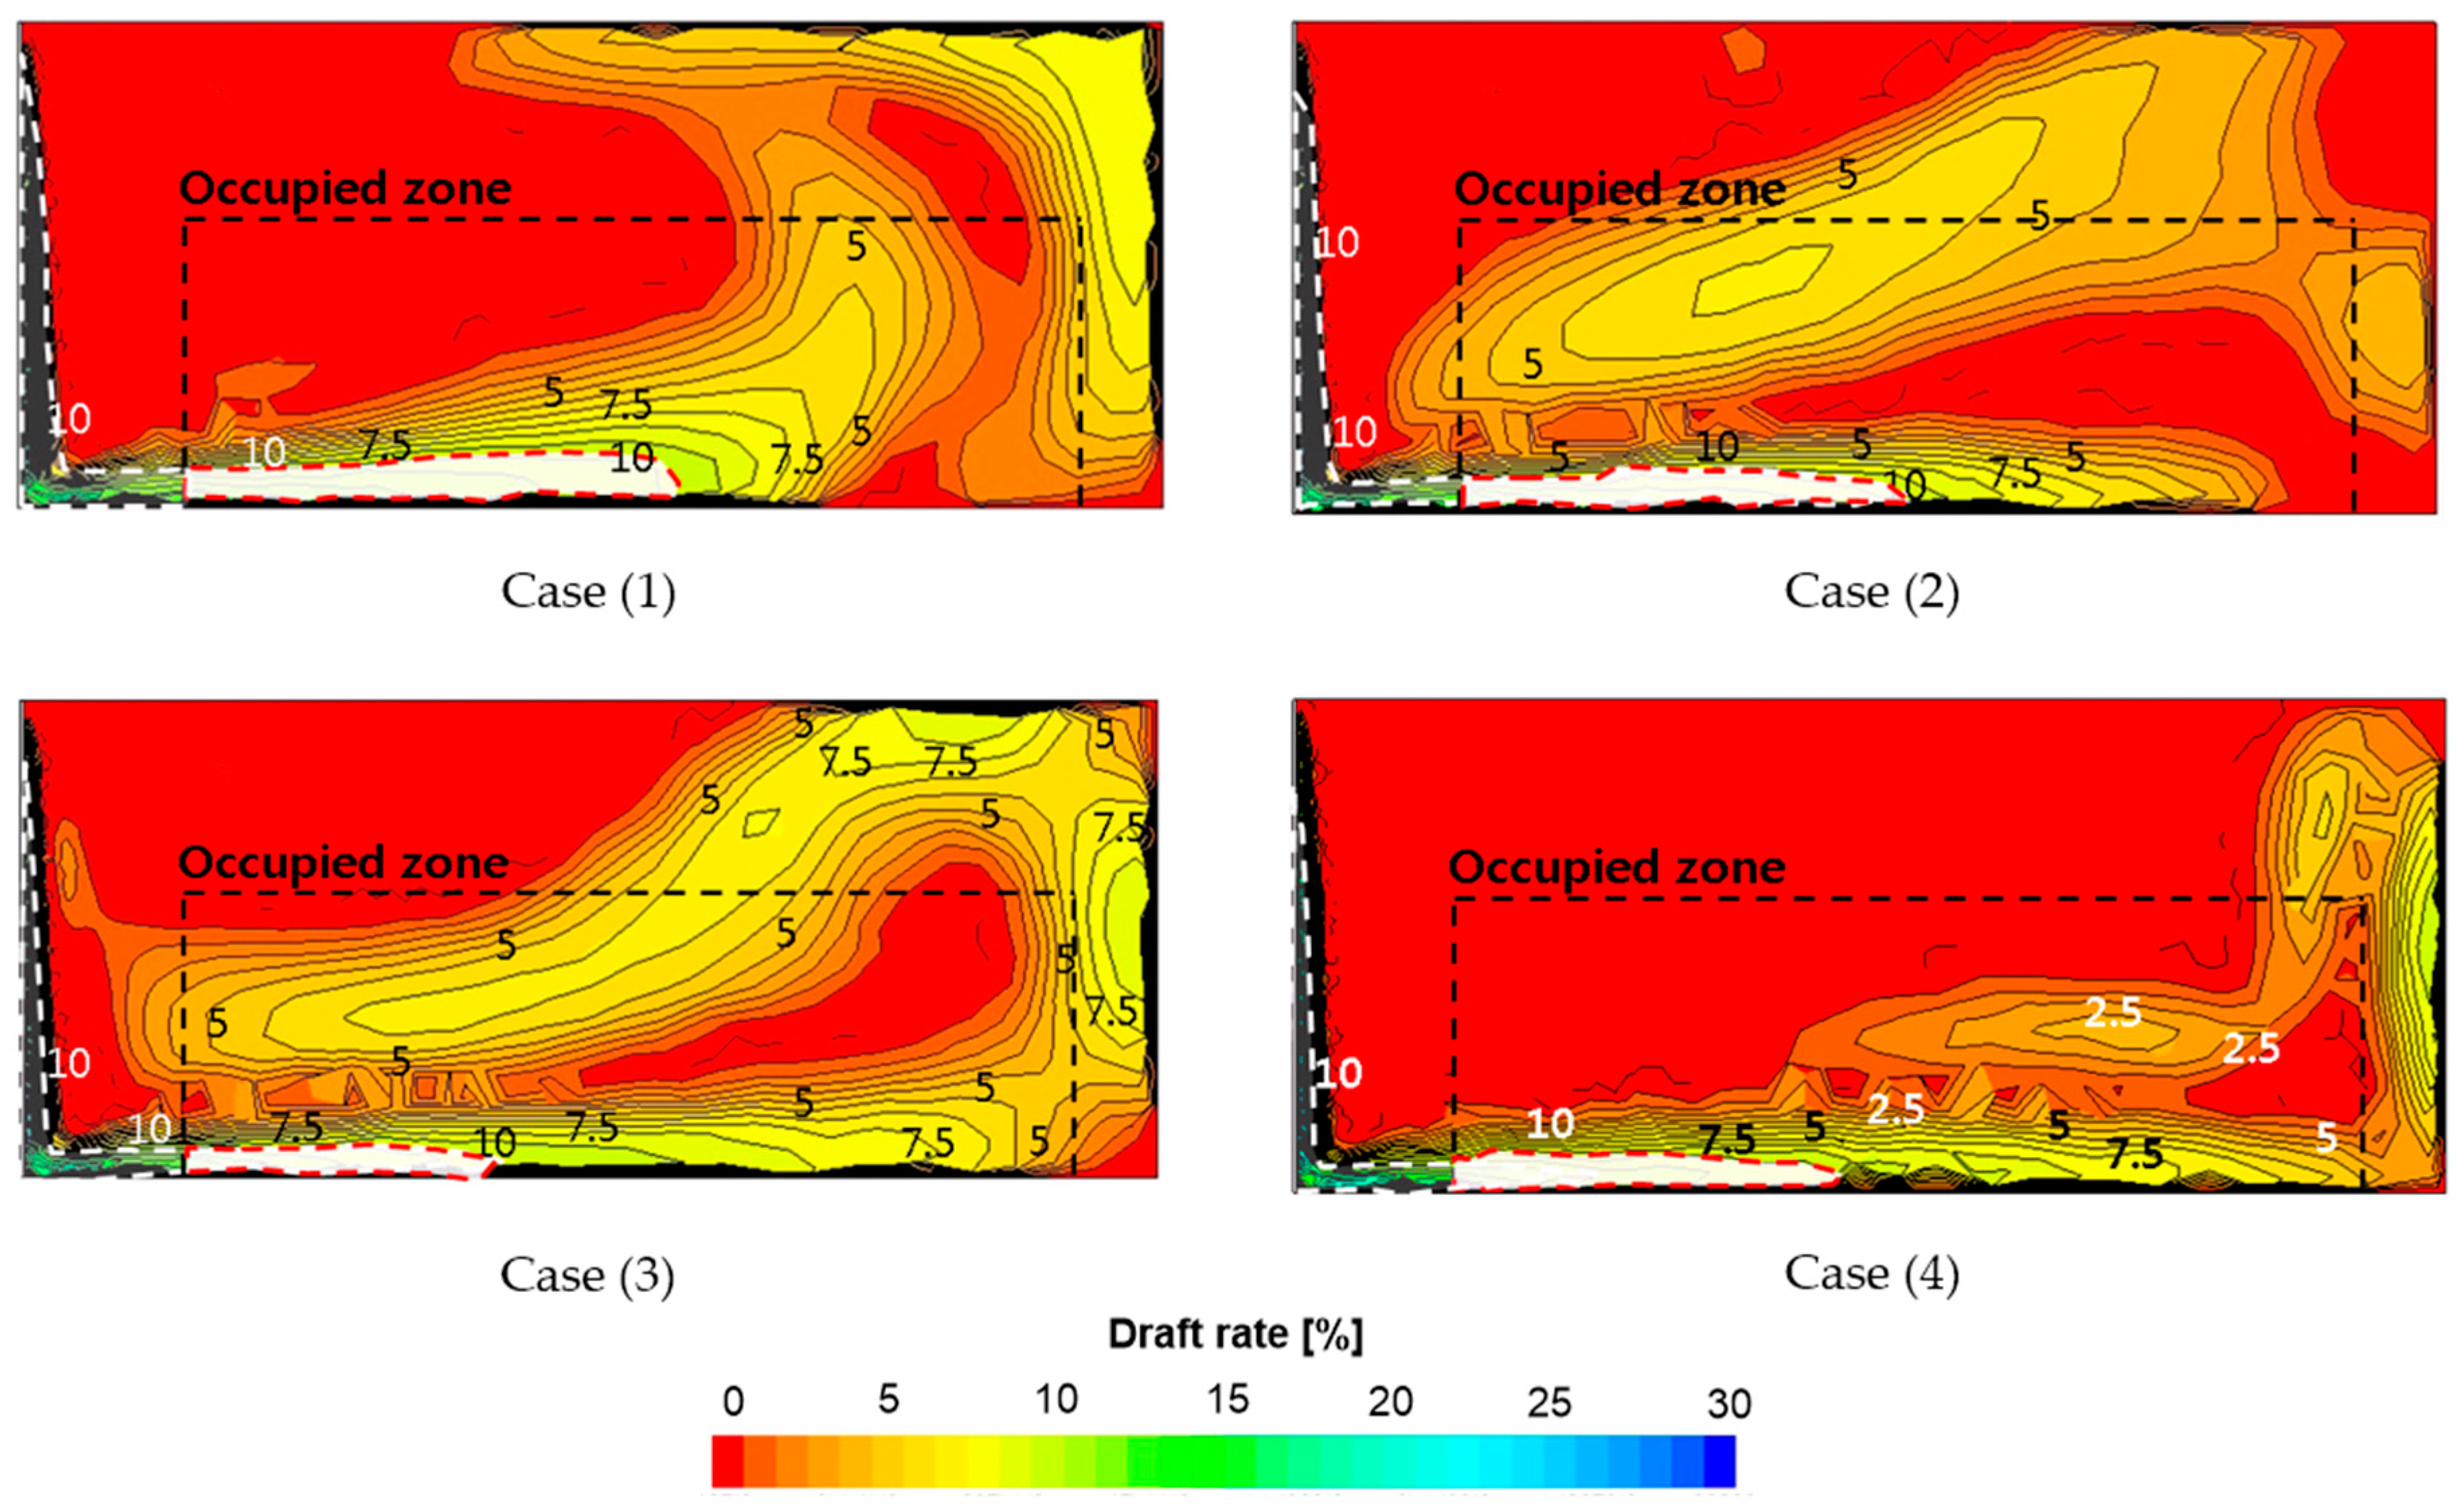
5.1.3. Predicted Percentage of People Dissatisfied Due to Downdraft
5.2. Effect of U-Value and Window Area
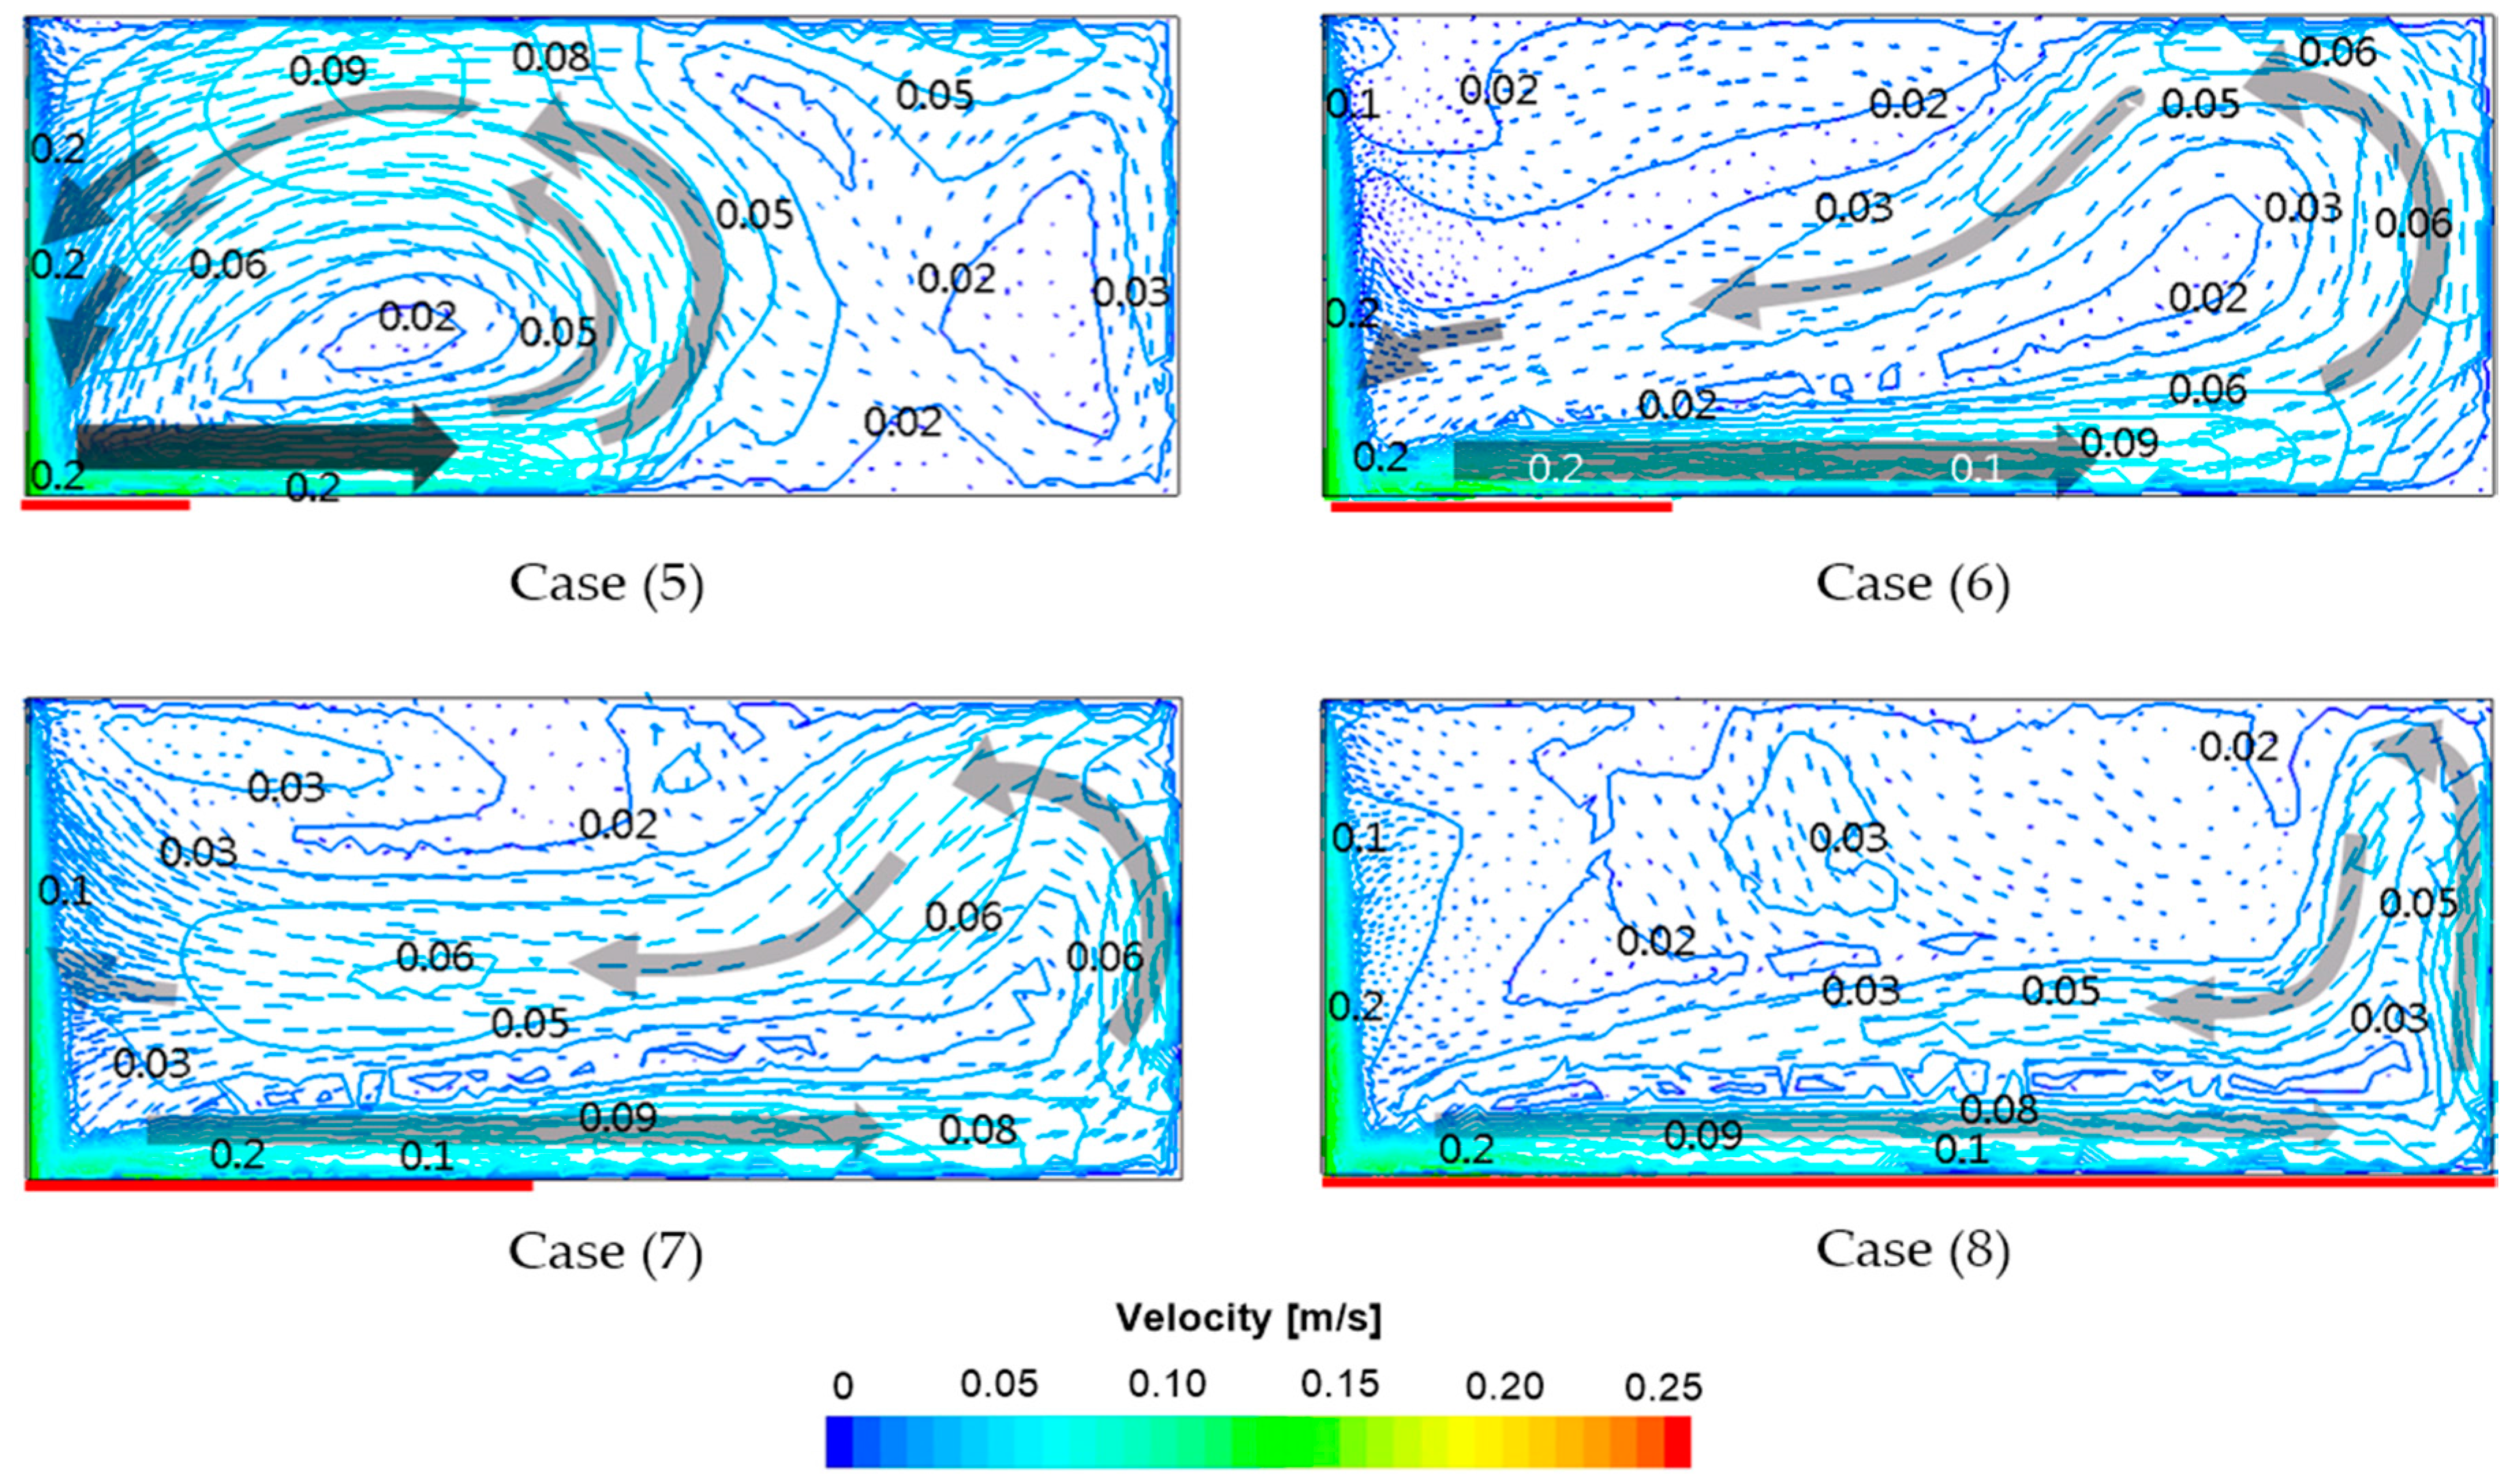
5.2.1. Velocity Profiles
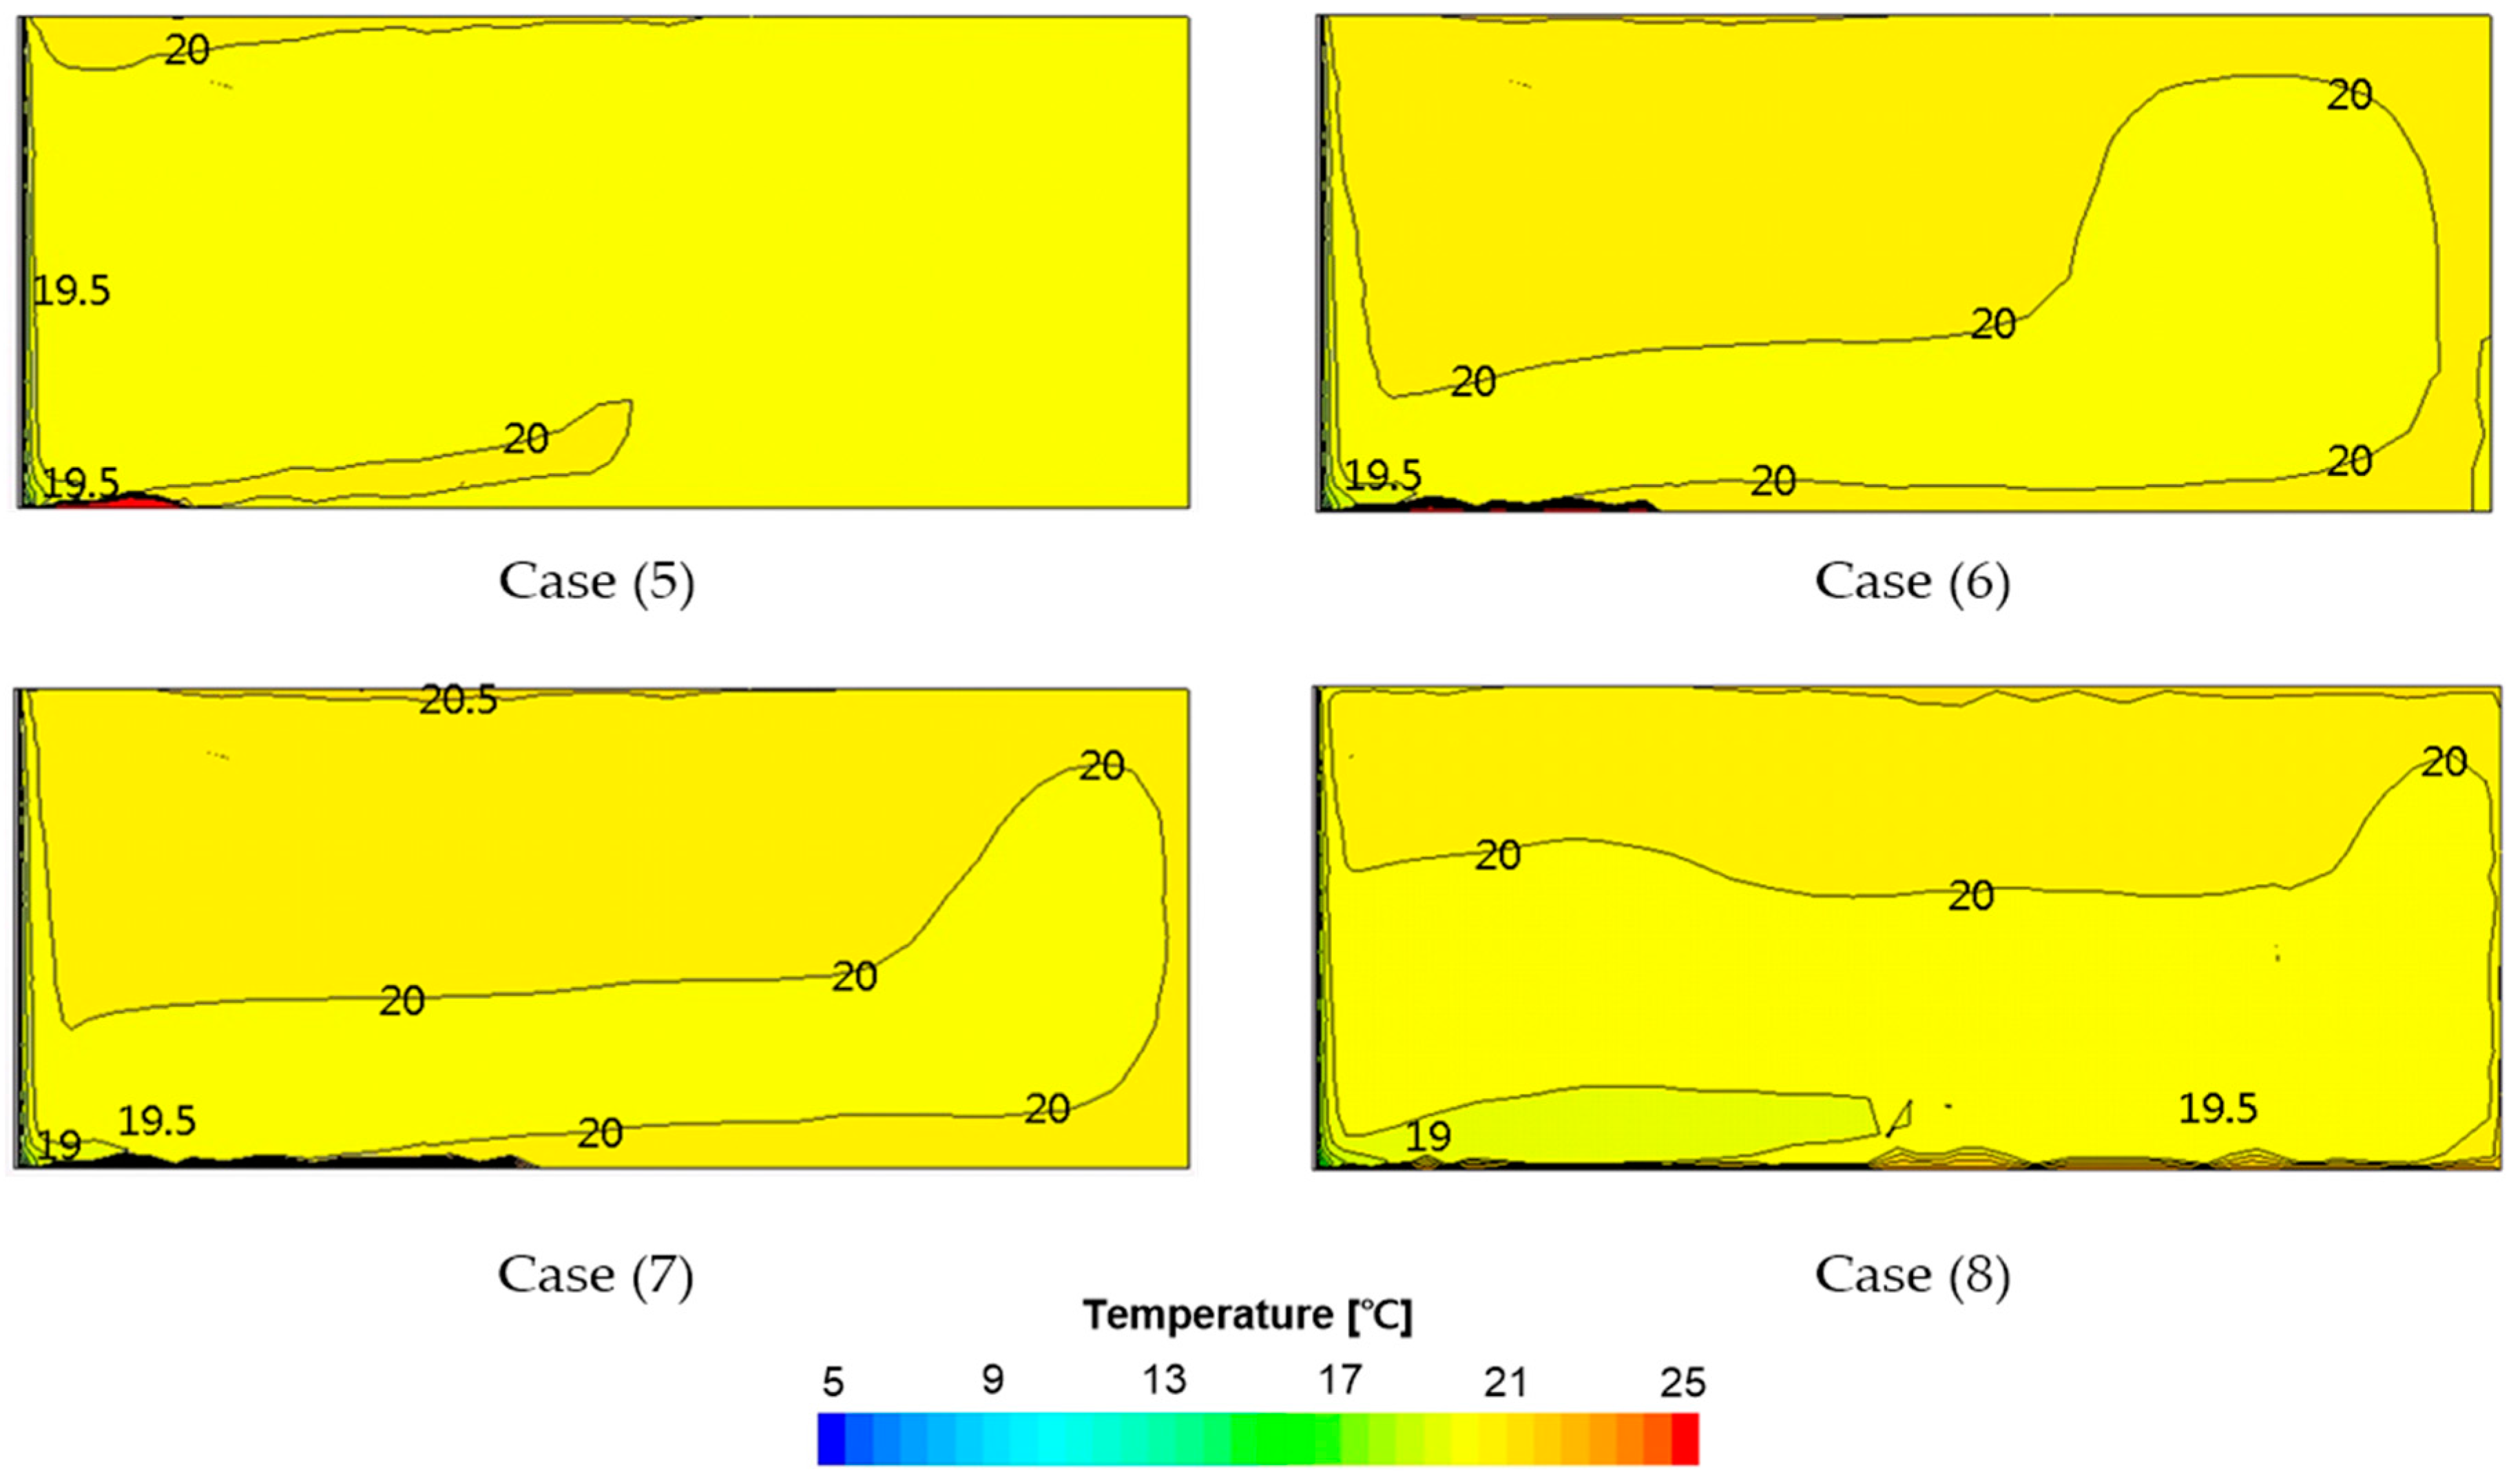
5.2.2. Temperature Distribution
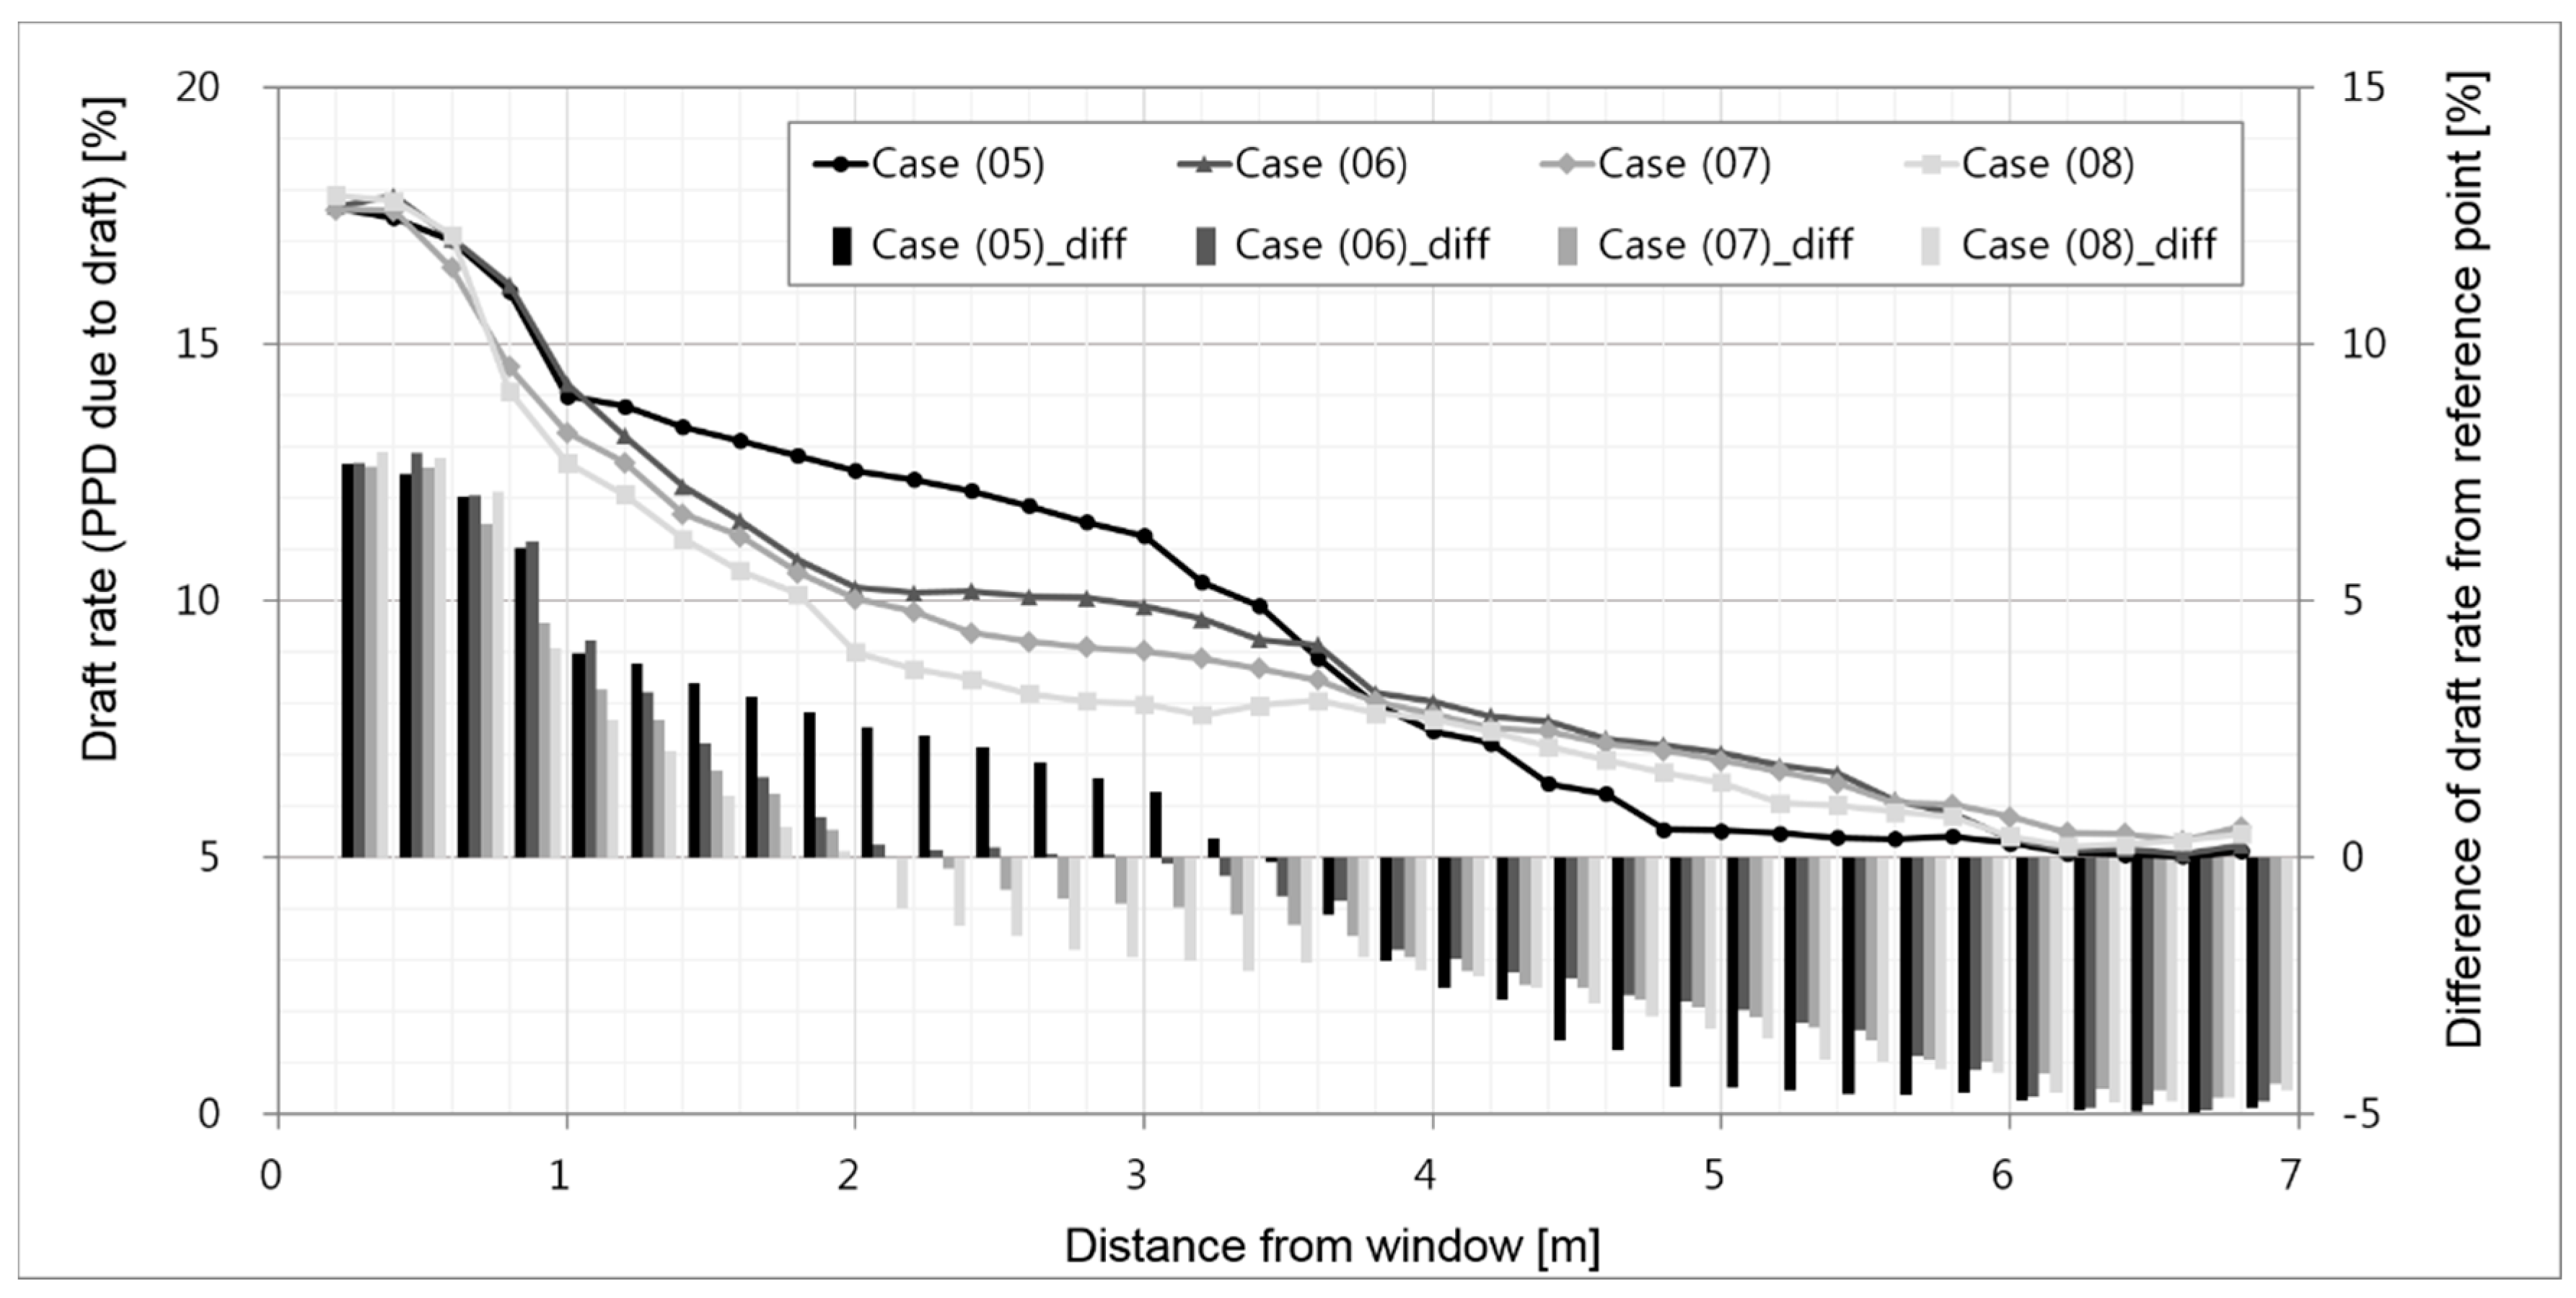
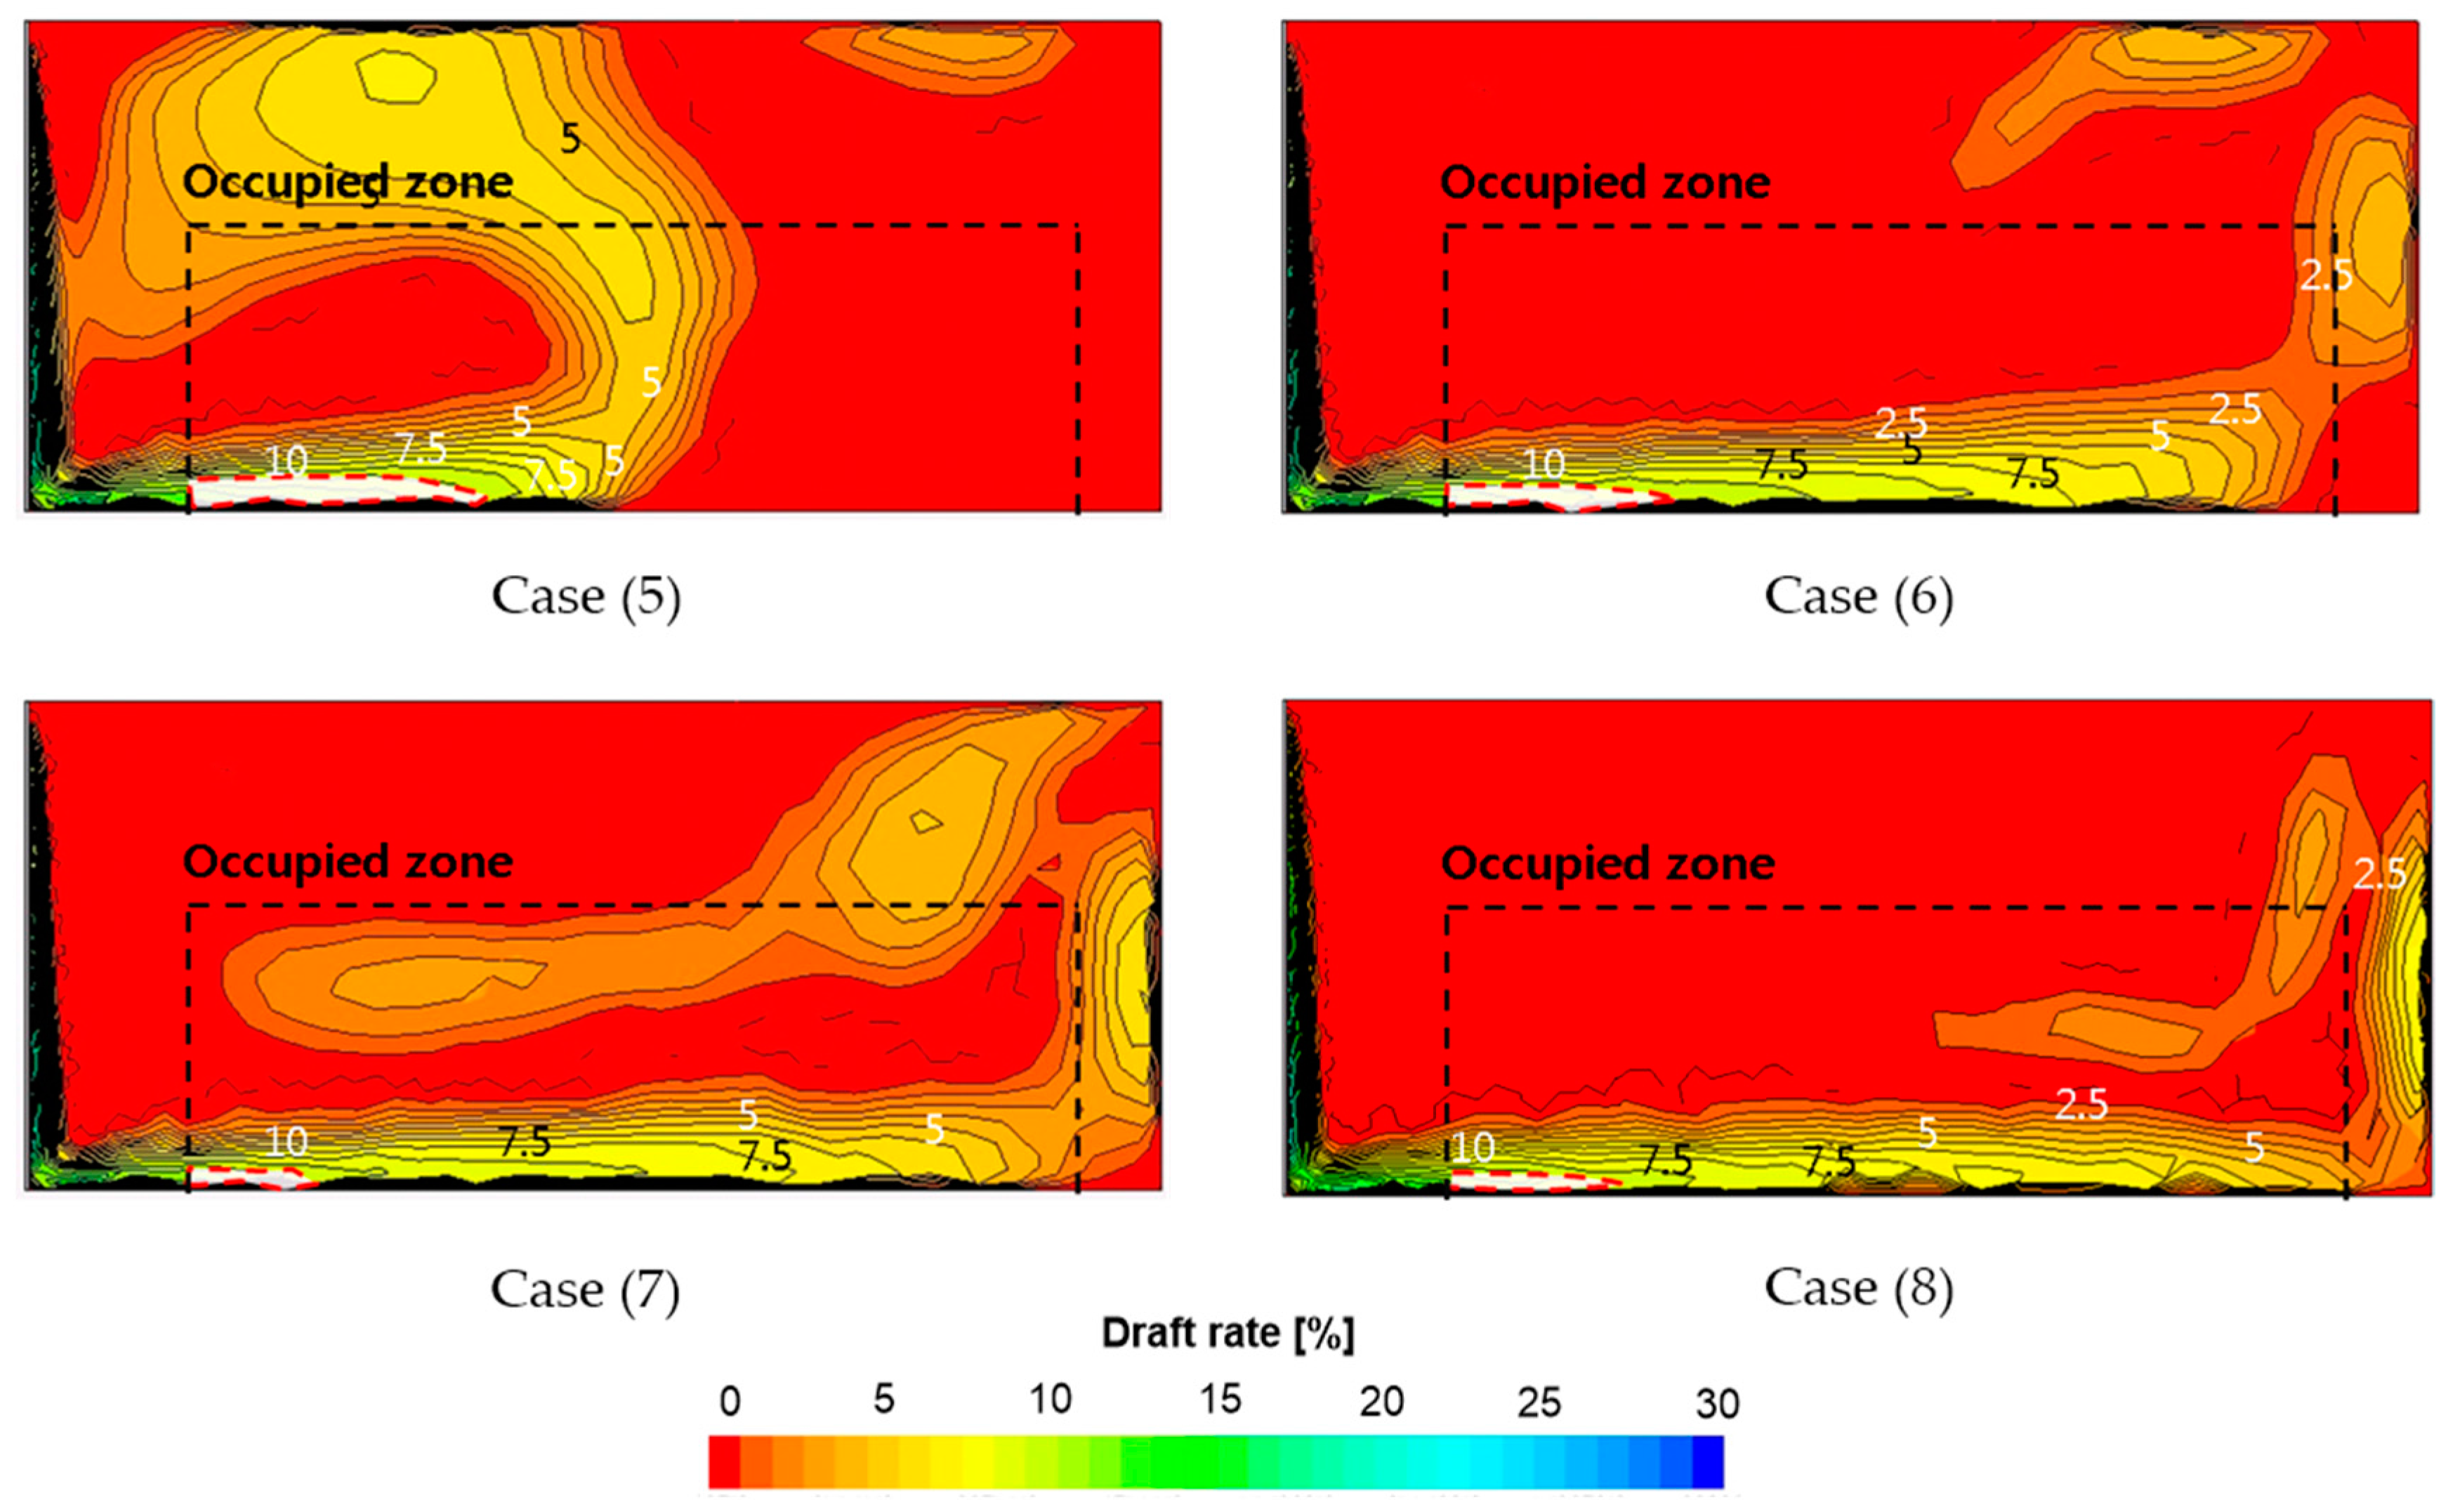
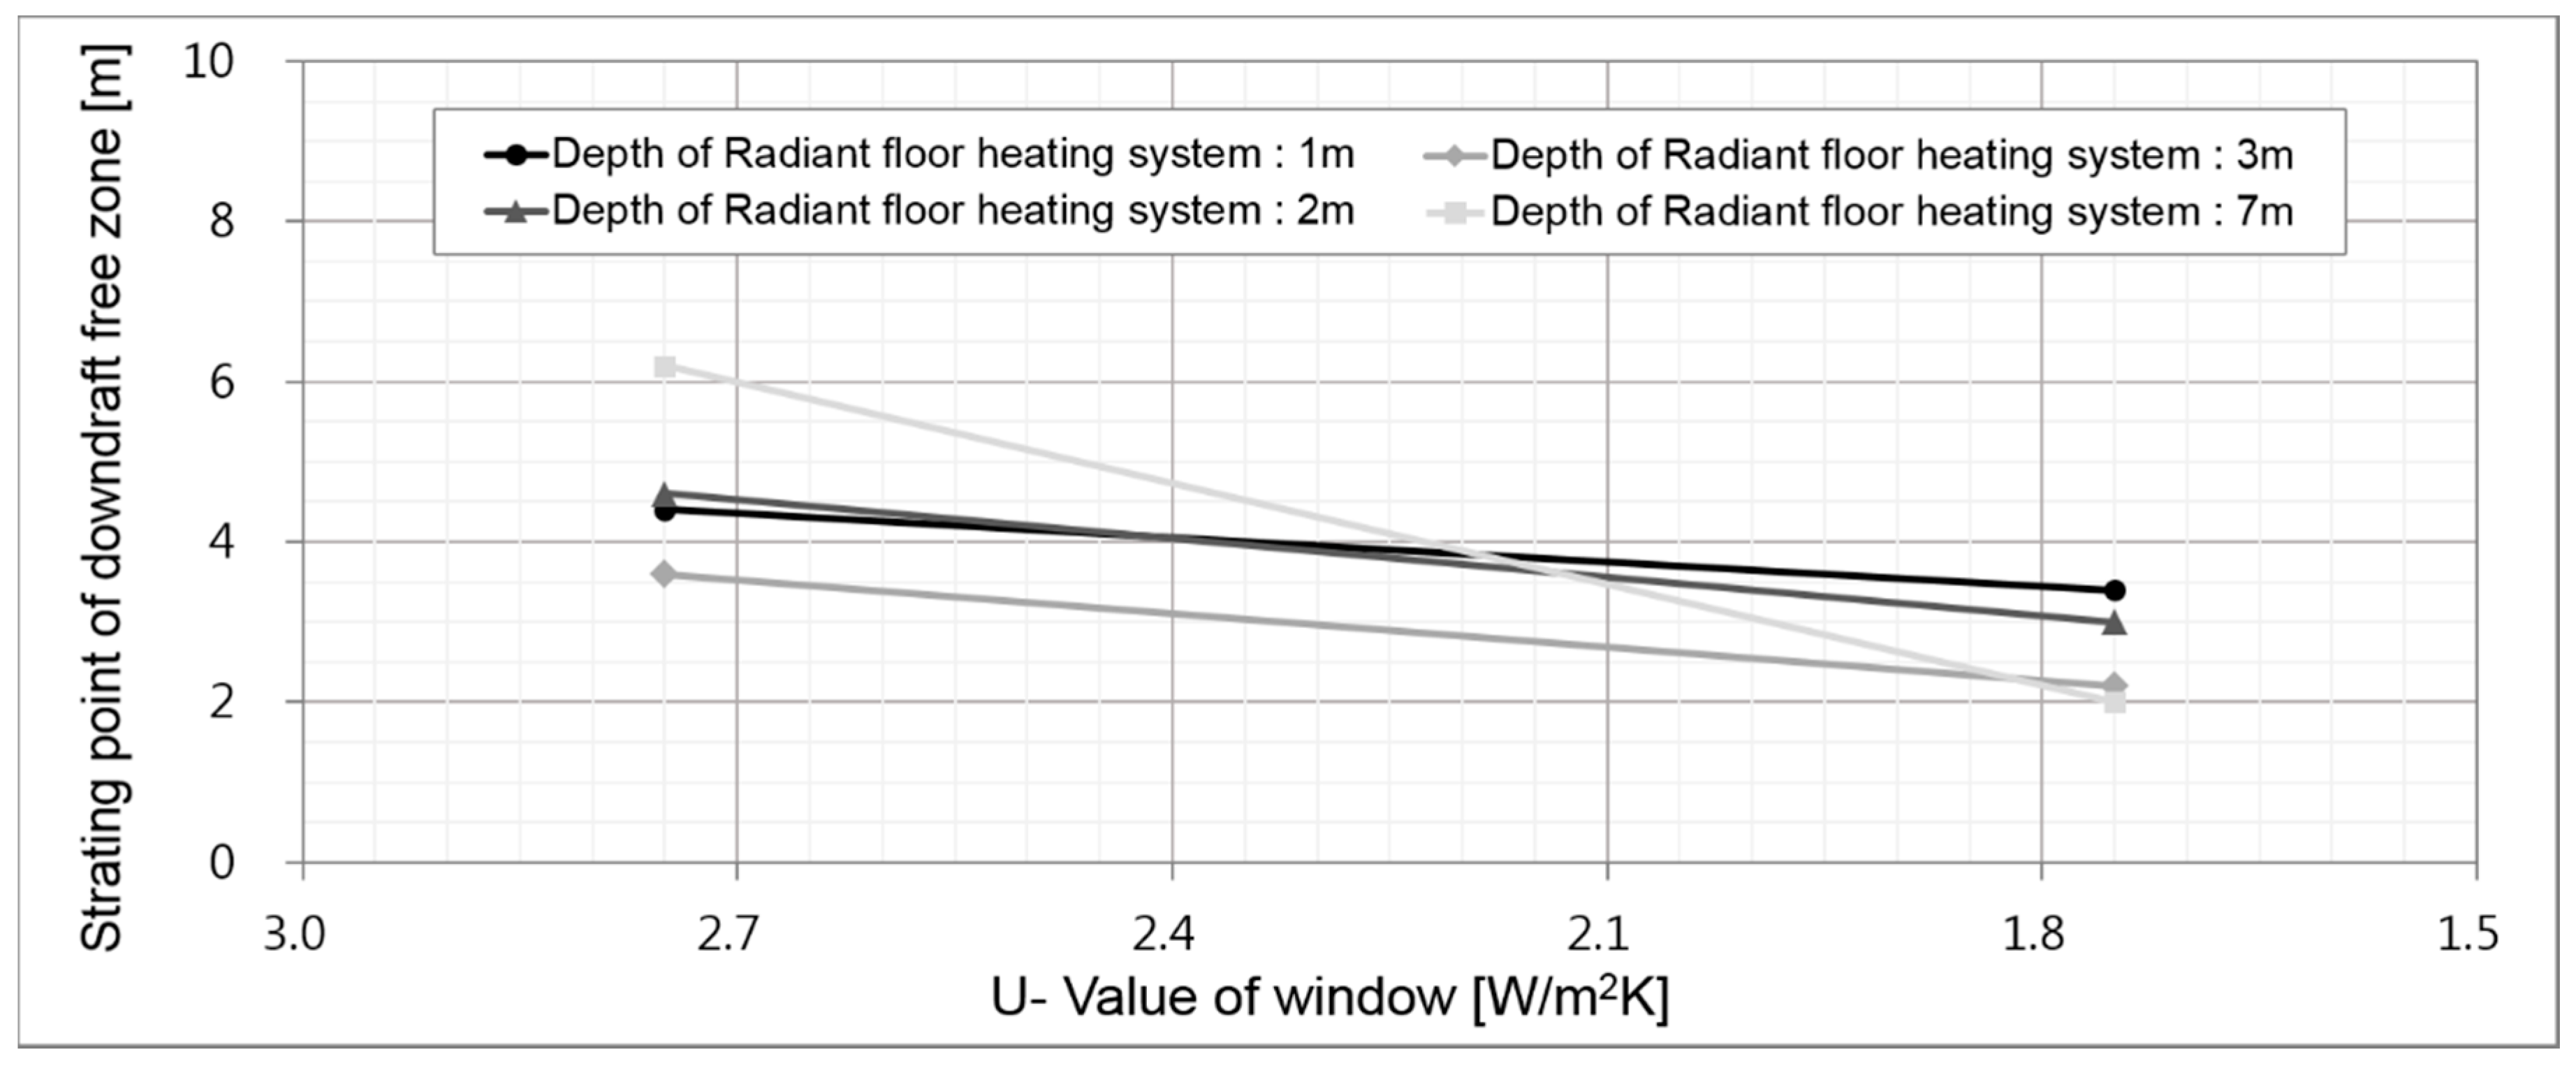
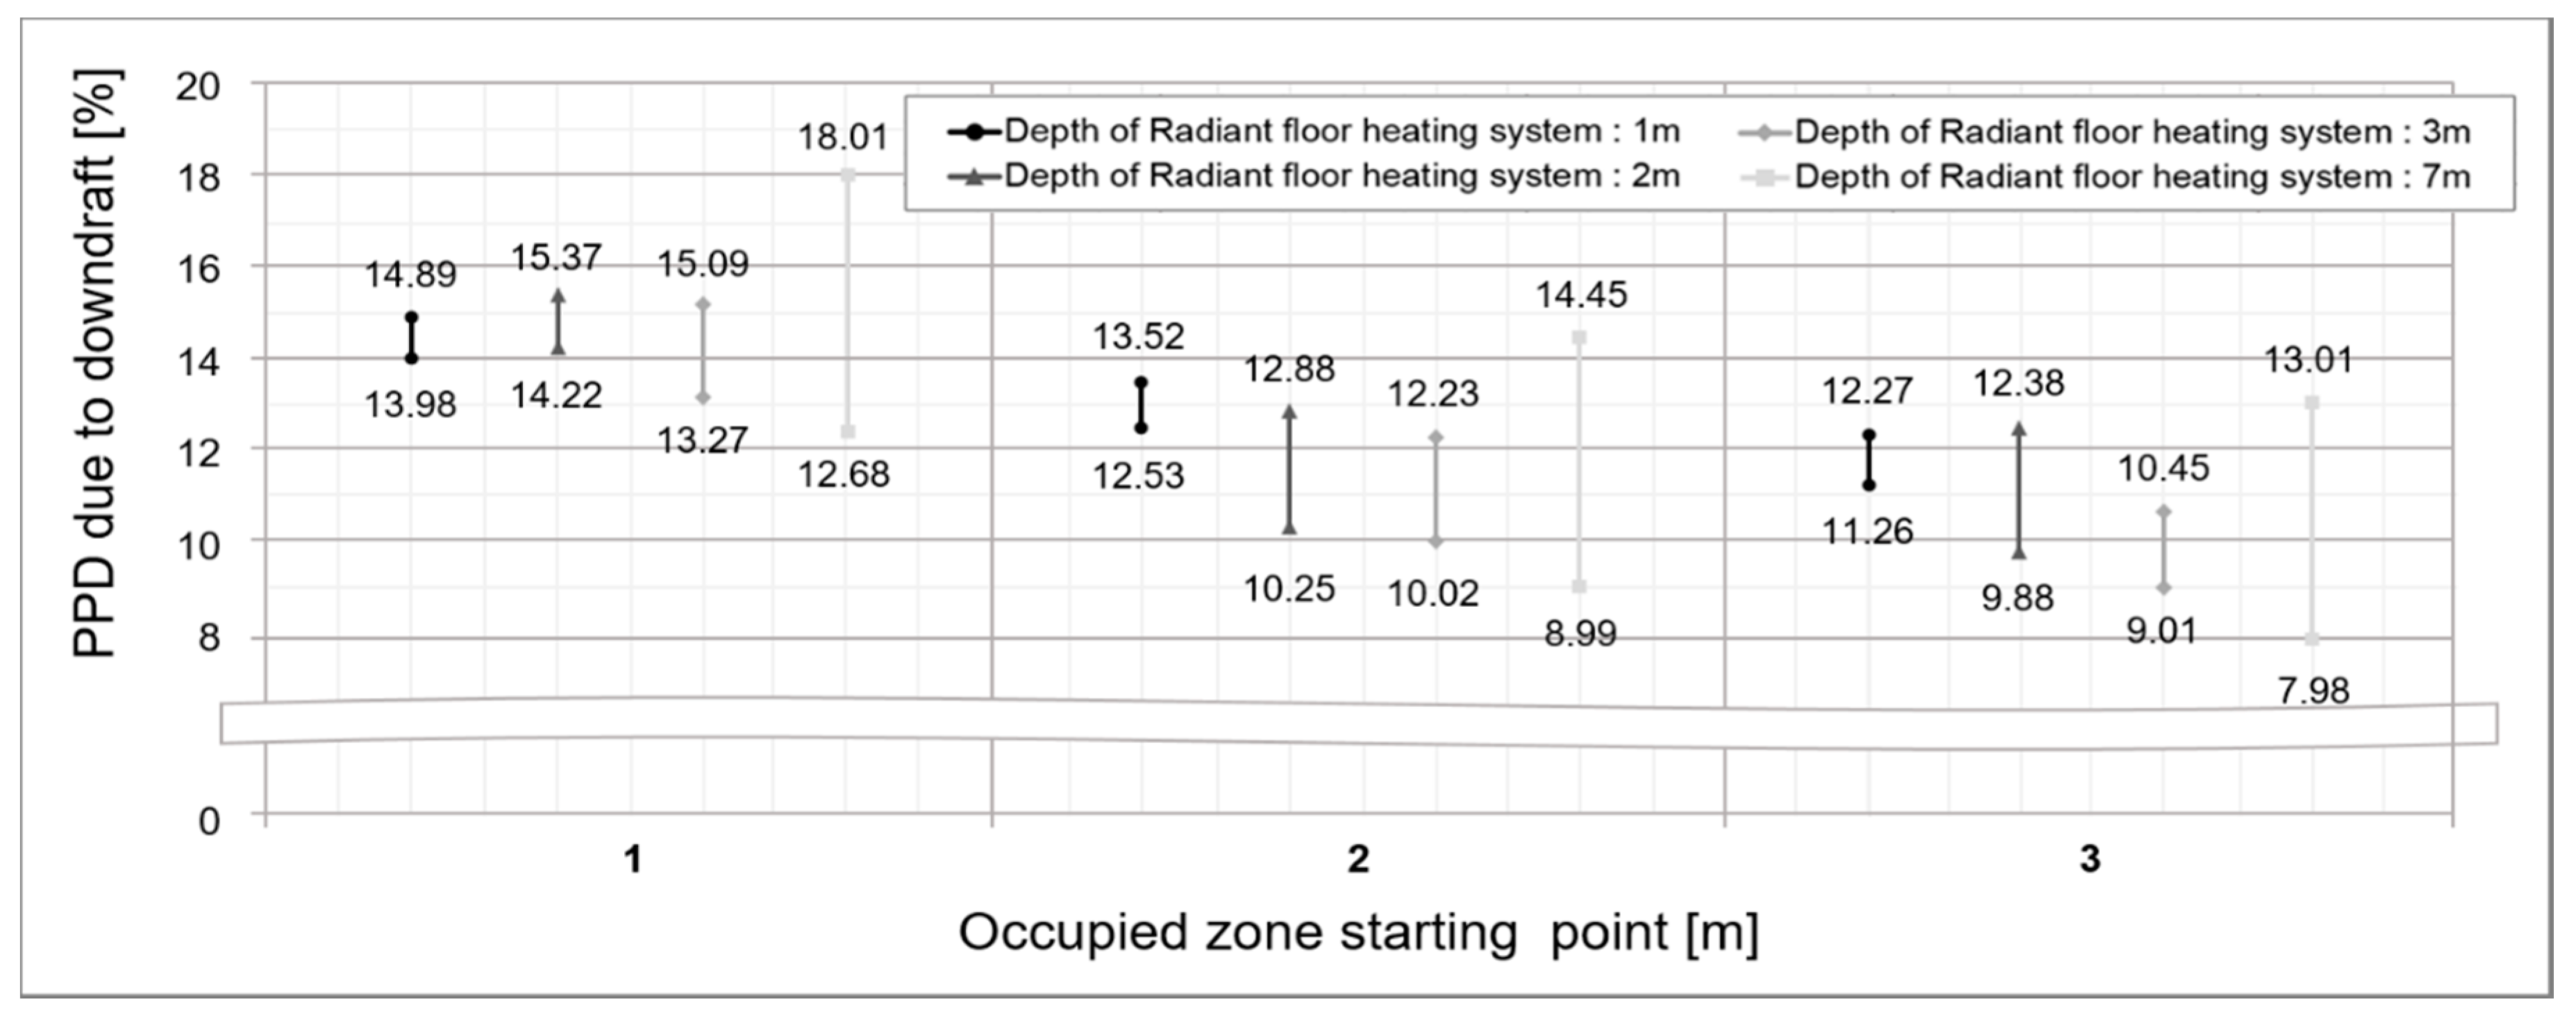
5.2.3. Predicted Percentage of People Dissatisfied Due to Downdraft
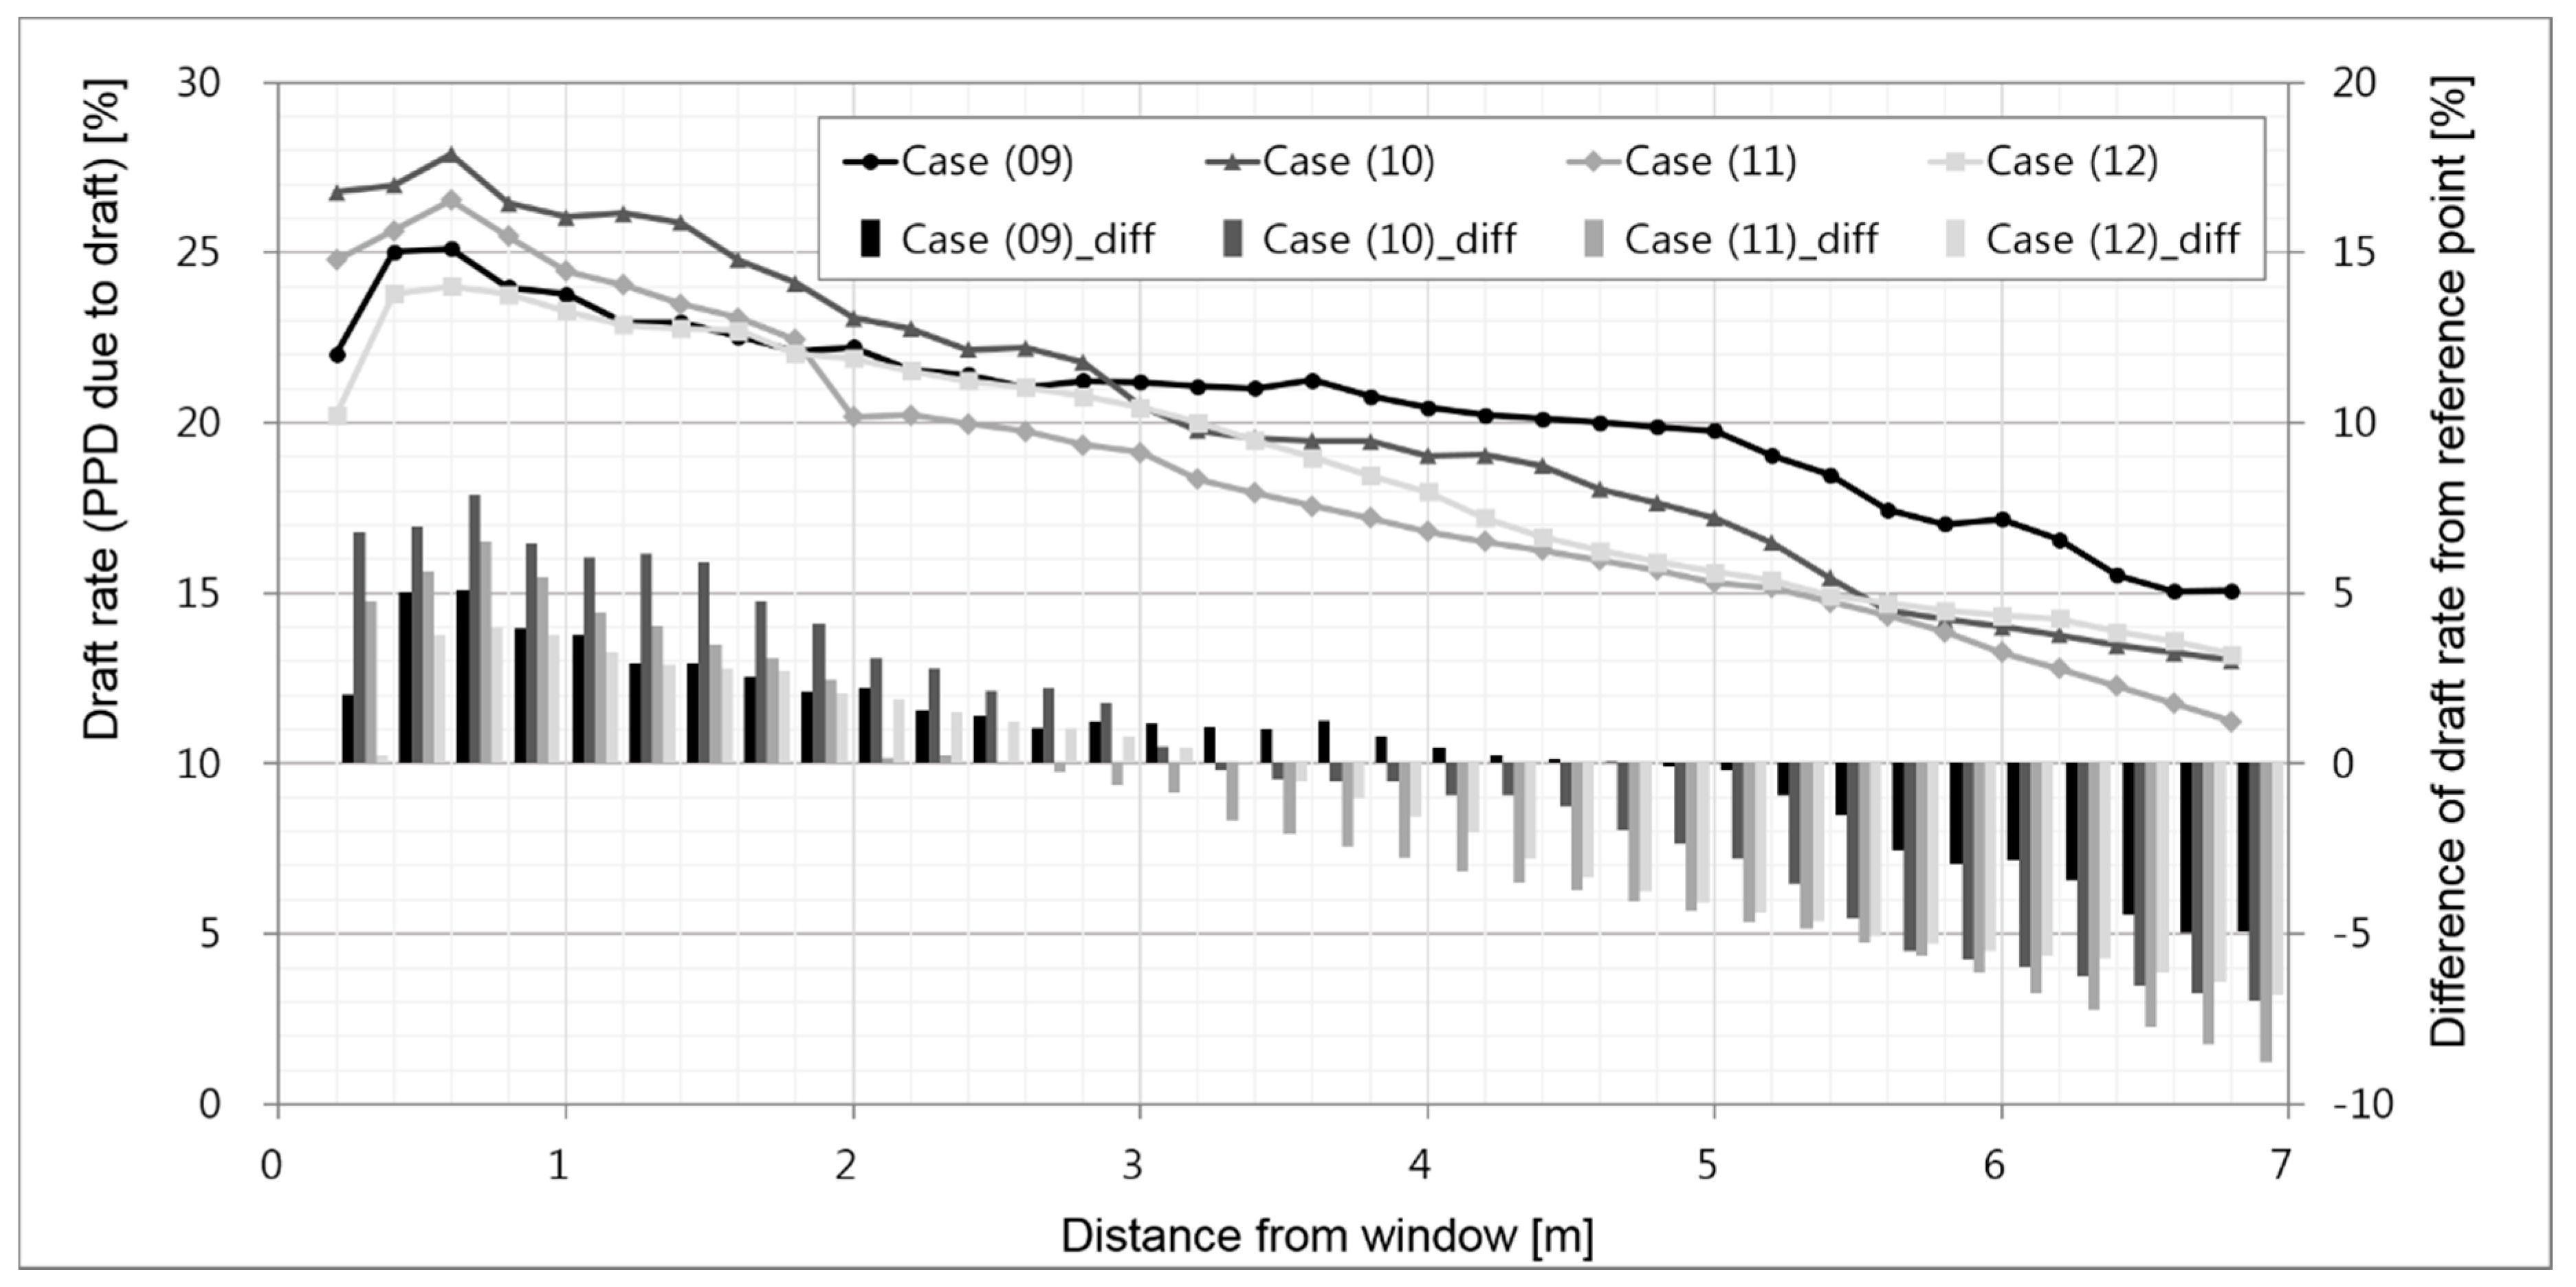
5.3. Effect of Window Height
5.4. RFHS Application for Preventing Downdraft
6. Conclusions
Acknowledgments
Author Contributions
Conflicts of Interest
References
- Rhee, K.N.; Kim, K.W. A 50 year review of basic and applied research in radiant heating and cooling systems for the built environment. Build. Environ. 2015, 91, 166–190. [Google Scholar] [CrossRef]
- Salt, H. Preliminary design considerations for a rockbed/floor space-heating system. Build. Environ. 1985, 20, 221–231. [Google Scholar] [CrossRef]
- American Society of Heating, Refrigerating, and Air Conditioning Engineers (ASHRAE). ASHRAE Handbook—HVAC Systems and Equipment; ASHRAE: Atlanta, GA, USA, 2012. [Google Scholar]
- Heiselberg, P.; Overby, H.; Bjørn, E. Energy-Efficient Measures to Avoid Downdraft from Large Glazed Facades. ASHRAE Trans. 1995, 101, 1127–1135. [Google Scholar]
- Feustel, H.E.; Stetiu, C. Hydronic radiant cooling-preliminary assessment. Energy Build. 1995, 22, 193–205. [Google Scholar] [CrossRef]
- Li, S.; Joe, J.; Hu, J.; Karava, P. System identification and model-predictive control of office buildings with integrated photovoltaic-thermal collectors, radiant floor heating and active thermal storage. Sol. Energy 2015, 113, 139–157. [Google Scholar] [CrossRef]
- Shin, D.U. Control Strategy for the Experiment of Evaluation the Thermal Output of Radiant Floor Heating Panels. Master’s Thesis, Seoul National University, Seoul, Korea, 2010. [Google Scholar]
- Sharda, A.; Kumar, S. Comparative study of simulation and experimentation for the U-value of double-glazed windows with inter-pane blinds. Sci. Technol. Built Environ. 2015, 21, 179–189. [Google Scholar] [CrossRef]
- Gao, T.; Ihara, T.; Grynning, S.; Jelle, B.P.; Lien, A.G. Perspective of aerogel glazings in energy efficient buildings. Build. Environ. 2016, 95, 405–413. [Google Scholar] [CrossRef]
- Park, S.H.; Chung, W.J.; Yeo, M.S.; Kim, K.W. Evaluation of the thermal performance of a Thermally Activated Building System (TABS) according to the thermal load in a residential building. Energy Build. 2014, 73, 193–205. [Google Scholar] [CrossRef]
- Chung, W.J.; Park, S.H.; Yeo, M.S.; Kim, K.W. Control of Thermally Activated Building System Considering Zone Load Characteristics. Sustainability 2017, 9, 586. [Google Scholar] [CrossRef]
- Fanger, P.O. Air turbulence and sensation of draught. Energy Build. 1988, 12, 21–39. [Google Scholar] [CrossRef]
- Atlanta, American Society of Heating, Refrigerating, and Air-Conditioning Engineers (ANSI/ASHRAE). ANSI/ASHRAE Standard: Thermal Environmental Conditions for Human Occupancy; ANSI/ASHRAE: Atlanta, GA, USA, 2013; p. 55. [Google Scholar]
- International Organization for Standardisation (ISO). ISO 7730: Ergonomics of the Thermal Environment-Analytical Determination and Interpretation of Thermal Comfort Using Calculation of the PMV and PPD Indices and Local Thermal Comfort Criteria; ISO: Geneva, Switzerland, 2013. [Google Scholar]
- Heiselberg, P. Draught risk from cold vertical surfaces. Build. Environ. 1994, 29, 297–301. [Google Scholar] [CrossRef]
- Lyons, P.; Arasteh, D.; Huizenga, C. Window Performance for Human Thermal Comfort. ASHRAE Trans. 2000, 106, 594–602. [Google Scholar]
- Larsson, U.; Moshfegh, B. Experimental investigation of downdraught from well-insulated windows. Build. Environ. 2002, 37, 1073–1082. [Google Scholar] [CrossRef]
- Zukowski, M. A new formula for determining a minimum recommended value of inlet air velocity from UFAD system to prevent occupants from draught risk. Build. Environ. 2007, 42, 171–179. [Google Scholar] [CrossRef]
- Olesen, B.W. Vereinfachte methode zur vorausberechnung des thermischen raumklimas. Heiz. Luftung Klima Haustech. 1995, 46, 219–225. [Google Scholar]
- Manz, H.; Frank, T. Analysis of thermal comfort near cold vertical surfaces by means of computational fluid dynamics. Indoor Built Environ. 2004, 13, 233–242. [Google Scholar] [CrossRef]
- Ge, H.; Fazio, P. Experimental investigation of cold draft induced by two different types of glazing panels in metal curtain walls. Build. Environ. 2004, 39, 115–125. [Google Scholar] [CrossRef]
- Schellen, L.; Timmers, S.; Loomans, M.G.L.C.; Nelissen, E.S.M.; Hensen, J.L.M.; van Marken Lichtenbelt, W.D. Downdraught assessment during design: Experimental and numerical evaluation of a rule of thumb. Build. Environ. 2012, 57, 290–301. [Google Scholar] [CrossRef]
- Jurelionis, A.; Isevičius, E. CFD predictions of indoor air movement induced by cold window surfaces. J. Civ. Eng. Manag. 2008, 14, 29–38. [Google Scholar] [CrossRef]
- Myhren, J.A.; Holmberg, S. Flow patterns and thermal comfort in a room with panel, floor and wall heating. Energy Build. 2008, 40, 524–536. [Google Scholar] [CrossRef]
- Mustakallio, P.; Kosonen, R.; Korinkova, A. Full-scale test and CFD-simulation of radiant panel integrated with exposed chilled beam in heating mode. Build. Simul. 2017, 10, 75–85. [Google Scholar] [CrossRef]
- Shia-hui, P.; Peterson, F. Convection from a cold window with simulated floor heating by means of transiently heated flat unit. Energy Build. 1995, 23, 95–103. [Google Scholar] [CrossRef]
- Kulkarni, R. Natural Convection in Enclosures with Localised Heating and Cooling. Ph.D. Thesis, Department of Mechanical Engineering, University of Wollongong, Wollongong, Australia, 1998. [Google Scholar]
- Eckert, E.R.G.; Jackson, T.W. Analysis of Turbulent Free-Convection Boundary Layer on Flat Plate; National Advisory Committee for Aeronautics: Cleveland, OH, USA, 1951; pp. 255–261.
- Star-CCM+. Tutorial Guide; Siemens Inc.: München, Germany, 2017. [Google Scholar]
- International Organization for Standard (ISO). ISO 11855-2:2012(E) Building Environment Design e Design, Dimensioning, Installation and Control of Embedded Radiant Heating and Cooling Systems. Part 2: Determination of the Design Heating and Cooling Capacity; ISO: Geneve, Switzerland, 2012. [Google Scholar]
- CEN; BS EN 1264-2. Water Based Surface Embedded Heating and Cooling Systems. Floor Heating: Prove Methods for the Determination of the Thermal Output Using Calculation and Test Methods; EU: Brussels, Belgium, 2009. [Google Scholar]
- Wang, Z.; Zhang, H.; Arens, E.; Lehrer, D.; Huizenga, C.; Yu, T.; Hoffmann, S. Modeling thermal comfort with radiant floors and ceilings. In Proceedings of the 4th International Building Physics Conference, Istanbul, Turkey, 15–18 June 2009. [Google Scholar]
- European Committee for Electrotechnical Standardization (CENELEC). Temperatures of Hot Surfaces Likely to Be Touched; CENELEC Guide 29; CENELEC: Brussels, Belgium, 2007. [Google Scholar]


| Class | Draft Rate | Description |
|---|---|---|
| A | <10 | It is desired to adhere to higher than typical comfort standards |
| B | <20 | Typical applications and should be used when other information is not available |
| C | <25 | It is desired to relax the typical comfort standards |
| Classification | Description | |
|---|---|---|
| Target space area | 6 (m) × 7 (m) × 3 (m) (w × d × h) | |
| Temperature conditions | Outdoor: −11.3 °C/Indoor: 20 °C | |
| Window conditions | Type | general dual-pane glass/Low-E dual-pane glass |
| U-value | 2.75 W/m2·K/1.75 W/m2·K | |
| Radiant floor heating system conditions | Heating area | 1.0 m, 3.0 m, 7.0 m distance from Window |
| Surface Temp. | According to a heating area (Perimeter zone: Maximum 41 °C; Interior zone: Maximum 29 °C) | |
| Wall condition | Adiabatic | |
| Physics Model | Description | |
|---|---|---|
| Physics | Time | Steady state |
| Turbulence model | K-ε Turbulence | |
| Radiation | Surface-to-surface Radiation | |
| Equation of state | Ideal Gas (Including Boussinesq Model) | |
| Parameters Of Radiant Floor Heating System | ||||||
| Case | Radiant Floor Heating System | Window | ||||
| Thermal Output | Heating Area (m2) | Surface Temp. (°C) | U-Value (W/m2·K) | Height (m) | ||
| (W/m2) | (W) | |||||
| (1) | 258.22 | 1549.35 | 6 (1) | 41.0 | 2.75 | 3.0 |
| (2) | 129.11 | 12 (2) | 31.3 | |||
| (3) | 86.07 | 18 (3) | 27.8 | |||
| (4) | 36.88 | 42 (7) | 23.6 | |||
| Parameters of Radiant Floor Heating System and Window | ||||||
| Case | Radiant Floor Heating System | Window | ||||
| Thermal Output | Heating Area (m2) | Surface Temp. (°C) | U-Value (W/m2·K) | Height (m) | ||
| (W/m2) | (W) | |||||
| (5) | 164.32 | 985.95 | 6 (1) | 34.1 | 1.75 | 3.0 |
| (6) | 82.16 | 12 (2) | 27.5 | |||
| (7) | 54.77 | 18 (3) | 25.2 | |||
| (8) | 23.47 | 42 (7) | 22.4 | |||
| (9) | 258.22 | 3098.70 | 12 (2) | 41.0 | 2.75 | 6.0 |
| (10) | 73.77 | 42 (7) | 26.7 | |||
| (11) | 164.32 | 1971.90 | 12 (2) | 34.1 | 1.75 | |
| (12) | 46.95 | 42 (7) | 24.5 | |||
| Classification | Heiselberg’s Experiment | This Study’s Simulation |
|---|---|---|
| Indoor area | 6 (m) × 7 (m) × 3 (m) (w × d × h) | 6 (m) × 7 (m) × 3 (m) (w × d × h) |
| Window surface temp. | 10~16 °C | 10~12 °C (Outdoor : −11.3 °C/U-value: 2.75 W/m2·K) |
| Room temp. | 18~20 °C | 18~20 °C |
© 2017 by the authors. Licensee MDPI, Basel, Switzerland. This article is an open access article distributed under the terms and conditions of the Creative Commons Attribution (CC BY) license (http://creativecommons.org/licenses/by/4.0/).
Share and Cite
Joe, G.; Kim, D.; Park, S.; Park, S.; Yeo, M.; Kim, K. Downdraft Assessment of Glass Curtain Wall Buildings with a Radiant Floor Heating System. Appl. Sci. 2017, 7, 1075. https://doi.org/10.3390/app7101075
Joe G, Kim D, Park S, Park S, Yeo M, Kim K. Downdraft Assessment of Glass Curtain Wall Buildings with a Radiant Floor Heating System. Applied Sciences. 2017; 7(10):1075. https://doi.org/10.3390/app7101075
Chicago/Turabian StyleJoe, Goosang, Dongwoo Kim, Sanghoon Park, Sojeong Park, Myoungsouk Yeo, and Kwangwoo Kim. 2017. "Downdraft Assessment of Glass Curtain Wall Buildings with a Radiant Floor Heating System" Applied Sciences 7, no. 10: 1075. https://doi.org/10.3390/app7101075
APA StyleJoe, G., Kim, D., Park, S., Park, S., Yeo, M., & Kim, K. (2017). Downdraft Assessment of Glass Curtain Wall Buildings with a Radiant Floor Heating System. Applied Sciences, 7(10), 1075. https://doi.org/10.3390/app7101075