Article

Modeling Coloration of a Radiochromic Film with Molecular Dynamics-Coupled Finite Element Method

1
Department of Physics, City University of Hong Kong, Tat Chee Avenue, Kowloon Tong, Hong Kong, China
2
Faculty of Science, University of Kragujevac, Kragujevac 34000, Serbia
*
Author to whom correspondence should be addressed.
Appl. Sci. 2017, 7(10), 1031; https://doi.org/10.3390/app7101031
Submission received: 13 September 2017 / Revised: 28 September 2017 / Accepted: 1 October 2017 / Published: 7 October 2017
(This article belongs to the Special Issue Radiation Effects of Materials with Laser, Ion Beam and Rays)

Abstract

:
Radiochromic films change color upon exposures to radiation doses as a result of solid-state polymerization (SSP). Commercially available radiochromic films are primarily designed for, and have become widely used in, clinical X-ray dosimetry. However, many intriguing properties of radiochromic films are not yet fully understood. The present work aimed at developing a theoretical model at both atomic and macroscopic scales to provide a platform for future works to understand these intriguing properties. Despite the fact that radiochromic films were primarily designed for clinical X-ray dosimetry, dose-response curves for the Gafchromic EBT3 film obtained for ultraviolet (UV) radiation were employed to develop our model in order to avoid complications of ionization, non-uniform energy deposition, as well as dispersed doses caused by secondary electrons set in motion by the indirectly ionizing X-ray photons, which might introduce added uncertainties to the model and overshadow the basic SSP processes. The active layer in the EBT3 film consisted of diacetylene (DA) pentacosa-10,12-diynoate monomers, which were modelled using molecular dynamics (MD). The degrees of SSP in the atomic scale upon different UV exposures were obtained to determine the absorption coefficients of the active layer, which were then input into the finite element method (FEM). The classical steady-state Helmholtz equation was engaged to model the reflection from the active layer using the FEM technique. The multifrontal massively parallel sparse direct solver (MUMPS) was employed to solve the present numerical problem. Very good agreement between experimentally and theoretically obtained coloration in terms of net reflective optical density was achieved for different UV exposures. In particular, for UV exposures larger than ~40 J/cm2, the reflected light intensity decreased at a lower rate when compared to other UV exposure values, which was explained by the densely cross-linked structure under near-complete polymerization, and thus the lower efficiency for further bond formation between DA monomer strands.

1. Introduction

Radiochromic films change colors upon exposures to radiation doses as a result of solid-state polymerization (SSP) [1], where energy is transferred to the receptive part of the monomers [2]. Commercially available radiochromic films are primarily designed for, and have become widely used in, clinical X-ray dosimetry [2]. Application of radiochromic films for clinical X-ray dosimetry has, in essence, relied on dose-response curves (response in terms of film coloration) obtained through calibration. However, many intriguing properties of radiochromic films are not yet fully understood, including their responses to fluorescent light [3,4] and ultraviolet (UV) radiation [5,6,7,8]; the energy dependence of their responses [9,10,11,12,13]; the effects of polarization and scanning orientation [14,15,16]; and the effects of mechanical pressure [17] and auto-development [18], etc. In order to understand these intriguing properties, development of a theoretical model at both atomic and macroscopic scales is pertinent. To the best of our knowledge, there are at present no theoretical models in the literature that can reproduce experimentally obtained dose-response curves of radiochromic films. The present work was devoted to developing such a model. Despite the fact that radiochromic films were primarily designed for clinical X-ray dosimetry and that most dose-response curves were understandably obtained for X-rays, development of a theoretical model in the atomic scale using X-ray data would involve added complications of ionization, non-uniform energy deposition, as well as dispersed doses [19] caused by secondary electrons set in motion by the indirectly ionizing X-ray photons. Such complications will inevitably introduce added uncertainties to the model and might overshadow the basic SSP processes. Fortunately, dose-response curves for the Gafchromic EBT3 film have also been obtained for UV radiation [8], for which complications caused by secondary electrons described above are insignificant. These data would provide reference information for the development of our model. A future paper will cover further investigations that add processes involving secondary electrons created by X-ray photons into the model developed here.
The present task was divided into two parts, namely, (1) the atomic scale model and (2) the macroscopic scale model, in which molecular dynamics (MD) and finite element method (FEM) simulation techniques were coupled. The active layer in the EBT3 film consisted of diacetylene (DA) pentacosa-10,12-diynoate monomers [20] (hereafter referred to as DA monomers), which were modelled using the MD technique. The degrees of SSP in the atomic scale upon different UV exposures were obtained in order to determine the absorption coefficients of the active layer, which were then input into the FEM model. The classical steady-state Helmholtz equation was engaged to model the re-emittance (i.e., reflection) from and transmittance through the active layer using the FEM technique. The multifrontal massively parallel sparse direct solver (MUMPS) [21] was employed to solve the present numerical problem.

2. Materials and Methods

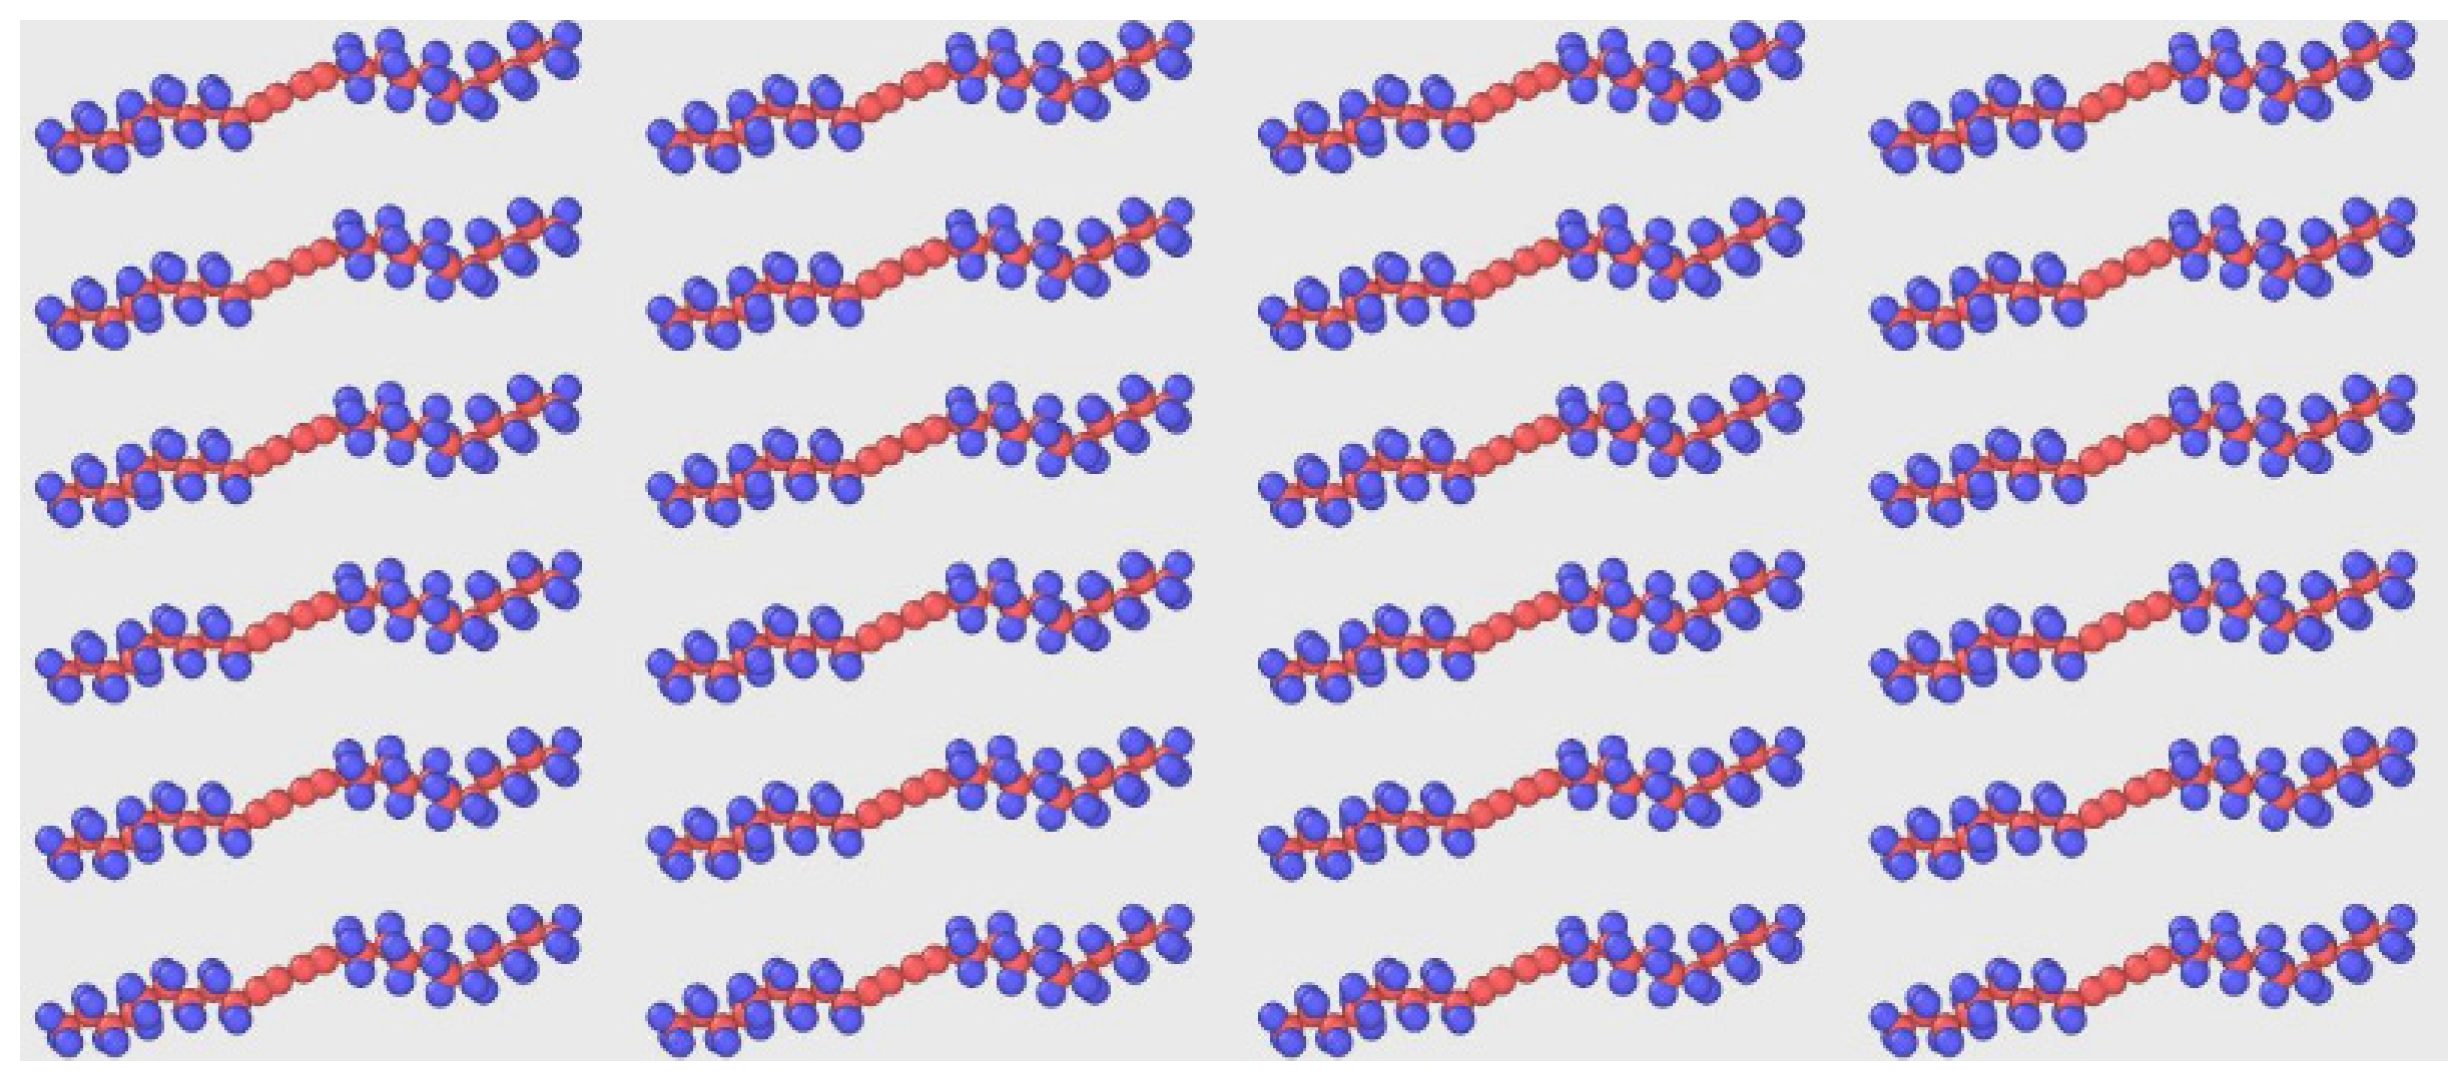
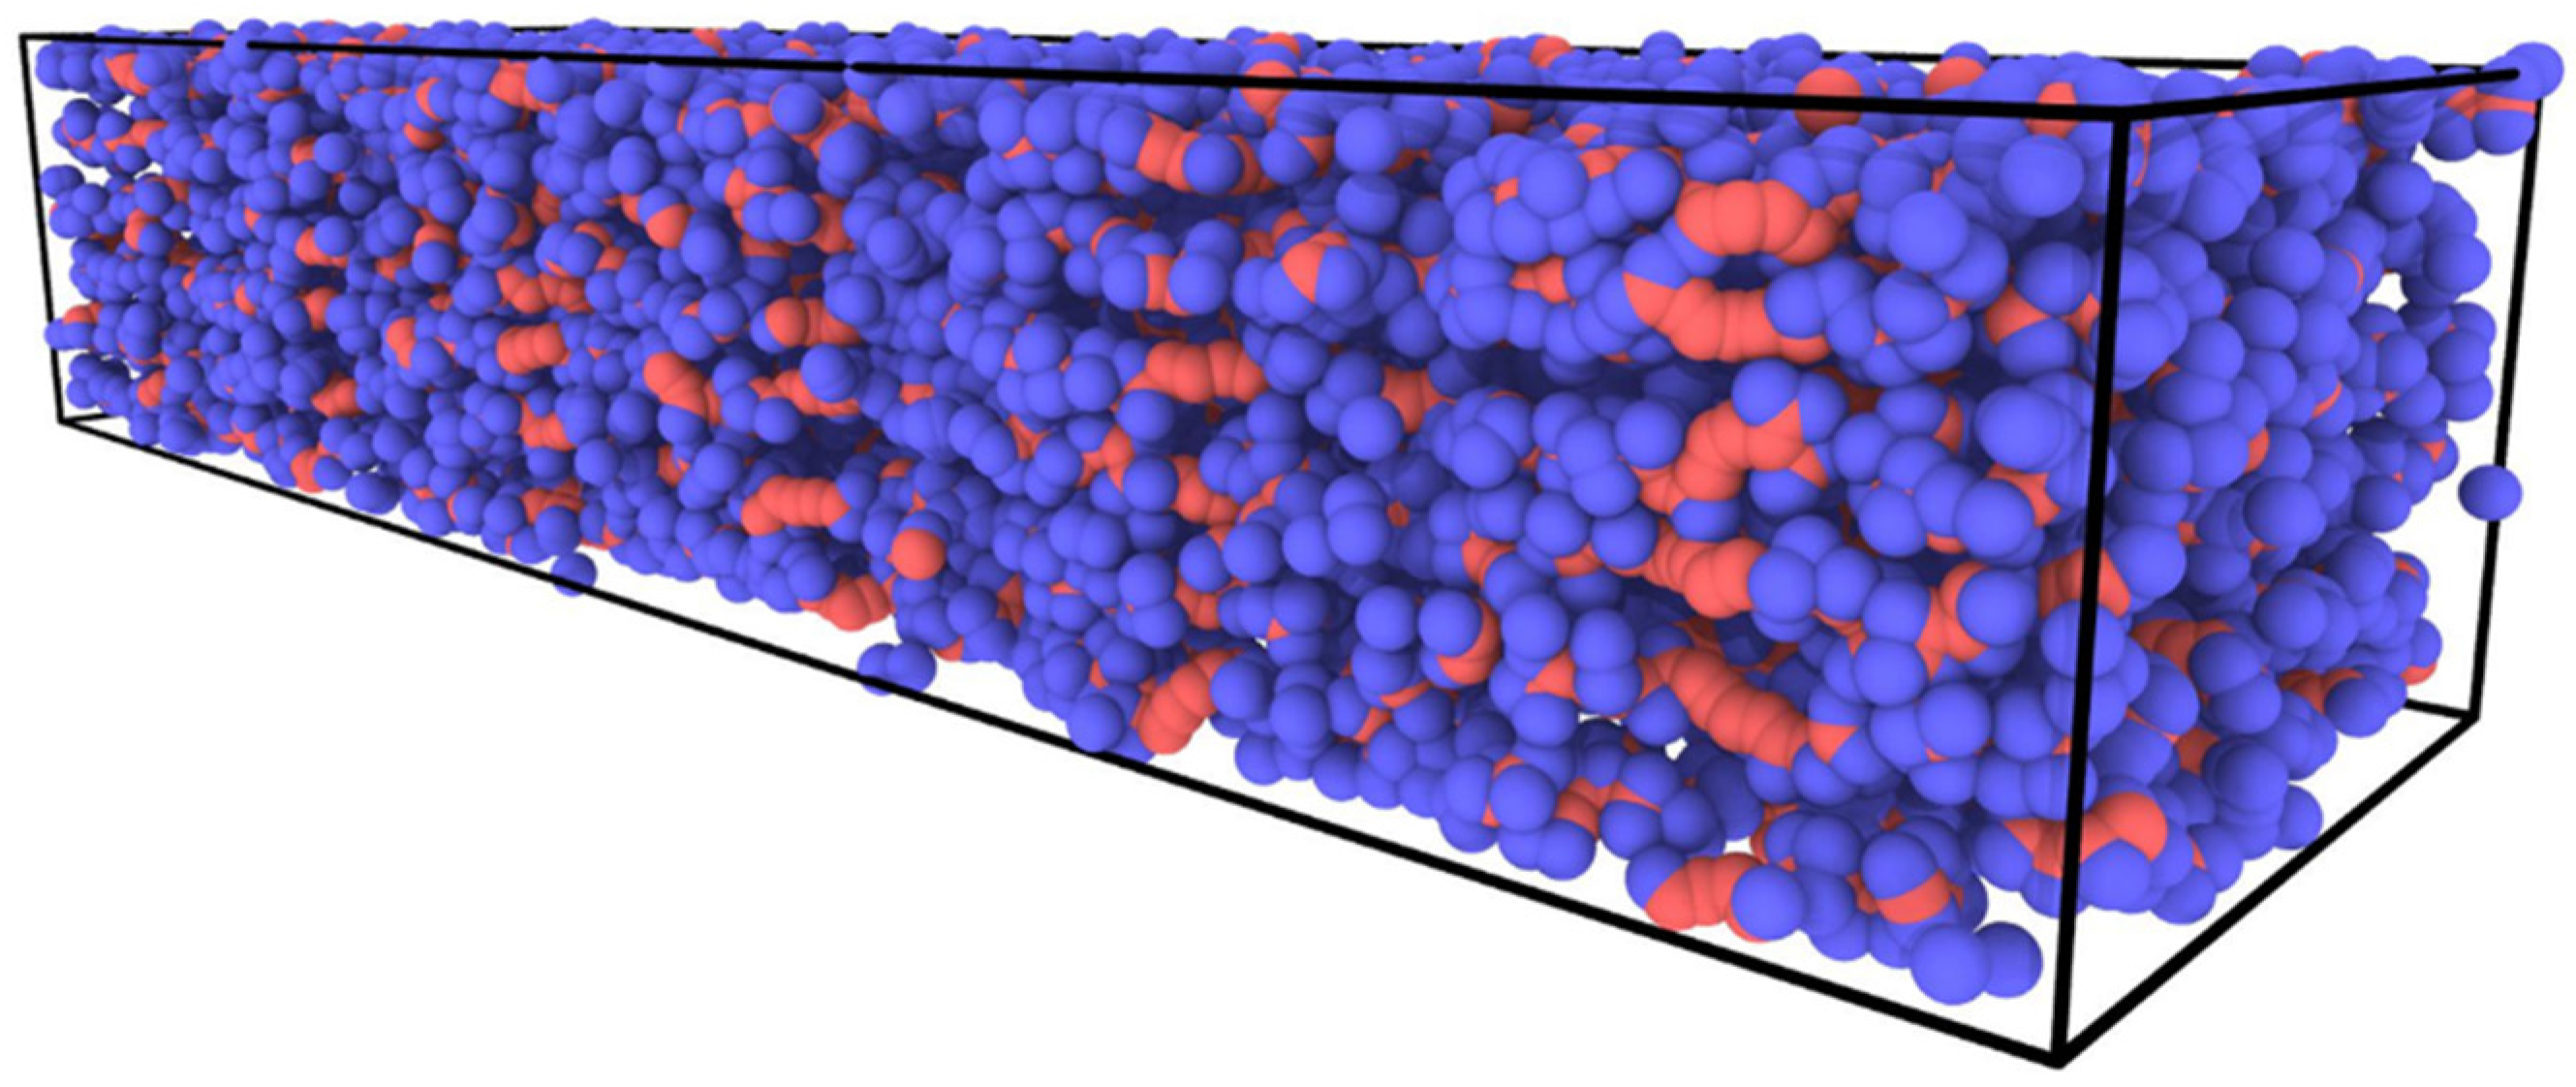
2.1. Atomic Scale Model

To understand the degree of polymerization in an EBT3 film, we employed MD computations to model the behavior of DA monomers using the AIREBO (Adaptive Intermolecular Reactive Empirical Bond Order) potential [22]. The DA monomers were modeled in a rectangular simulation box with lengths of 800 Å in the x direction, 230 Å in the y direction, and 150 Å in the z direction, and the carboxylic chain (–COOH) was neglected. The number of oxygen atoms in the DA monomer was insignificant compared to those in the long hydrocarbon chain. The dominant bonding sites would be located along the simulated chain and the contribution of the –COOH group would be negligible. The attraction forces among the DA monomers were governed by attraction forces among atoms in the chains, which were inversely proportional to separations among the atoms. The simulation box consisted of ~106 (carbon + hydrogen) atoms in total, which accounted for ~15,000 DA monomer strands. A section of the simulation box is shown schematically in Figure 1.
In the AIREBO potential used in the present work, each pair of covalently-bonded atoms interacted via a potential given by
E i j R E B O = V i j R ( r i j ) + b i j V i j A ( r i j )
where VijR and VijA were pairwise potentials for repulsion (R) and for attraction (A), respectively; and where the monomer chain was considered to consist of carbon (i) and hydrogen (j) atoms. The AIREBO potential consisted of three terms:
E = 1 2 i   j i   [ E i j R E B O + E i j L J + k i , j   l i , j , k   E k i j l T o r s i o n ]
where EijLJ represented the intermolecular interaction potential, which accounted for intermolecular repulsion and dispersion defined using the Lennard-Jones (LJ) 12–6 potential:
V i j L J ( r i j ) = 4 ϵ i j [ ( σ i j r i j ) 12 ( σ i j r i j ) 6 ]
where ϵ was the potential well depth; σ was the distance at which the intermolecular potential between the two particles (i) and (j) was essentially zero; and r represented the distance between two attracting particles. Due to the presence of the torsional interaction potential in the AIREBO potential for dihedral angles, this potential would be highly suitable for long-chain hydrocarbon system such as DA monomers. The torsional potential was expressed as
V T o r s i o n ( ω ) = ϵ [ 256 405 c o s 10 ( ω 2 ) 1 10 ]
with ω as the dihedral angle. The energy minimization of the system was performed for 103 fs for DA monomers using the constant-energy, constant-volume ensemble (NVE) at 295 K. The structure was then relaxed using Langevin thermostat at 295 K for 103 fs, which enabled the atoms and the overall monomer chains to relax. Furthermore, the relaxed DA strands were exposed to specific UV exposures; this exposure was supplied in the form of energy to the atoms in every chain in small increments over a relatively long relaxation time, mainly to avoid excessive energy supply to the atoms that might break them from the main DA chain. After the energy supply step to the chains was completed, the DA monomers were relaxed under constant-pressure, constant-temperature ensemble (NPT) for ~2000 fs, and the final density of the polymerized system was obtained. The mass energy-absorption coefficient (α)m) for the present polymeric system was assumed to be 100 or 10 cm2/g (which actually did not affect the final results and conclusions, as explained below). The density ρ of the polymer system obtained from MD computations was used to determine the absorption coefficient µα for different UV exposures, i.e., µα = ρ × α)m. The variation in the absorption coefficient versus different UV exposures reflected the atomic-scale dynamics of the DA monomers.

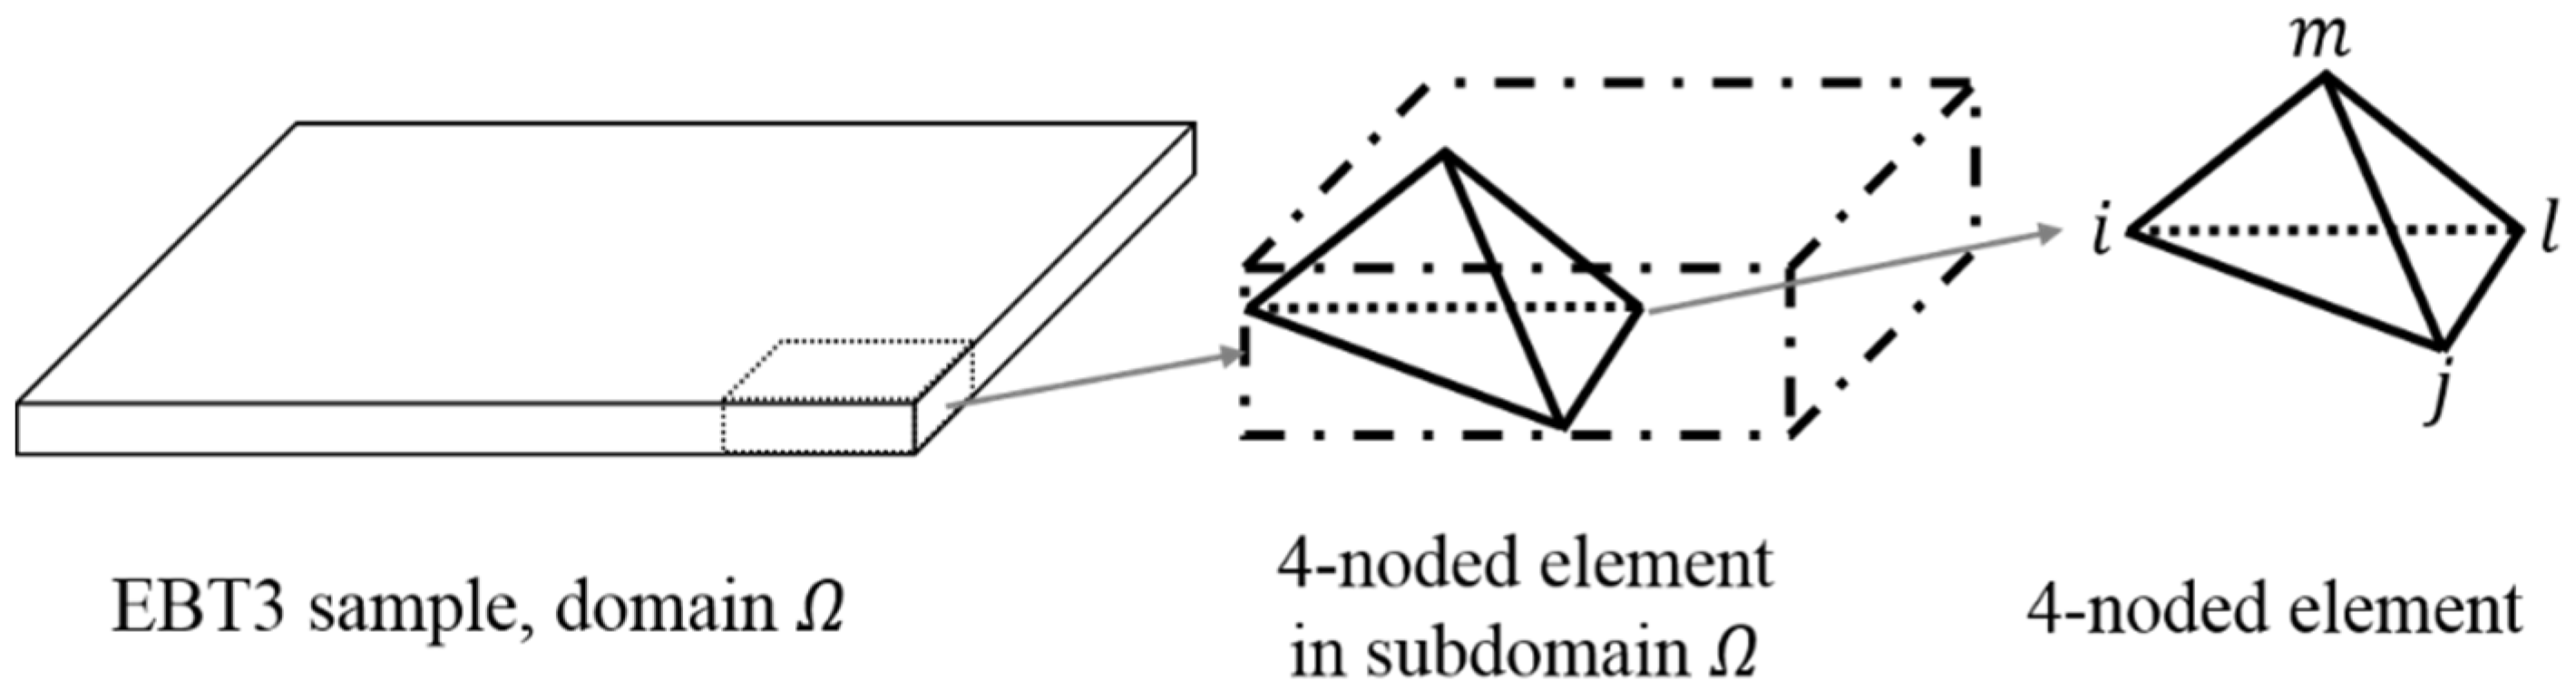
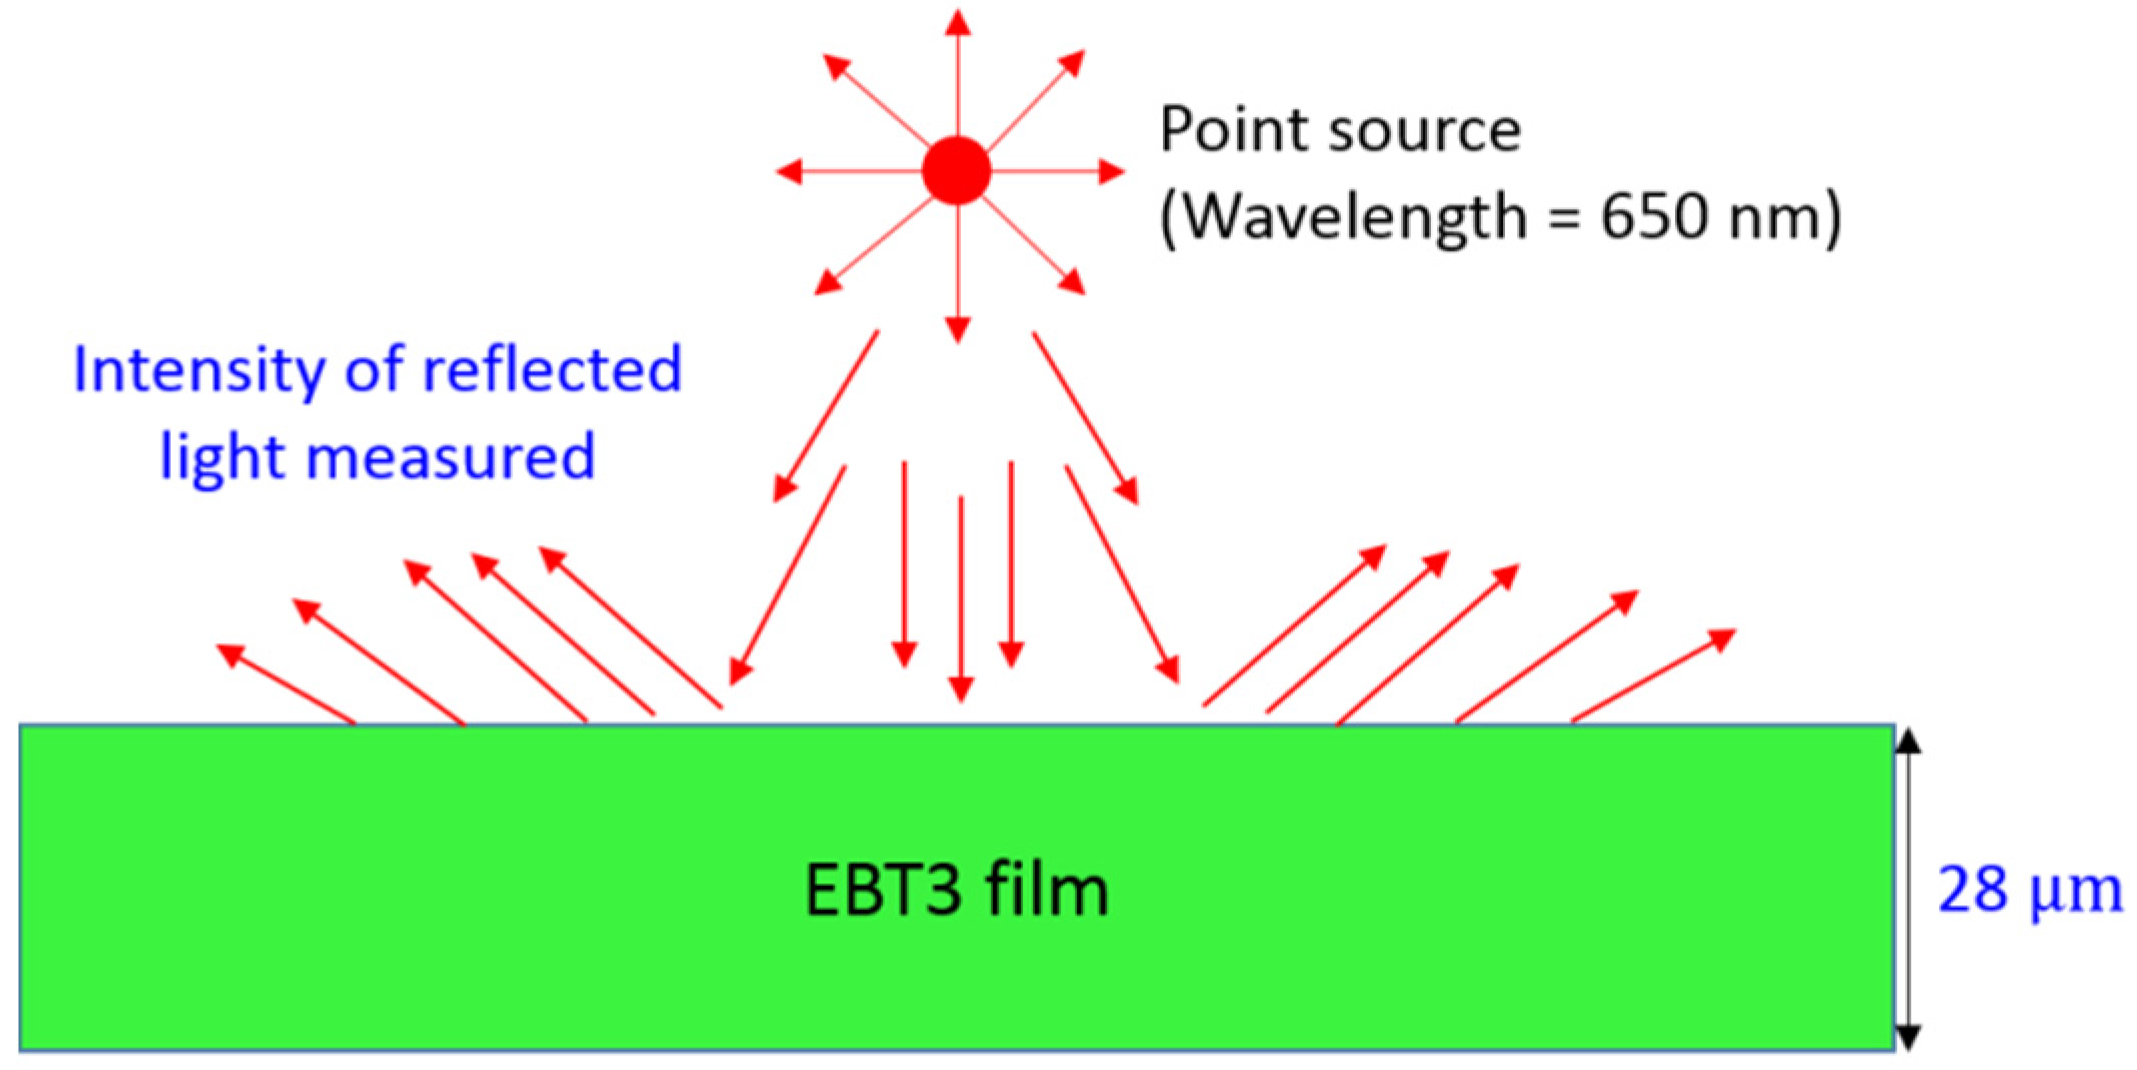
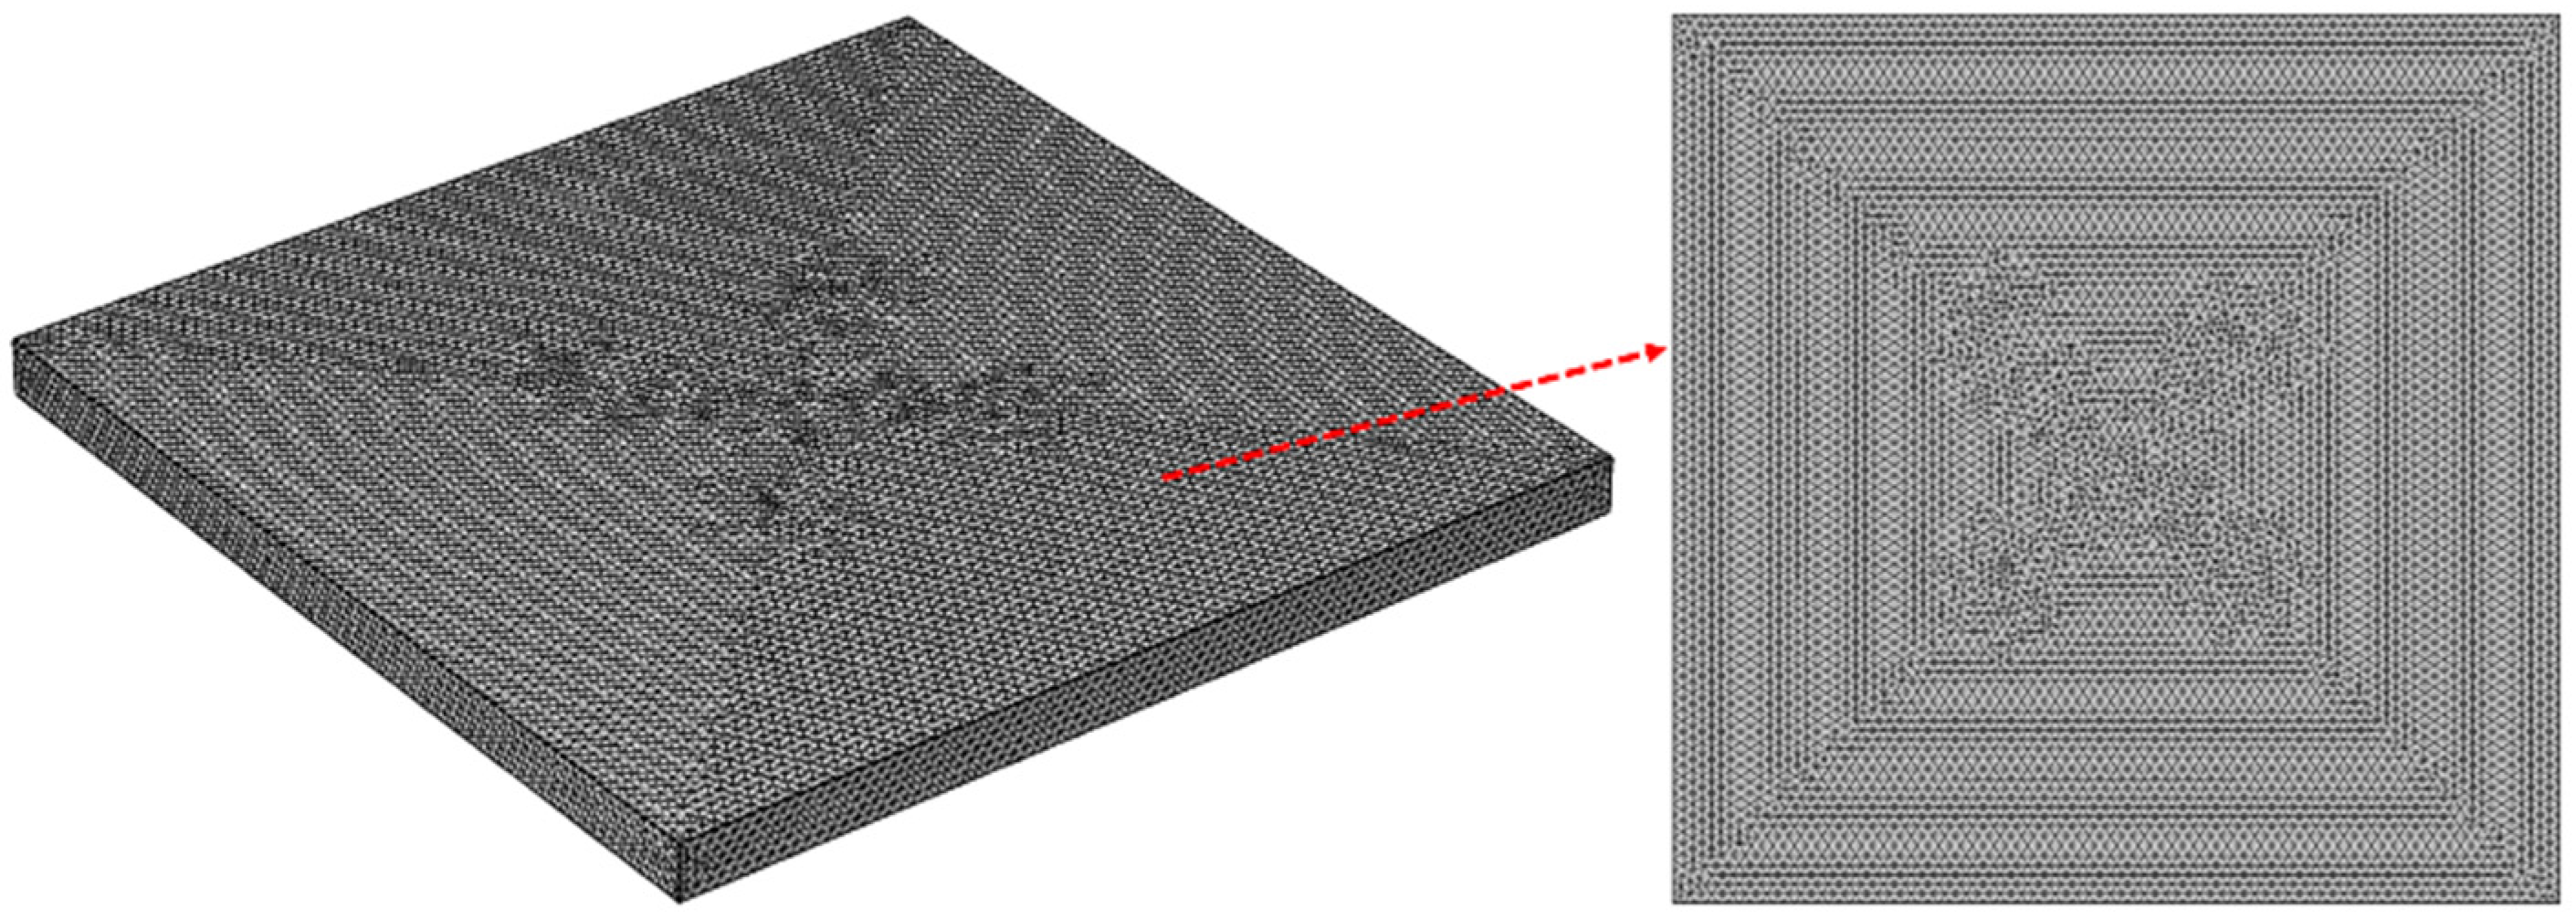
2.2. Macroscopic Scale Model

The numerical model bundled with the MD code was based on the FEM technique, which simulated light propagation through an EBT3 film with different light-absorption coefficients. The FEM model simulated the realistic experimental set-up in which the EBT3 film was scanned. The classical steady-state Helmholtz equation was used to model the re-emittance (i.e., reflection) from and transmittance through the EBT3 film [23]:
( D ϕ ) + μ α ϕ = S
where ϕ was the intensity; S represented the source term; and D = 1/3(µαs), µα and µs were absorption and reduced scattering coefficients, respectively. Equation (5) could be expanded as
x ( D ϕ x ) + y ( D ϕ y ) + z ( D ϕ z ) + α ϕ = S  
The Helmholtz’s equation might be solved in 2- or 3-dimensional forms. Here it was solved in a 3-dimensional form that could directly emulate the experimental set-up. Equation (6) could be restated as the determination of function ϕ that minimized the functional χ defined as
χ = 1 2 D { ( ϕ x ) 2 + ( ϕ y ) 2 + ( ϕ z ) 2 } d Ω   1 2 μ α ϕ 2 d Ω
where was the domain enclosing the volume. The Neumann condition was included in the functional, with the general form of the Neumann boundary condition as
n ( D ϕ ) = g q ϕ
where n was the normal vector; and g and q represented the boundary flux and absorption term, respectively. The functional χ could be expressed as χ = χf + χs for convenience. Here, the FEM method was employed to solve the Helmholtz equation, which was based on dividing the region under analysis into a number of sub-regions (i.e., elements). The modelled domain () was a rectangular block with dimensions of 500 × 500 × 28 µm3. The subdivision of was accomplished by introducing tetrahedron elements with 4 nodes (i.e., 4-noded elements). This technique is schematically summarized in Figure 2.
Upon introduction of 4-noded elements, the dependent variable ϕ needed to be defined as a vector at each node as
{ ϕ } = [ ϕ 1 ϕ 2 : ϕ n ]
The definition of ϕ would now be possible as
{ ϕ } e = [ ϕ i ϕ j ϕ l ϕ m ]
where i, j, l, m were nodes that emerged from the 4-nodes elements (see Figure 2). The variable ϕ could be expressed as
ϕ ( x , y , z ) = N { ϕ } e = [ N i , N j , N l , N m ] { ϕ } e
where N was the matrix containing the shape functions. For any set of values of {ϕ}, χ could be determined and minimization could be accomplished by writing the set of equations as
{ χ f ϕ i + χ s ϕ i = 0 χ f ϕ j + χ s ϕ j = 0 χ f ϕ l + χ s ϕ l = 0 χ f ϕ m + χ s ϕ m = 0 }
Similarly, the elemental decomposition of χ would be
χ f = χ f e   and   χ s = χ s e
considering χe as the contribution of element e to the total integration. Interestingly, the relation between the quadratic function of the nodal values for each element would be linear:
{ χ f ϕ i χ f ϕ j χ f ϕ l χ f ϕ m } = χ f e { ϕ } e = S e { ϕ } e
where the matrix S depended on the shape function N, which in fact was associated with the nodal elements as N = [Ni, Nj, Nl, Nm]. The matrix Se was symmetric and could be represented as
S r s e = ( N r x N s x d Ω + N r y N s y d Ω + N r z N s z d Ω ) D
The term χs was defined by
χ s = 1 2 μ α ϕ 2 d Ω
Equation (16) could be redefined for other nodes of any element as
χ s c ϕ i = μ α N i [ N i , N j ,   N m ,   N e ] d Ω { ϕ e }
Using the matrix form, it would be possible to state the total contribution for a 4-noded element as
{ χ s ϕ i χ s ϕ j χ s ϕ m χ s ϕ e } e = μ α [ N i 2 N i N j N i N m N i N e N j N i   N j 2 N j N m N j N e N m N i N m N j N m 2 N m N e N e N i N e N j N e N m N e 2 ] d Ω { ϕ i ϕ j ϕ m ϕ e } e
Equation (18) could be written as
χ s e d { ϕ e } = μ α M e { ϕ } e
The two parts of the functional χ could now be combined as
χ e { ϕ e } = χ f e { ϕ e } + χ s e { ϕ e }
From Equations (12), (14), (19),
S { ϕ } = μ α M { ϕ }
The solution of Equation (21) gave the eigenvalues of µα. This could be further extended for any number of associated nodes. Here, 4-noded tetrahedron elements were used. The mathematical description for a 4-noded tetrahedron element is given in Appendix A. The seamless mesh containing the tetrahedron elements is shown in Figure 3.
The employed mesh consisted of 468,345 domain elements including 34,056 boundary elements and 820 edge elements. The term D could be expressed in terms of absorption (µa) and reduced scattering (µs) coefficient as
D = 1 3 ( μ a + μ s )
The present model was implemented and solved using the MUMPS solver, which allowed better exploitation of computer resources and reduced numerical fluctuations associated with the FEM technique. The solver configurations included: (1) a memory allocation factor of 1.2; (b) pivoting with a pivot threshold of 0.1; and (c) hyper-threading enabled for the multiprocessor cluster. Due to the employment of a fine mesh, the numerical simulations were executed on supercomputer with Intel® Xeon E5-2670 2.60 GHz using 32 physical cores and hyper-threaded to 64.

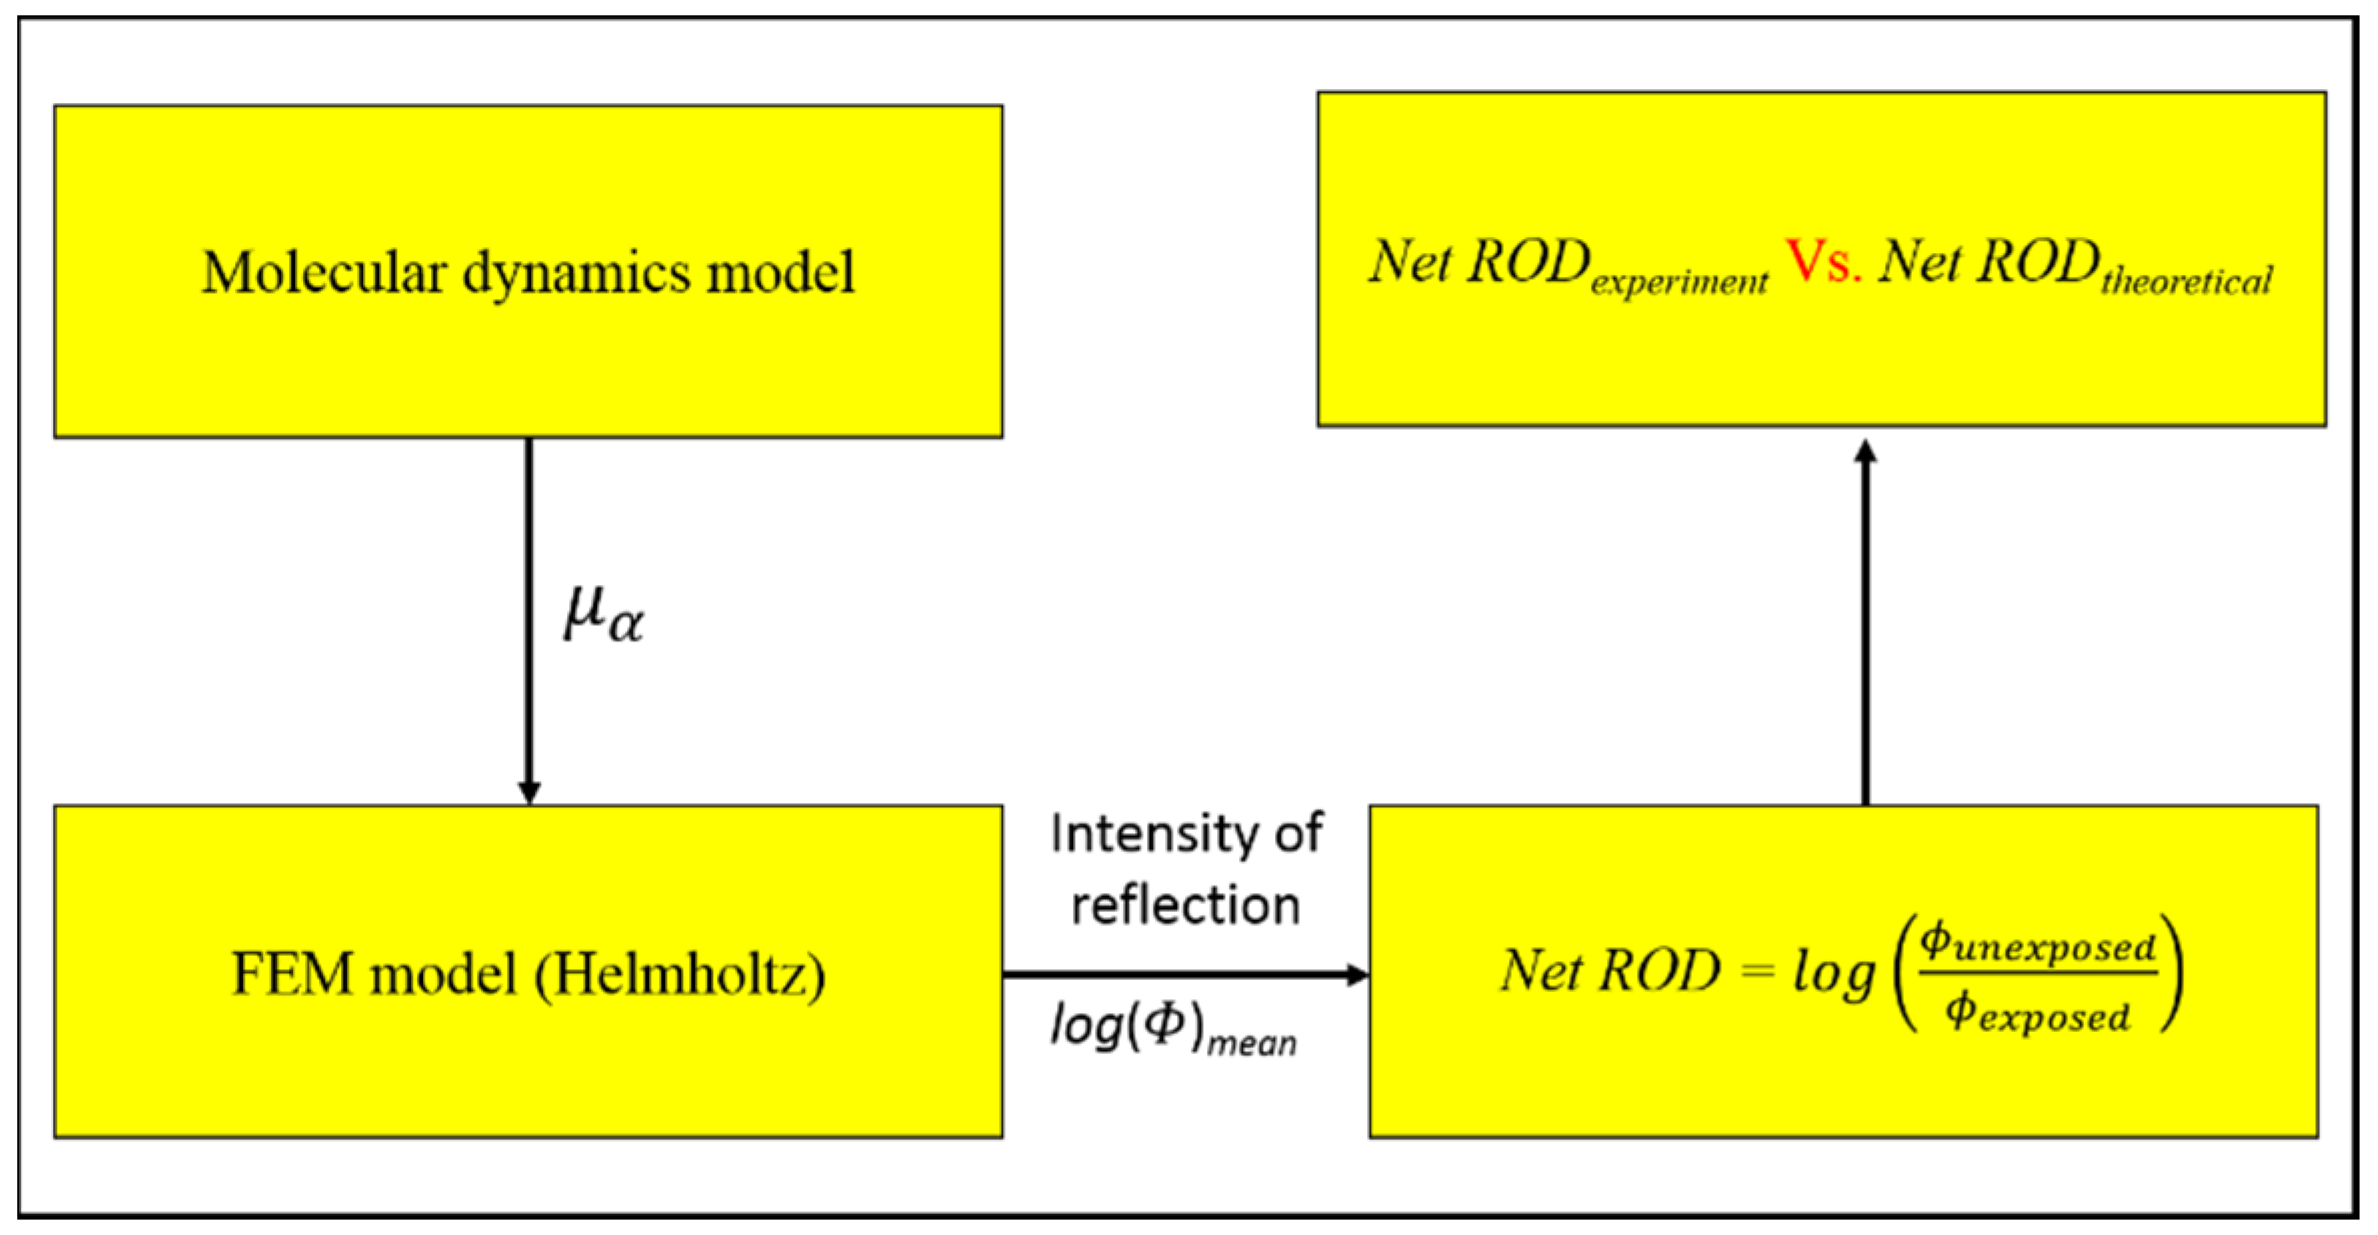
2.3. Computation Scheme

The present approach to determine the net reflective optical density (Net ROD) (see below for definitions) is summarized in Figure 4. Variations in the absorption coefficient were obtained from the MD model, which would then be supplied to the FEM model. The intensity of reflection from the film surface would be scored. Ratios between different intensities were obtained to compare with experimentally determined Net ROD values.
Since Net ROD was a ratio of the reflected light intensity, the theoretical ratio Net RODtheoretical would not be affected by properties of the light source, including its strength, shape, size and distance from the film surface. For simplicity, a monoenergetic point source was chosen. The wavelength of light emission was assumed to be 650 nm. The irradiation of the film and the reflection from the film are schematically shown in Figure 5.
The Net ROD from the present model was calculated as
N e t   R O D = log ( ϕ u n e x p o s e d ϕ e x p o s e d )
where ϕunexposed and ϕexposed were reflected intensities of light from the unexposed and exposed film to UV radiation, respectively. The experimental Net ROD was defined as Net ROD = log(Pu/Pt), where Pu and Pt were the pixel values of the reflected intensities through an unexposed film and an exposed film, respectively. Here, the UV exposure values were taken from previous work by Chun et al. [8].

3. Results and Discussions

The absorption coefficients of EBT3 films versus UV exposure obtained from our model are shown in Figure 6. The increase in the absorption coefficient with increasing UV exposure could be explained in the atomic scale by the corresponding increase in the density of the system. The extra energy from larger UV exposures increased the kinetic energy of atoms in the monomer strands and facilitated their relocation to form a cross-linked structure. A denser polymerized configuration through solid-state polymerization would result from more bond formation. The lowest and highest absorption coefficients were found to be ~27.0 and ~29.0 cm−1, respectively. The absorption coefficients were obtained from the product of mass energy-absorption coefficient with density. Here, the mass energy-absorption coefficient was assumed to be 100 cm2/g, but the chosen value was not important since Net ROD was the ratio of reflected intensities from the unexposed and exposed film to UV radiation. The variations in reflected light intensities from the EBT3 film were governed by the variation in density ρ versus UV exposure in other words, by the variation in absorption coefficient µα versus UV exposure, since µα = ρ × α)m. A snapshot from the atomic-scale system of monomer strands during relaxation after UV exposure and subsequent formation of bonds is shown in Figure 7.
The reflected intensities (i.e., log(ϕ)) from the EBT3 films versus UV exposures are shown in Figure 8. A larger absorption coefficient led to increased absorption of light by the polymer material. For UV exposures larger than ~40 J/cm2, the reflected light intensity decreased at a lower rate when compared to other UV exposure values, which was due to the insignificant variations in the absorption coefficient for UV exposures larger than ~40 J/cm2 (see Figure 6). For relatively large UV exposures, the monomers became almost fully polymerized, and the densely cross-linked structure significantly lowered the efficiency for further bond formation between DA monomer strands. As a result, the absorption coefficient, which depended on the density of polymerization, also did not significantly increase at large UV exposures.
In the model here, Net ROD was defined as Net ROD = log(ϕunexposedexposed), where ϕunexposed and ϕexposed were reflected intensities of light from the unexposed and exposed film to UV radiation, respectively, in line with the definition of experimental Net ROD as Net ROD = log(Pu/Pt), where Pu and Pt were the pixel values of reflected intensities through an unexposed film and an exposed film, respectively [8]. It is remarked here that, during the conversion of experimentally obtained images of the EBT3 film into grayscale, the pixel values ranged from 255 (completely white) to 0 (completely black), so the ratio Pu/Pt was always larger than unity. Similarly, the ratio ϕunexposedexposed ratio was always larger than unity. Both pixel values and reflected light intensities could be traced back to properties of the EBT3 film under analysis.
The comparisons among Net ROD values (obtained experimentally by Chun et al. [8]) and from theoretical predictions with two different mass energy-absorption coefficients, (µα)m versus UV-light exposures are shown in Figure 9. The Net ROD values from theoretical predictions were scored over the entire film surface that had been exposed to UV. In the FEM technique, an element consisted of a number of nodes (4 nodes for the tetrahedron used in the present work) each being associated with a shape function. The intensity of the reflected light in an element was determined through summing the intensities over all nodes with consideration of their corresponding shape function. The average reflected intensity was determined as the arithmetic mean of the intensities of elements in the modeled domain [24]. The theoretically obtained Net ROD values were generally in good agreement with the experimental data and, as described above, did not vary noticeably with the chosen mass energy-absorption coefficients (viz., 100 vs. 10 cm2/g). The two curves were close to each other, but the numerical values were not exactly the same. When different mass energy-absorption coefficients were employed, the reflected light intensities from the unexposed and exposed films changed by almost the same factor, so the Net ROD values were close. Figure 9 shows that Net ROD increases with the UV exposure. Upon UV exposures, the DA monomer strands gained enough energy to form a dense cross-linked polymerized structure, so the EBT3 film became darker. However, upon excessive UV exposures, polymerization would become saturated and there would be no further film darkening.
The deviations between the model and the experimental data in Figure 9 could be due to assumptions and simplifications made in the present model; such as, no other elements than carbon and hydrogen atoms were present in the EBT3 film, and no light leaked from the film. The spatial distribution of Net ROD over the upper and lower surface of an EBT3 film after being exposed to 164.70 J/cm2 UV radiation is shown in Figure 10. The Net ROD values were larger at the upper surface, which was explained by the loss of intensities of light rays during their traversals of the active layer of the EBT3 film (thickness = 28 µm). The largest theoretical Net ROD was recorded at the center of the film because a point source was used in the simulations.

4. Conclusions

In the present work, we presented the first numerical model for the simulation of coloration changes in radiochromic EBT3 film. A MD-coupled FEM model was developed to study the coloration change of the EBT3 film when exposed to UV radiation. The active layer in the EBT3 film consisted of diacetylene (DA) pentacosa-10,12-diynoate monomers, which were modelled using MD. The densities of the active layer of the EBT3 film were determined upon different UV exposures. The results obtained from MD computations were used as inputs to the FEM model to simulate light propagation through the EBT3 film. The classical steady-state Helmholtz equation was implemented in the FEM model to determine the reflected light intensities. Very good agreement between experimentally and theoretically obtained coloration in terms of net reflective optical density was achieved for different UV exposures. In particular, for UV exposures larger than ~40 J/cm2, the reflected light intensity decreased at a lower rate when compared to other UV exposure values, which was explained by the densely cross-linked structure under near-complete polymerization and, thus, lower efficiency of further bond formation between DA monomer strands. With the success of our present model for explaining solid-state polymerization (SSP) in the EBT3 film, we are in a good position to perform related studies on dose responses for X-ray photons by adding processes involving secondary electrons created by X-ray photons, which will be covered in a future paper.

Acknowledgments

We acknowledge the support of the Neutron computer cluster of the Department of Physics, City University of Hong Kong, for the computational work involved in this paper.

Author Contributions

M.S.B. and K.N.Y. conceived and designed the experiments; M.S.B. and D.K. performed the experiments; M.S.B., D.K. and D.N. analyzed the data; D.N. and K.N.Y. contributed reagents/materials/analysis tools; and M.S.B., D.N. and K.N.Y. wrote the paper.

Conflicts of Interest

The authors declare no conflict of interest.

Appendix A

Tetrahedron element:
The shape function of the tetrahedron element can be expressed in the form of a linear polynomial as
ϕ = α 1 + α 2 x + α 3 y + α 4 z
For the 4 different nodes, the shape function can be decomposed into nodal components as
{ ϕ i = α 1 + α 2 x i + α 3 y i + α 4 z i ϕ j = α 1 + α 2 x j + α 3 y j + α 4 z j ϕ l = α 1 + α 2 x l + α 3 y l + α 4 z l ϕ m = α 1 + α 2 x m + α 3 y m + α 4 z m }
where i, j, l and m are the nodes from the 4-noded tetrahedron element. Therefore, ϕ can be expressed as
ϕ = [ N i , N j , N l , N m ] { ϕ } e
where the term Ni, Nj, Nl and Nm are
N i = ( a i + b i x + c i y + d i z ) 6 V N j = ( a j + b j x + c j y + d j z ) 6 V N l = ( a l + b l x + c l y + d l z ) 6 V N m = ( a m + b m x + c m y + d m z ) 6 V
The term 6V in the denominator of Equation (4) is given by
6 V = | 1 x i y i z i 1 x j v j z j 1 x l y l z l 1 x m y m z m |
where V is the volume of the 4-noded element (i.e., the tetrahedron). The terms in the nominator of Equation (4) can also be expressed in terms of x ,y and z, as a i = | x i y j z j x l y l z l x m y m z m | , b i = | 1 y j z j 1 y l z l 1 y m z m | , c i = | 1 x j z j 1 x l z l 1 x m z m | and d i = | 1 x j y i 1 x l y l 1 x m y m | . Similar expressions would be applicable for aj, al and am, however further derivation of these terms is not shown in the present paper. A distinctive term in the matrix S can now be represented as
S r s = ( b r b s + c r c s + d r d s ) 36 V × D
where V is the volume of the 4-noded tetrahedron element.

References

  1. McLaughlin, W.L.; Al-Sheikhly, M.; Lewis, D.F.; Kovács, A.; Wojnárovits, L. Radiochromic Solid-State Polymerization Reaction. In Irradiation of Polymers, Chapter 11; ACS Symposium Series; American Chemical Society: Washington, DC, USA, 1996; Volume 620, pp. 152–166. Available online: http://pubs.acs.org/doi/abs/10.1021/bk-1996–0620.ch011 (accessed on 10 September 2017).
  2. Butson, M.J.; Yu, P.K.N.; Cheung, T.; Metcalfe, P. Radiochromic film for medical radiation dosimetry. Mater. Sci. Eng. R 2003, 41, 61–120. Available online: http://www.sciencedirect.com/science/article/pii/S0927796X03000342 (accessed on 10 September 2017). [CrossRef]
  3. Cheung, T.; Butson, M.J.; Yu, P.K.N. Evaluation of a fluorescent light densitometer for radiochromic film analysis. Radiat. Meas. 2002, 35, 13–16. Available online: http://www.sciencedirect.com/science/article/pii/S1350448701002517 (accessed on 10 September 2017). [CrossRef]
  4. Butson, M.J.; Cheung, T.; Yu, P.K.N. Fluorescent light effects on FWT-60 radiochromic film. Phys. Med. Biol. 2005, 50, N209–N213. Available online: http://iopscience.iop.org/article/10.1088/0031–9155/50/16/N02/meta (accessed on 10 September 2017). [CrossRef] [PubMed]
  5. Butson, M.J.; Cheung, T.; Yu, P.K.N.; Abatti, D.; Greenoak, G. Ultraviolet radiation dosimetry with radiochromic film. Phys. Med. Biol. 2000, 45, 1863–1868. Available online: http://iopscience.iop.org/article/10.1088/0031–9155/45/7/311/meta (accessed on 10 September 2017). [CrossRef]
  6. Butson, E.T.; Cheung, T.; Yu, P.K.N.; Butson, M.J. Measuring solar UV radiation with EBT radiochromic film. Phys. Med. Biol. 2010, 55, N487–N493. Available online: http://iopscience.iop.org/article/10.1088/0031–9155/55/20/N01/meta (accessed on 10 September 2017). [CrossRef] [PubMed]
  7. Butson, E.T.; Yu, P.K.N.; Butson, M.J. Solar ultraviolet radiation response of EBT2 Gafchromic, radiochromic film. Phys. Med. Biol. 2013, 58, N287–N294. Available online: http://iopscience.iop.org/article/10.1088/0031–9155/58/21/N287/meta (accessed on 10 September 2017). [CrossRef] [PubMed]
  8. Chun, S.L.; Yu, P.K.N. Note: Calibration of EBT3 radiochromic film for measuring solar ultraviolet radiation. Rev. Sci. Instrum. 2014, 85, 106103. Available online: https://www.ncbi.nlm.nih.gov/pubmed/25362462 (accessed on 10 September 2017). [CrossRef] [PubMed]
  9. Cheung, T.; Butson, M.J.; Yu, P.K.N. Experimental energy response verification of XR type T radiochromic film. Phys. Med. Biol. 2004, 49, N371–N376. Available online: http://iopscience.iop.org/article/10.1088/0031–9155/49/21/N02/meta (accessed on 10 September 2017). [CrossRef] [PubMed]
  10. Cheung, T.; Butson, M.J.; Yu, P.K.N. Weak energy dependence of EBT Gafchromic film dose response in the 50 kVp—10 MVp X-ray range. Appl. Radiat. Isot. 2006, 64, 60–62. Available online: http://www.sciencedirect.com/science/article/pii/S0969804305002332 (accessed on 10 September 2017).
  11. Butson, M.J.; Cheung, T.; Yu, P.K.N. Measurement of energy dependence for XRCT Radiochromic film. Med. Phys. 2006, 33, 2923–2925. Available online: http://onlinelibrary.wiley.com/doi/10.1118/1.2219330/full (accessed on 10 September 2017). [CrossRef] [PubMed]
  12. Butson, M.J.; Cheung, T.; Yu, P.K.N. Measuring energy response for RTQA Radiochromic film to improve quality assurance procedures. Australas. Phys. Eng. Sci. 2008, 31, 203–206. Available online: https://link.springer.com/article/10.1007/BF03179345 (accessed on 10 September 2017). [CrossRef]
  13. Butson, M.J.; Yu, P.K.N.; Cheung, T.; Alnawaf, H. Energy response of the new EBT2 radiochromic film to x-ray radiation. Radiat. Meas. 2010, 45, 836–839. Available online: http://www.sciencedirect.com/science/article/pii/S1350448710000739 (accessed on 10 September 2017). [CrossRef]
  14. Butson, M.J.; Yu, P.K.N.; Cheung, T.; Inwood, D. Polarization effects on a high sensitivity radiochromic film. Phys. Med. Biol. 2003, 48, N207–N211. Available online: http://iopscience.iop.org/article/10.1088/0031–9155/48/15/401/meta (accessed on 10 September 2017). [CrossRef] [PubMed]
  15. Butson, M.J.; Cheung, T.; Yu, P.K.N. Scanning orientation effects on EBT Gafchromic film dosimetry. Australas. Phys. Eng. Sci. 2006, 29, 281–284. Available online: https://link.springer.com/article/10.1007/BF03178579 (accessed on 10 September 2017). [CrossRef]
  16. Alnawaf, H.; Butson, M.J.; Cheung, T.; Yu, P.K.N. Scanning orientation and polarization effects for XRQA Radiochromic film. Phys. Med. 2010, 26, 216–219. Available online: http://www.sciencedirect.com/science/article/pii/S1120179710000050 (accessed on 10 September 2017). [CrossRef] [PubMed]
  17. Yu, P.K.N.; Butson, M.J.; Cheung, T. Does mechanical pressure on radiochromic film affect optical absorption and dosimetry? Australas. Phys. Eng. Sci. 2006, 29, 285–287. Available online: https://link.springer.com/article/10.1007/BF03178580 (accessed on 10 September 2017). [CrossRef]
  18. Chan, P.M.; Ng, C.Y.P.; Shahmohammadi Beni, M.; Law, S.S.; Yu, K.N. Auto-development issue in quality assurance of biological X-ray irradiator using Gafchromic EBT3 film. Results Phys. 2017, 7, 444–445. Available online: http://www.sciencedirect.com/science/article/pii/S2211379716307471 (accessed on 10 September 2017). [CrossRef]
  19. Shahmohammadi Beni, M.; Ng, C.Y.P.; Krstic, D.; Nikezic, D.; Yu, K.N. Conversion coefficients for determination of dispersed photon dose during radiotherapy: NRUrad input code for MCNP. PLoS ONE 2017, 12, e0174836. Available online: http://journals.plos.org/plosone/article?id=10.1371/journal.pone.0174836 (accessed on 10 September 2017). [CrossRef] [PubMed]
  20. Girard, F.; Bouchard, H.; Lacroix, F. Reference dosimetry using radiochromic film. J. Appl. Clin. Med. Phys. 2012, 13, 339–353. Available online: http://onlinelibrary.wiley.com/doi/10.1120/jacmp.v13i6.3994/full (accessed on 10 September 2017). [CrossRef] [PubMed]
  21. MUMPS Solver. Available online: http://mumps.enseeiht.fr/ (accessed on 10 September 2017).
  22. Stuart, S.J.; Tutein, A.B.; Harrison, J.A. A reactive potential for hydrocarbons with intermolecular interactions. J. Chem. Phys. 2000, 112, 6472–6486. Available online: http://aip.scitation.org/doi/abs/10.1063/1.481208 (accessed on 10 September 2017). [CrossRef]
  23. Arlett, P.L.; Bahrani, A.K.; Zienkiewicz, O.C. Application of finite elements to the solution of Helmholtz’s equation. Proc. Inst. Electr. Eng. 1968, 115, 1762–1766. Available online: http://ieeexplore.ieee.org/document/5249030/ (accessed on 10 September 2017). [CrossRef]
  24. Shahmohammadi Beni, M.; Yu, K.N. Computational Fluid Dynamics Analysis of Cold Plasma Plume Mixing with Blood Using Level Set Method Coupled with Heat Transfer. Appl. Sci. 2017, 7, 578. Available online: https://www.mdpi.com/2076–3417/7/6/578/htm (accessed on 10 September 2017). [CrossRef]
Figure 1. Schematic diagram of the initial of diacetylene (DA) pentacosa-10,12-diynoate monomers. (Red spheres: carbon atoms; blue spheres: hydrogen atoms.).
Applsci 07 01031 g001
Figure 2. Tetrahedron elements introduced into the volumetric domain .
Applsci 07 01031 g002
Figure 3. Seamless tetrahedron mesh employed for a 500 × 500 × 28 µm3 EBT3 film.
Applsci 07 01031 g003
Figure 4. Flowchart summarizing approach to determine Net ROD.
Applsci 07 01031 g004
Figure 5. Irradiation of the EBT3 film and the reflection from the film.
Applsci 07 01031 g005
Figure 6. Absorption coefficients of EBT3 film versus ultraviolet (UV) light exposure obtained from our model.
Applsci 07 01031 g006
Figure 7. A snapshot from the atomic-scale system of monomer strands during relaxation after UV exposure and subsequent formation of bonds. (Red spheres: carbon atoms; blue spheres: hydrogen atoms. Dimensions of box: 800 × 230 × 150 Å3).
Applsci 07 01031 g007
Figure 8. Reflected intensities (log(ϕ)) from EBT3 films versus UV exposures.
Applsci 07 01031 g008
Figure 9. Comparisons among Net ROD values (obtained experimentally by Chun et al. [8] and from theoretical predictions with two different mass energy-absorption coefficients, (µα)m) versus UV-light exposures. (The error bars for the experimental data are smaller than the symbols.).
Applsci 07 01031 g009
Figure 10. Spatial distribution of Net ROD over (a) upper and (b) lower surface of EBT3 film after being exposed to 164.70 J/cm2 UV radiation.
Applsci 07 01031 g010

