Article

Comparison of Cooling Different Parts in a High Pressure Ratio Centrifugal Compressor

Turbomachinery Laboratory, State Key Laboratory of Automotive Safety and Energy, Tsinghua University, Beijing 100084, China
*
Author to whom correspondence should be addressed.
Appl. Sci. 2017, 7(1), 16; https://doi.org/10.3390/app7010016
Submission received: 5 October 2016 / Revised: 18 November 2016 / Accepted: 12 December 2016 / Published: 22 December 2016
(This article belongs to the Section Energy Science and Technology)

Abstract

:
Cooling in a centrifugal compressor can improve the performance and reduce the impeller temperature. In a centrifugal compressor, external walls can be cool down, which is known as the shell cooling. This method avoids undesirable effects induced by other cooling methods. Cooling can be applied on different external walls, such as the shroud, diffuser or the back plate. This paper focuses on seeking the most effective cooling place to increase the performance and reduce the impeller temperature. It is found that shroud cooling improves the compressor performance the most. Shroud cooling with 2400 W of cooling power increases the pressure ratio by 4.6% and efficiency by 1.49%. Each 500 W increase in the shroud cooling power, increases the efficiency by 0.3%. Diffuser cooling and back plate cooling have an identical effect on the polytropic efficiency. However, back plate cooling increases the pressure ratio more than diffuser cooling. Furthermore, only back plate cooling reduces the impeller temperature, and with 2400 W of cooling power, the impeller temperature reduces by 45 K.

1. Introduction

Centrifugal compressors generate a high pressure ratio in a small size. They can be used in areas where a high pressure ratio in a small space is desirable; for example, in compact gas turbines, helicopters and turbochargers. The trend in centrifugal compressors is towards a high pressure ratio on a smaller scale. This increases the power density, saves energy and also reduces emissions. Future turbochargers, for example, are required to have a compressor with a pressure ratio up to 5.8 for continuous operation [1].
Unfortunately, the development of high pressure ratio centrifugal compressors faces some limitations. In order to have an increment in the pressure ratio, the impeller rotational speed has to increase. Higher rotational speed intensifies the mechanical stress on the impeller disk. Meanwhile, the solid impeller temperature increases because of the higher temperature of the flow. This degrades the impeller integrity. Zheng et al. [2] reported that the maximum pressure ratio that an impeller can bear drops from 4.6 down to 4.2 if the effects of the temperature variations on the ultimate tensile stress of the impeller are being considered. Furthermore, higher rotational speed increases the flow speed and Mach number. This produces shock waves and degrades the efficiency of the compressor.
Compressor efficiency is substantial, especially in high pressure ratio conditions. In a turbocharger with a pressure ratio of six, compression work in the compressor requires half of the engine power [3]. This shows that a slight improvement in compressor efficiency saves a significant amount of work. Many studies have sought to increase the efficiency in a centrifugal compressor by aerodynamic redesign and modification of the blade shape [4,5,6]. However, the aerodynamic improvement of blades reached its limits, and new improvements need a complex 3D manufacturing process.
Effective cooling in a compressor improves the efficiency by changing the thermodynamical path of the compression. Furthermore, a suitable cooling method at the right place can cool down the impeller. Different methods of cooling have been used in compressors. Inlet wet cooling is a common method in gas turbines to increase the efficiency [7,8]. In this method, water is added to the inlet air flow to reduce the inlet air temperature by evaporation. This method has gained popularity because of its effectiveness, simple installation and low cost [9,10]. However, this method degrades the blades’ integrity by ice formation before the leading edge. This method has a negative effect on the compressor’s surge margin [11,12]. Furthermore, a large amount of water is needed for the continuous operation, which is not always available.
Another method to avoid these negative effects is to utilize a heat exchanger at the inlet. The cooling source can be an absorption chiller, active magnetic cooler or Vapor Compression Refrigeration (VCR). Ameri et al. [13] illustrates that using an absorption chiller for inlet air cooling in a gas turbine increases the output power by 11.3%. This improvement can be further increased if somehow the pressure drop caused by the heat exchanger in the main flow can be prevented.
Shell cooling or cooling on the external walls in a centrifugal compressor can be used to cool down the fluid flow, as well as the impeller. The cooling power source can be the same as the sources used for charge air cooling as mentioned in the last paragraph. A secondary flow can flow inside some jackets attached to the walls to cool them down. Moosania et al. [14] used shell cooling for all of the external walls in a centrifugal compressor. A huge improvement in the compressor performance, as well as a noticeable reduction in impeller temperature have been obtained by shell cooling. Lei et al. [15] studied the effect of cooling inside the casing near the back plate on the impeller temperature and found that with an appropriate cooling rate, the impeller temperature can be reduced effectively.
In this study, cooling has been applied on different external walls separately, to compare the effect of cooling on each part. Cooling power has been varied on each wall, and the compressor pressure ratio and efficiency, as well as the impeller temperature have been compared. The cooling walls are shown in Figure 1.

2. Numerical Approach

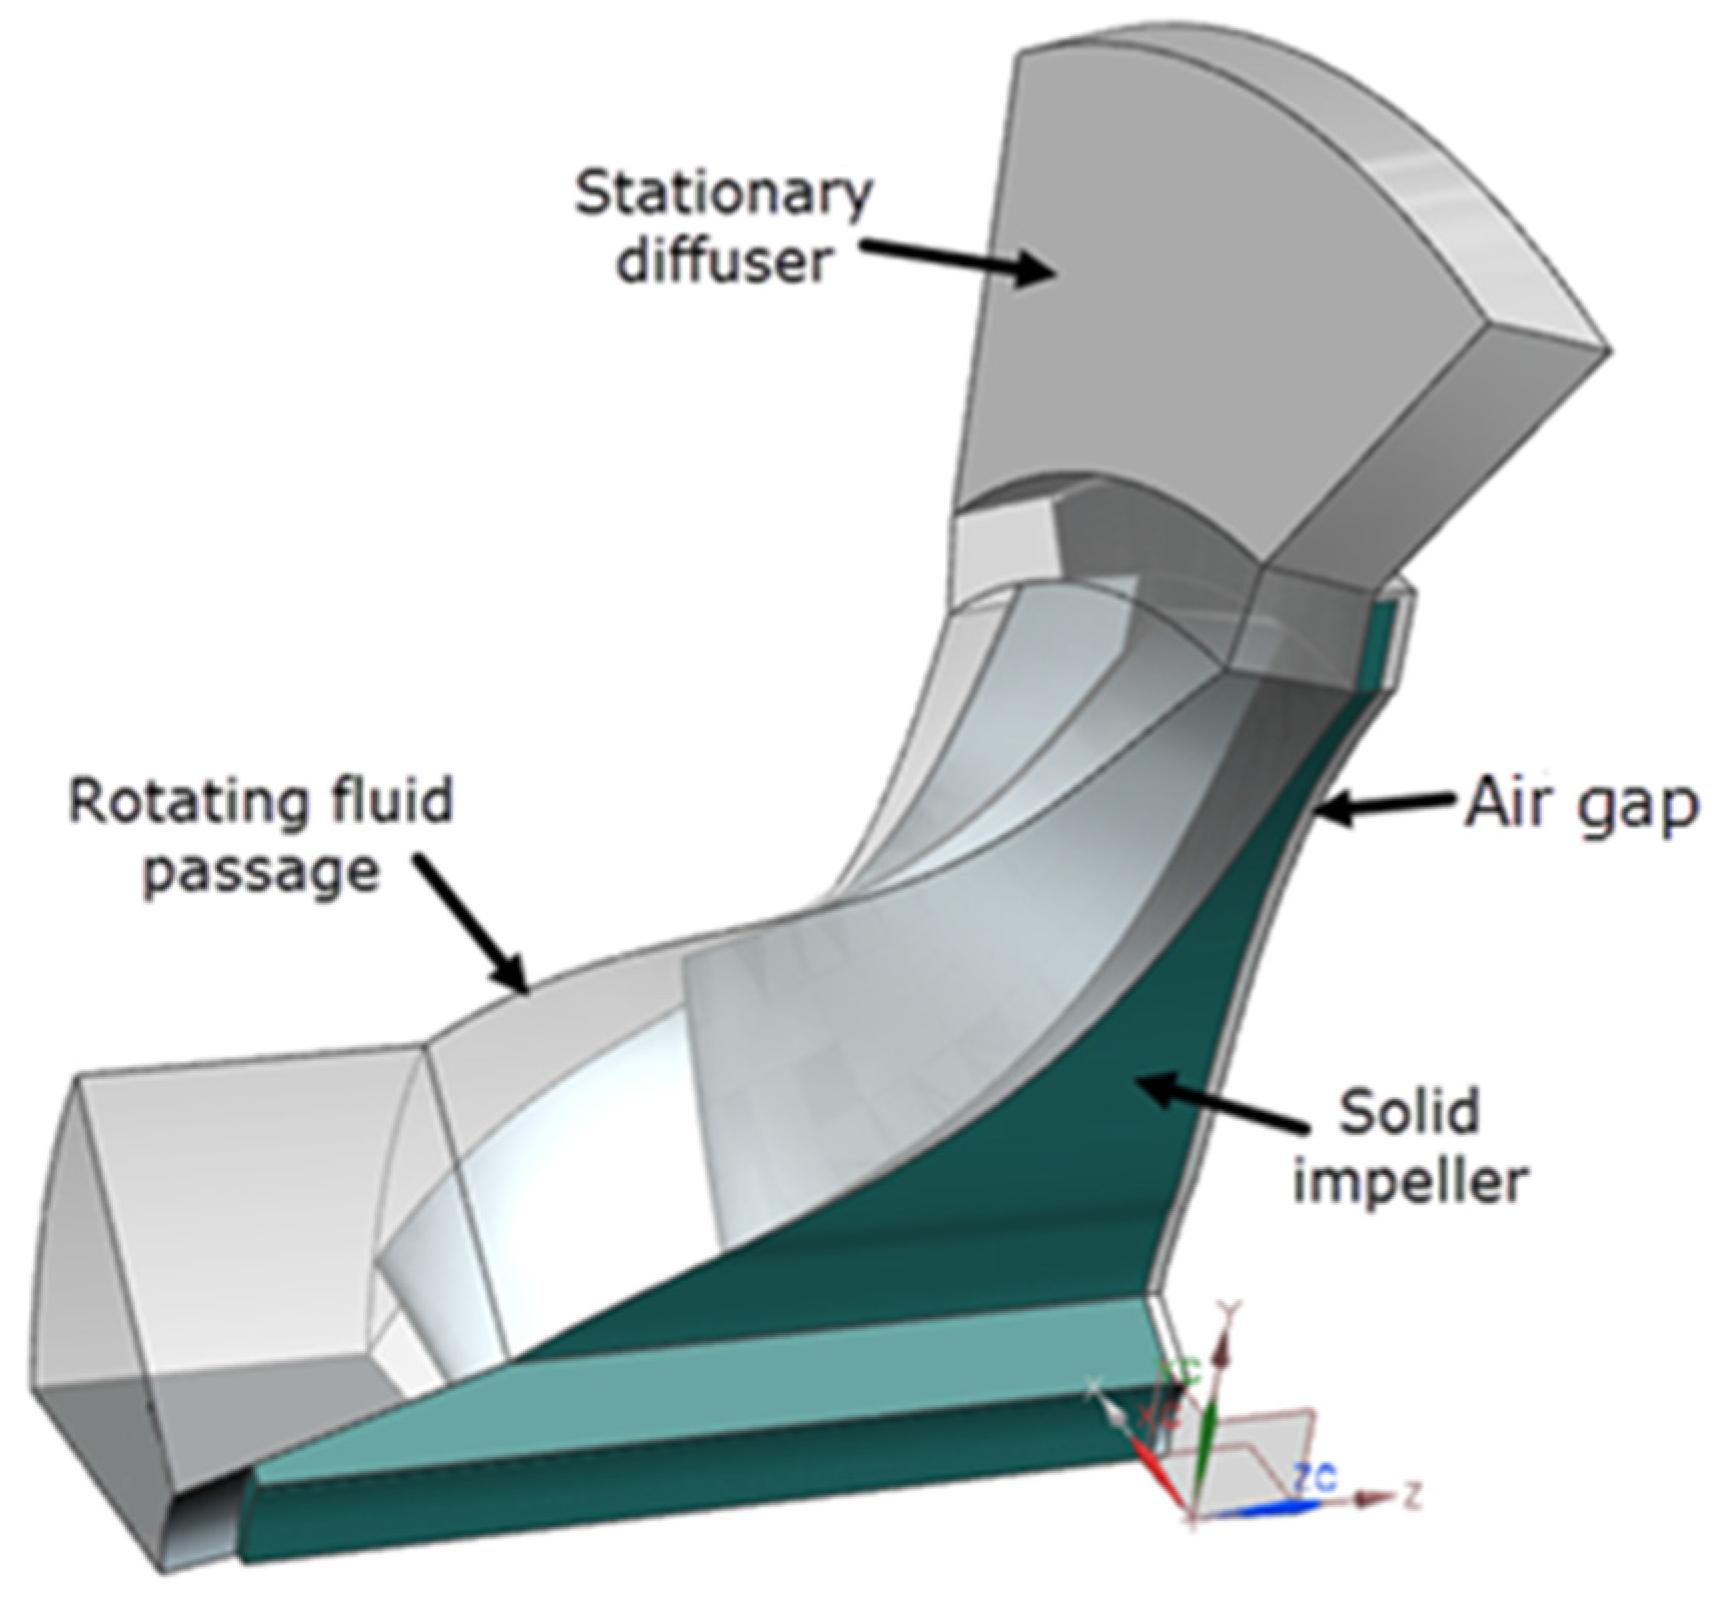
2.1. Compressor Geometry

The compressor blade profile was designed by the author with the parameters shown in Table 1.
The computational domain consists of the solid impeller and the flow passage in the rotating impeller and the stationary diffuser, as illustrated in Figure 2. Due to the rotational periodicity in these parts, only one compartment, including one splitter and one main blade, has been included in the simulation. The air gap was modeled to take into account the heat transfer and heat generation inside the gap.

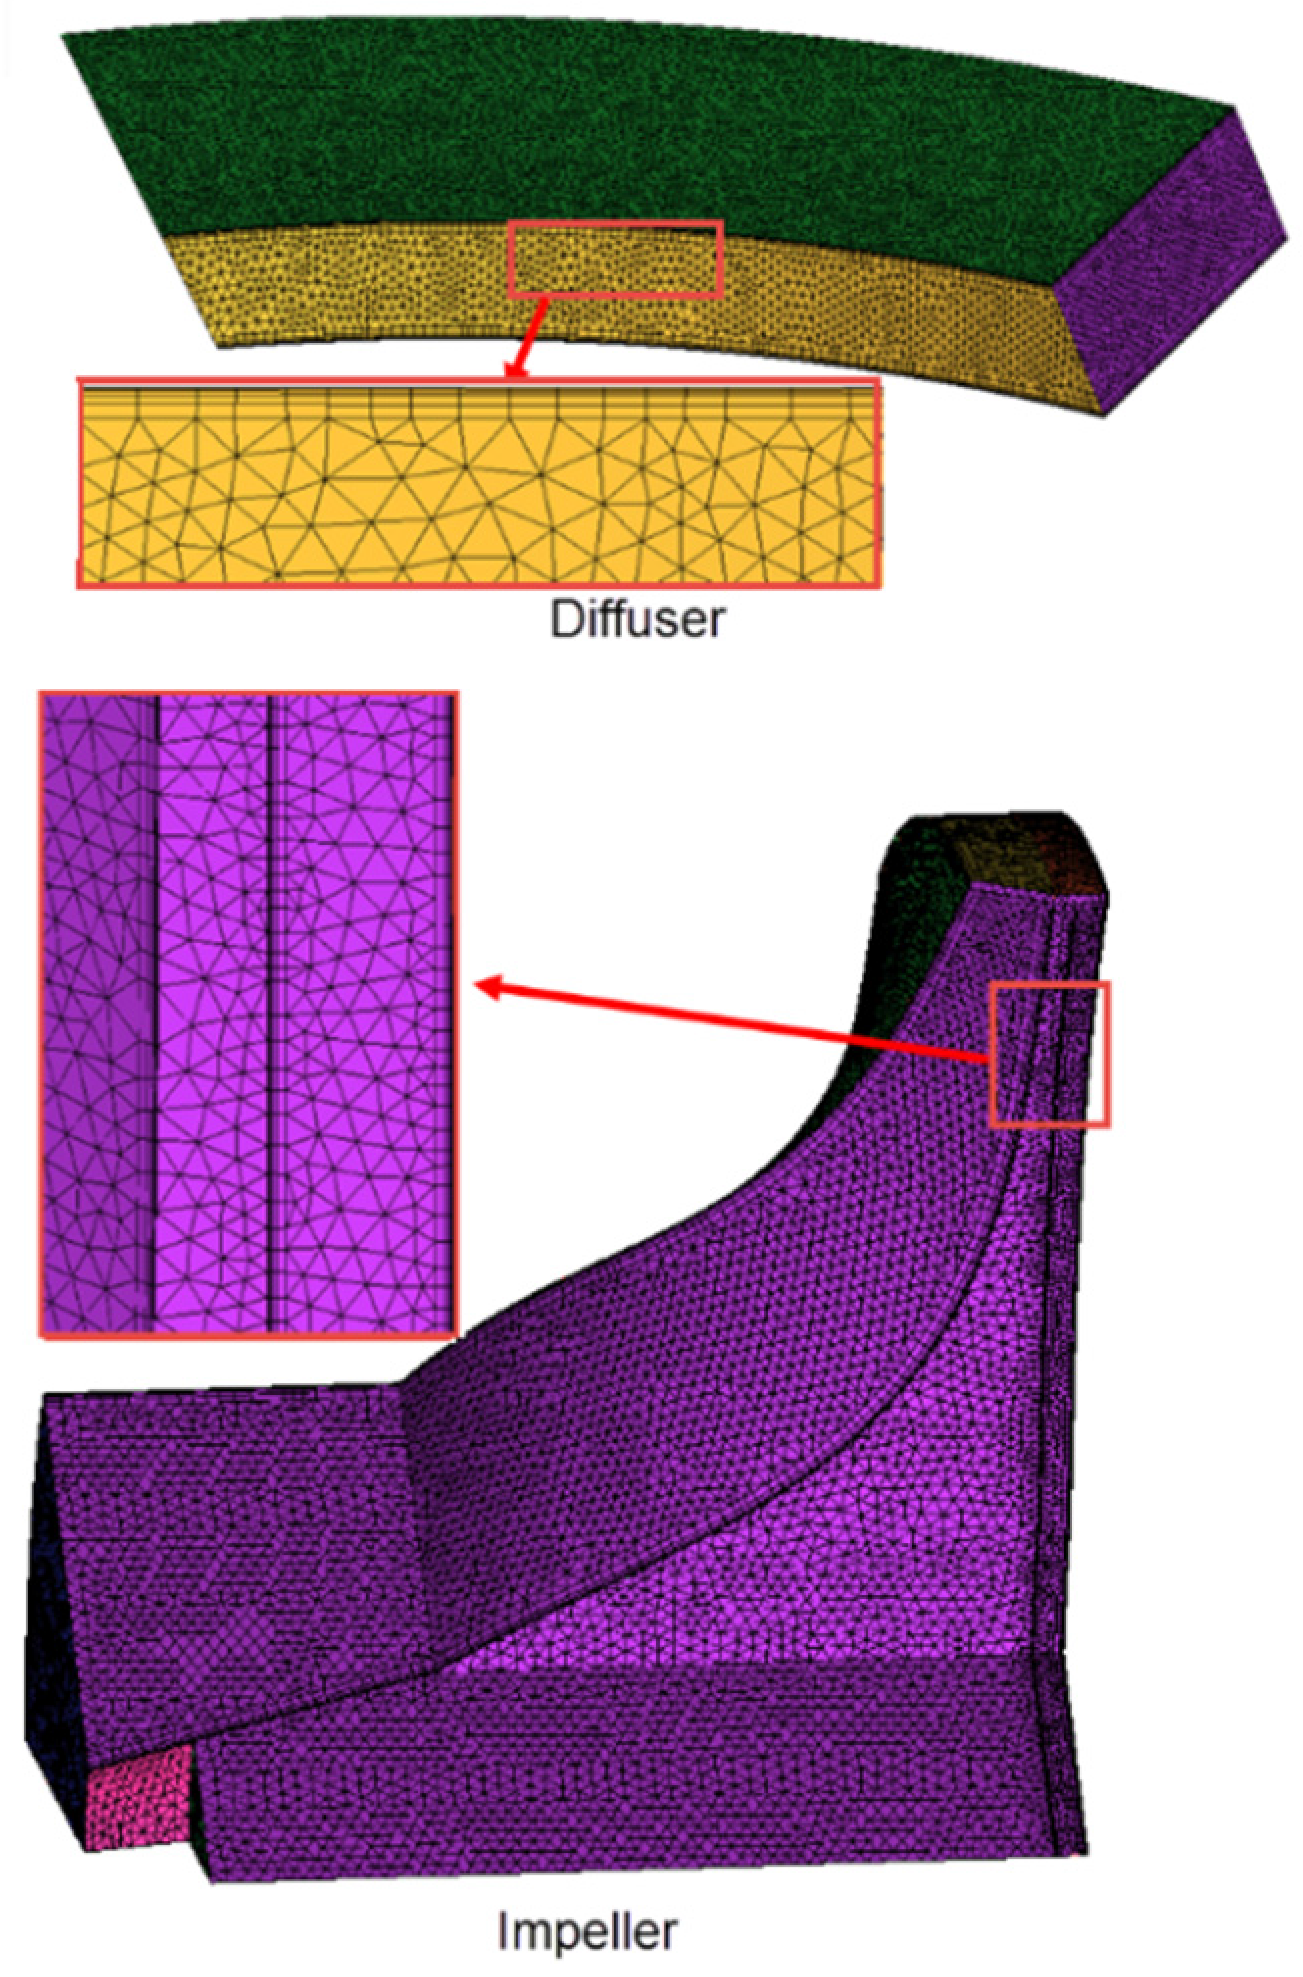
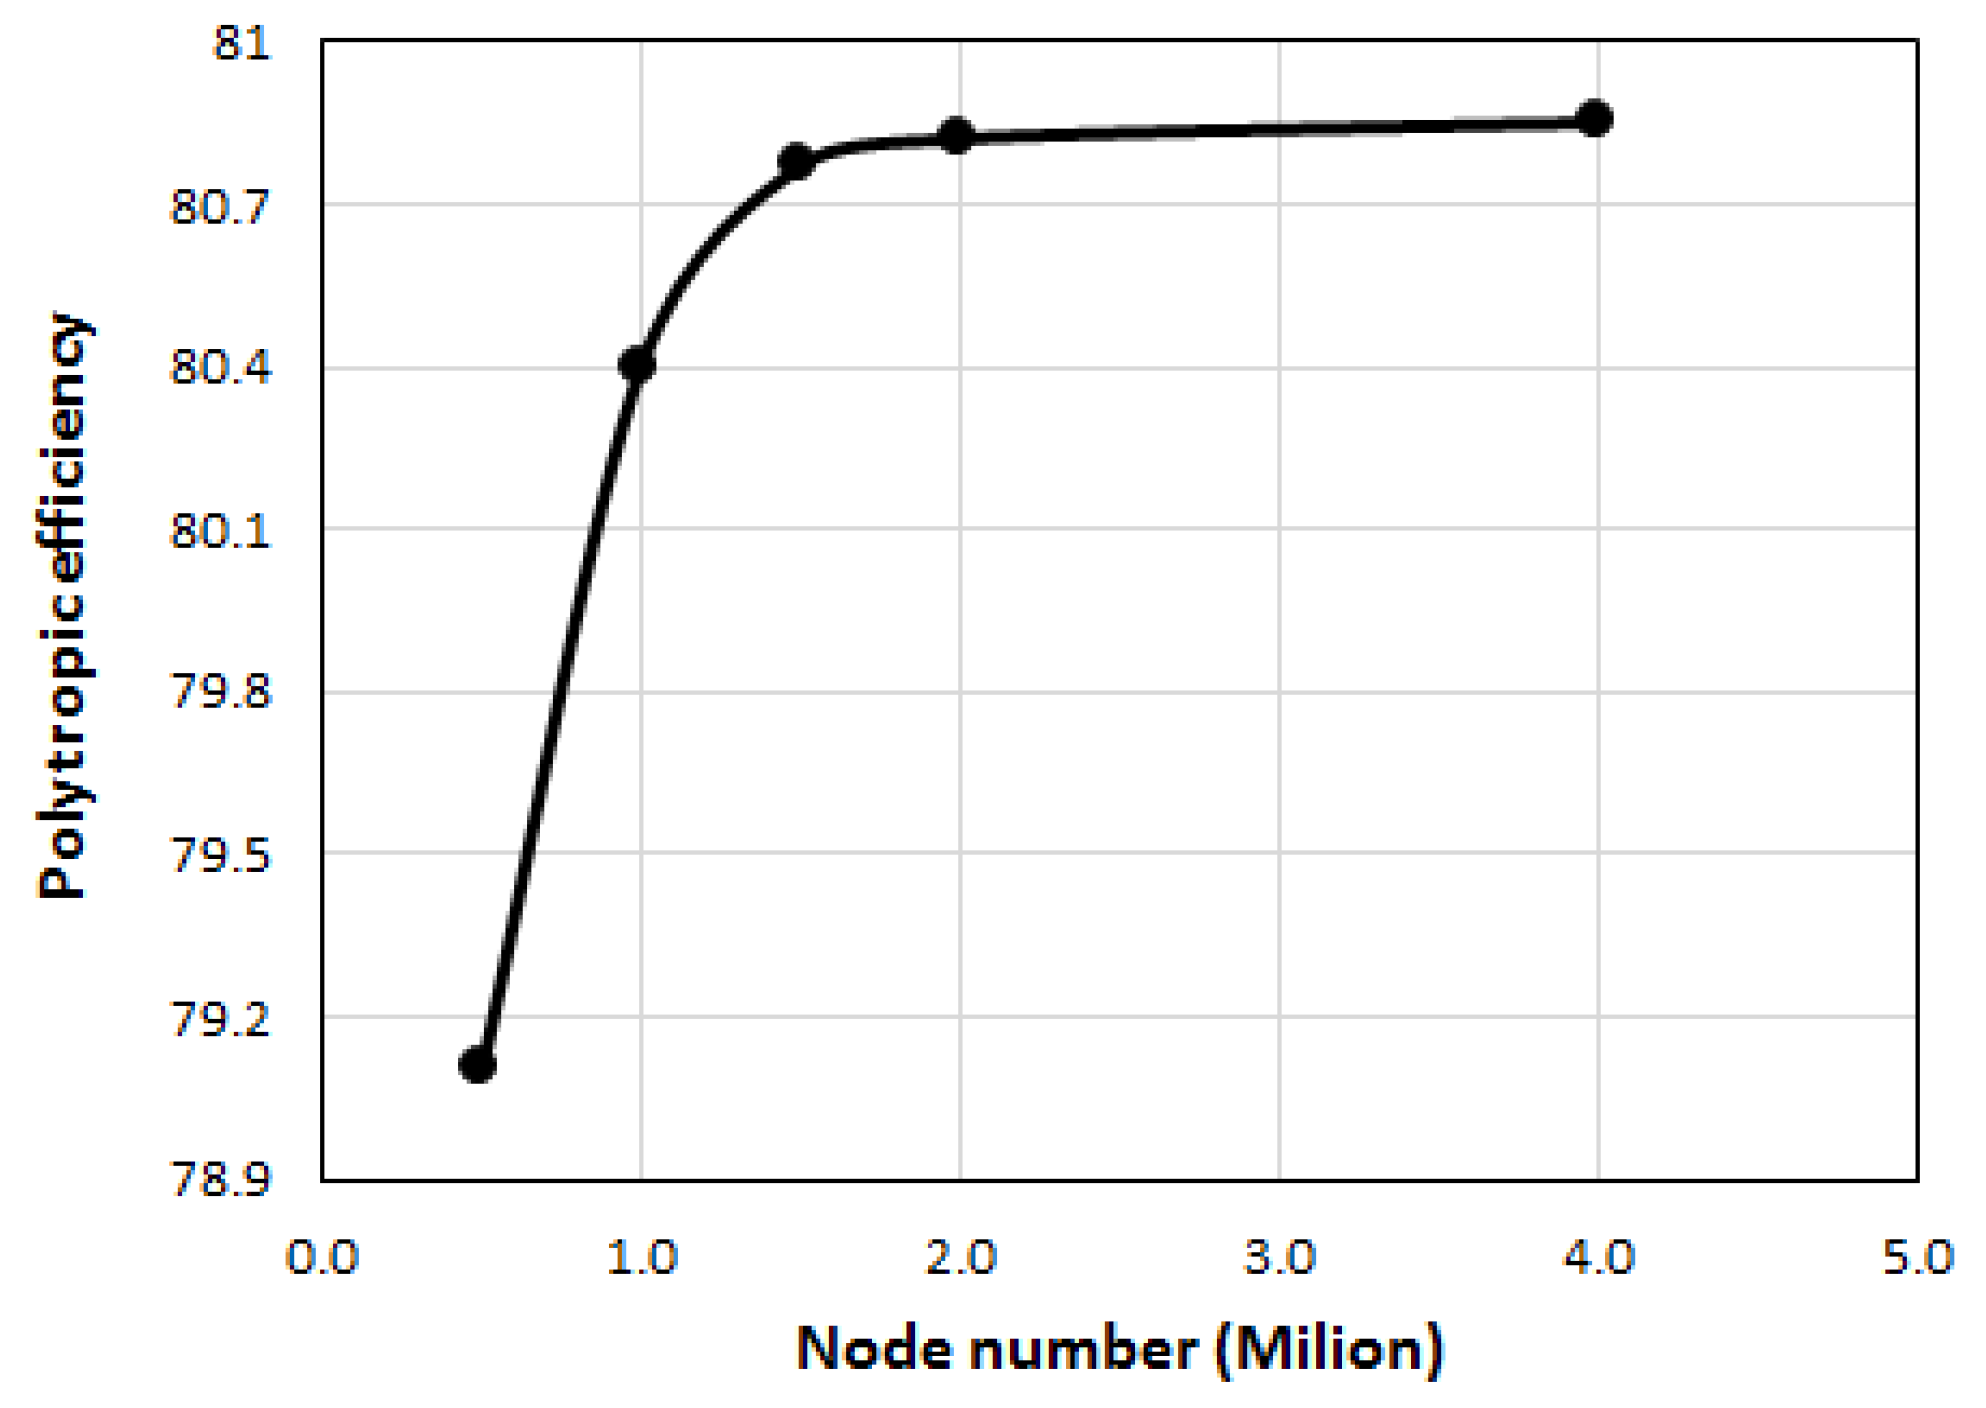
2.2. Grid Generation

A refined tetrahedral grid was created for the flow passage, as shown in Figure 3. Near the walls, a prism mesh with 10 layers and the ratio of 1.8 were created for boundary layer calculations. The first layer height has been chosen to have a y+ < 1. Because of the high velocity gradient in the gap, a mesh with a smaller size was generated in this area. The grid generation was done at the same time for both solid and flow regions, in order to have the same nodes on the fluid-solid interface. This increases the accuracy of the conjugate heat transfer (CHT) calculation [16].
After a grid independence check that gave the results shown in Figure 4, a mesh with about two million nodes was chosen.

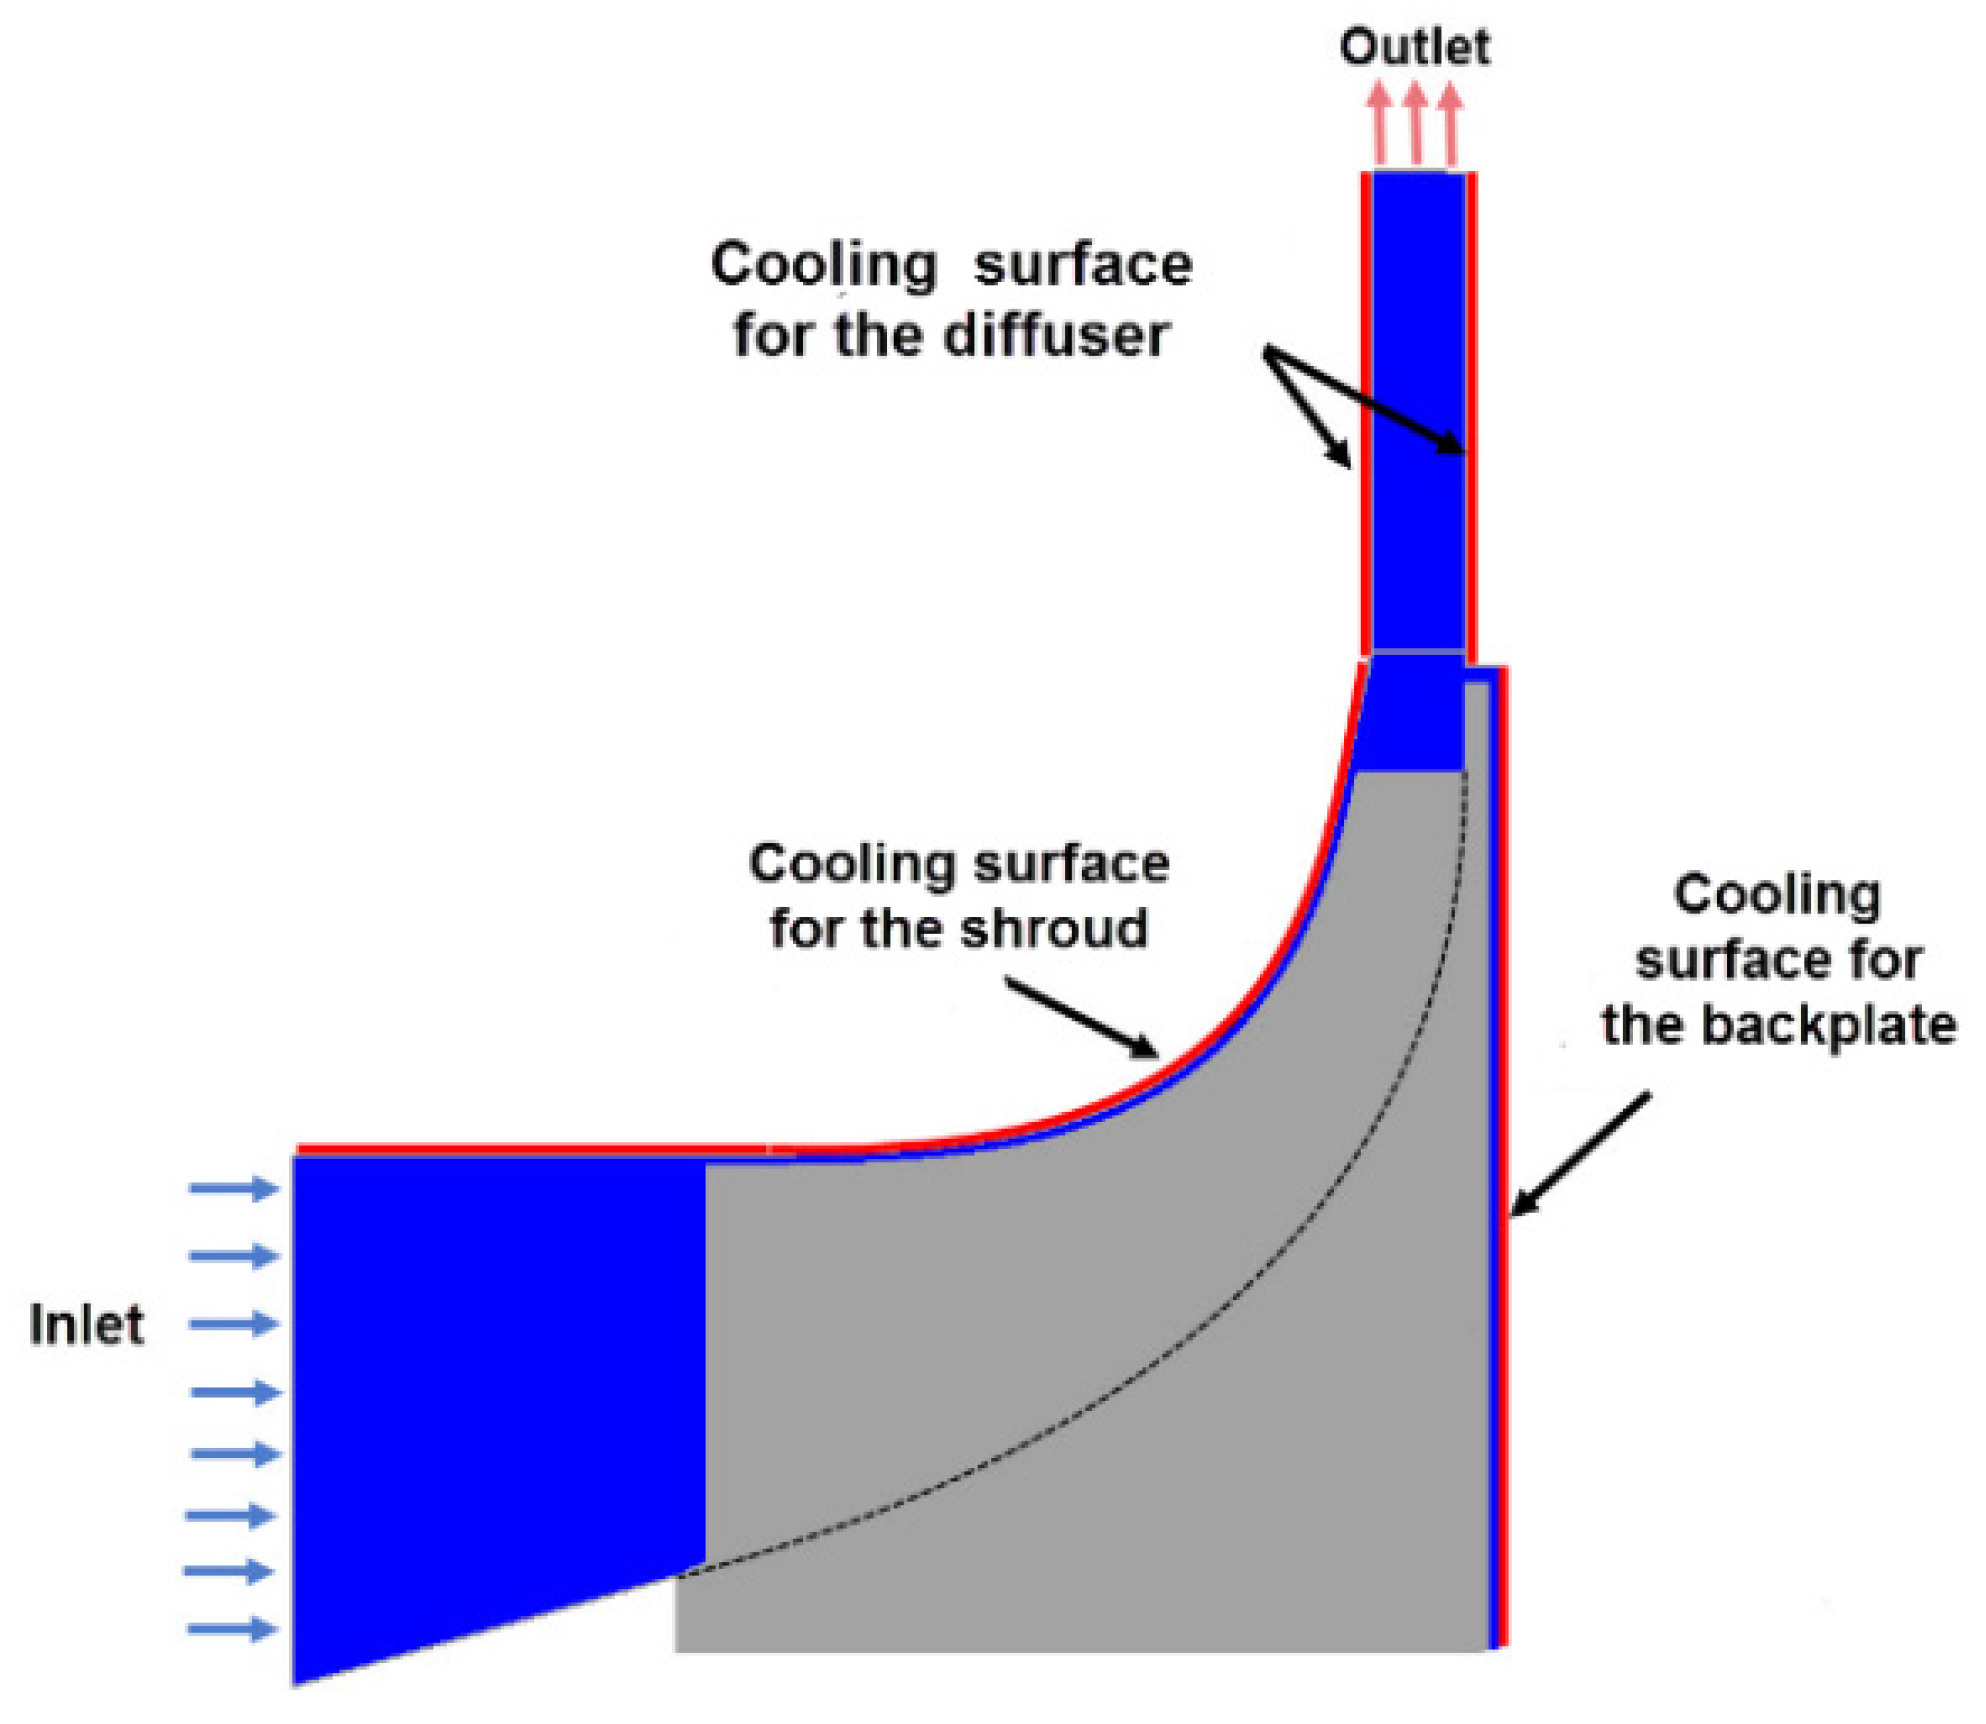
2.3. Boundary Conditions

The inlet boundary condition was a total pressure of 100 kPa, a total temperature of 298.15 K, a turbulence intensity of 5% and axial direction for the flow. The outlet boundary conditions first used the same total pressure as the inlet for the choked condition. Then, the mass flow rate at the outlet was reduced to find other operating points. No-slip wall boundary conditions were applied to all of the walls, and the walls are assumed to be smooth. The steady calculations used in this study and the unsteady phenomenon of the flow has been neglected. The steady calculation is very robust for high speed centrifugal compressor, and based on Figure 5, it still has a good prediction of the real compressor.
In this study, a mixing plane interface was used between the rotating impeller and the stationary diffuser to enable steady calculations. The mixing plane interface transfers the circumferential average of the flow quantity in each span to the other region.
Compressor solid parts have a high thermal conductivity. Furthermore, the high rotational speed of the impeller produces a high convection coefficient. The radiational heat transfer then can be neglected compared with the high conduction and convection in the compressor [17,18].
The centrifugal compressor performance was evaluated for different cooling powers. The boundary condition applied to cooling walls was constant heat flux, which has been calculated from the equation below:
q = q i / A i
In this equation, q” is the heat flux, and q i is the cooling power on different walls (i.e., the diffuser, back plate and shroud). A is the surface corresponding to each cooling wall.

2.4. Numerical Methodology

The CFX commercial solver was used to solve the steady-state Reynolds Average Navier-Stokes (RANS) equations. The air flow inside the compressor is assumed to be compressible. The ideal gas equation has been used. Although the compressor has a high outlet pressure, it is far below its critical pressure. Furthermore, the air temperature increases several times more than the critical temperature. Based on compressibility diagram, the ideal gas assumption still has a good prediction of the air properties.
p = ρ R T
The flow inside a high speed compressor is fully turbulent. Thus, the SST (Shear Stress Transport) model was used for the turbulence closure in the RANS equations. This model combines the accuracy of the k-ω model for boundary layer predictions in high adverse pressure gradient flows and the stability of the k-ε model for the main flow. Therefore, the SST model offers a good balance of accuracy and stability [19]. This turbulence model also has been found to give the best results for conjugate calculations [20].

2.4.1. Advection Discretization Method

In the beginning of the simulation, the first order upwind method was used for the advection terms because of its better convergence and stability. The High Resolution advection scheme in the CFX package was then used for the final results due to the false diffusion in the first order upwind method.
φ i p = φ u p + β φ . Δ r
The High Resolution scheme uses a special nonlinear recipe for β at each node, computed to be as close to one as possible without introducing new extrema. The advective flux is then evaluated using the values of β and φ from the upwind node. The choice of β = 1 leads to formally second order-accurate discretization in space.

2.4.2. Conjugate Heat Transfer

The conjugate heat transfer (CHT) method was used to calculate the temperatures in the solid impeller and the solid casing. The CHT method gives accurate predictions of the temperatures with low computational cost, and the accuracy of this method has been examined by different authors [21]. The CHT method uses the same code to solve for both the solid and fluid temperatures with only the energy equation solved inside the solid body.
( ρ U s h ) = ( λ T ) + S E
where h is the enthalpy, ρ is the density and λ is the thermal conductivity of the solid. Us is the velocity of the solid.

2.5. Numerical Model Validation

The experimental data reported by Krain et al. [22] used to validate the numerical model. Computational results of the compressor pressure ratio have been compared with the experimental data in Figure 5.
In low speed and low pressure ratio conditions (N = 60%), numerical results agree well with the experimental data. However, with increasing the pressure ratios and speeds (N = 80% and 100%), numerical simulation gives a lower value compared with the experimental data, but the trend is the same. The reason is the boundary condition on the outside walls. It has been set to be adiabatic in the numerical model, while in the experiment, it is very hard to control the heat transfer to surroundings, especially in a high pressure ratio. Moosania et al. [14] reported that in a compressor, heat transfer to the surroundings considerably increases the compressor performances, especially in a high pressure ratio.

3. Results and Discussion

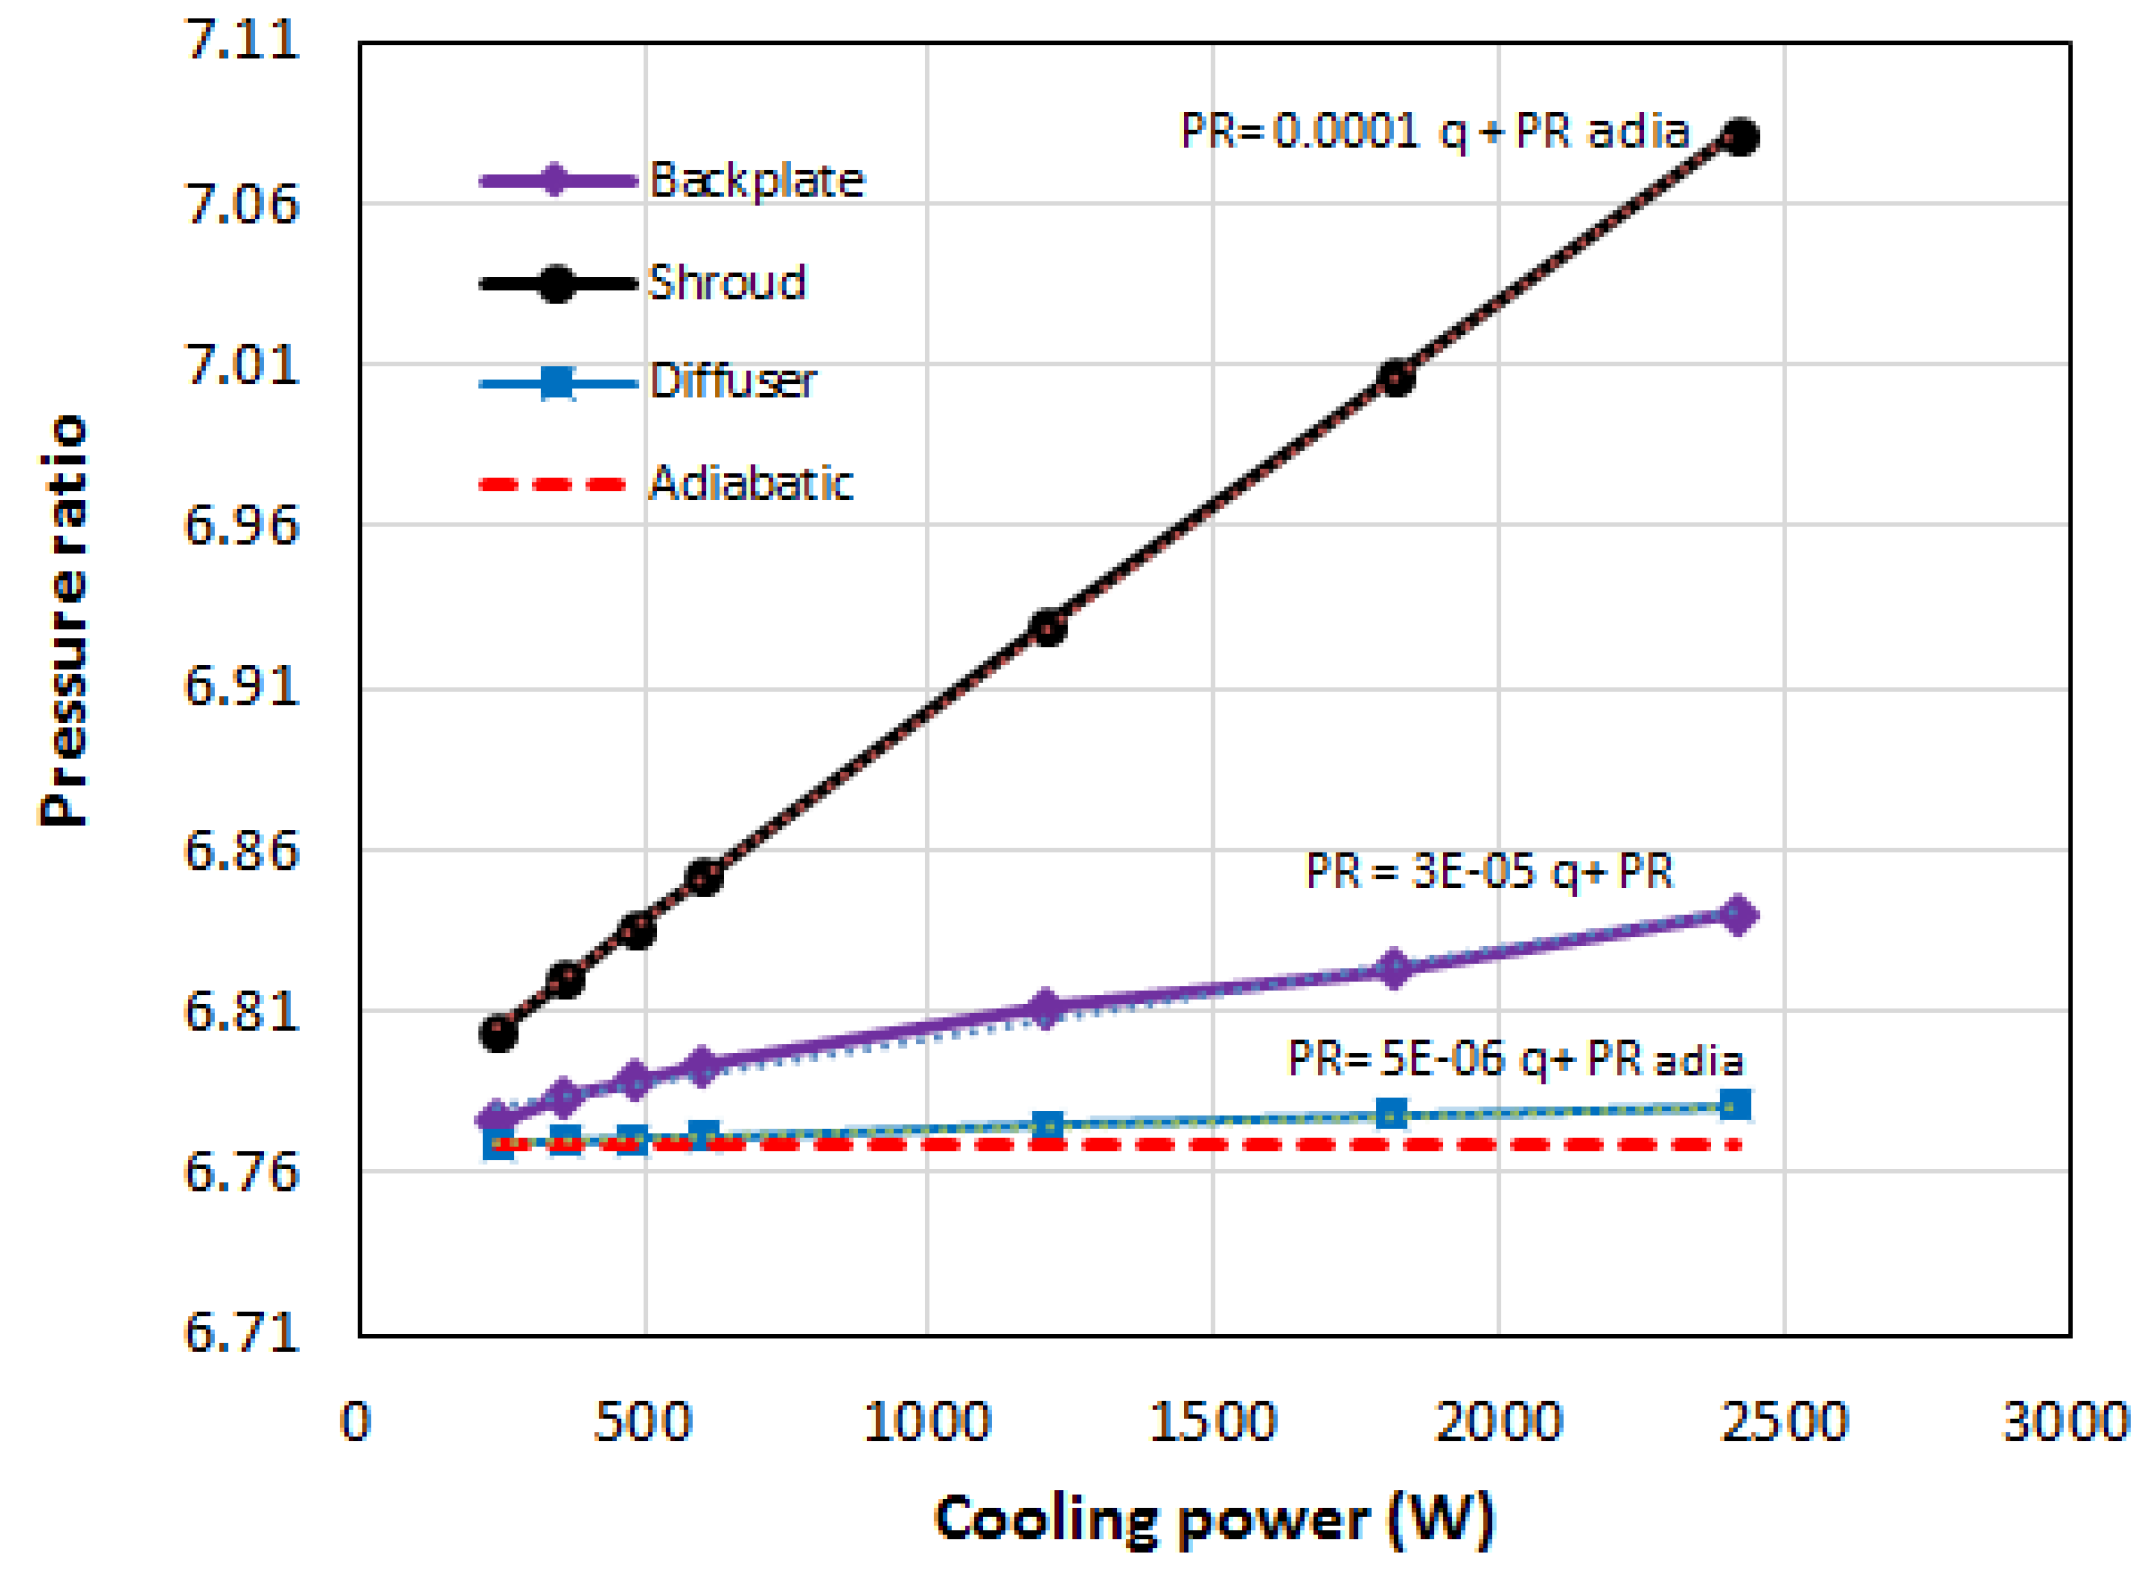
3.1. Effects on the Pressure Ratio

Figure 6 illustrates the compressor total pressure ratio by cooling on different parts with varied cooling powers. The dashed line represents the pressure ratio for the adiabatic compressor, which is a constant value of 6.77. The operating point for all of the result is the design point.
Based on Figure 6, shroud cooling increases the compressor pressure ratio the most in all cooling powers. By increasing the cooling power on the shroud, the pressure ratio increases with the largest slope. Cooling power of 500 W on the shroud increases the compressor pressure ratio from 6.77 to 6.84, which is about 1%. By intensifying the cooling power to 2400 W, the pressure ratio increases to 7.08, which is about 4.6%. Cooling power of 2400 W can be achieved by passing cool water flow over fins attached to the outside walls on the casing.
This result shows that in order to increase the performance of the compressor by cooling, the first part that should be considered is the shroud. On the other side, any heat flow from external or internal source to the shroud reduces the compressor performance effectively. Therefore, the heat transfer to this part should be prevented. Especially for a turbocharger installed in a car, the compressor shroud has to be insulated to prevent the heat flow from the engine and other heat sources.
Back plate cooling increases the pressure ratio much less than the shroud cooling, but still more than the diffuser cooling. With the cooling power of 500 W, the compressor pressure ratio increases to 6.78, which is about 0.15%. Increasing the cooling power to 2400 W gives a pressure ratio up to 6.84, which is about 1.03%.
Cooling the shroud and back plate reduces the air flow temperature inside the impeller. This is where the compression process happens. The shroud cooling reduces the main flow temperature directly with the high speed flow crossing over the shroud. The back plate cooling reduces the air temperature inside the gap. This reduces the impeller temperature, and this slightly reduces the main flow temperature. The temperature contour in a mid-plane, along the stream-wise direction, is illustrated in Figure 7.
Cooling the shroud and back plate improves the compression process by changing the thermo-dynamical path. As is shown in Figure 8, in a cooled compression, the final process has a higher pressure compared with the adiabatic compression.
Diffuser cooling has a small improvement on the pressure ratio. Velocity change, inside a stream line in the diffuser, where there is no work input, can be computed using:
d u = d p / ρ u
It has been proven by Broadbent [23] that heating increases the velocity. Cooling, on the other hand, should decelerate the flow. This means, for cooling, du < 0, and dp has to be positive in Equation (5). This is why cooling in the diffuser increases the pressure ratio.
The work input to the compressor varies with cooling on different parts. This is because of the change in the velocity triangle at the impeller’s trailing edge. It can be seen that shroud cooling has the highest increase in working input. However, even with the same work input as the adiabatic compressor, shroud cooling will result in a higher pressure ratio because of improved flow and higher efficiency (Table 2).

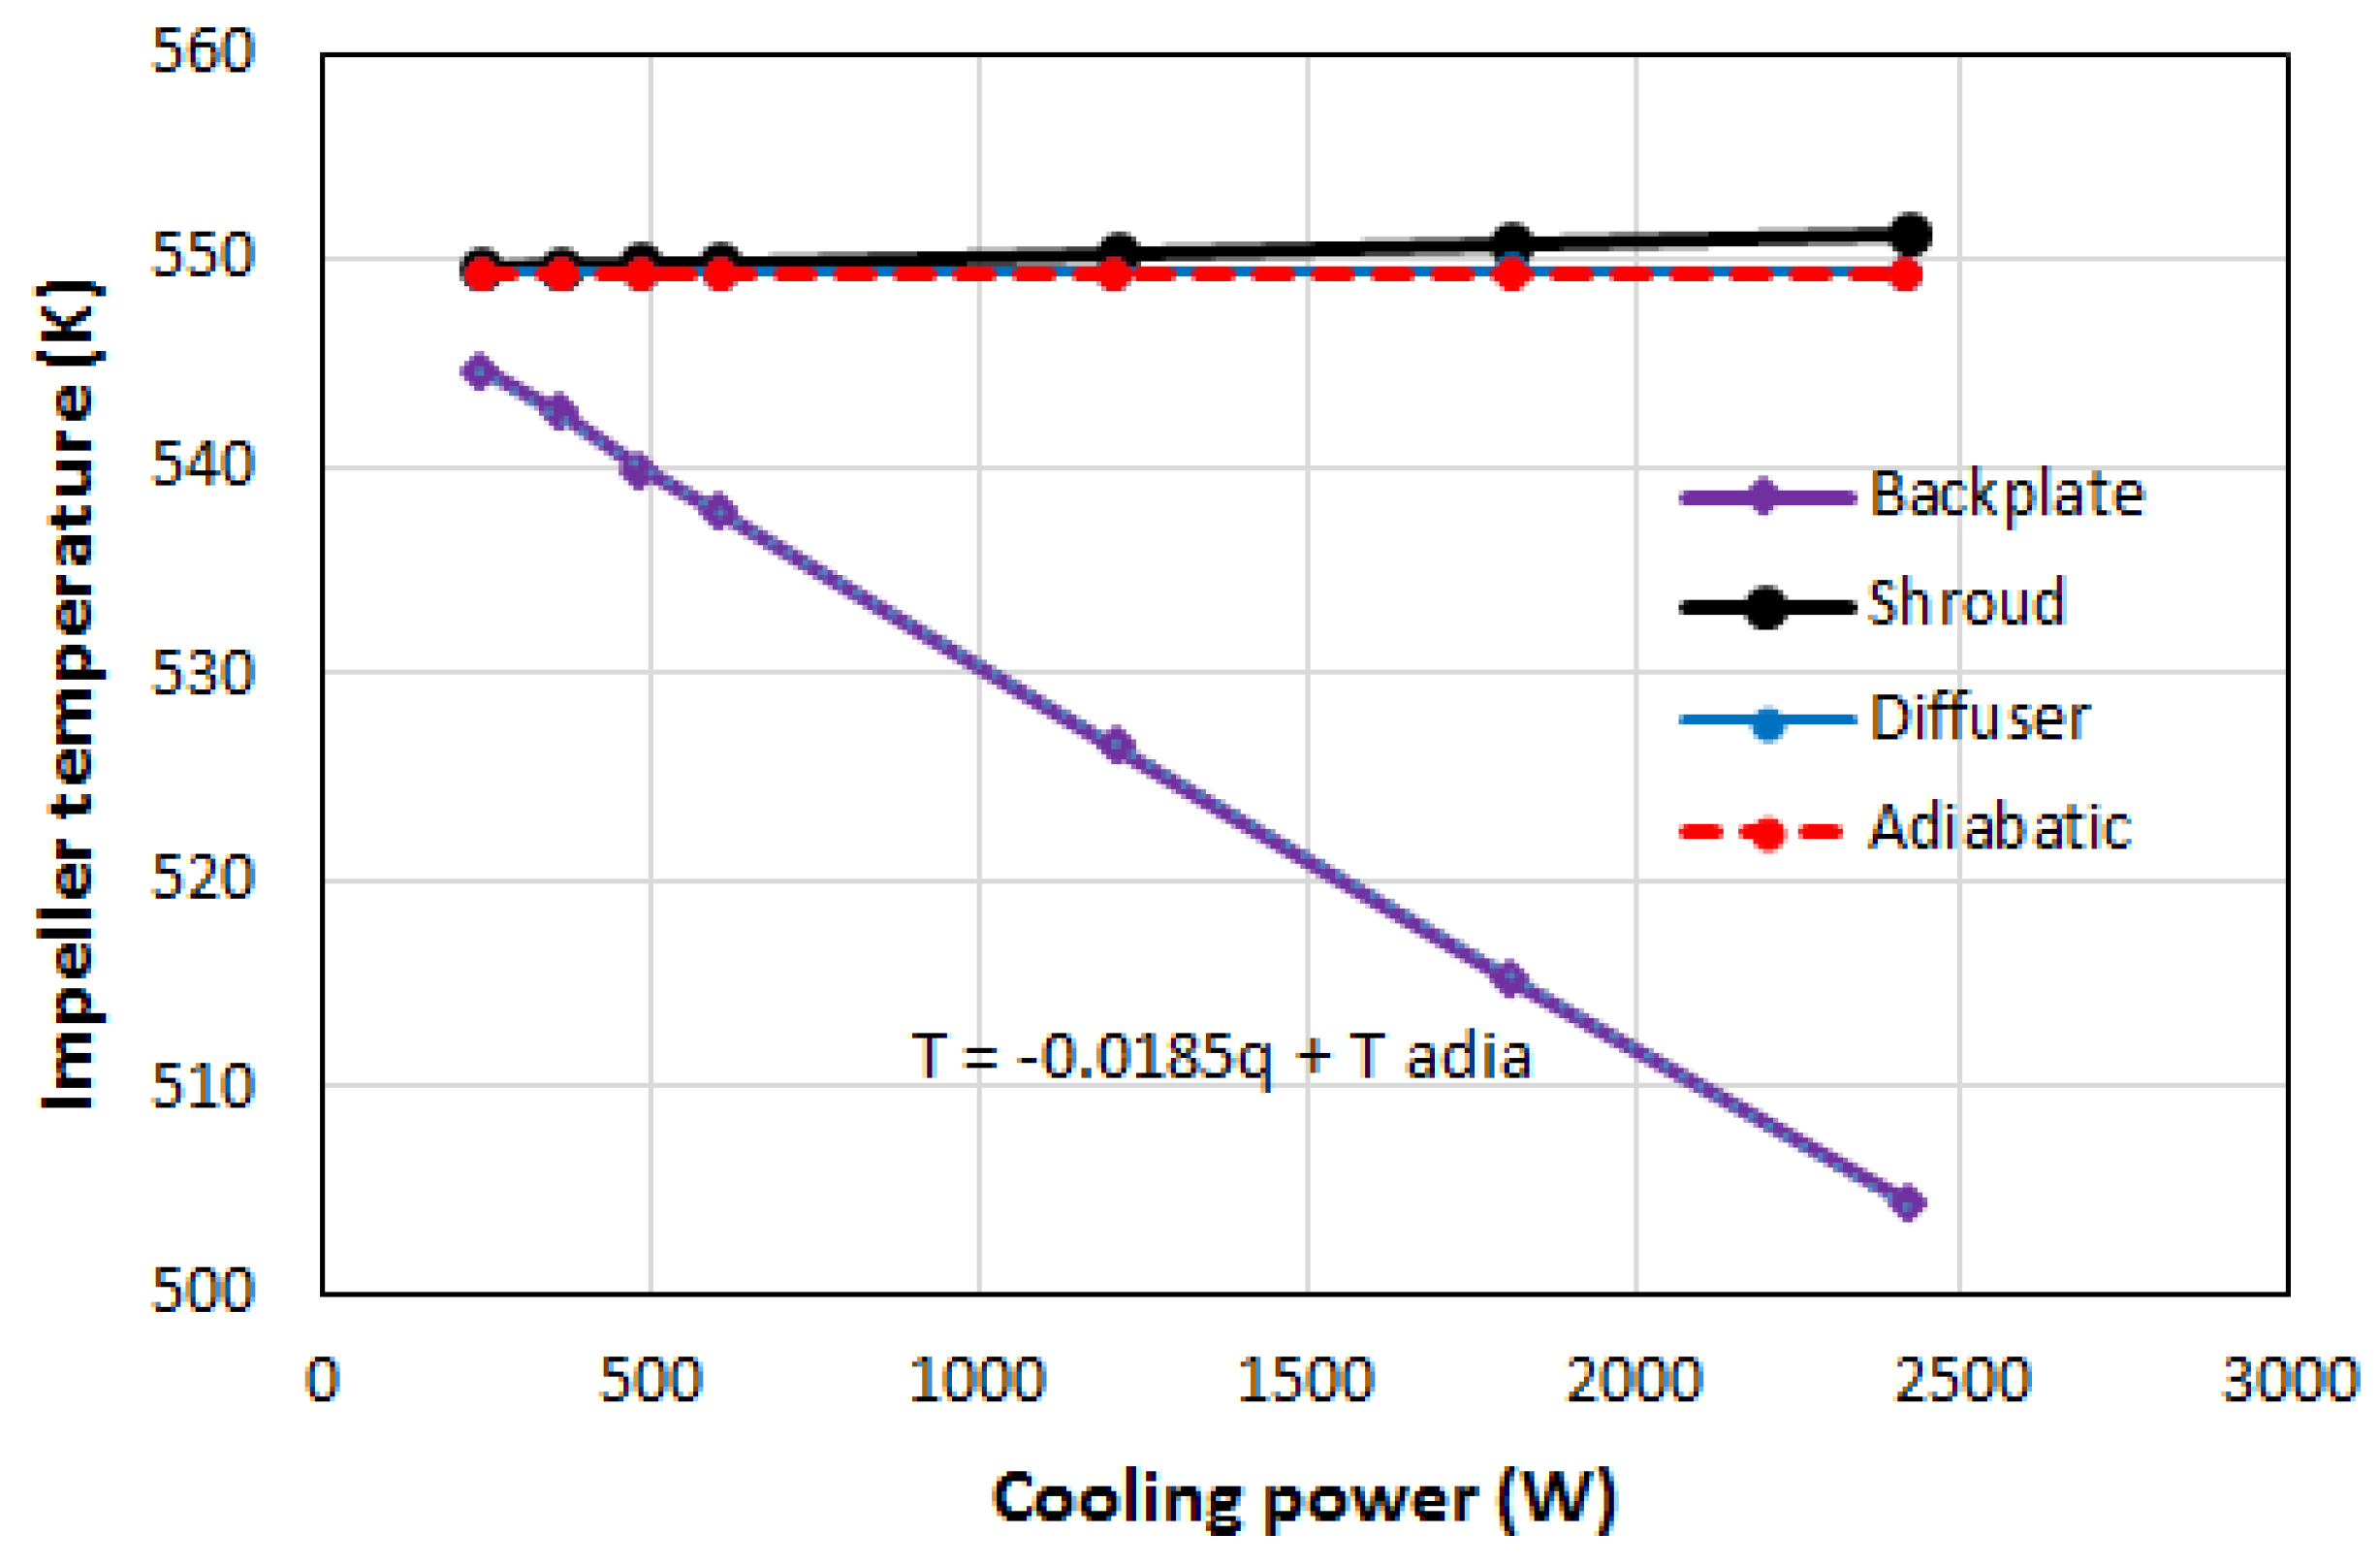
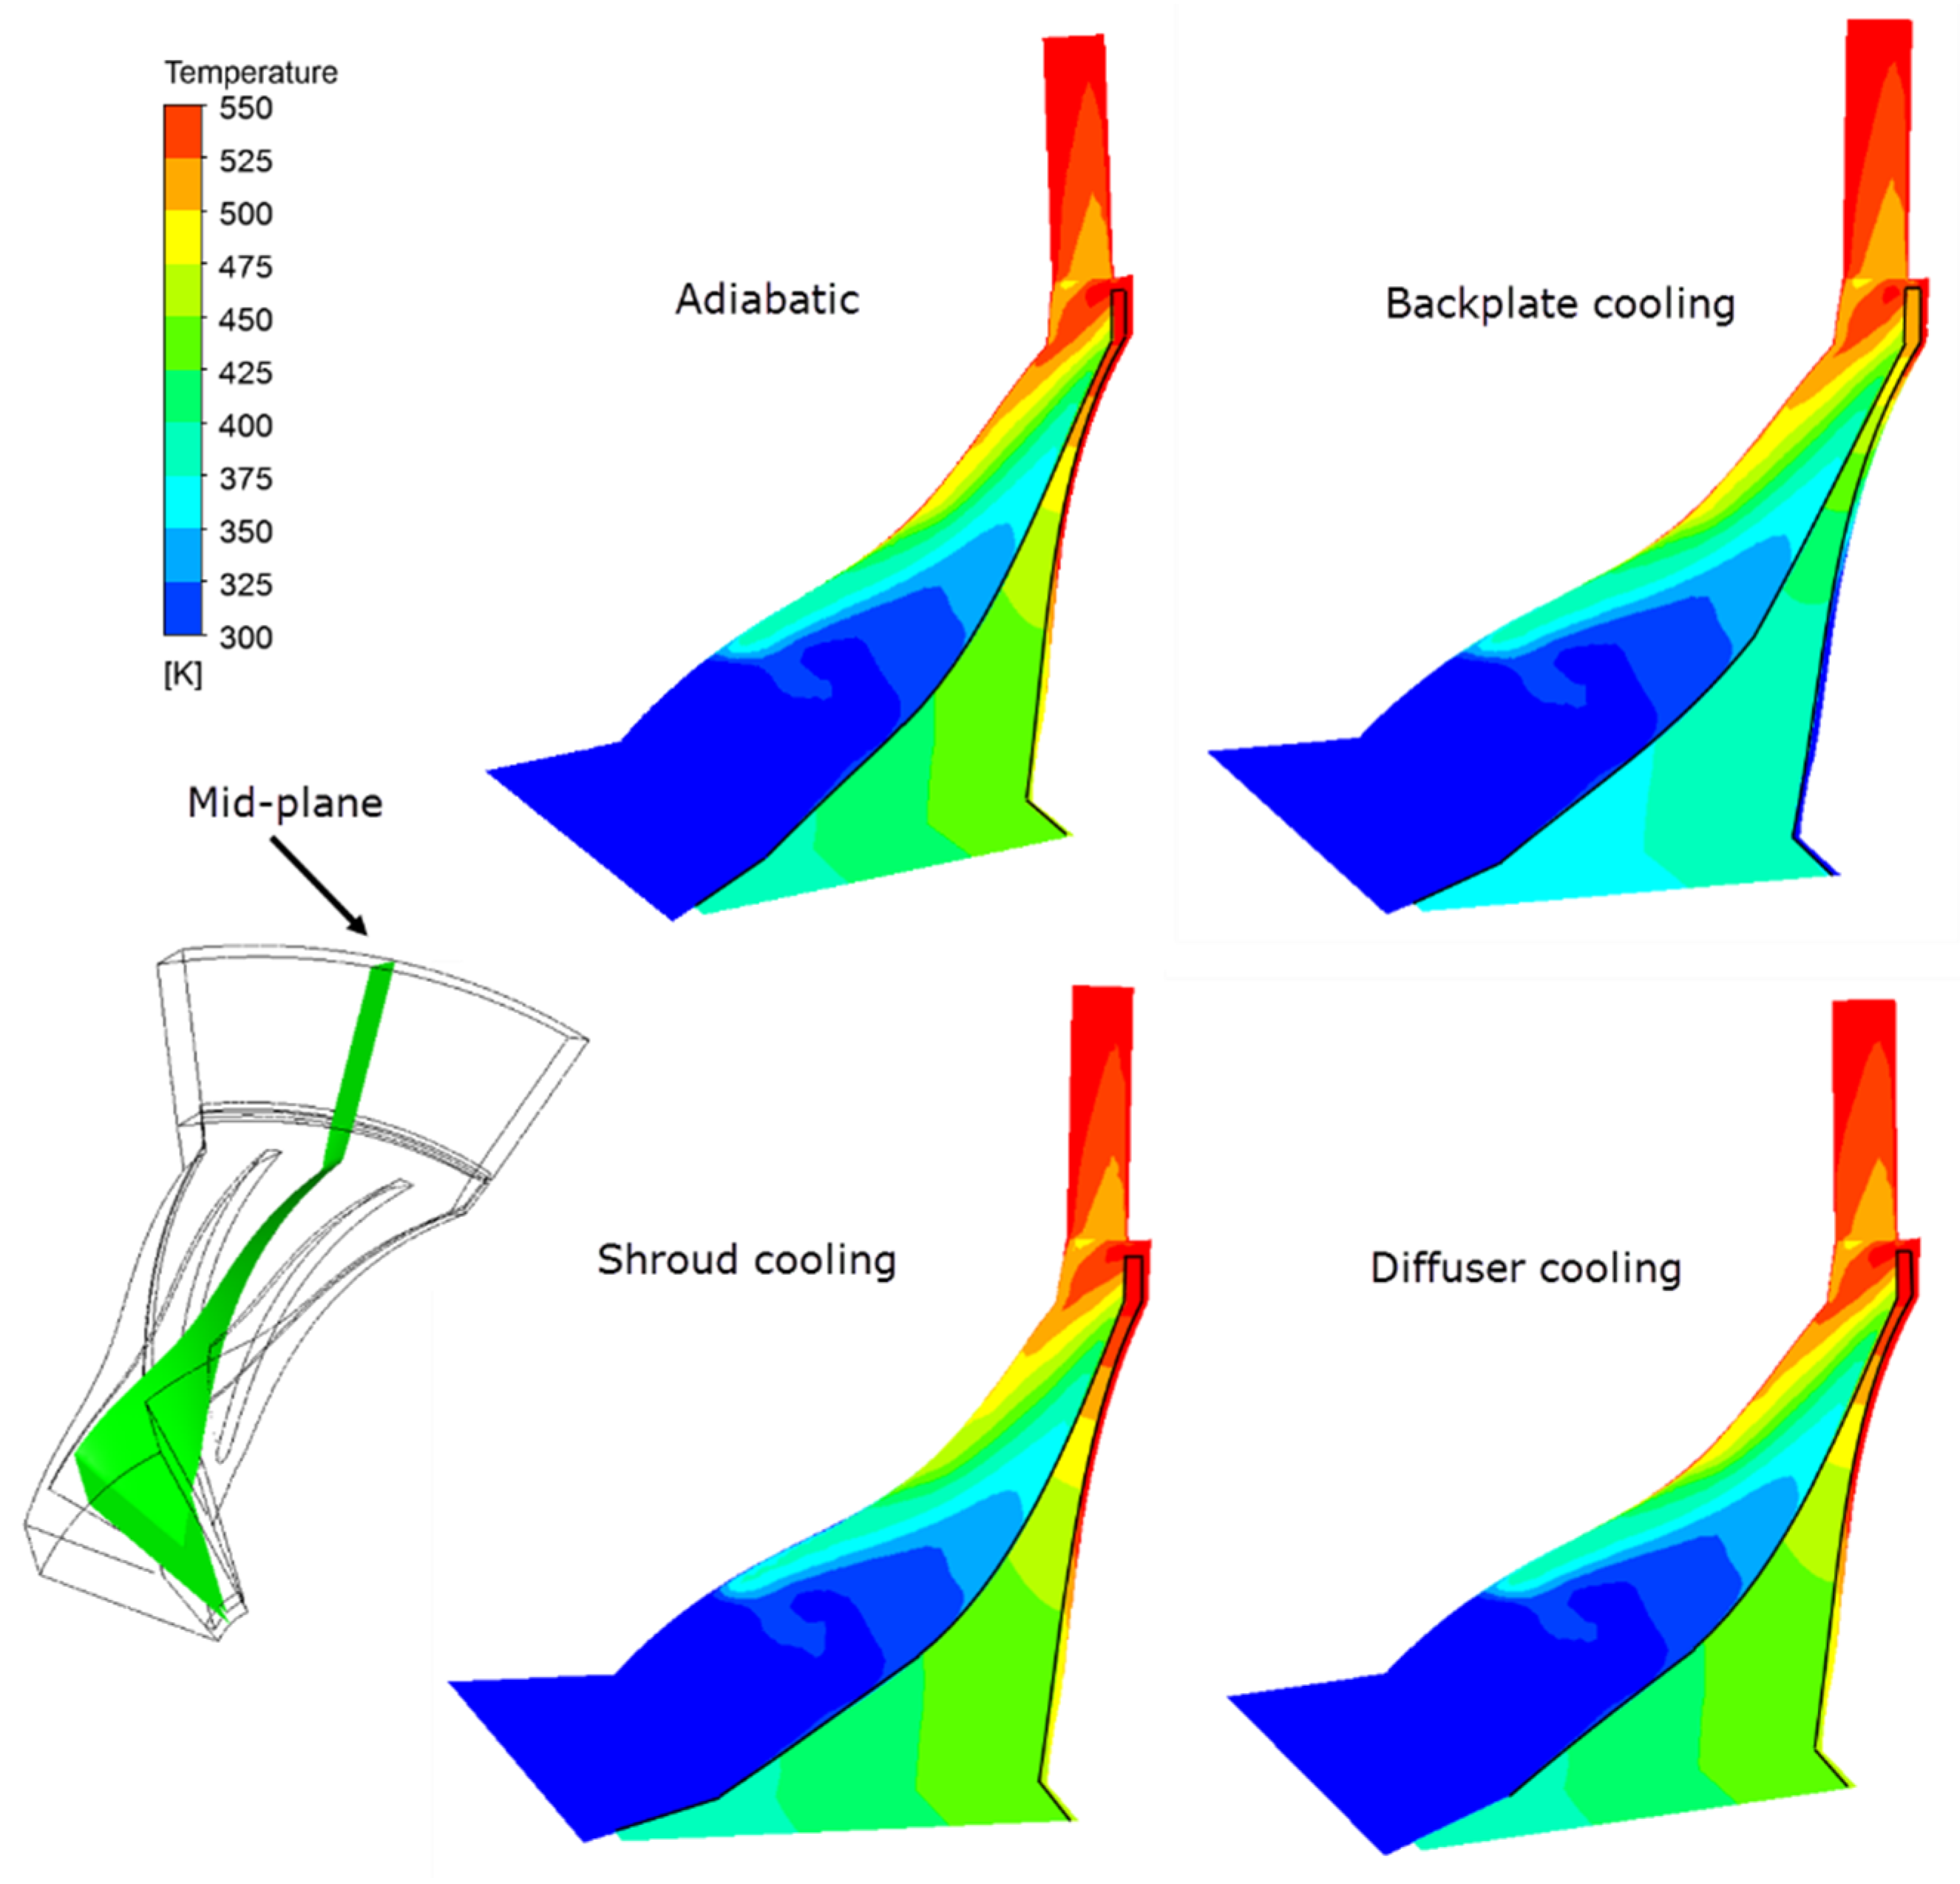
3.2. Effects on the Impeller Temperature

Impeller temperature is a critical parameter for the compressor reliability. The impellers in centrifugal compressors are generally made of aluminum. Aluminum loses its strength at temperatures higher than 500 K. Therefore, this is very important to control the impeller temperature, especially in the area with high stress. The impeller maximum temperatures, with cooling on different walls, are shown in Figure 9.
Back plate cooling reduces the impeller temperature the most, while shroud and diffuser cooling do not have any effect on the impeller temperature. Shroud cooling slightly increases the impeller temperature. This is because the shroud cooling considerably increases the pressure ratio and the flow temperature. Meanwhile, the flow temperature near the blade tip is reduced by shroud cooling, as shown in Figure 7. The convective heat transfer coefficient is very high at the tip clearance due to the high velocity of the flow. The impeller losses heat at the tip and gets heat from the flow with higher temperature. As a result of these two heat transfers, one to the impeller and one from the impeller, there is a small increment in solid impeller temperature.
Diffuser cooling does not have any effect on the impeller temperature because there is no convection between cooled down flow inside the diffuser and the impeller. With 500 W of cooling power on the back plate, the impeller reduced from 549.4 K to 539.88 K. By intensifying the cooling power to 2400 W, impeller temperature drops to 504.5 K. Roughly by each 500 W of extra cooling power on the back plate, the impeller temperature reduces by 10 K.
Temperature contours in the compressor with cooling on different parts are demonstrated in Figure 7. Back plate cooling reduces the temperature of the air inside the gap area. The high rotational speed of the impeller induces a high convective heat transfer on the impeller back face. By reducing the air gap temperature, the impeller temperature will be reduced.
Shroud cooling considerably increases the pressure ratio and the flow temperature. Meanwhile, the flow temperature reduces by losing heat to the cooling wall. As a result, based on Figure 10, there is a negligible increment in solid impeller temperature by shroud cooling.

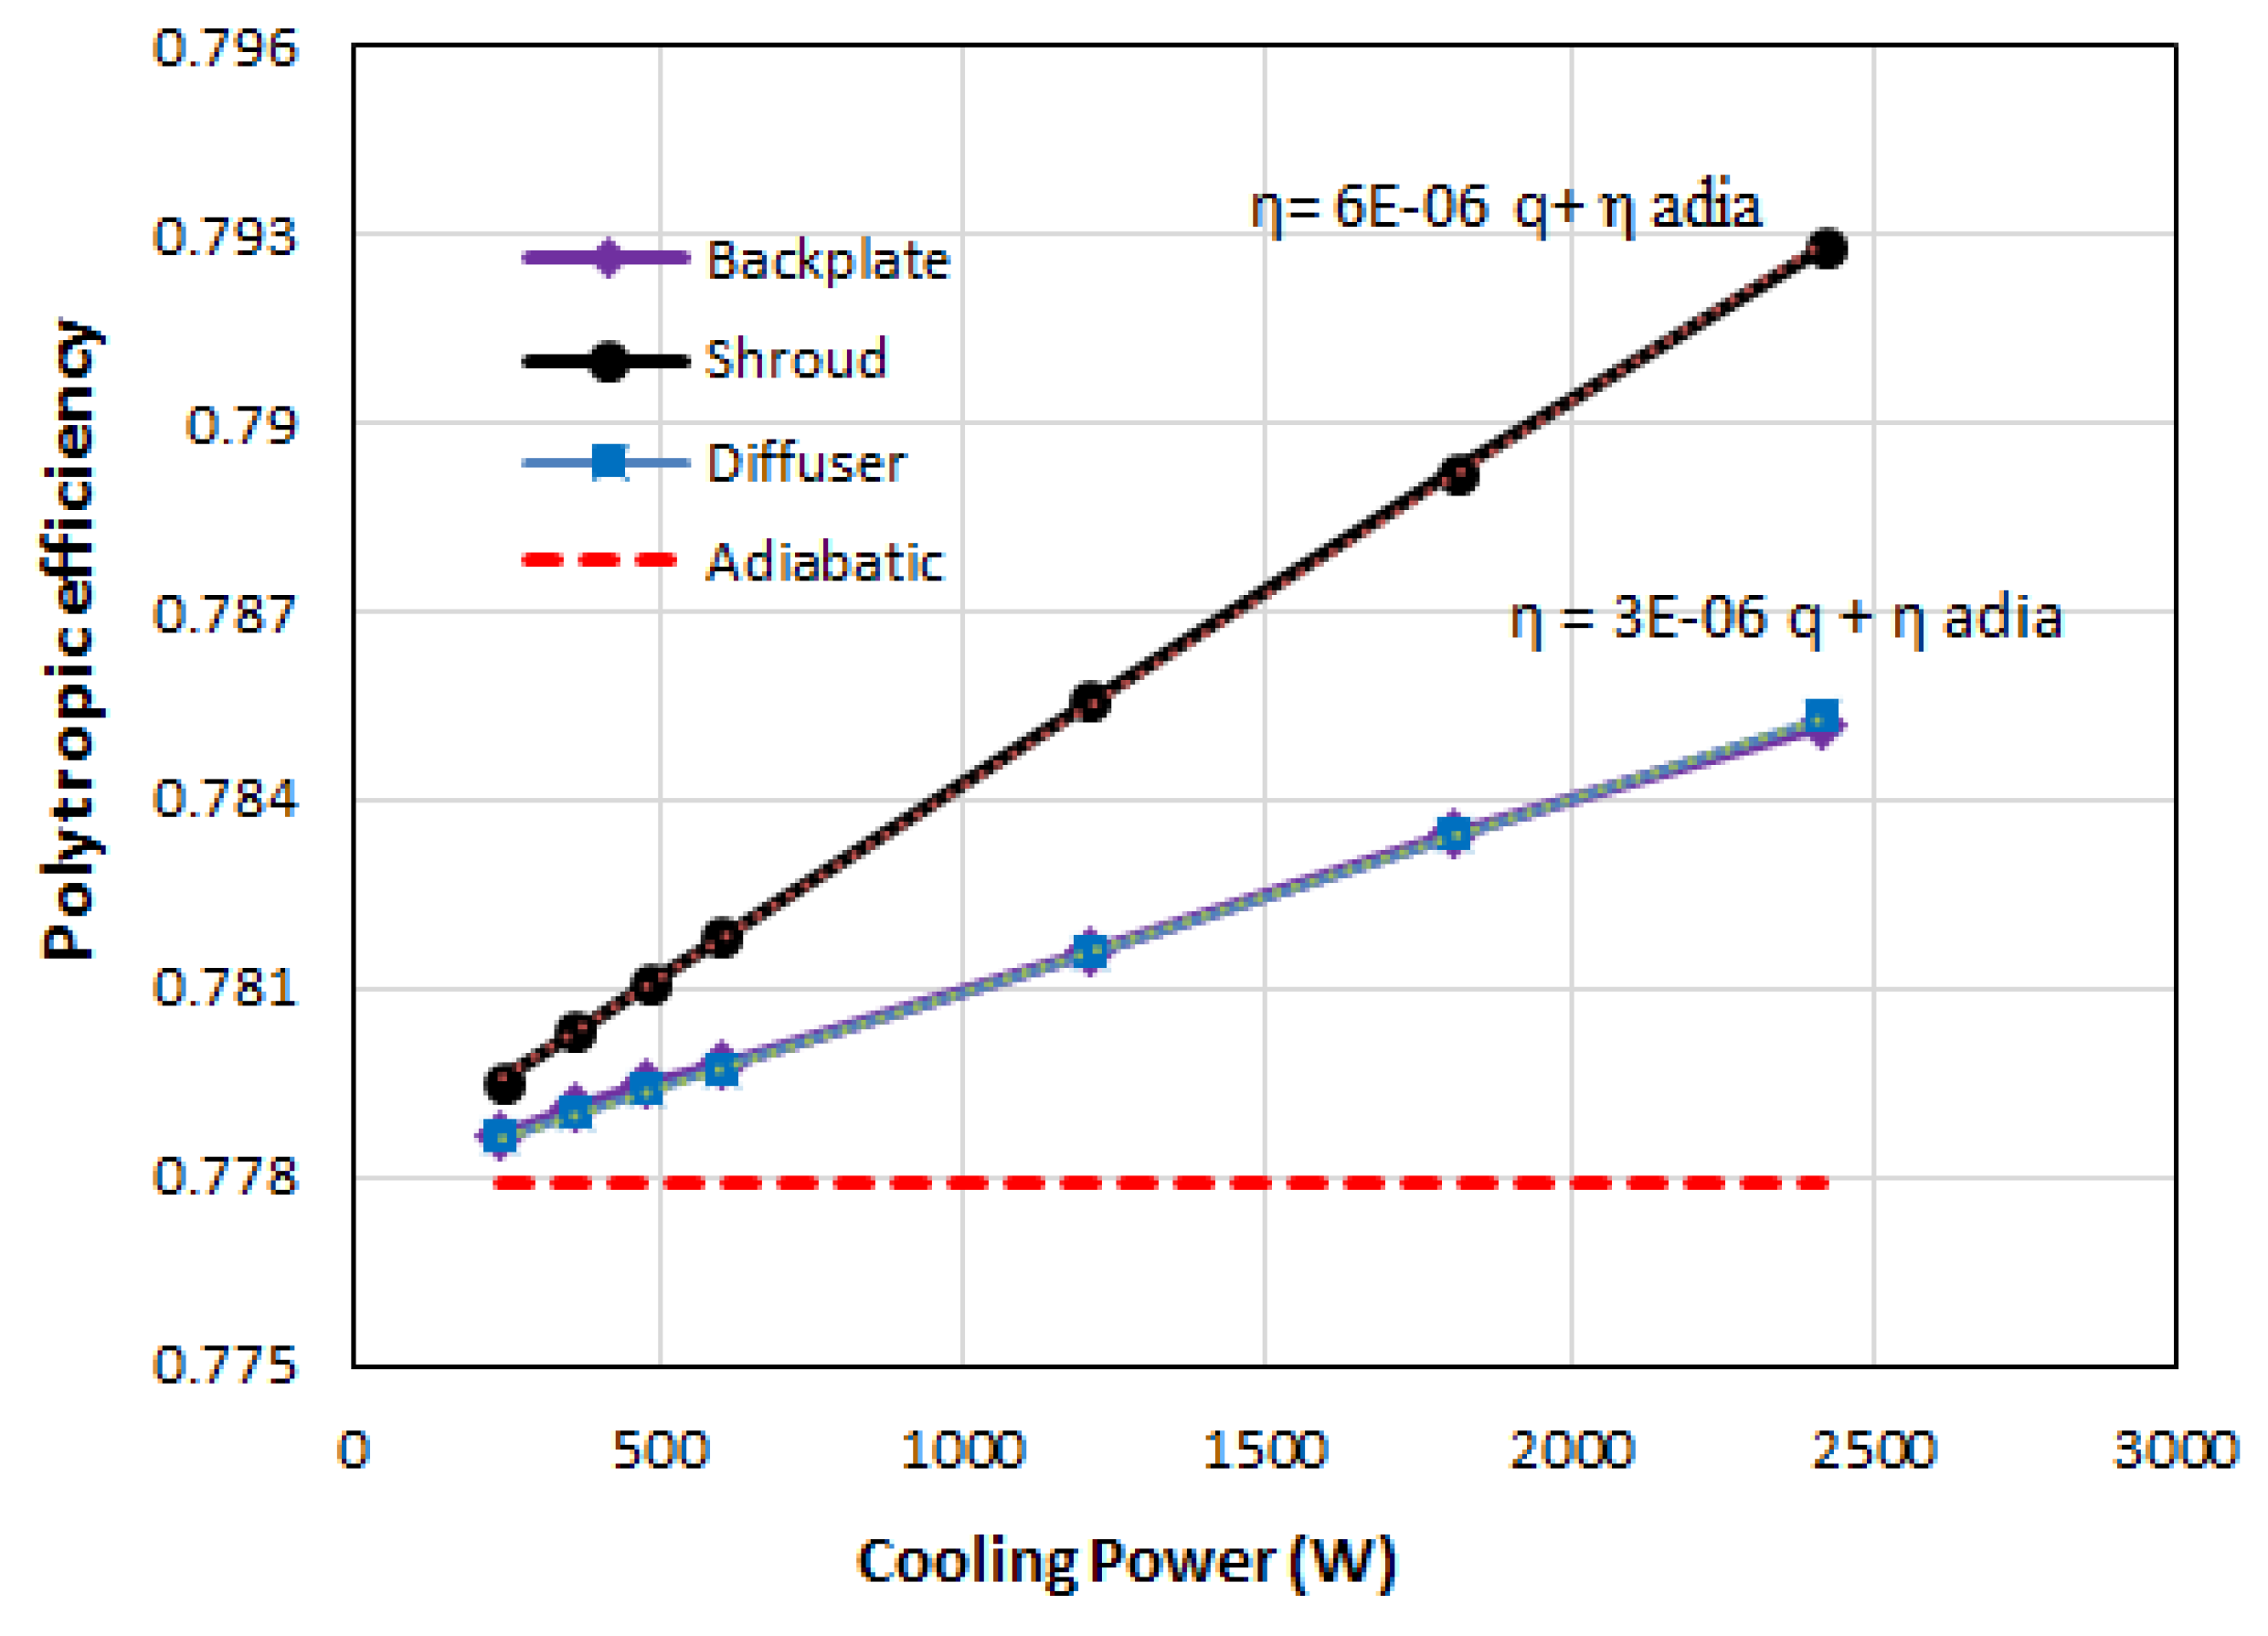
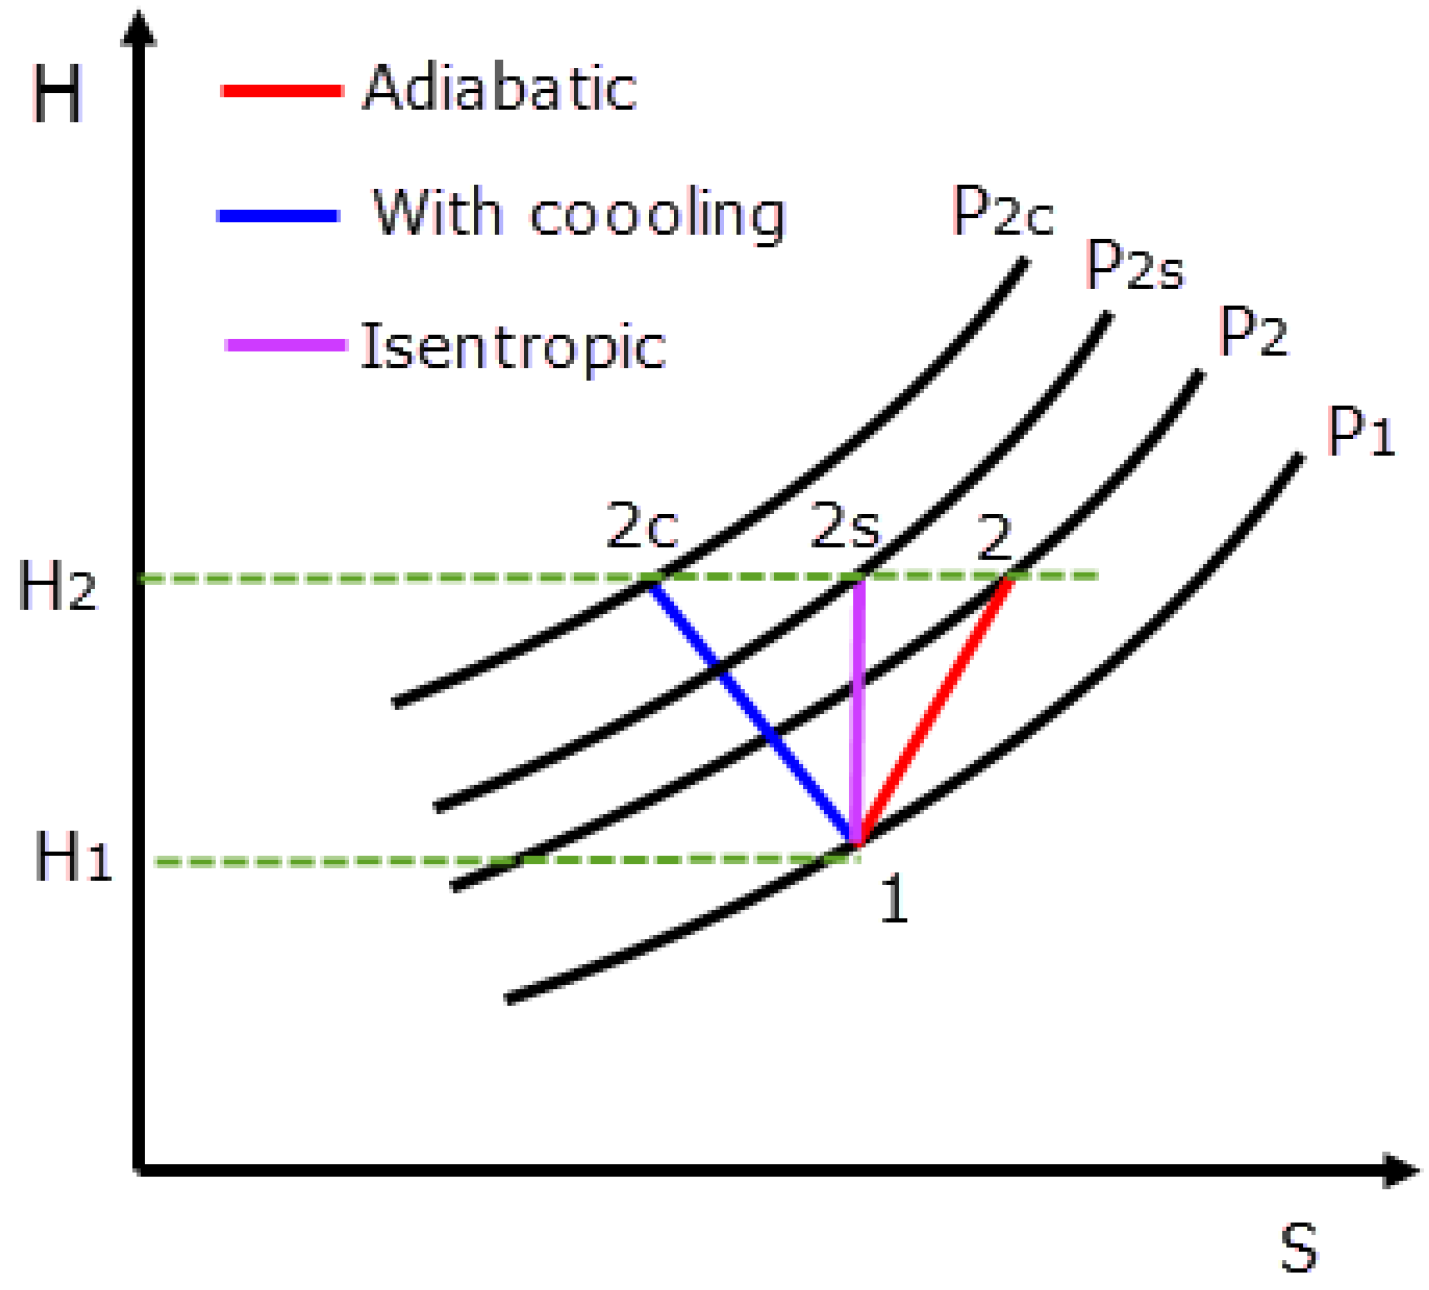
3.3. Effects on the Polytropic Efficiency

For comparing the efficiencies of turbo machines of differing pressure ratios, the isentropic efficiency can be misleading. For example, two compressors with the same flow quality, but different pressure ratios will have different efficiencies. Casey et al. [24] discussed in details why isentropic efficiency is totally flawed for the compressors with heat transfer.
The polytropic efficiency calculation in a compressor with heat transfer was discussed by Oldrich [25].
η p = H P H 02 H 01 + Q
where Q is the cooling power per mass flow rate.
Figure 10 shows the polytropic efficiency of compressors with varied cooling power on different parts. The dashed line is the polytropic efficiency of the adiabatic compressor.
Shroud cooling increases the compressor polytropic efficiency the most in all cooling powers. With the cooling power of 500 W, the compressor efficiency increases from 77.79% for the adiabatic condition to 78.11%. With increasing the cooling power, polytropic efficiency inclined faster for the shroud cooling compared with diffuser cooling and back plate cooling. Raising the cooling power from 500 W to 2400 W increases the efficiency up to 79.28%. With each 500 W of cooling power, the efficiency increases roughly about 0.3%.
Back plate cooling and diffuser cooling have the same effect on the efficiency. By 500 W of cooling power applied on the diffuser or back plate, the efficiency increases to 77.94% compared to the adiabatic polytropic efficiency, which is 77.79%. Intensifying the cooling power from 500 W to 2400 W improves the efficiency from 77.94% to 78.53%. By each 500-W increase in cooling power at the back plate or diffuser, the efficiency improves about 0.118%.
Figure 11 represents the streamlines in the compressor passage. As can be seen, the shroud cooling does not have a considerable effect on the streamlines.

4. Conclusions and Remarks

In this study, a three-dimensional CFD model has been used in order to study the performance of a high pressure ratio centrifugal with cooling on different parts. Important conclusions about the cooling approach in a centrifugal compressor are listed as follows.
1. Shroud cooling increases the pressure ratio the most. The cooling power of about 2400 W on the shroud increases the pressure ratio by about 4.6%.
2. Only back plate cooling reduces the solid impeller temperature. Impeller temperature will drop by 45 K with the cooling power of 2400 W on the back plate. Cooling the other walls does not affect the impeller temperature.
3. Shroud cooling has the largest effect on the efficiency, while back plate and diffuser cooling have almost identical effects on the efficiency. Shroud cooling with the cooling power of 2400 W increases the polytropic efficiency by 1.49%. With increasing each 500 W of cooling power on the shroud, the efficiency increases roughly about 0.3%.
4. Heating should have a contrariwise effect on each wall. For example, heating the shroud should reduce the performance the most, and heating the back plate will increase the impeller temperature. It is very important to prevent heat transfer to the shroud and back plate to preserve efficiency and reliability, respectively.

Acknowledgments

This research was supported by the National Natural Science Foundation of China (Grant No. 51176087).

Author Contributions

S. Mostafa Moosania acquired the data and wrote the paper and Xinqian Zheng revised the paper and offered useful suggestions to write and revise the paper.

Conflicts of Interest

The authors declare no conflict of interest.

Nomenclature

The following nomenclature is used in this manuscript:
DImpeller diameter (mm)
hSpecific enthalpy (J·kg−1)
HTotal Enthalpy (J)
mMas flow rate (kg·s−1)
nRotational speed (rpm)
NRotational speed
pPressure (kPa)
PRPressure ratio
pkShear production of turbulence (kg·m−1·s−3)
pCorrected pressure (= p + 2ρk/3)
qHeat flux (W·m−2)
qCooling power (W)
QHeat transfer per mass flow rate (kJ·kg−1)
RGas constant
ReReynolds number
sEntropy (J·kg−1·K−1)
SmMomentum source term
SEEnergy source term
TTemperature (K)
UMean velocity (m·s−1)
uVelocity fluctuation (m·s−1)
WWork input (kW)
y+Dimensionless wall distance
ZNumber of blades or vanes
Greek symbols
Nabla sign
µAir viscosity (kg·s−1·m−1)
λThermal conductivity (W·K−1·m−1)
ηefficiency
ρ Density (kg·m−3)
τShear stress (N·m−2)
Subscriptions
adiaAdiabatic
cCooled process
effEffective viscosity
pPolytropic
sIsentropic
tTurbulent
0Stagnation condition
1Inlet
2Outlet
θTangential direction

References

  1. Tamaki, H.; Unno, M.; Kawakubo, T.; Hirata, Y. Aerodynamic Design of Centrifugal Compressor for AT14 Turbocharger. IHI Eng. Rev. 2010, 43, 70–76. [Google Scholar]
  2. Zheng, X.; Jin, L.; Du, T.; Gan, B.; Liu, F.; Qian, H. Effect of temperature on the strength of a centrifugal compressor impeller for a turbocharger. Proc. Inst. Mech. Eng. Part C J. Mech. Eng. Sci. 2012, 227, 896–904. [Google Scholar] [CrossRef]
  3. Baines, N.C. Fundamentals of turbocharging; Cncepts NREC: White River Junction, VT, USA, 2005. [Google Scholar]
  4. Krain, H.; Hoffmann, B. Improved High Pressure Ratio Centrifugal Compressor. In Proceedings of the ASME Turbo Expo 2007: Power for Land, Sea, and Air, Montreal, QC, Canada, 14–17 May 2007; pp. 1–9.
  5. Krain, H.; Hoffmann, B. Flow Study of a Redesigned High-Pressure-Ratio Centrifugal Compressor. J. Propuls. Power 2008, 24, 1117–1123. [Google Scholar] [CrossRef]
  6. Zhang, C.; Deng, Q.; Feng, Z. Study on Aerodynamic Redesign of a High Pressure Ratio Centrifugal Compressor. In Proceedings of the ASME Turbo Expo 2010, Glasgow, UK, 14–18 June 2010; pp. 1027–1040.
  7. Zheng, Q.; Sun, Y.; Li, S.; Wang, Y. Thermodynamic Analyses of Wet Compression Process in the Compressor of Gas Turbine. J. Turbomach. 2003, 125, 489–496. [Google Scholar] [CrossRef]
  8. Sanaye, S.; Tahani, M. Analysis Of Gas Turbine Operating Parameters With Inlet Fogging And Wet Compression Processes. Appl. Therm. Eng. 2010, 30, 234–244. [Google Scholar] [CrossRef]
  9. Bhargava, R.; Meher-Homji, C.B. Parametric Analysis of Existing Gas Turbines With Inlet Evaporative and Overspray Fogging. In Proceedings of the ASME Turbo Expo 2002, Amsterdam, The Netherlands, 3–6 June 2002; pp. 387–401.
  10. Shibata, T.; Takahashi, Y.; Hatamiya, S. Inlet Air Cooling With Overspray Applied to a Two-Stage Centrifugal Compressor. In Proceedings of the ASME Turbo Expo 2008, Berlin, Germany, 9–13 June 2008; pp. 207–217.
  11. Chaker, M.; Meher-homji, C.B. Inlet Fogging of Gas Turbine Engines: Climatic Analysis of Gas Turbine Evaporative Cooling Potential of International Locations. In Proceedings of ASME Turbo Expo 2002, Amsterdam, The Netherlands, 3–6 June 2002; pp. 1–16.
  12. Brun, K.; Kurs, R. Inlet Fogging and Overspray Impact on Industrial Gas Turbine Life and Performance. In Proceedings of 20th Symposium of the Industrial Application of Gas Turbines Committee, Banff, AB, Canada, 21 Octobre 2013.
  13. Ameri, M.; Hejazi, S.H. The Study Of Capacity Enhancement Of The Chabahar Gas Turbine Installation Using An Absorption Chiller. Appl. Therm. Eng. 2004, 24, 59–68. [Google Scholar] [CrossRef]
  14. Moosania, S.M.; Zheng, X. Performance Improvement Of A High Pressure Ratio Centrifugal Compressor By Integrated Cooling. Proc. Inst. Mech. Eng. Part G J. Aerosp. Eng. 2015. [Google Scholar] [CrossRef]
  15. Lei, V.-M.; Kawakubo, T. A Fast Method For Conjugate Heat Transfer Analysis Of Centrifugal Compressor. In Proceedings of International Mechanical Eng. Congress and Exposition, Seattle, WA, USA, 11–15 November 2007; Paper No. IMECE2007-41368. pp. 699–706.
  16. Jaluria, Y.; Atluri, S.N. Computational heat transfer. Comput. Mech. 1994, 14, 385–386. [Google Scholar] [CrossRef]
  17. Bohn, D.; Heuer, T.; Kusterer, K. Conjugate Flow and Heat Transfer Investigation of a Turbo Charger. J. Eng. Gas Turbines Power 2005, 127, 663–669. [Google Scholar] [CrossRef]
  18. Yamagata, A.; Nagai, S.; Nakano, K.; Kawakubo, T. Prediction and measurement of turbocharger compressor wheel temperature. In Proceedings of 8th International Conference on Turbochargers and Turbocharging, London, UK, 17–18 May 2006; pp. 3–13.
  19. Menter, F.R. Two-equation eddy-viscosity turbulence models for engineering applications. AIAA J. 1994, 32, 1598–1605. [Google Scholar] [CrossRef]
  20. Bulat, M.P.; Bulat, P.V. Comparison of turbulence models in the calculation of supersonic separated flows. World Appl. Sci. J. 2013, 27, 1263–1266. [Google Scholar]
  21. Verstraete, T.; Van den Braembussche, R.A. A novel method for the computation of conjugate heat transfer with coupled solvers. In Proceedings of International Symposium on Heat Transfer in Gas Turbine Systems, Antalya, Turkey, 9–14 August 2009.
  22. Krain, H.; Hoffmann, B.; Pak, H. Aerodynamics of a Centrifugal Compressor Impeller with Transonic Inlet Conditions. In Proceedings of ASME Summer Meeting, Washington DC, USA, 21–25 June 1998; pp. 1–9.
  23. Broadbent, E. Flows With Heat Addition. Prog. Aerospace Sci. 1976, 17, 93–108. [Google Scholar] [CrossRef]
  24. Casey, M.V.; Fesich, T.M. The Efficiency of Turbocharger Compressors With Diabatic Flows. J. Eng. Gas Turbines Power 2010, 132, 72302. [Google Scholar] [CrossRef]
  25. Oldrich, J. Advanced Polytropic Calculation Method of Centrifugal Compressor. In Proceedings of the ASME 2010 International Mechanical Engineering Congress and Exposition, Vancouver, BC, Canada, 12–18 November 2010; pp. 123–131.
Figure 1. Cooling walls in the centrifugal compressor.
Applsci 07 00016 g001
Figure 2. Computational domain for the compressor.
Applsci 07 00016 g002
Figure 3. Compressor grid used in the simulation.
Applsci 07 00016 g003
Figure 4. Polytropic compressor efficiency for the different grid sizes.
Applsci 07 00016 g004
Figure 5. Numerical model validation.
Applsci 07 00016 g005
Figure 6. Effect of cooling on different walls with varied cooling power on the total pressure ratio.
Applsci 07 00016 g006
Figure 7. Enthalpy-entropy diagram for the compression process with different thermal conditions.
Applsci 07 00016 g007
Figure 8. Effect of cooling different walls on the impeller temperature.
Applsci 07 00016 g008
Figure 9. Temperature contours inside the compressor with cooling on different walls.
Applsci 07 00016 g009
Figure 10. Effect of the cooling temperature on the polytropic efficiency.
Applsci 07 00016 g010
Figure 11. Streamlines for the compressor in the adiabatic condition and with shroud cooling.
Applsci 07 00016 g011
Table 1. Compressor parameters.
ParametersValues and Units
n (rotational speed)110,000 rpm
m (mass flow rate)0.7 kg·s−1
Z (blade number)9 + 9
D2 (impeller diameter)120 mm
W (work input)211.76 kW
Tip clearance0.5 mm
Air gap width1 mm
Blade inlet angle60°
Back sweep40°
Reynolds number4.96 × 102
Table 2. Compressor performance by cooling on different parts.
Cooling WallCooling Power (W)Work Input (W)Pressure RatioEfficiency
Back plate cooling2415.978212,922.47646.839920.785197
Shroud cooling2415.978215,355.04187.081670.792815
Diffuser cooling2415.978211,545.80326.781160.785338
Adiabatic0211,763.30366.768690.7779

