Article

Application of Response Surface Methodology for Optimisation of Simultaneous UHPLC-PDA Determination of Oleanolic and Ursolic Acids and Standardisation of Ericaceae Medicinal Plants

by
Aleksandra Owczarek
1,*,
Łukasz Kuźma
2,
Halina Wysokińska
2 and
Monika Anna Olszewska
1
1
Department of Pharmacognosy, Faculty of Pharmacy, Medical University of Lodz, 1 Muszynskiego St., Lodz 90-151, Poland
2
Department of Biology and Pharmaceutical Botany, Faculty of Pharmacy, Medical University of Lodz, 1 Muszynskiego St., Lodz 90-151, Poland
*
Author to whom correspondence should be addressed.
Appl. Sci. 2016, 6(9), 244; https://doi.org/10.3390/app6090244
Submission received: 5 July 2016 / Revised: 13 August 2016 / Accepted: 24 August 2016 / Published: 29 August 2016
(This article belongs to the Section Chemical and Molecular Sciences)

Abstract

:
A fast and sensitive ultra-high performance liquid chromatography-photodiode array (UHPLC-PDA) method for simultaneous quantification of oleanolic acid (OA) and ursolic acid (UA) in plant materials was developed. A central composite design combined with a response surface methodology was utilized to establish optimal separation conditions. The final separation was accomplished on a Zorbax Eclipse XDB-C18 column (1.8 μm, 100 mm × 3 mm I.D., Agilent, Santa Clara, CA, USA) using a mixture 90:10 (v/v) of methanol and 1% (w/v) aqueous orthophosporic acid as a mobile phase at a flow rate of 0.44 mL/min and temperature of 18 °C. The analysis was completed in 6.2 min with satisfactory resolution of 1.5 between the target analytes. The developed method proved to be precise (relative standard deviations below 3.2%), accurate (recoveries in the range of 95.27%–98.60%), and sensitive (limits of detection (LODs) in the range of 0.047–0.051 mg/mL). The method was then successfully applied to evaluate OA and UA content in real samples of selected Ericaceae plant materials (leaves of Arctostaphylos uva ursi, Vaccinium myrtillus, Vaccinium vitis idaea, Gaultheria procumbens). The content of OA and UA in investigated samples varied in the range of 0.74–4.47 mg/g dry weight (dw) and 1.30–18.61 mg/g dw, respectively.

Graphical Abstract

1. Introduction

Oleanolic acid (3β-3-hydroxyolean-12-en-28-oic acid, OA) and ursolic acid (3β-3-hydroxyurs-12-en-28-oic acid, UA) are two isomeric pentacyclic triterpenes (Figure 1) that are ubiquitous constituents of various medicinal and dietary plants [1]. Numerous studies have demonstrated their versatile biological properties with anti-inflammatory activity being the most important from phytotherapeutic point of view. As the underlying mechanism of this action, the suppression of immune cells and cytokines (TNF-α, IL-12, IL-6, interferon-γ) production either via inhibition of pro-inflammatory enzymes (elastase, cyclooxygenases, lipoxygenases, nitric oxide synthase) and NF-κB-regulated genes expression or direct cytokine receptor interactions has been proposed [1,2]. Recently, the potent antimicrobial activity of both compounds has also been demonstrated towards various bacterial strains including Escherichia coli—a common pathogen of urinary tract infection [3]. OA and UA were found to modulate bacterial resistance to some antibiotics and produce in combination with them synergistic antibacterial effect [4]. Other biological properties attributed to OA and UA include anti-proliferative, anti-cancer, anti-mutagenic, anti-leukemic, anti-atherosclerotic, anti-hypertensive, hepatoprotective, and antioxidant activities [1,5,6]. The presence of OA and UA in plant materials is, therefore, regarded as beneficial for human health.
Ericaceae is a large family of flowering plants comprising over 4000 species of great morphological and ecological diversity, and with almost worldwide distribution [7]. Many of its members have found use in numerous countries as traditional herbal medicinal products applied routinely in over-the-counter (OTC) drugs and dietary supplements in the treatment of bacterial infections or inflammatory ailments, especially urinary tract disorders. Triterpenes are important active constituents of Ericaceae species, and OA and UA often comprise the major part of the lipophilic fractions in these plants. Considering the proven biological activity of both acids, which closely corresponds with the range of the medical application of Ericaceae plant materials, the determination of their content might be of particular interest as far as the standardisation of these plant materials is concerned [8]. Therefore, there is a persistent interest in the development of fast, selective, and sensitive analytical methods allowing separation and reliable simultaneous quantification of the two analytes.
There are several different approaches reported recently for quantification of OA and UA in plant materials including thin-layer chromatography [9], gas chromatography [10], capillary electrophoresis [11], high-performance liquid chromatography (HPLC), supercritical fluid chromatography [12], micellar electrokinetic chromatography [13], and nuclear magnetic resonance [14]. HPLC is, by far, the most frequently used technique in standardisation studies, mainly because of the high flexibility and relatively good ratio between the analytical performance and maintenance costs. However, when it comes to separation of OA and UA, the conventional RP-HPLC analysis is often problematic and some major issues arise during the assays. The close structural similarity of both compounds, manifested in similar log P (logarithm of the octanol/water partition coefficient) values (6.468 and 6.427, respectively) [15], makes them particularly difficult to separate which results in co-elution or only partial separation of the critical peaks. Although some significant effects of organic solvents and pH of the mobile phase on selectivity have been reported [16], the stationary phase efficiency is believed to be the most important factor determining the resolution of the overlapping bands of native acids. Subsequently, even for relatively simple plant matrices, the use of long chromatographic columns and analysis time of over 15 min, and sometimes over 30 min, are usually required for satisfactory separation [15,16,17,18,19]. As most of the methods utilize HPLC equipment with ultraviolet (UV) detectors, reduced sensitivity may be also an issue, as triterpenes, in general, exhibit low absorption of ultraviolet light. To address these problems various methods have been applied. Adding of separation facilitating substances, like cyclodextrins [20,21], might improve the resolution, as might pre-column derivation [17,22,23,24], which is sometimes used as a solution for low sensitivity. Better limits of detection may be also achieved with detectors other than UV, e.g., evaporative light scattering (ELS) or mass selective (MS) detectors [23,24,25,26]. However, these techniques increase the complication of procedures (additional, time-consuming steps in sample preparation) and their costs (special chemicals and/or solvents) and, therefore, they might not be suitable for routine, commercial standardisation tests.
Over the past decade, there has been tremendous interest in approaches to speed up and increase the resolving power of the chromatographic separation, particularly with the development of columns packed with porous sub-2-µm particles used in very high pressure conditions (namely UHPLC, for ultra-high performance liquid chromatography). The UHPLC technique is quickly gaining significance in many areas of pharmaceutical industry, including the standardisation of natural products. It takes full advantage of chromatographic principles with superior sensitivity, efficiency and resolution at reduced solvent consumption [27]. Considering these advantages, it might become a suitable alternative to HPLC, especially for analysis of structural isomers. There is, however, only one previous report presenting the use of UHPLC for separation and quantification of OA and UA [28]. Despite the separation of both analytes has been achieved in a relatively short time of 7.2 min, the basic rules of HPLC-to-UPLC method transfer suggest that further improvement might be expected [29]. Optimisation of the (U)HPLC separation is a complex process influenced by numerous factors, such as mobile phase composition, flow rate, column temperature, detector wavelength, etc. The traditional optimisation approach, applied in all previous works for the separation of OA and UA based on trial and errors methodologies, which are hardly efficient, time-consuming, and may not be able to find the optimal conditions [30]. These could be identified by the use of systematic experimental design and statistically-assisted construction of a response function describing relationships between the process variables and their interactions and performance parameters of the chromatographic separation [31].
Thus, the objective of this study was to present the first-time application of multivariate statistical techniques in order to develop a simple, fast, sensitive and fully validated ultra-high performance liquid chromatography-photodiode array (UHPLC-PDA) method suitable for routine standardisation of Ericaceae plant materials in terms of OA and UA content.

2. Materials and Methods

2.1. Chemicals and Standards

All chemicals used in UHPLC analyses, including methanol (Avantor Performance Materials, Gliwice, Poland), water, and 85% (w/w) orthophosphoric acid (Merck, Darmstadt, Germany), were of HPLC-grade. Solvents used in extraction of plant materials (Avantor Performance Materials, Gliwice, Poland) were of analytical grade. Reference standards of OA and UA of HPLC-grade (98% and 95% purity, respectively) were obtained from Sigma-Aldrich (St Louis, MO, USA).

2.2. UHPLC Equipment

UHPLC analyses were carried out on an Agilent 1290 Infinity chromatograph (Agilent Technologies, Santa Clara, CA, USA) equipped with a photodiode array detector (PDA), thermostat and autosampler. The column used in the separation was Zorbax Eclipse XDB-C18 column (1.8 μm, 100 mm × 3.0 mm I.D.; Agilent Technologies, Santa Clara, CA, USA). The mixture 90:10 (v/v) of methanol and 1% (w/v) aqueous orthophosphoric acid was used as the mobile phase for isocratic elution. The injection volume was 3 μL. The flow rate and the temperature of the analysis were optimised as described below to the values of 0.44 mL/min and 18 °C, respectively. For quantitative purpose, the analytes were monitored at 215 nm. The investigated compounds were identified by comparison of their retention times and UV spectra with that of reference standards.

2.3. Plant Material and Sample Preparation

Commercial leaf samples of Arctostaphylos uva ursi (L.) Spreng., Vaccinium vitis idaea L., and Vaccinium myrtillus L. were purchased in 2014 from Flos, Herb Confectioning Company (Mokrsko, Poland). Leaves of Gaultheria procumbens L. were collected in October 2014 in the nursery-garden of Ericaceae plants (Gospodarstwo Szkolkarskie Jan Cieplucha, Konstantynow Lodzki, Poland; 51°44′N, 19°18′E) and air-dried under normal conditions. Authentication of the samples was performed by the authors. Voucher specimens were deposited in the herbarium of the Department of Pharmacognosy, Medical University of Lodz, Lodz, Poland. Prior to the analysis, the plant samples were powdered using an electric grinder (Eldom, Katowice, Poland), sieved through a 0.315-mm sieve, and stored in airtight containers at ambient temperature and in darkness until used.
An accurately weighted sample of the plant material (300 mg) was sequentially refluxed twice for 30 min with 30 mL of chloroform, and finally for another 30 min with 30 mL of the mixture of chloroform-methanol (1:1, v/v). The obtained extracts were combined and evaporated to dryness under vacuum. The residue was dissolved in 4 mL of chloroform-methanol (1:1, v/v), diluted with methanol to 10 mL (to 25 mL for A. uvae ursi leaf), filtered through the syringe filter (25 mm, 0.2 µm, Vitrum, Praha, Czech Republic) and directly subjected to the UHPLC system (3 µL). Determinations were performed after three separate extractions of each sample, and each extract was injected in duplicate.
An alternative method of extraction was also used in which the plant material was first defatted by pre-extraction with n-hexane (30 mL, 20 min of heating reflux) to remove waxes (after filtration, the hexane extract was discarded) and subsequently extracted and analysed as described above.

2.4. Experimental Design and Data Treatment

The optimisation tests were carried out using a solution of standards containing equal amounts of OA and UA (50 μg/mL each). A central composite design was used to investigate the effects of two independent variables—temperature (T) and flow rate (FR)—on the separation process. The independent variables were coded on five different levels (−1.41, −1, 0, 1, 1.41), using preliminary experimental data as guidance to set the ranges of the factors. The complete design consisted of 13 experimental points, including five replications of the central point (all variables coded as zero). The behaviour of the system was described by the following second-degree polynomial equation:
Y = β 0 + β i X i + β j X j + β i i X i 2 + β j j X j 2 + β i j X i X j
where Y is a response, β0 is a constant coefficient, βi and βj are linear coefficients, βii and βjj are quadratic coefficients, βij is interaction coefficient, and Xi and Xj are coded values of the independent variables [31]. Three responses Y1–3 were considered, including the separation time (Y1, ST) understood as the retention time of the latest peak (UA), the resolution (Y2, Rs) between the adjacent bands of OA and UA, and a combined response (Y3, D) described by the overall desirability function according to Derringer and Suich [32]:
D = ( d 1 d 2 ) 1 2
where d1 and d2 correspond to individual desirability function for each response:
d 1 = { 0 S T > 8 8 S T 3 5 < S T < 8 1 S T < 5
d 2 = { 0 R s < 1.3 R s 1.3 0.4 1.3 < R s < 1.7 1 R s > 1.7
The resolution (Rs) was calculated using the following equation:
R s = 2.0 × t 1 t 2 w 2 w 1
in which t1 and t2 are retention times, and (w2 + w1) is a sum of peak widths at baseline between tangents lines drawn at 50% peak height. The statistical analysis of the data and development of regression equations between the process variables and analytical responses were performed using the software Statistica 12.0 PL (Statsoft, Kraków, Poland, 2015). According to the experimental data, the fitting models were constructed and the statistical significance of the model terms were examined by regression analysis and analysis of variance (ANOVA, α = 0.05).

2.5. Validation of the Method

The analytical method was validated by determination of the selectivity, linearity, precision, accuracy and stability of each analyte, according to the International Council for Harmonisation (ICH) Guidance for Industry [33].
The standard stock solution containing a mixture of the reference compounds was prepared in triplicate in methanol and serially diluted (in two replicates) with the same solvent to six concentration levels (1%, 10%, 25%, 50%, 75% and 100% of the stock concentration) within the range of approximately 1.5–150 μg/mL for OA and 3.0–325.0 μg/mL for UA. Each sample was injected twice into the UHPLC system. Calibration tests were run at the beginning, midpoint, and the end of the analytical tests. Calibration graphs were constructed by plotting the mean peak area versus concentration. Linearity of the calibration curves was tested using two linear regression models (y = ax + b; y = ax), and the F- and t-tests were applied to check statistical significance of the regression equations, slopes, and intercepts at the 99% confidence level. The residuals from linear regression models were tested ex post to check the validity of the assumptions of normality, independence, and homoscedasticity of the response variables. The possible matrix effects were evaluated by constructing the sensitivity plots for the standards dissolved in the real leaf samples exhibiting the most complicated matrices, i.e., the samples of V. myrtillus and G. procumbens. Concentration ranges of the added standards were the same as those used for calibration. Statistical differences between the slopes of the matrix-matched linear regression equations and the calibration curves were tested by the Tukey’s HSD (honest significant difference) test at the 95% confidence level. The limit of detection (LOD) and limit of quantitation (LOQ) values were estimated from the standard solution diluted with methanol to provide serial solutions with their concentrations decreasing to the smallest detectable peaks. The LODs were accepted with the 3-signal-to-noise (S/N) ratio, while the LOQs were accepted if the relative standard deviation (RSD) values for peak area were less than 15% for both intraday and inter-day variability with S/N ratio greater than 10, according to Corley [34].
The measurement of intra- and inter-day variabilities was used to determine the precision of the method. The assessments were performed in triplicate using standard solution at two concentration levels and the real leaf sample of A. uva ursi. The replicate solutions were injected twice and the RSD values were calculated for both retention time and concentration, and considered as a measure of precision. The repeatability (intra-day variability) was determined by analysing each sample within 24 h, while the reproducibility (inter-day variability) was measured on three non-consecutive days.
The accuracy of the method was tested in the leaf extract of G. procumbens by means of the standard addition/recovery procedure at three different concentration levels corresponding to the whole analytical range investigated. The samples were prepared in triplicate according to the procedure described above (Section 2.3) with the standards being added to the plant material prior to the extraction. The replicate samples were injected twice, and the accuracy was evaluated by calculating the mean recovery of the analytes from the spiked extracts versus the non-spiked samples.

3. Results and Discussion

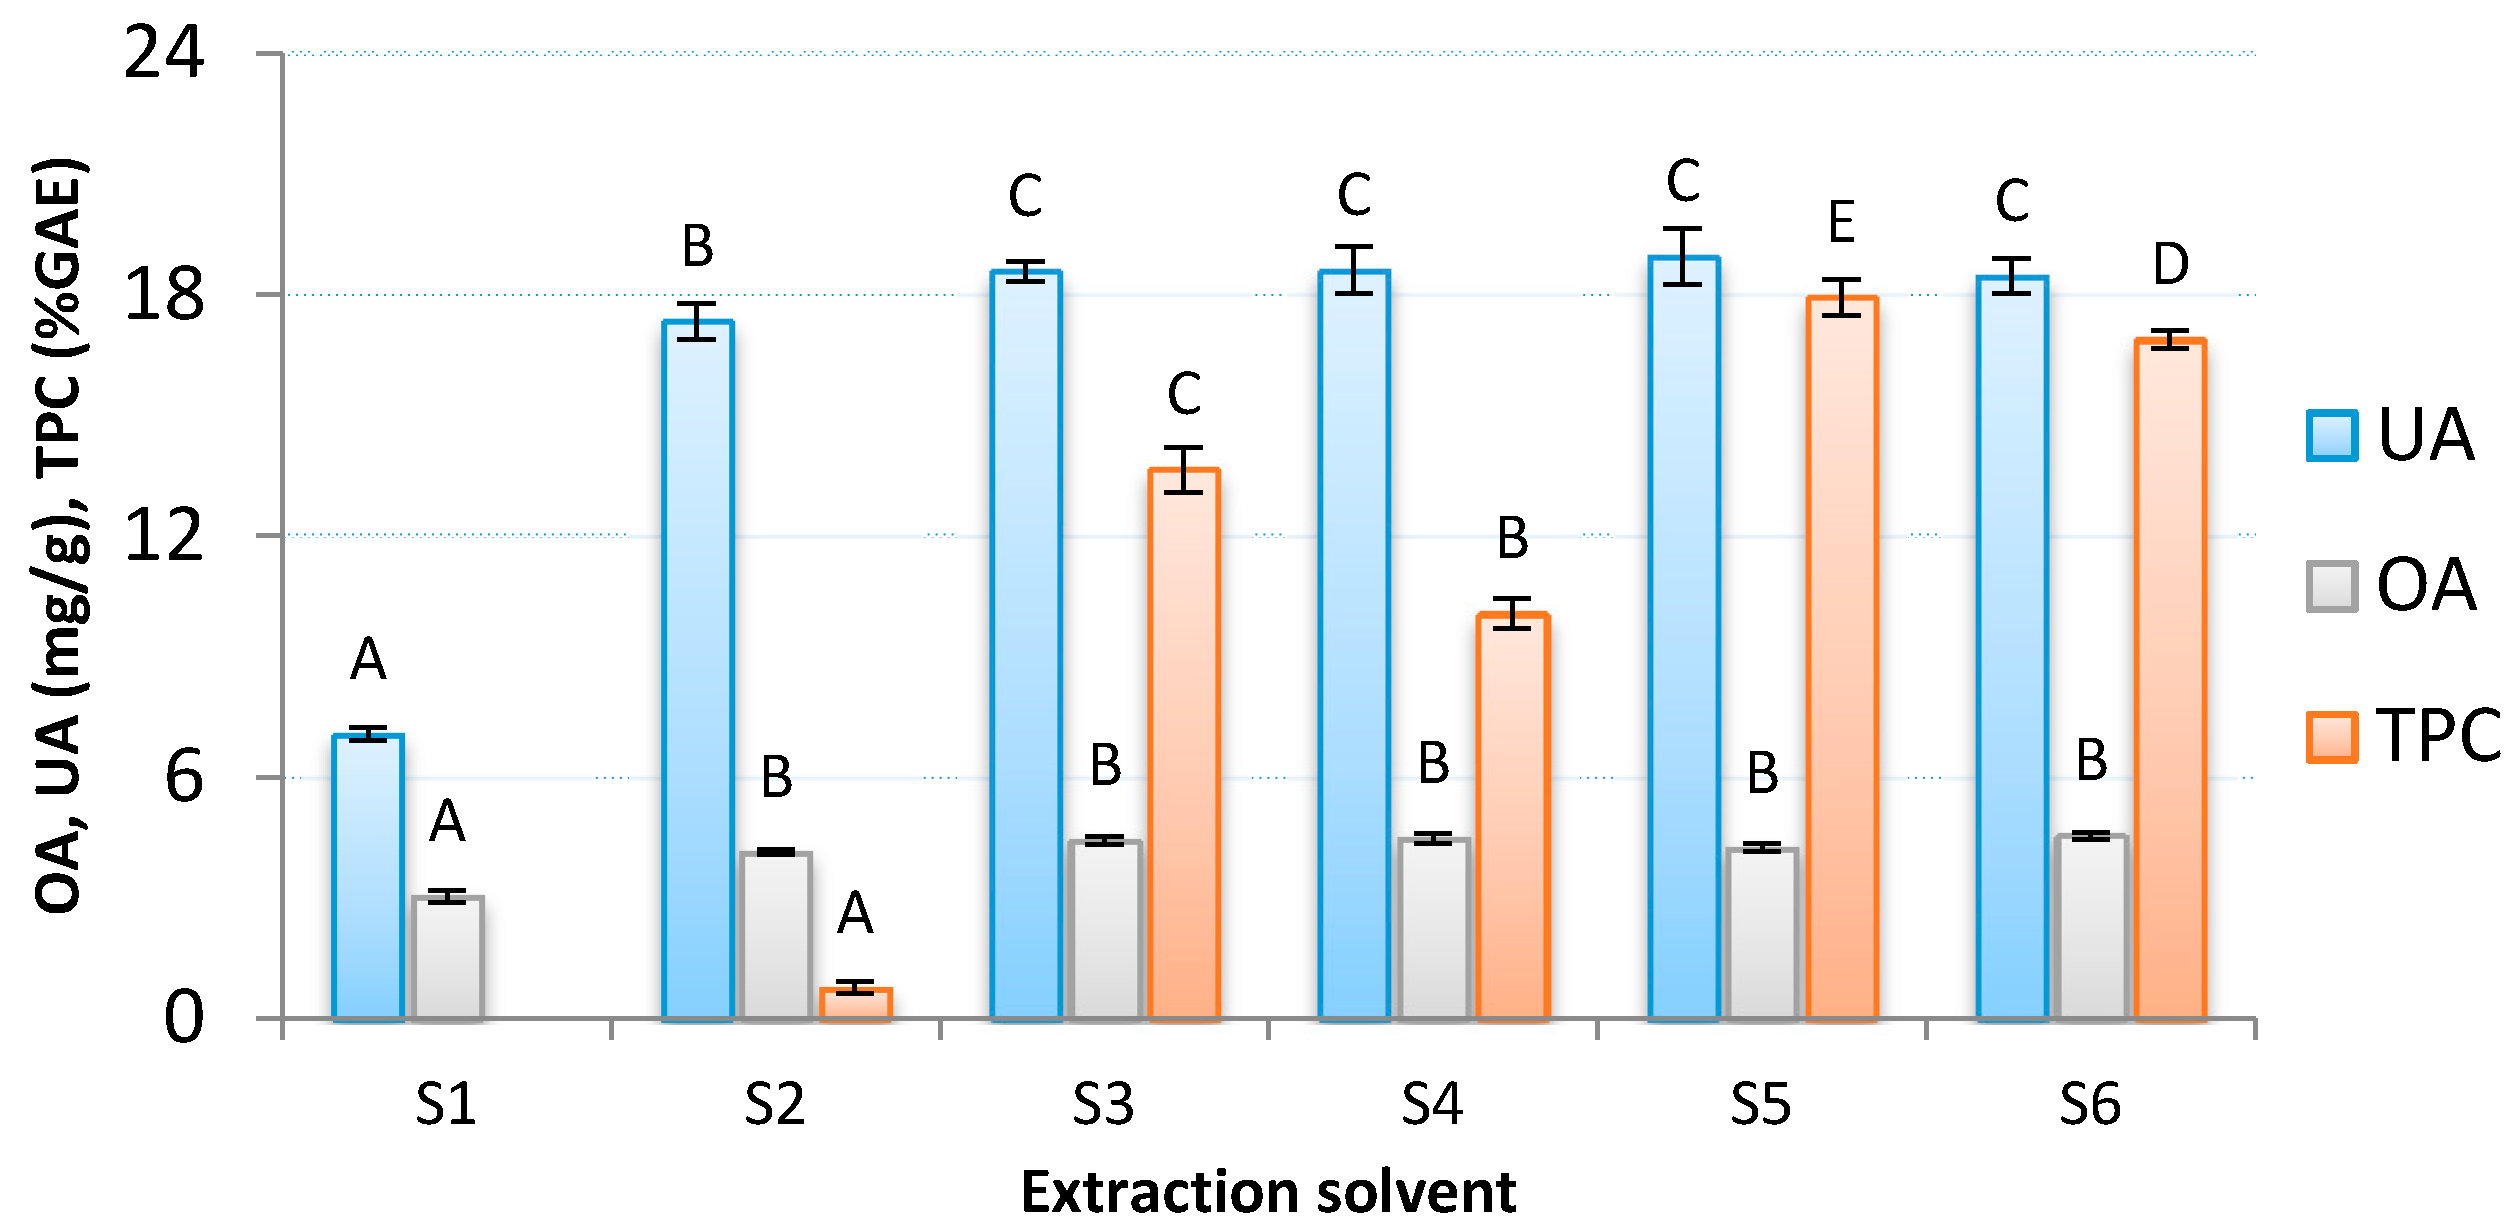
3.1. Selection of Extraction Solvent

Selection of extraction solvent is a crucial aspect of plant analysis. Optimal solvent must ensure quantitative extraction of target analytes but, at the same time, it should be sufficiently selective to avoid excessive extraction of other groups of compounds that might interfere with the analytical process. It is especially important in UHPLC, where columns with relatively low capacities are used. In the case of Ericaceae plant materials the interference might come from two different sources. The lipoidal substances (waxes, fatty acids, etc.), easily extractable with lipophilic solvents, like n-hexane and chloroform, are not easily washed from the column even with solvents of high eluotropic strength and may cause plugging problems, increasing the pressure, and shortening the column life. On the other hand, high concentrations of polyphenols present in polar extracts are likely to result in column overload causing peak broadening, decreasing the resolution and efficiency.
Basing on some previous reports considering the solubility of OA and UA and their mixtures [35,36], a couple of easily accessible solvents suitable for reflux extraction were selected (n-hexane, chloroform, methanol, n-butanol), and tested in terms of extraction efficiency. To this end, the leaves of A. uva ursi were extracted with every solvent thrice and the obtained extracts were combined. The content of both target analytes as well as total polyphenolic content (TPC) was determined (as described previously [37]) for all extracts. Hexane proved to be least efficient for OA and UA extraction, which is consistent with the studies carried out by Schneider et al. [36], where the mixture of OA and UA was only scarcely soluble in this solvent. No statistical differences were found between chloroform, methanol, and butanol in terms of OA extraction, but the content of UA was slightly lower in chloroform extract in comparison to the other two. However, high TPC levels reaching over 17% GAE (gallic acid equivalent) per leaf dry weight (dw) were found in both polar extracts. To limit the phenolic recovery, mixtures of chloroform and methanol in different volume combinations were tested. Finally, an optimal extraction procedure was established comprising two successive extraction periods with chloroform followed by one with chloroform-methanol 1:1 (v/v). This scheme, allowed for quantitative extraction of both OA and UA as well as reduced the TPC level in the extract by over 40% (Figure 2).

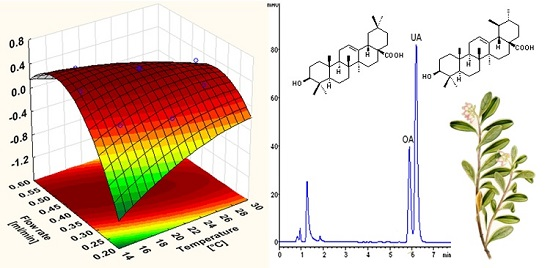
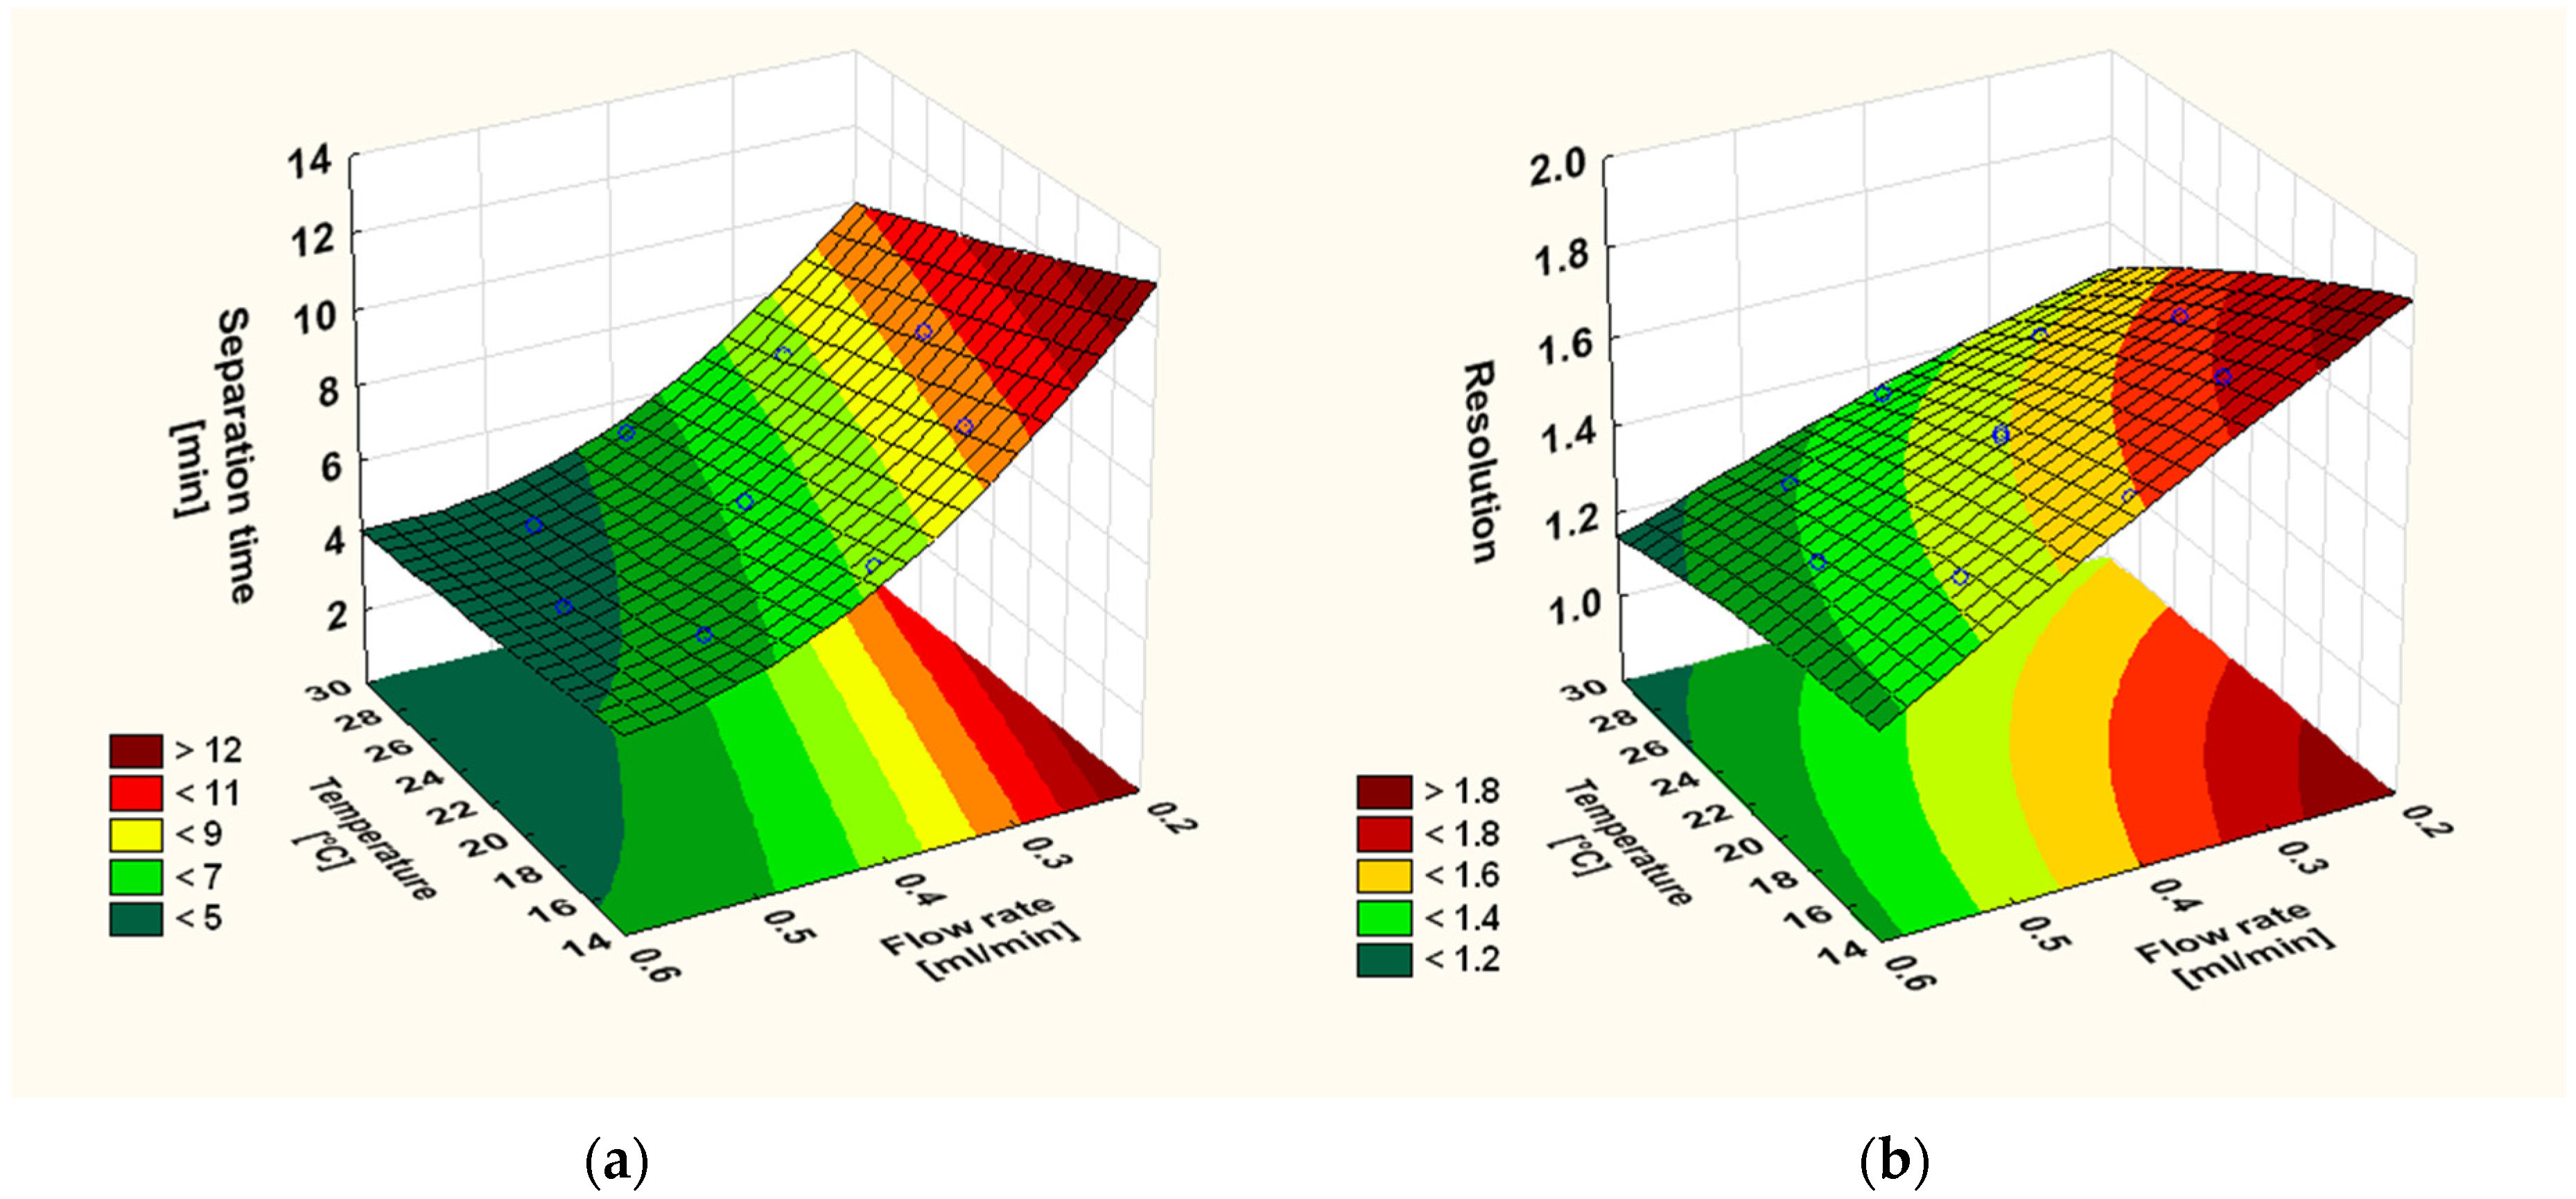
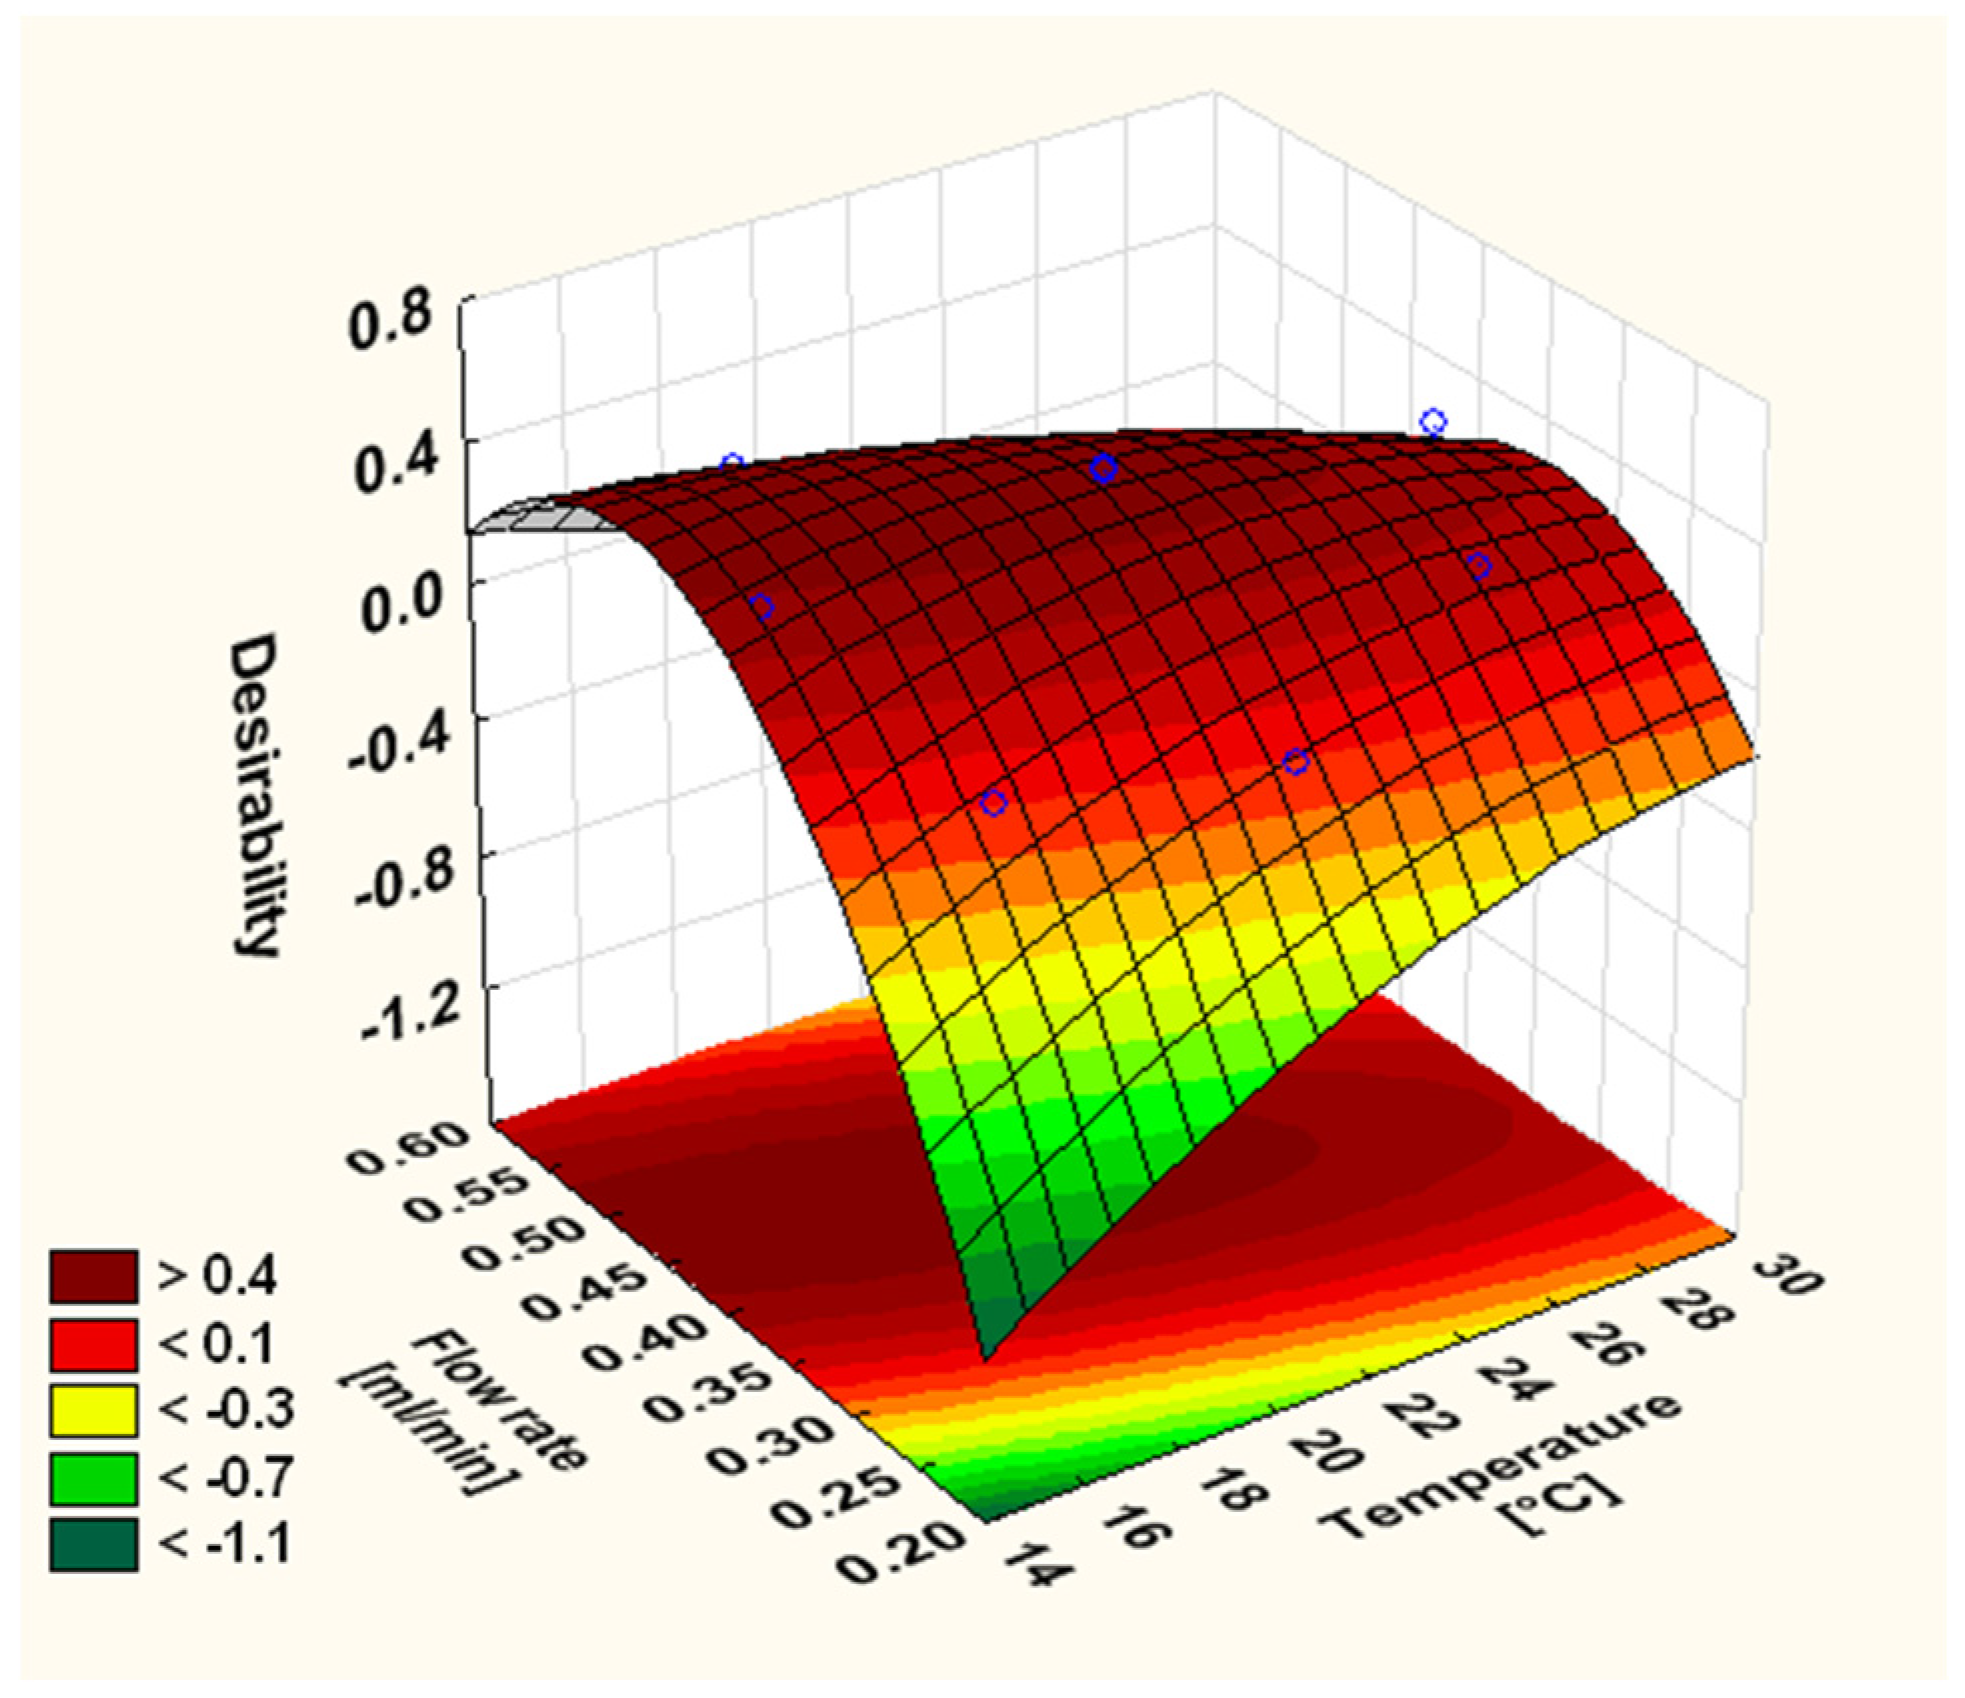
3.2. Optimisation of the Chromatographic Conditions

When optimizing a liquid chromatographic (LC) separation, there are several variables to consider, including analytical column chemistry and geometry, mobile phase composition, flow rate, and temperature. However, as far as analysis of thoroughly studied analytes is concerned, the critical previous findings should be adopted to avoid unnecessary repetitions in experimental design.
Considering the earlier studies, C18 is the stationary phase that is most commonly used in the LC separation of OA and UA [8,15,16,17,18,19,20,21,26,38]. This is hardly surprising, as RP-18 columns are also the most popular ones when it comes to plant material standardisation in general and, therefore, easily available in laboratories performing such studies. Moreover, in a study conducted by Zhang et al. [15], where different column chemistries (C8, C18, CN, phenyl) were compared, only C18-based stationary phases exhibited selectivity adequate for effective separation of both compounds. The best resolution was achieved on polymeric C18 bonded phase (polycyclic aromatic hydrocarbons, PAH), however, standard C18 phases gave superior peak shape and symmetry and, therefore, lower detection limits. We decided, thus, to use classic RP-18 UHPLC columns in further optimisation. Among of couple of columns assessed in the preliminary experiments, Zorbax Eclipse XDB C18 (100 mm × 3.0 mm, 1.8 μm) column was proven to be the most suitable for the task. The internal column diameter of 3.0 mm was chosen as less susceptible to the plugging problems than standard 2.1 mm UHPLC columns, especially for the plant samples with complex lipoidal matrices, such as the target extracts. With only two analytes to separate, a column shorter than 100 mm would seem to be a better choice as it could offer a significant reduction of retention times. However, the efficiency of 50 mm columns tested was strongly insufficient to separate so closely-related chemicals as OA and UA, which eluted then in one band independently from the analytical conditions.
The mobile phase used to conduct the analysis is another important factor affecting the separation process. According to the literature [16,18,19,20,21,28,39,40,41,42], isocratic binary elution systems containing acetonitrile or methanol are preferred in analysis of native triterpenoid acids as preventing baseline drifts often observed in gradient modes at detection wavelengths set below 220 nm, the region which the both organic modifiers exhibit also the highest absorption in. In the corresponding mobile phases, the concentrations of both solvents are similar, usually 80%–95% (v/v) for methanol and 85%–90% (v/v) for acetonitrile. In general, methanol-containing phases, due to the lower eluotropic strength, tend to give longer retention times, but better resolution. Our previous comparative studies [16] confirmed this finding and 90% (v/v) aqueous methanol with 1% (w/v) of orthophosphoric acid was demonstrated to be the optimal eluent for OA and UA separation. As it fits in the above-mentioned range of the most selective mobile phase compositions, it has been selected for the present analysis.
The flow rate and temperature are further factors that can easily allow changing the separation efficiency. According to the basics of chromatography, elevation of temperatures reduces eluent viscosity and the observed backpressures, improves the sorption kinetics, increases the mass transfer and longitudinal diffusion, which result in shorter analysis times, but the resolution could suffer, especially for small molecules [43]. A similar effect (shorter time, but worse resolution) could be achieved by increasing the flow rate. The efficient combination of the two factors is a key to successful separation. The thorough examination of all combinations, even with only two factors to consider, can be time consuming and might not necessarily provide an optimal solution. Therefore, to facilitate the optimisation process, an experimental design was used.
The central composite design (CCD) is generally accepted in chromatographic studies on various analytical stages from extraction to chromatographic separation [30]. It combines two-level full factorial design with axial or star points and at least one point at the centre of the experimental region being investigated. The design used in the present study comprised of four factorial and four axial runs, as well as five duplicates of the central point. After preliminary experiments setting the central point (flow rate, FR: 0.40 mL/min; temperature, T = 22 °C), the independent variables (FR, T) were tested on five different levels in the ranges of 15.0–29.1 °C for T and 0.26–0.54 mL/min for FR (Table 1).
Two responses were selected as a measure of efficiency of the method: resolution (Rs) and separation time (ST, understood as the retention time of the last peak). As the two responses chosen have distinct targets, i.e., improving resolution usually means elongating analysis time, and the other way around, in order to establish optimal conditions a compromise is required. Therefore, a third response (D) was calculated using Derringer’s desirability function (Equation (2)), which is defined as a geometric mean of the individual desirability functions (Equations (3) and (4)) [31,32]. As the primary aim of the optimization was to minimize the analysis time while retaining the resolution still allowing reliable quantification of both analytes, the desirability function for Rs (Equation (4)) was centred at 1.5 (with the ranges of 1.3–1.7), which value is commonly accepted as a precondition for precise analysis. The ranges of the desirability function for ST (Equation (3)) were set between 5 and 8 min based on the experimental data with 5 min being the most and 8 min the least desirable result.
The results were fitted with a second-order polynomial model (Equation (1)) and the insignificant coefficients (p > 0.05) were eliminated using a backwards elimination process. The reduced equations calculated that way and statistical parameters obtained from ANOVA are presented in Table 2, and the corresponding response surfaces for the separation process are shown in Figure 3 and Figure 4. The adjusted R2 (R2 adjusted for the number of terms in the model) values for all models (0.981–0.999) were well within the agreeable bounds of R2 > 0.88, which indicates good fitting of the experimental data with the calculated equations [44]. All models were found to be significant in the F-test with p value < 0.0001. The adequate precision, that is the measure of the response to deviation ratio, was in the range of 25.61–135.50, well above the desirable value of 4 [45]. The coefficient of variation (CV) for all models was calculated to be less than 10%, which demonstrated their good reproducibility. All ANOVA parameters show suitability of the established models for final optimisation calculations.
After reaching the optimal values for T and FR, the separation was conducted in the optimised conditions. The close consistency between the calculated and experimental responses (Table 3) shows the usefulness of the models in predicting the chromatographic behaviour of the analytes. The experimental resolution of 1.497 was considered sufficient for quantitative analysis. The achieved analysis time of 6.20 is considerably shorter than those obtained previously on conventional HPLC systems, and also 1 min briefer than that obtained by Ampofo et al. [28] on a UHPLC instrument equipped in the chromatographic column of lower internal diameter. As can be seen from the computed models, a substantially larger ST reduction is not possible without compromising the resolution, and the developed method may be considered optimal in the investigated range of factors and on the selected chromatographic column.

3.3. Validation of the Method

Selectivity of the method and peak purity were analysed by the comparison of retention times and UV-VIS spectra with reference compounds using an automated match system. The comparison of the spectra upslope, apex, and downslope, and between the peak spectral data at different wavelengths confirmed that all analyte peaks of the real samples eluted as pure bands. Representative chromatograms (Figure 5), including that of the most complex extract of V. myrtillus, show good resolution of the matrix peaks and high selectivity of the developed method for the quantification of OA and UA.
Calibration standards were prepared in methanol. Linearity of the calibration curves was tested using two linear regression models (y = ax + b; y = ax), and the F- and t-tests were applied to check the statistical significance of the regression equations, slopes, and intercepts at the 99% confidence level. The correlation coefficient r of the accepted equations was 0.99998 for both analytes, and the chromatographic responses were linear in wide concentration ranges (Table 4). Since no significant differences (p < 0.05) were found between the slopes of the calibration curves and the matrix-matched sensitivity plots, the calibration standards prepared in methanol were assumed to be appropriate for the quantification of the target triterpenes in plant materials. The high sensitivity of the method was demonstrated with the low LODs (47–51 μg/mL; 0.14–0.15 ng) and LOQs (374–405 μg/mL; 1.12–1.22 ng). The LODs and LOQs of both compounds were similar, as were the slopes of their regression curves, which is consistent with their close structural similarity and, thus, similar UV-VIS absorption. In comparison with the previously developed HPLC methods with UV- (Table 5) and ELS-detection [25], as well as with the only one available to date UHPLC method [28] (Table 5), the sensitivity was highly improved. Lower LODs and LOQs could have been obtained for native OA and UA (43–95 ng/mL; 0.017–0.038 ng) with MS-detection [26], and for fluorophore derivatives (0.8–6.3 ng/mL; 0.004–0.063 ng) with FL-detection [17,22,23,24]. Stability of the standards (expressed as recovery of the initial concentration) was tested at 4 °C during 30 days in five-day intervals. All analytes were found stable in neutral solutions, with the 30th-day recovery >96%.
Precision of the method was tested for the standard solution and real sample of A. uva ursi. The RSD values for intraday and inter-day variabilities were <1% for the retention times and in the range of 0.4%–3.2% for the concentrations (Table 6).
Accuracy was tested by determination of recovery by the standard addition technique. The average total recovery of the method was 95.3%–100.9% for the both analytes, with RSD < 5% (Table 6).
The optimisation tests revealed that the separation results were susceptible to variations in several analytical conditions, especially in mobile-phase composition, flow rate, and column temperature. Therefore, the main system suitability parameters such as Rs of the critical pair and RSD values for retention times and peak areas should be regularly controlled using the standard solution to ensure that the validity of the proposed method is maintained whenever used.

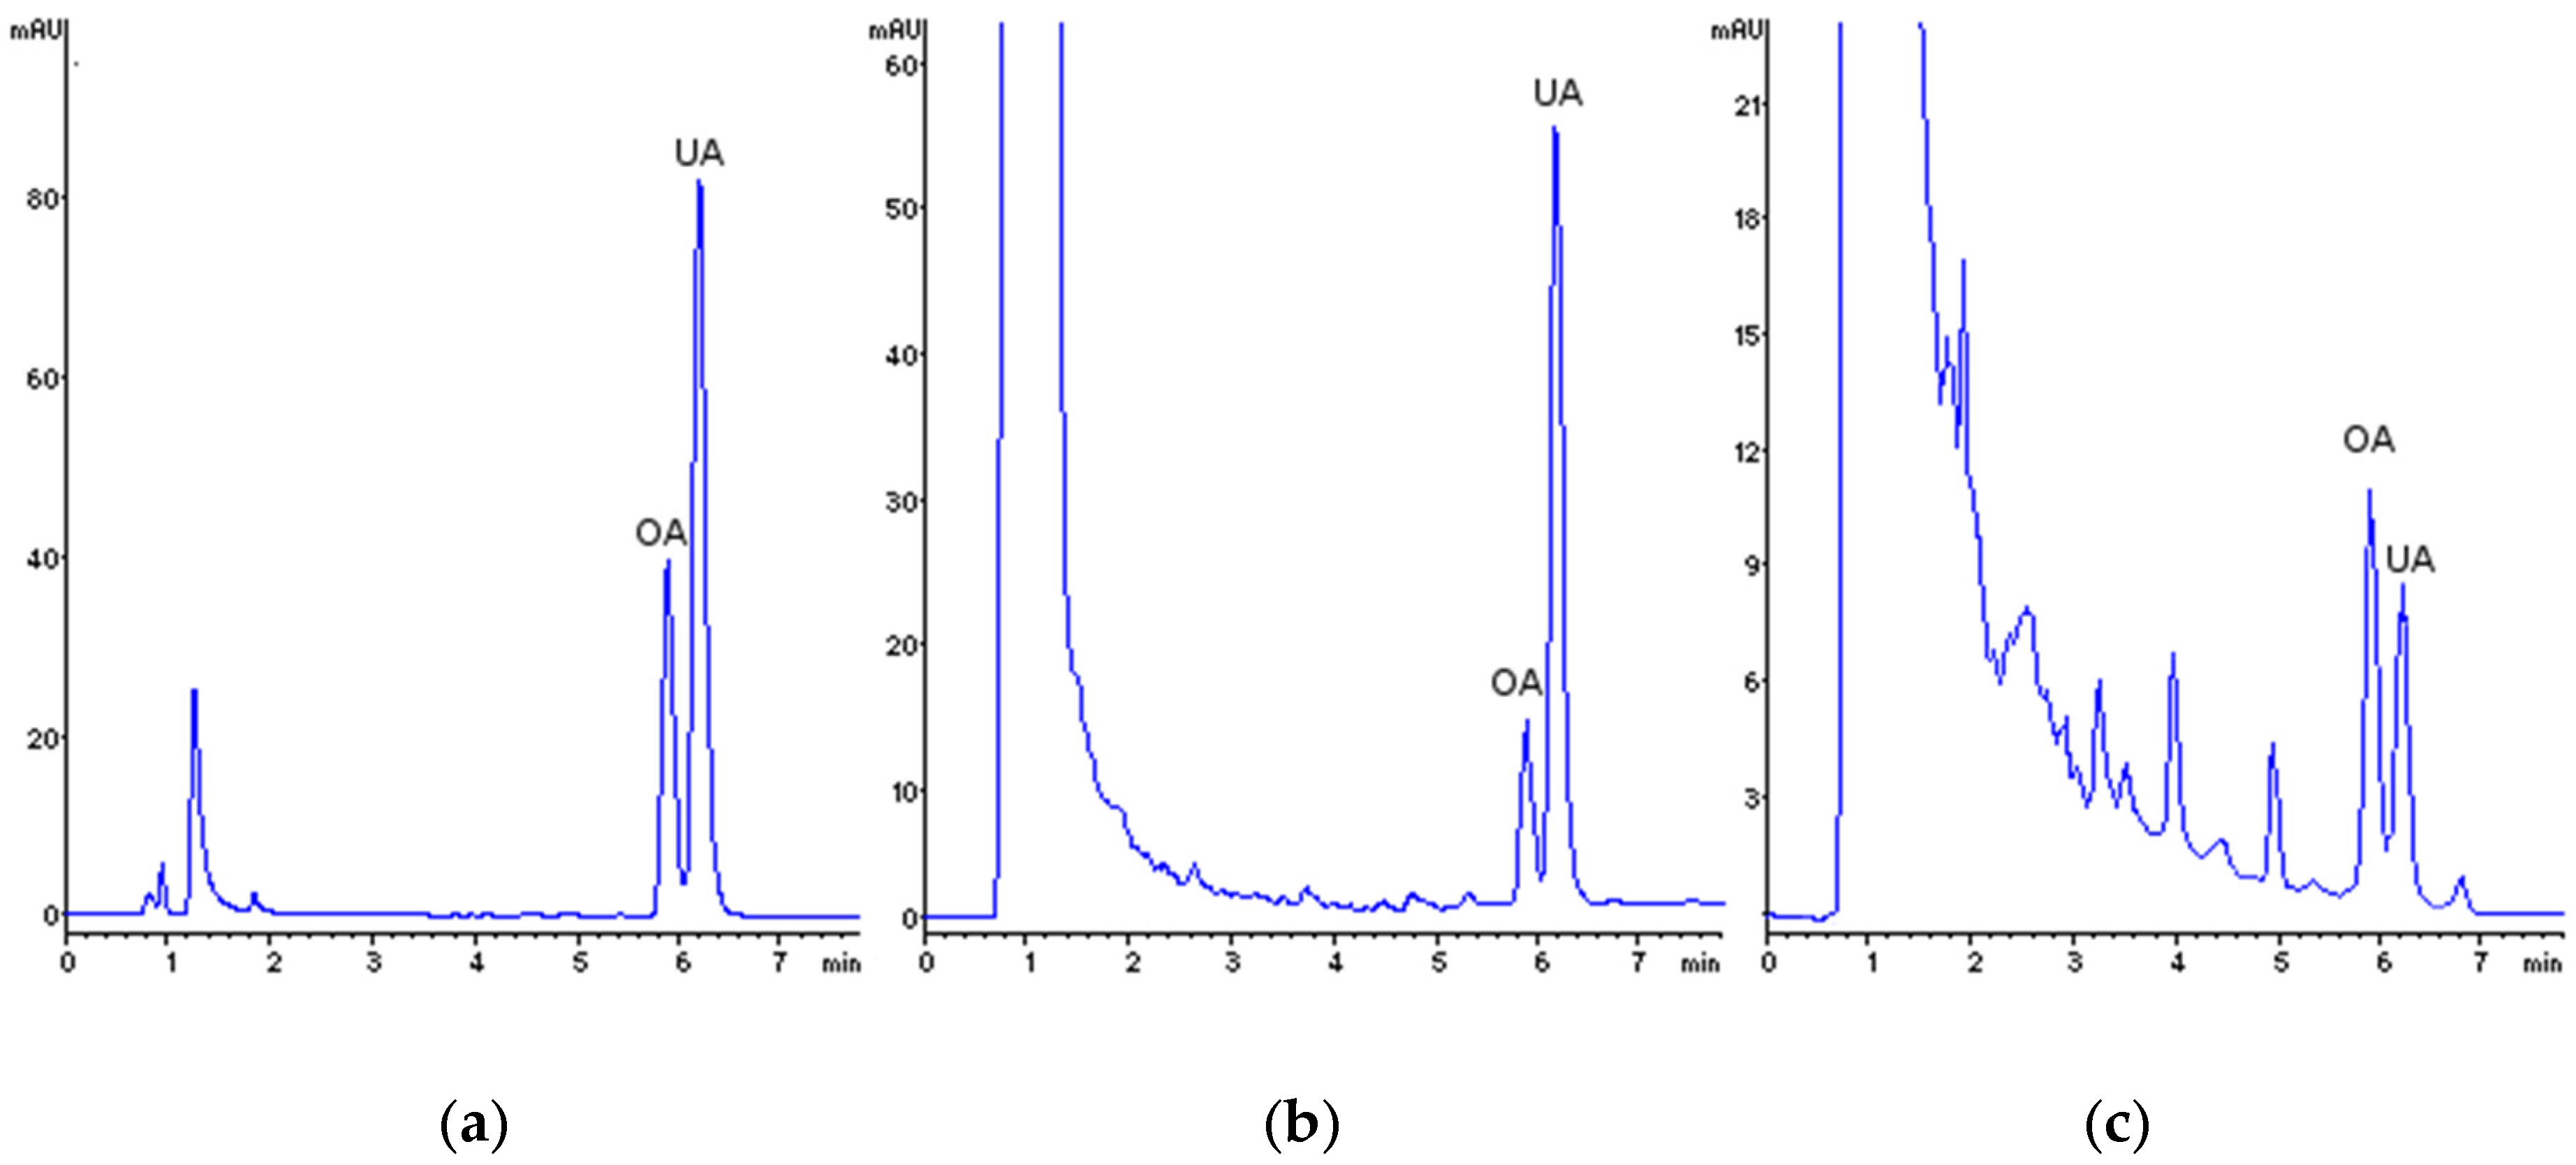
3.4. Method Application to Real Samples

The developed method was applied to the simultaneous determination of OA and UA in the leaves of selected Ericaceae species used in traditional medicine (Table 7). The leaves of A. uva ursi, V. vitis idaea, and V. myrtillus are well known herbal remedies commercially available in European countries, including Poland, recommended mainly for the treatment of urinary tract infections. G. procumbens is a plant native to North America and introduced to Europe as a source of leaves and essential oil used as anti-inflammatory agents of wide applicability.
In all of the tested plant materials OA and UA constituted the dominating part of the triterpene acid fraction with other triterpene peaks negligible or not existing at 215 nm, which is typical for the analysed taxons [46,47] and illustrated on the respective chromatograms (Figure 5). The amounts of OA and UA in the investigated plant tissues varied from 0.74 ± 0.01 mg/g dw to 4.47 ± 0.02 mg/g dw and from 1.30 ± 0.03 mg/g dw to 18.61 ± 0.23 mg/g dw, respectively. With the levels generally over three times higher than those of OA, the UA was the primary constituent in all samples (p < 0.001) except of V. myrtillus. The highest concentrations of both analytes were found in the leaves of A. uva ursi.
The detailed studies of triterpenes in the leaves of V. vitis idaea revealed that the content of both acids can vary significantly depending not only on the place of plant origin (i.e., local geoclimatic conditions), but also on the time of harvest and leaf development stage [48]. For UA it ranged from 1.59 mg/g dw to 3.16 mg/g dw, while for OA it ranged from 0.81 mg/g dw to 1.44 mg/g dw, which is consistent with the data obtained in our study. In the case of leaves of A. uva ursi and V. myrtillus our results are higher than the previous ones, but the relative ratio remains similar. For comparison, Jäger et al. [47] found in the leaf extract from A. uva ursi 12.4 mg/g dw of UA and 2.7 mg/g dw of OA. The leaves of V. myrtillus, depending on the collection sites, contained 0.85–0.87 mg/g dw of OA and 0.75–0.78 mg/g dw of UA [49]. These variations could be attributed not only to the differences in the harvest, preparation, and storage conditions between the commercial samples analysed in the present work and the plant material from natural habitats assayed earlier, but also presumably to the different extraction condition applied in the studies [48].
As standardisation procedures are generally meant for routine analyses of large amount of samples, the economy factor is of uttermost importance. During our experiments we noticed an increased need for inline filter change, which was likely caused by waxy substances extracted with chloroform. Therefore, we proposed an alternative extraction procedure that contains one additional step, i.e., pre-extraction of the plant material with n-hexane. This allowed for the removal of waxes and substantially (over two times) elongated the usability of the filters, reducing the costs of the analyses. However, due to the partial solubility of the investigated analytes in n-hexane, the results obtained in this way are underestimated. A correction factors were thus introduced allowing for quick recalculation of the factual OA and UA content. The factors were in the range of 1.46–1.95 for OA and 1.30–1.60 for UA (Table 8).

4. Conclusions

The UHPLC-PDA method reported here represents a new, simple, fast, and sensitive analytical tool for simultaneous determination of two prominent triterpene acids OA and UA in plant materials. The use of central composite design combined with Derringer’s desirability function and response surface methodology in the optimisation process assured achieving the shortest time of analysis possible on the applied column. Consequently, the established method was proved the fastest from all previously-described HPLC and UHPLC protocols, as well as significantly superior to the known HPLC-UV methods in term of sensitivity. The assay is accurate, reproducible, fully validated, and was successfully applied to real samples of herbal medicinal products of commercial importance, demonstrating its usefulness as an effective technique for standardisation and quality control procedures.

Acknowledgments

This work was financially supported by the Medical University of Lodz (Grants No. 503/3-012-01/503-31-001 and No. 503/3-022-01/503-31-001).

Author Contributions

M.A.O. and A.O. conceived and designed the experiments; M.A.O. and L.K. performed the experiments; A.O. and M.A.O. analysed the data; L.K. and H.W. contributed reagents/materials/analysis tools; A.O. and M.A.O. wrote the paper.

Conflicts of Interest

The authors declare no conflict of interest.

References

  1. Liu, J. Pharmacology of oleanolic acid and ursolic acid. J. Ethnopharmacol. 1995, 49, 57–68. [Google Scholar] [CrossRef]
  2. Checker, R.; Sandur, S.K.; Sharma, D.; Patwardhan, R.S.; Jayakumar, S.; Kohli, V.; Sethi, G.; Aggarwal, B.B.; Sainis, K.B. Potent Anti-inflammatory activity of ursolic acid, a triterpenoid antioxidant, is mediated through suppression of NF-kB, AP-1 and NF-AT. PLoS ONE 2012, 7, e31318. [Google Scholar] [CrossRef] [PubMed]
  3. Wolska, K.I.; Grudniak, A.M.; Fiecek, B.; Kraczkiewicz-Dowjat, A.; Kurek, A. Antibacterial activity of oleanolic and ursolic acids and their derivatives. Cent. Eur. J. Biol. 2010, 5, 543–553. [Google Scholar] [CrossRef]
  4. Kurek, A.; Nadkowska, P.; Pliszka, S.; Wolska, K.I. Modulation of antibiotic resistance in bacterial pathogens by oleanolic acid and ursolic acid. Phytomedicine 2012, 19, 515–519. [Google Scholar] [CrossRef] [PubMed]
  5. Tsai, S.J.; Yin, M.C. Antioxidative and anti-inflammatory protection of oleanolic acid and ursolic acid in PC12 cells. J. Food Sci. 2008, 73, H174–H178. [Google Scholar] [CrossRef] [PubMed]
  6. Ikeda, Y.; Murakami, A.; Ohigashi, H. Ursolic acid: An anti- and pro-inflammatory triterpenoid. Mol. Nutr. Food Res. 2008, 52, 26–42. [Google Scholar] [CrossRef] [PubMed]
  7. Schwery, O.; Onstein, R.E.; Bouchenak-Khelladi, Y.; Xing, Y.; Carter, R.J.; Linder, H.P. As old as the mountains: The radiation of the Ericaceae. New Phytol. 2015, 207, 355–367. [Google Scholar] [CrossRef] [PubMed]
  8. Zhou, C.; Sheng, Y.; Zhao, D.; Wang, Z.; Tao, J. Variation of oleanolic and ursolic acid in the flesh of persimmon fruit among different cultivars. Molecules 2010, 15, 6580–6587. [Google Scholar] [CrossRef] [PubMed]
  9. Naumoska, K.; Simonovska, B.; Albreht, A.; Vovk, I. TLC and TLC-MS screening of ursolic, oleanolic and betulinic acids in plant extracts. J. Planar. Chromatogr. Mod. TLC 2013, 26, 125–131. [Google Scholar] [CrossRef]
  10. Janicsak, G.; Veres, K.; Kallai, M.; Mathe, I. Gas chromatographic method for routine determination of oleanolic and ursolic acids in medicinal plants. Chromatographia 2003, 58, 295–299. [Google Scholar]
  11. Yang, P.; Li, Y.; Liu, X.; Jiang, S. Determination of free isomeric oleanolic acid and ursolic acid in Pterocephalus hookeri by capillary zone electrophoresis. J. Pharm. Biomed. Anal. 2007, 43, 1331–1334. [Google Scholar] [CrossRef] [PubMed]
  12. Lesellier, E.; Destandau, E.; Grigoras, C.; Fougere, L.; Elfakir, C. Fast separation of triterpenoids by supercritical fluid chromatography/evaporative light scattering detector. J. Chromatogr. A. 2012, 1268, 157–165. [Google Scholar] [CrossRef] [PubMed]
  13. Du, H.; Chen, X.Q. A comparative study of the separation of oleanolic acid and ursolic acid in Prunella vulgaris by high-performance liquid chromatography and cyclodextrin-modified micellar electrokinetic chromatography. J. Iran. Chem. Soc. 2009, 6, 334–340. [Google Scholar] [CrossRef]
  14. Kontogianni, V.G.; Exarchou, V.; Troganis, A.; Gerothanassis, I.P. Rapid and novel discrimination and quantification of oleanolic and ursolic acids in complex plant extracts using two-dimensional nuclear magnetic resonance spectroscopy—Comparison with HPLC methods. Anal. Chim. Acta. 2009, 635, 188–195. [Google Scholar] [CrossRef] [PubMed]
  15. Zhang, Y.; Xue, K.; Zhao, E.Y.; Li, Y.; Yao, L.; Yang, X.; Xie, X. Determination of oleanolic acid and ursolic acid in Chinese medicinal plants using HPLC with PAH polymeric C18. Pharmacogn. Mag. 2013, 9, S19–S24. [Google Scholar] [CrossRef] [PubMed]
  16. Olszewska, M. Optimization and validation of an HPLC-UV method for analysis of corosolic, oleanolic, and ursolic acids in plant material: Application to Prunus serotina Ehrh. Acta Chromatogr. 2008, 20, 643–659. [Google Scholar] [CrossRef]
  17. Zhang, S.; Sun, Y.; Sun, Z.; Wang, X.; You, J.; Suo, Y. Determination of triterpenic acids in fruits by a novel high performance liquid chromatography method with high sensitivity and specificity. Food Chem. 2014, 146, 264–269. [Google Scholar] [CrossRef] [PubMed]
  18. Wójciak-Kosior, M.; Sowa, I.; Kocjan, R.; Nowak, R. Effect of different extraction techniques on quantification of oleanolic and ursolic acid in Lamii albi flos. Ind. Crop. Prod. 2013, 44, 373–377. [Google Scholar] [CrossRef]
  19. Zou, S.; Chen, W. Determination of oleanolic and ursolic acids in different parts of Perilla frutescens by high-performance liquid chromatography. J. Braz. Chem. Soc. 2008, 19, 1429–1432. [Google Scholar] [CrossRef]
  20. Fan, J.-P.; Zhang, R.-F.; Zhang, X.-H.; Zhu, J.-H.; Huang, J.-Z. Separation of three triterpene acids in leaves of Diospyros kaki by high performance liquid chromatography using hydroxy-propyl-β-cyclodextrin as mobile phase modifier. J. Liq. Chromatogr. R. T. 2011, 34, 1340–1355. [Google Scholar] [CrossRef]
  21. Wang, C.; Liu, H.; Zhang, B.; Guo, H. Determination of oleanolic and ursolic acid in Chinese herbs using HPLC and γ-CD as mobile phase modifier. J. Sep. Sci. 2011, 34, 3023–3028. [Google Scholar] [CrossRef] [PubMed]
  22. Hu, N.; Suo, Y.; Zhang, Q.; You, J.; Ji, Z.; Wang, A.; Han, L.; Lv, H.; Ye, Y. Rapid, Selective, and Sensitive Analysis of triterpenic acids in Hippophae rhamnoides L. using HPLC with pre-column fluorescent derivatization and identification with post-column APCI-MS. J. Liq. Chromatogr. R. T. 2015, 38, 451–458. [Google Scholar] [CrossRef]
  23. Li, G.-L.; You, J.-M.; Song, C.-H.; Xia, L.; Zheng, J.; Suo, Y.-R. Development of a new HPLC method with precolumn fluorescent derivatization for rapid, selective and sensitive detection of triterpenic acids in fruits. J. Agric. Food Chem. 2011, 59, 2972–2979. [Google Scholar] [CrossRef] [PubMed]
  24. Li, G.; Zhang, X.; You, J.; Song, C.; Sun, Z.; Xia, L.; Suo, Y. Highly sensitive and selective pre-column derivatization high-performance liquid chromatography approach for rapid determination of triterpenes oleanolic and ursolic acids and application to Swertia species: Optimization of triterpenic acids extraction and pre-column derivatization using response surface methodology. Anal. Chim. Acta 2011, 688, 208–218. [Google Scholar] [PubMed]
  25. Yang, G.; Fen, W.; Lei, C.; Xiao, W.; Sun, H. Study on determination of pentacyclic triterpenoids in Chaenomeles by HPLC–ELSD. J. Chromatogr. Sci. 2009, 47, 718–722. [Google Scholar] [CrossRef] [PubMed]
  26. Zhao, L.; Li, W.; Li, Y.; Xu, H.; Lv, L.; Wang, X.; Chai, Y.; Zhang, G. Simultaneous determination of oleanolic and ursolic acids in rat plasma by HPLC–MS: Application to a pharmacokinetic study after oral administration of different combinations of QingGanSanJie decoction extracts. J. Chromatogr. Sci. 2015, 53, 1185–1192. [Google Scholar] [CrossRef]
  27. Chesnut, S.M.; Salisbury, J.J. The role of UHPLC in pharmaceutical development. J. Sep. Sci. 2007, 30, 1183–1190. [Google Scholar] [CrossRef] [PubMed]
  28. Ampofo-Yeboah, A.; Lambrechts, H.; Brink, D.; Hiten, F.; Afriyie-Gyawu, E. Analysis of oleanolic acid and ursolic acid, potential antifertility agents in moringa (Moringa oleifera) seed. J. Agric. Sci. Technol. A 2013, 3, 989–999. [Google Scholar]
  29. Guillarme, D.; Nguyen, D.T.-T.; Rudaz, S.; Veuthey, J.-L. Method transfer for fast liquid chromatography in pharmaceutical analysis: Application to short columns packed with small particle. Part I: Isocratic separation. Eur. J. Pharm. Biopharm. 2007, 66, 475–482. [Google Scholar] [CrossRef] [PubMed]
  30. Ferreira, S.L.C.; Bruns, R.E.; da Silva, E.G.P.; dos Santos, W.N.L.; Quintella, C.M.; David, J.M.; de Andrade, J.B.; Breitkreitz, M.C.; Jardim, I.C.S.F.; Neto, B.B. Statistical designs and response surface techniques for the optimization of chromatographic systems. J. Chromatogr. A 2007, 1158, 2–14. [Google Scholar] [CrossRef] [PubMed]
  31. Myers, R.H.; Montgomery, D.C.; Anderson-Cook, C.M. Response Surface Methodology: Process and Product Optimization Using Designed Experiments; Wiley: Hoboken, NJ, USA, 2009. [Google Scholar]
  32. Derringer, G.; Suich, R. Simultaneous optimization of several response variables. J. Qual. Technol. 1980, 12, 214–219. [Google Scholar]
  33. Q2B Validation of Analytical Procedures: Methodology. Available online: http://www.fda.gov/downloads/Drugs/GuidanceComplianceRegulatoryInformation/Guidances/UCM073384.pdf (accessed on 5 May 2014).
  34. Corley, J. Best practices in establishing detection and quantification limits for pesticide residues in foods. In Handbook of Residue Analytical Methods for Agrochemicals; Lee, P.W., Aizawa, H., Barefoot, A.C., Murphy, J.J., Eds.; Wiley: New York, NY, USA, 2003; Volume 1. [Google Scholar]
  35. Jin, I.J.; Ko, Y.I.; Kim, Y.M.; Han, S.K. Solubilization of oleanolic acid and ursolic acid by cosolvency. Arch. Pharm. Res. 1997, 20, 269–274. [Google Scholar] [CrossRef] [PubMed]
  36. Schneider, P.; Hosseiny, S.S.; Szczotka, M.; Jordan, V.; Schlitter, K. Rapid solubility determination of the triterpenes oleanolic acid and ursolic acid by UV-spectroscopy in different solvents. Phytochem. Lett. 2009, 2, 85–87. [Google Scholar] [CrossRef]
  37. Olszewska, M.A.; Michel, P. Antioxidant activity of inflorescences, leaves and fruits of three Sorbus species in relation to their polyphenolic composition. Nat. Prod. Res. 2009, 23, 1507–1521. [Google Scholar] [CrossRef] [PubMed]
  38. Fang, X.; Wang, J.; Yu, X.; Zhang, G.; Zhao, J. Optimization of microwave-assisted extraction followed by RP-HPLC for the simultaneous determination of oleanolic acid and ursolic acid in the fruits of Chaenomeles sinensis. J. Sep. Sci. 2010, 33, 1147–1155. [Google Scholar] [PubMed]
  39. Wang, H.; Wang, Z.; Guo, W. Comparative determination of ursolic acid and oleanolic acid of Macrocarpium officinalis (Sieb. et Zucc.) Nakai by RP-HPLC. Ind. Crops Prod. 2008, 28, 328–332. [Google Scholar] [CrossRef]
  40. Xu, X.-H.; Su, Q.; Zang, Z.-H. Simultaneous determination of oleanolic acid and ursolic acid by RP-HPLC in the leaves of Eriobotrya japonica Lindl. J. Pharm. Anal. 2012, 2, 238–240. [Google Scholar] [CrossRef]
  41. Sowa, I.; Wójciak-Kosior, M.; Rokicka, K.; Kocjan, R.; Szymczak, G. Application of solid phase extraction with the use of silica modified with polyaniline film for pre-treatment of samples from plant material before HPLC determination of triterpenic acids. Talanta 2014, 122, 51–57. [Google Scholar] [CrossRef] [PubMed]
  42. Gbaguidi, F.; Accrombessi, G.; Moudachirou, M.; Quetin-Leclercq, J. HPLC quantification of two isomeric triterpenic acids isolated from Mitracarpus scaber and antimicrobial activity on Dermatophilus congolensis. J. Pharm. Biomed. Anal. 2005, 39, 990–995. [Google Scholar] [CrossRef] [PubMed]
  43. Warren, F.V., Jr.; Bidiingmeyer, B.A. Influence of temperature on column efficiency in reversed-phase liquid chromatography. Anal. Chem. 1988, 60, 2024–2027. [Google Scholar] [CrossRef]
  44. Lundstedt, T.; Seifert, E.; Abramo, L.; Thelin, B.; Nyström, Å.; Pettersen, J.; Bergman, R. Experimental design and optimization. Chemometr. Intell. Lab. 1988, 42, 3–40. [Google Scholar] [CrossRef]
  45. Giriraj, P.; Sivakkumar, T. Development and validation of a rapid chemometrics assisted RP-HPLC with PDA detection method for the simultaneous estimation of pyridoxine HCl and doxylamine succinate in bulk and pharmaceutical dosage form. Chromatogr. Res. Int. 2014. [Google Scholar] [CrossRef]
  46. Caligiani, A.; Malavasi, G.; Palla, G.; Marseglia, A.; Tognolini, M.; Bruni, R. A simple GC–MS method for the screening of betulinic, corosolic, maslinic, oleanolic and ursolic acid contents in commercial botanicals used as food supplement ingredients. Food Chem. 2013, 136, 735–741. [Google Scholar] [CrossRef] [PubMed]
  47. Jäger, S.; Trojan, H.; Kopp, T.; Laszczyk, M.N.; Scheffler, A. Pentacyclic triterpene distribution in various plants—Rich sources for a new group of multi-potent plant extracts. Molecules 2009, 14, 2016–2031. [Google Scholar] [CrossRef] [PubMed]
  48. Szakiel, A.; Pączkowski, C.; Koivuniemi, H.; Huttunen, S. Comparison of the triterpenoid content of berries and leaves of lingonberry Vaccinium vitis-idaea from Finland and Poland. J. Agric. Food Chem. 2012, 60, 4994–5002. [Google Scholar] [CrossRef] [PubMed]
  49. Szakiel, A.; Pączkowski, C.; Huttunen, S. Triterpenoid content of berries and leaves of bilberry Vaccinium myrtillus from Finland and Poland. J. Agric. Food Chem. 2012, 60, 11839–11849. [Google Scholar] [CrossRef] [PubMed]
Figure 1. Molecular structures of ursolic acid (UA) and oleanolic acid (OA).
Applsci 06 00244 g001
Figure 2. Content of OA, UA, and polyphenols (TPC) in the leaves of A. uva ursi as calculated per dry weight basis in extracts obtained with different solvents: S1, n-hexane (3 × 30 mL); S2, chloroform (3 × 30 mL); S3, chloroform-methanol 1:1 (3 × 30 mL); S4, chloroform (2 × 30 mL) + chloroform-methanol 1:1 (30 mL); S5, methanol (3 × 30 mL); and S6, n-butanol (3 × 30 mL). Values are presented as means (n = 3) ± standard deviation (error bars). Different superscripts (capitals, A–E) for each analyte indicate significant differences in the means at p < 0.05.
Applsci 06 00244 g002
Figure 3. Response surface for: (a) the resolution and (b) separation time estimated from the central composite design as a function of flow rate and temperature.
Applsci 06 00244 g003
Figure 4. Response surface of Derringer’s desirability estimated from the central composite design as a function of flow rate and temperature.
Applsci 06 00244 g004
Figure 5. Representative chromatograms in the optimised conditions at λ = 215 nm of: (a) standards at concentrations of 149.40 μg/mL (OA), 324.30 μg/mL (UA), (b) A. uva ursi leaves (12 mg/mL), and (c) V. myrtillus leaves (30 mg/mL).
Applsci 06 00244 g005
Table 1. Experimental variables, levels, design matrix and responses for the central composite design 1.
RunLevelsFactorsResponses
TFRT (°C)FR (mL/min)ST (min)RsD
1+1+127.00.504.5831.290.000
2+1−127.00.307.5911.490.228
3−1+117.00.505.5611.420.442
4−1−117.00.309.2651.710.000
5−1.41015.00.407.2441.590.382
6+1.41029.10.405.5011.360.316
70−1.4122.00.269.6201.660.000
80+1.4122.00.544.6601.310.141
90022.00.406.2821.500.479
100022.00.406.2891.490.466
110022.00.406.2831.490.466
120022.00.406.2861.490.466
130022.00.406.2891.490.466
1 T: temperature; FR: flow rate; ST: separation time (retention time of the last peak; Rs: resolution OA/UA acc. to Equation (5); D: Total response acc. to Equation (2).
Table 2. Response models and statistical parameters obtained from ANOVA.
Response 1Reduced Response ModelR2Adjusted R2 2F-Value 3p-Value 4CV (%) 5Adequate Precision
ST6.31 − 0.64T − 1.72FR + 0.42FR2 + 0.17TFR0.99930.99891960.31<0.00010.91%135.50
Rs1.49 − 0.08T − 0.01T2 − 0.12FR + 0.02TFR0.99840.99761268.19<0.00010.40%113.43
D0.47 − 0.04T + 0.05FR − 0.07T2 − 0.02FR2 − 0.17TFR0.98870.9806122.57<0.00019.29%25.61
1 ST: separation time (retention time of the last peak); Rs: resolution OA/UA acc. to Equation (5); D: overall desirability function acc. to Equation (2). 2 R2 adjusted for number of terms in the model. 3 Test for comparing model variance with residual (error) variance. 4 Probability of seeing the observed F-value if the null hypothesis is true. 5 Coefficient of variance.
Table 3. Experimental and predicted responses under optimal conditions.
Response 1Predicted ValuesExperimental ValuesError 2 (%)
ST (min)6.0906.2001.81
Rs1.4901.5000.67
D0.4950.4901.01
1 ST: separation time (retention time of the last peak; Rs: resolution OA/UA acc. to Equation (5); D: total response acc. to Equation (2). 2 Percent error between predicted and experimental values.
Table 4. Linear regression and sensitivity data.
AnalyteLinearity Range (μg/mL)Linear Regression (n) 1rF-Test Value for Linear Fit 2LOD 3
[ng/mL (ng)]
LOQ 4
[ng/mL (ng)]
OA1.49–149.40y = 3.3355 x (6)0.99998144923.0447 (0.141)374 (1.122)
UA3.24–324.30y = 3.3535 x (6)0.99998155563.17351 (0.153)405 (1.215)
1 y, peak area; x, concentration of the standard in (μg/mL); n, number of data points (concentration levels). 2 Fisher variance ratio for the experimental data (the critical value at α = 0.01 is 8.5310 for n = 6). 3 Limit of detection. 4 Limit of quantitation.
Table 5. Comparison of selected methods of OA (oleanolic acid) and UA (ursolic acid) separation.
AuthorsMethodColumnMobile PhaseFR 1 (mL/min)T 2 (°C)ST 3
(min)
LOD 4 (ng)Rs 5
Zou and Chen [19]HPLC-PDAKromasil 100 C18 (250 × 4.6 mm, 5 μm)MeOH:0.5% aqueous H3PO4 (88:12, v/v)1.02519.57.8–8.42.5
Fan et al. [20]HPLC-PDAZorbax Eclipse XDB-C18 (150 × 4.6 mm, 5 μm)MeOH:0.2% aqueous AcOH (85:15, v/v) + HP-β-CD (10 mmol/L)1.03511.520.8–22.32.0
Zhang et al. [15]HPLC-UVUltimate XB-PAH (250 × 4.6 mm, 5 μm)MeCN:water (85:15, v/v)1.02516.92.1–3.3>3.4
Sowa et al. [41]HPLC-PDASupelco Discovery C18 (250 × 4.6 mm, 5 μm)MeCN:water:1% H3PO4 (90:10:0.5 v/v/v)0.8109.62.8–3.01.6
Olszewska [16]HPLC-UVNucleodur Gravity C18 (250 × 4.6 mm, 5 μm)MeOH:1% aqueous H3PO4 (90:10, v/v)0.62025.00.7–1.01.5
Ampofo- Yeboah et al. [28]UHPLC-ESI-MS/MSWaters Acquity BEH
C18 (100 × 2.1mm, 2.1 μm)
MeOH:10 mmol aqueous ammonium acetate (75:25, v/v)0.38507.20.61.5
presentUHPLC-PDAZorbax Eclipse XDB C18 (100 × 3.0, 1.8 μm)MeOH:1% aqueous H3PO4 (90:10, v/v)0.44186.20.1–0.21.5
1 Flow rate. 2 Temperature. 3 Separation time (retention time of the last peak). 4 Limit of detection. 5 Resolution OA/UA.
Table 6. Validation parameters of precision and accuracy.
AnalytePrecision (RSD %) 1Accuracy 2
Level (μg/mL)Intra-Day VariabilityInter-day VariabilitySpiked Level (μg/mL)Recovery (RSD, %)
tRPeak AreatRPeak Area
OA149.400.040.450.451.56595.98 (1.78)
52.700.120.650.441.795098.32 (2.23)
14.940.141.140.392.1610096.75 (2.13)
UA324.300.040.430.491.021096.78 (2.38)
198.110.090.930.371.3310097.47 (1.91)
32.430.131.220.432.4620097.83 (2.48)
1 Values for the standard solution tested at 100% and 10% of the stock concentration and for A. uva ursi leaves (52.70 μg/mL OA, 198.11 μg/mL UA). 2 Spiked levels refer to the analyte amount added to the sample of V. vitis idaea leaves (nominal concentration of 22.33 μg/mL OA, 67.43 μg/mL UA).
Table 7. Content of OA and UA in investigated leaf samples.
SpeciesOA (mg/g) 1UA (mg/g) 1
Arctostaphylos uva ursi4.47 ± 0.022 D18.61 ± 0.233 D
Gaultheria procumbens1.58 ± 0.049 B5.76 ± 0.043 C
Vaccinium myrtillus1.78 ± 0.003 C1.30 ± 0.034 A
Vaccinium vitis idaea0.74 ± 0.008 A2.50 ± 0.021 B
1 Values calculated per dry weight basis and presented as means (n = 3) ± standard deviation. Different superscripts (capitals, A–D) in each column indicate significant differences in the means (p < 0.05).
Table 8. Results of OA and UA determination obtained with alternative extraction procedure and correction factors.
SpeciesOA (mg/g) 1FOA 2UA (mg/g) 1FUA 2
Arctostaphylos uva ursi3.06 ± 0.087 D1.4614.37 ± 0.305 D1.30
Gaultheria procumbens0.84 ± 0.012 B1.883.71 ± 0.067 C1.55
Vaccinium myrtillus1.13 ± 0.035 C1.570.81 ± 0.019 A1.60
Vaccinium vitis idaea0.38 ± 0.018 A1.951.57 ± 0.039 B1.59
1 Values calculated per dry weight basis and presented as means (n = 3) ± standard deviation. Different superscripts (capitals, A–D) in each column indicate significant differences in the means (p < 0.05). 2 Correction factors (F) for recalculating the factual OA and UA content.

