Abstract
As a successful solution applied to hard machining, the minimum quantity lubricant (MQL) has already been established as an alternative to flood coolant processing. The optimization of MQL parameters and cutting parameters under MQL condition are essential and pressing. The study was divided into two parts. In the first part of this study, the Taguchi method was applied to find the optimal values of MQL condition in the hard milling of AISI H13 with consideration of reduced surface roughness. The L9 orthogonal array, the signal-to-noise (S/N) ratio and analysis of variance (ANOVA) were employed to analyze the effect of the performance characteristics of MQL parameters (i.e., cutting fluid type, pressure, and fluid flow) on good surface finish. In the results section, lubricant and pressure of MQL condition are determined to be the most influential factors which give a statistically significant effect on machined surfaces. A verifiable experiment was conducted to demonstrate the reliability of the results. In the second section, the optimized MQL parameters were applied in a series of experiments to find out cutting parameters of hard milling. The Taguchi method was also used to optimize the cutting parameters in order to obtain the best surface roughness. The design of the experiment (DOE) was implemented by using the L27 orthogonal array. Based on an analysis of the signal-to-noise response and ANOVA, the optimal values of cutting parameters (i.e., cutting speed, feed rate, depth-of-cut and hardness of workpiece) were introduced. The results of the present work indicate feed rate is the factor having the most effect on surface roughness.
1. Introduction
Hard machining has been widely applied in mechanical processing due to the many advantages included. The advantages of hard machining were indicated to be geometric accuracy, improved quality of the finished surface, the reduction of the labor expenditures [1] and also a reduction in burr formation, better chip disposal, higher stability, simplified tooling [2] and flexible process design [3,4]. However, hard machining also has its disadvantages, such as high tool wear rate, reduction in tool life due to the effect of high hardness of workpiece material and cutting temperature [2,4]. The application of flood coolant in hard milling has not been satisfied, especially in the matter of environmental and health-related issues regarding workers. As a successful solution applied to hard machining, MQL is an effective, environmentally-friendly solution and has been widely used in the machining processes (i.e., turning, drilling and milling). According to Phafat et al. [5], machining with MQL is a process in which a small amount lubricant utilized at a flow rate less than 250 mL/h is mixed with compressed air and sprayed onto the cutting zone. MQL helps to increase the quality of the surface finish [6,7,8], improve tool life, reduce tool wear, decrease cutting temperature and reduce the cost of lubrication [6,7,8,9,10,11,12]. The effectiveness of MQL has already been demonstrated in many studies and application of turning and milling processes. In machining with MQL, lubricant, air pressure and fluid flow are the main parameters. They will decide the effectiveness of MQL cutting. Applied lubricants in machining are ubiquitous, such as mineral oil, synthetic esters, fatty alcohols, etc. [8]. Even vegetable oil has been used and proven to be effective in machining [7,8]. Several authors optimized MQL parameters and achieved positive results. Thakur et al. [13] conducted optimization of MQL parameters to get minimum tool wear in the high-speed turning of super-alloy Inconel 718. Simultaneously, the cutting parameters, including cutting speed and feed rate, were also optimized. Nevertheless, the optimization of MQL parameters does not consist of a cutting fluid being an important factor of MQL. The result showed that the optimal cutting parameters for tool flank wear are lower cutting speed, lower feed rate, higher delivery pressure, higher quantity of lubrication, lower frequency of pulses and an inclined direction of the cutting fluid. In the study of Gandhe et al. [14], experiments were carried out to optimize the MQL parameters in the turning of EN-8 steel. It showed that the cutting fluid used is the most significant factor affecting tool wear. J. Barnabas et al. [15] have done a comparative analysis of particle swarm optimization and simulated annealing algorithm in the optimization of the MQL parameters for flank tool wear. The author presented a simulated annealing algorithm technique that is comparatively better than other techniques in use. However, the studies conducted on the effects and optimization of the parameters in MQL, such as flow rate, air pressure and type of lubricant used, still remain open.
Surface roughness is an important index used to estimate product quality in mechanical products. The parameters that influence surface roughness include cutting tool properties (i.e., tool material, tool shape, run-out error, nose radius), workpiece properties (i.e., workpiece diameter, workpiece hardness, workpiece length), cutting phenomena (i.e., acceleration, vibrations, chip formation, friction in the cutting zone, cutting force variation) and machining parameters (i.e., process kinematics, cooling fluid, step over, tool angle, depth-of-cut, feed rate, cutting speed) [16]. In any machining process, the primary key point for insuring the quality of the manufacturing processes is the selection of suitable cutting parameters for the corresponding material of the workpieces. With a designed experiments approach, the Taguchi technique for the design of experimentation is a method extensively used in optimizing the cutting parameters and predicting surface roughness. There has been some notable research produced related to the effects of cutting parameters on surface roughness in which the Taguchi method was applied. Ahmet et al. [17], Ilhan et al. [18] applied the Taguchi method to optimizing the tuning parameters in hard turning. The authors concluded that feed rate contributes mostly to surface roughness. The Taguchi method and ANOVA were also employed in the study of Gopalsamy et al. [19]. The authors found optimum process parameters during hard machining of hardened steel. In the results of this research, the cutting speed is the most influential factor on surface roughness. The AISI H13 steel selected in this study constituted a workpiece material which has been widely used in manufacturing, especially in high pressure die-casting and extrusion molding, cutting blades, and hot dies due to good toughness levels and resistance to abrasion. AISI H13 steel has been studied in many types of research. Ding et al. [20] used the Taguchi method and ANOVA to establish and analyze an empirical model for establishing surface roughness. This model indicates a relationship between surface roughness and four factors of cutting parameters: cutting speed, feed, radial depth of cut, and the axial depth of cut. The results showed that axial depth of cut is the main influential factor on surface roughness. In the research of Outeiro [21], the DOE method in Taguchi was used to design the experiment. The model of the residual stress and the optimization of cutting parameters was established by applying Artificial Neural Network (ANN) and a Genetic Algorithm (GA). The results indicated that the cutting parameters, which cause lower residual stress and contribute to better surface roughness. Ghani et al. [22] concluded that high cutting speed, low feed rate and lower depth of cut provided the best results for surface roughness in machining hardened steel AISI H13.
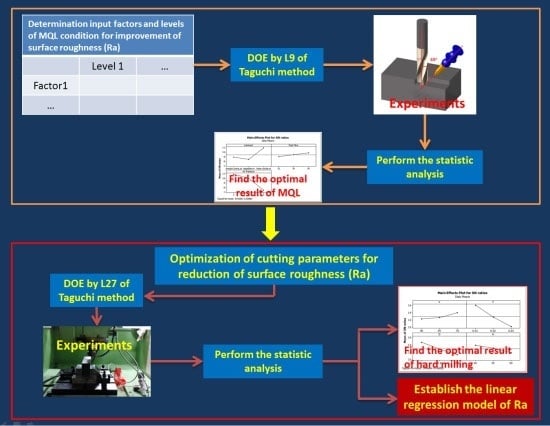
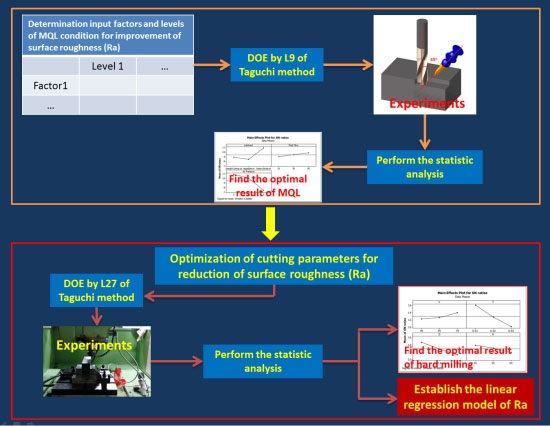
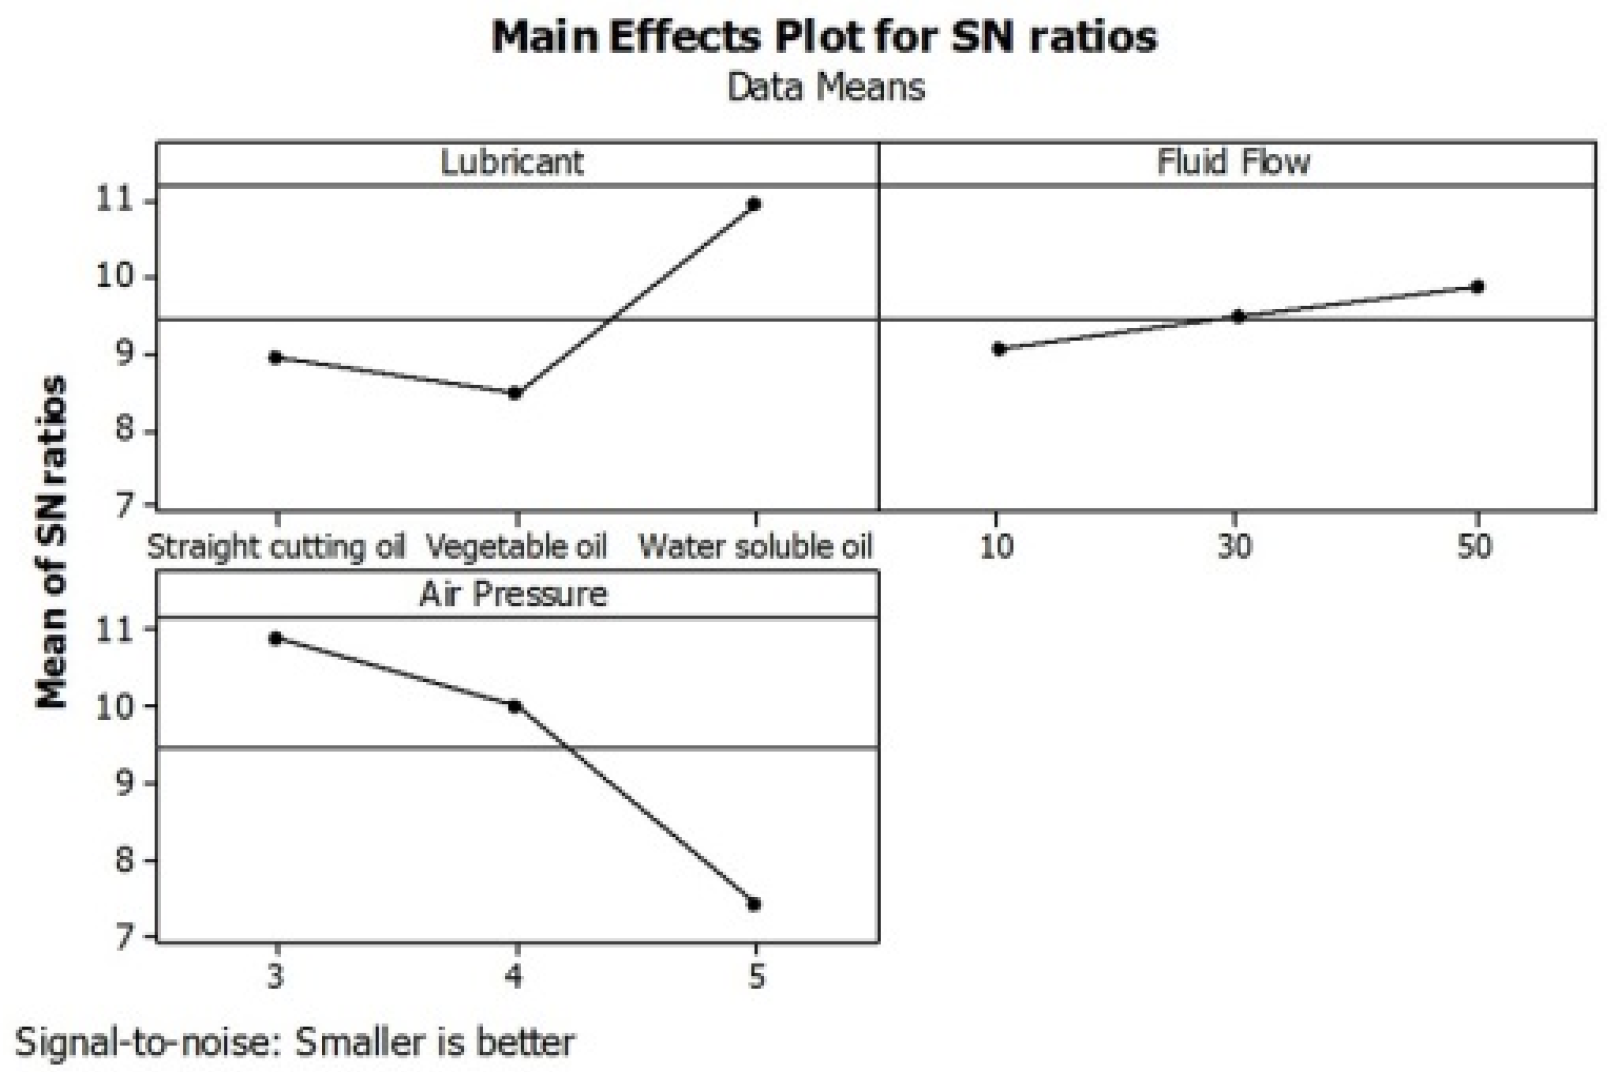
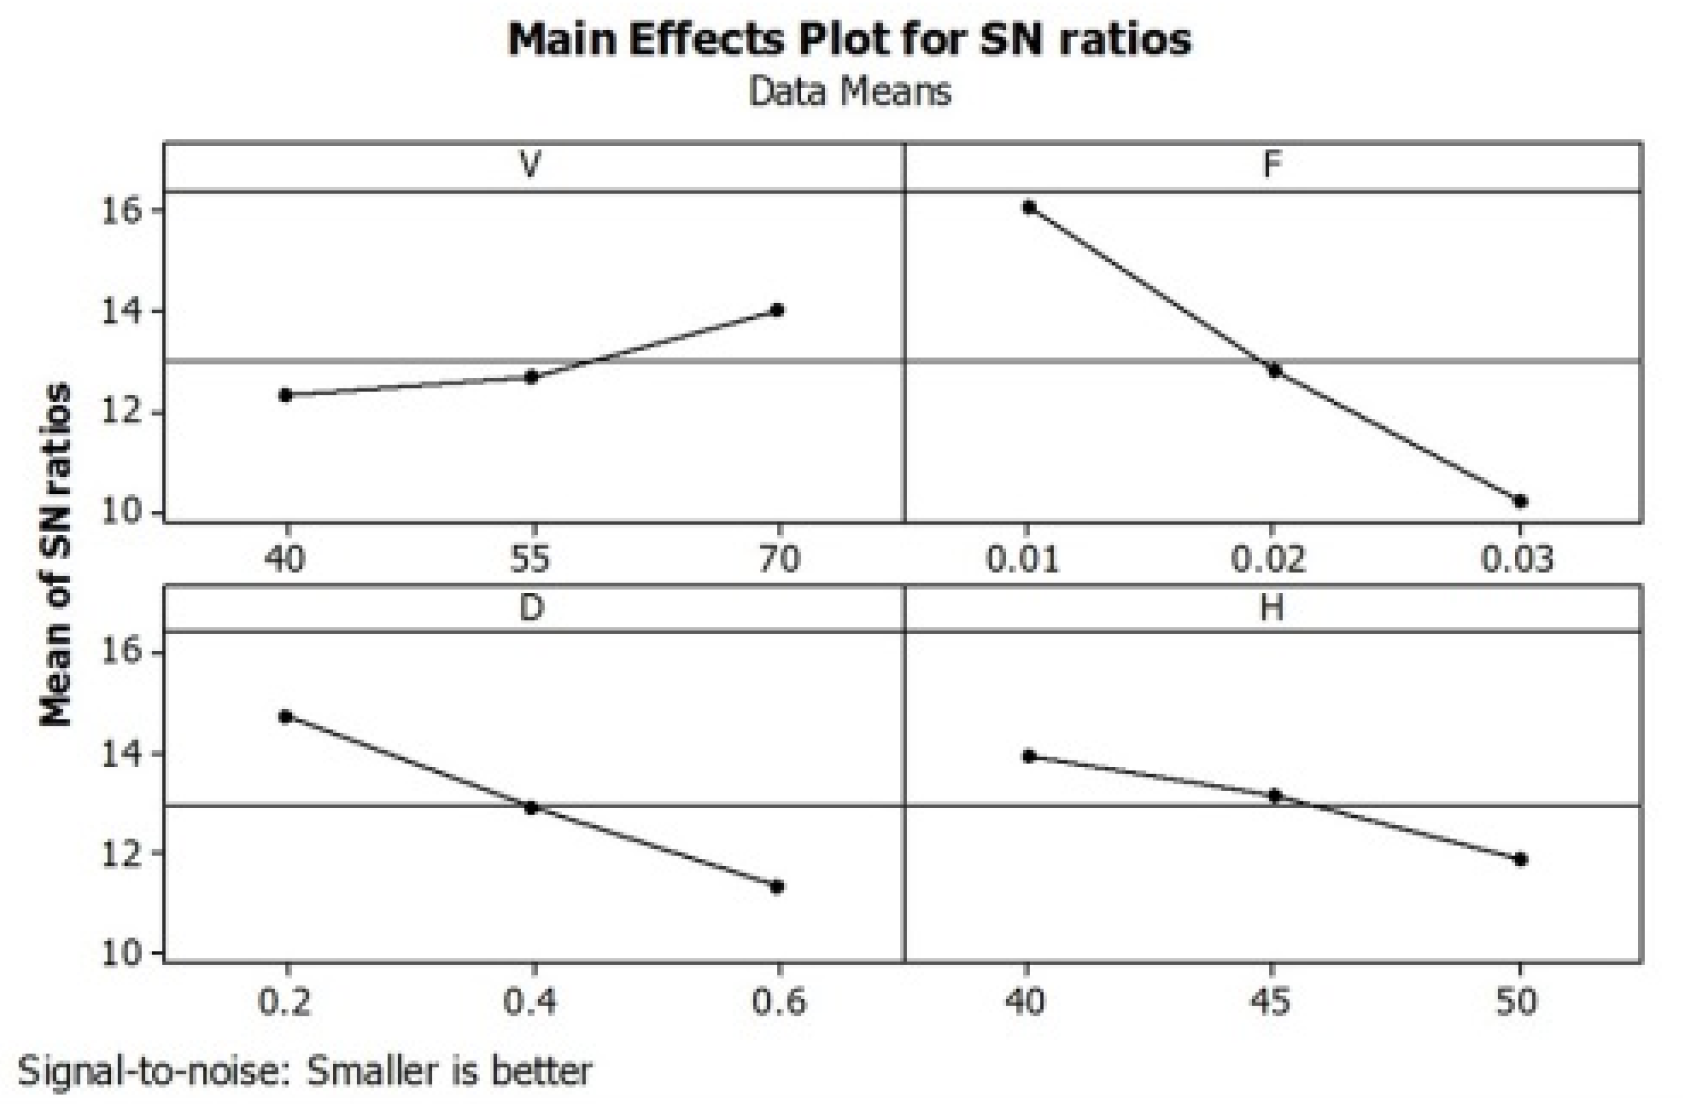
In the present study, the Taguchi method and ANOVA were applied to optimize MQL conditions for surface roughness. The best cutting parameters of hard milling of AISI H13, such as cutting speed, feed rate, depth-of-cut, and hardness of workpiece were found out in order to get the better surface roughness under MQL conditions optimized. A regression model for surface roughness was therefore established.
2. Optimization of MQL Parameters
2.1. Experimental Procedure
In the first part of the research, the air pressure, the fluid flow, and a different lubricant of MQL conditions were optimized to obtain improved cutting performances in the hard milling process with consideration of surface roughness.
The Taguchi method is widely used because it is a simple and robust method used to optimize the parameters of the process involving a significant reduction in cost and processing time [23]. In the experimental design, the Taguchi method uses the orthogonal arrays to obtain the best results with a minimum number of experiments. A signal to noise (S/N) ratio is used to measure the performance characteristics and to calculate the percent contribution of each process parameter by analysis of variance. The S/N ratio represents the amount of variation present in the quality characteristic in which the term S represents the mean value for the output characteristic, and the N represents the undesirable value for the output characteristic. The analysis of the S/N ratio could be classified into 3 types: the-bigger-is-the-better, the-smaller-is-the-better, and the-nominal-is-the-better [23,24]. Thus, the appropriate type is selected for each specific case. The purpose of this study is to optimize the parameters of the MQL condition to get the better surface roughness available. Therefore, the-smaller-is-the-better type was selected. It is calculated according to the following formula:
where: yi is the observed data, n is the number of experiments which are repeated.
With three parameters at three levels, Taguchi′s L9 orthogonal array was used to organize the experiments. The parameters with three levels of the MQL as the fluid flow, pressure, and lubricant are shown in Table 1. The lubricant factor includes straight cutting oil, vegetable oil, and water-soluble oil. Straight cutting oil and water soluble oil have been proved highly effective in industrial production. Vegetable oil has been used and proven to be effective in a number of recent studies [7,8]. The air pressure factor includes 3, 4, 5 kg/cm2. This range has been commonly applied in industry. The range of fluid flow factor is from 10 to 50 mL/h. The selected range of fluid flow is near dry condition. The milling process information is shown in Table 2. The details of the milling tool are given in Table 3.
Table 1.
Parameters and levels.
Table 2.
Milling process information.
Table 3.
Technical information of milling tool.
The milling process of the AISI H13 steel was performed by a Victor V-Center-4 Vertical Machining Center (Victor Taichung Machinery Works Co., Ltd., Taichung, Taiwan). The hardness of the workpiece is 50 HRC. The tool used is a ϕ10 TiAlN coated end mill of the CMTec Company (Tainan, Taiwan). All the tests were conducted under a cutting condition fixed as cutting speed v = 55 m/min, feed rate f = 0.02 mm/tooth and depth of cut d = 0.6 mm. The cutting parameters were selected based on workpiece material, tool material, hardness of workpiece, and the CMTec cutting tool company′s recommendation. The NC code was created for the CNC machine by use of Mastercam X software (Version 10, CNC Software, Inc., Tolland, CT, USA, 2005). The details of the experiment performed with a nozzle position in relief face of the tool as fixed for all experiments is illustrated in Figure 1. This position has high lubrication performance due to the lubricant′s facile penetration of the cutting zone.
Figure 1.
Experimental set-up with a fixed position of the minimum quantity lubricant (MQL) nozzle.
The surface roughness was measured by use of the SJ-401 surf-test instrument manufactured by the Mitutoyo Corporation (Kawasaki, Japan). This device allows the measurement of Ra (Based on the ISO standard, surface roughness average Ra was calculated as the arithmetic average of the absolute values of roughness profile). The MQL spray attached to the CNC machine is applied by the MC 1700 cooling system manufactured by the Noga Engineering Ltd. (Shlomi, Israel). Each experiment was repeated five times to reduce the possibility for experimental error to occur.
2.2. Results and Discussion
An analysis was carried out to determine the effect of MQL parameters (i.e., fluid flow, pressure, and lubricant) on surface roughness. The statistical analysis was performed by using Minitab software, Version 16, (Minitab, Inc., Philadelphia, PA, USA, 2010). The S/N ratio obtained from Equation (1) and the result of Ra is shown in Table 4. The three factors observed were lubricant, fluid flow, and pressure, respectively. Three levels of each factor were represented by “1”, “2”, and “3”.
Table 4.
The surface roughness result and S/N ratio.
The mean of S/N response for surface roughness of each level of parameters is shown in Table 5. Table 5 shows that the third level of lubricant, the third level of fluid flow, and the first level of pressure are ranked highest. Consequently, optimal MQL conditions for the experiment will be (3-3-1). The rank means that pressure is the most influential factor to surface roughness and the second influential factor is the lubricant introduced.
Table 5.
Mean of S/N response for surface roughness.
Figure 2 indicated the S/N response graph. From the S/N response analysis, in order to get the best Ra, the optimum MQL parameters were water soluble oil used for the lubricant, 50 mL/h for the flow rate, and 3 kg/cm2 for the pressure. This result in the study is reasonably close to those in the related researches about optimization of MQL conditions to reduce tool wear such as the study of Thakur et al. [13] and the study of Gandhe et al. [14]. Water soluble oil is considered to be the best lubricant available due to the inclusion of its non-flammable, good cooling, low viscosity and adequate wetting qualities. The flow rate of 50 mL/h and the pressure of 3 kg/cm2 are suitable to mix lubricant and compressed air. Under this condition, an appropriate amount of mixture is sprayed into the cutting zone.
Figure 2.
The effect of MQL parameters on surface roughness.
Table 6 shows an analysis of variance for surface roughness. Based on an analysis of variance, pressure and lubricant are considered to be the most significant factors affecting the surface roughness. They contribute 68.127% and 30.189% to the total effect, respectively. The P index of lubricant (0.008) and the P index of pressure (0.004) less than 0.05 indicate that the effect of these factors has statistical significance. With R-Sq = 99.76%, it expresses that 99.76% of the variability in surface roughness is explained by the three given parameters of the MQL process.
Table 6.
Analysis of variance for surface roughness.
Because optimal MQL conditions for the experiment were determined to be (3-3-1) although not present in the experimental process, a verification experiment with optimized MQL parameters was performed to examine the results of the study. The result of the surface roughness of the verification test is 0.211 µm for Ra. This value is less than the surface roughness of the experiment number 8 (3-2-1) that has the smallest value 0.239 shown in Table 4. It proves the result of the study is of value.
3. Optimization of Cutting Parameters under Optimal MQL Condition
3.1. Experimental Procedure
In this part of the research, the air pressure, flow rate, and the lubricant of MQL condition were fixed in all of the experiments. Table 7 shows the MQL conditions as applied in the experiments.
Table 7.
The MQL conditions.
The machining operation was slot milling. The cutting parameters selected for the experiment include cutting speed (v), feed rate (f), depth of cut (d), and workpiece hardness (H). Each parameter has three levels. Taguchi′s L27 orthogonal array was used for designing the experiment. The machining parameters with three levels are shown in Table 8. The range of the cutting factor was selected with consideration of the tool life, cutting productivity and surface roughness. The range of hardness of workpiece was 40 to 50 HRC. This range have been commonly applied in mold and die manufacture.
Table 8.
Parameters and levels.
Each experiment was also repeated five times to reduce the possibility of experimental error occurring. The roughness values (Ra) were determined by an average of five values that were measured at different positions on the machined surface of the workpiece.
3.2. Results and Discussion
Table 9 indicates S/N ratio obtained from Equation (1) and the result of surface roughness (Ra). Three factors were cutting speed (v), feed rate (f), depth-of-cut (d), and workpiece hardness (H), respectively. Three levels of each factor were represented by “1”, “2”, and “3”.
Table 9.
The surface roughness result and S/N ratio.
The analytical results were carried out by Minitab software, Version 16. Table 10 shows the mean of the S/N response for surface roughness of each level of parameters. It shows that the third level of cutting speed, the first level of feed rate, the first level of depth of cut, and the first level of hardness are highest. Therefore, under the MQL condition, optimal cutting conditions for the experiment will be (3-1-1-1). The ranking means that feed rate is the most influential factor to surface roughness and the second most influential factor is the depth-of-cut.
Table 10.
Mean of S/N response for surface roughness.
Figure 3 indicated the S/N response graph for surface roughness. The analytical results of the S/N response express that, in order to get the best Ra, the optimum cutting parameters are 70 m/min for the cutting speed, 0.01 mm/tooth for the feed rate, 0.2 mm in depth of cut, and 40 HRC for workpiece hardness. Generally, a higher cutting speed, lower feed rate, lower depth of cut, and lower workpiece hardness will lead to good surface roughness under an MQL condition. This result is consistent to the conclusions of Ghani et al. [22] although the study of Ghani et al. was conducted in dry conditions.
Figure 3.
The effect of cutting parameters on surface roughness.
An analysis of variance for surface roughness is shown in Table 11. Based on analysis of variance, feed rate and depth-of-cut are the most influential factors regarding surface roughness. They contribute 55.067% and 18.244% to the total effect, respectively. The P index of feed rate (0.000), the P index of depth of cut (0.001), and the P index of workpiece hardness (0.03) less than 0.05 indicate that the effect of these factors has statistical significance.
Table 11.
Analysis of variance for surface roughness.
Because optimal MQL conditions for the experiment were determined to be (3-1-1-1) although not present in the experimental process, a verification experiment with optimized MQL parameters was performed to examine the results of the study. The result of surface roughness of the verification test is 0.098 µm for Ra. The verification experiment is still conducted under MQL conditions. This value is less than the surface roughness of the experiment number 19 (3-1-1-3) that has the smallest value 0.107 shown in Table 9. It proves that the result of the study is of value.
According to the analytical procedure employed, the linear regression model for prediction of surface roughness under MQL condition is obtained as follows:
where: Ra-mql is surface roughness under MQL conditions. v, f, d, and H are cutting speed, feed rate, depth-of-cut, and workpiece hardness, respectively.
Ra-mql = −0.2185 − 0.00106296v + 7.55556f + 0.242778d + 0.00595556H
Table 12 shows an analysis of variance for the linear regression model. It identifies that feed rate and depth of cut are the most influential factors related to surface roughness in the linear regression model. The P values (<0.05) feed rate, depth-of-cut, and workpiece hardness mean that the effect of these factors has statistical significance. When the P value of the model is less than 0.05, the linear regression model is considered to be statistically significant. With R-Sq = 85.09%, it expresses that 85.09% of the variability in surface roughness is explained by the factors of cutting conditions.
Table 12.
Analysis of variance for the linear regression model.
The Probability plot of surface roughness under MQL conditions shown in Figure 4 represent that the data points of Ra-mql lay reasonably close to a center straight line. It proves that the terms chosen in model have significant influence on the responses provided.
Figure 4.
The probability plot of surface roughness under MQL conditions.
A series validation experiments were carried out to examine the accuracy of the linear regression model. The validation experiment is different from the initial experiment. The result of validation experiments is shown in the Table 13.
Table 13.
The result of validation experiments.
Comparing the surface roughness of the experiment and surface roughness of the model, the percentage differences are less than 10%. It proved that the accuracy of the model is of value.
4. Conclusions
In this study, the Taguchi method and ANOVA were applied to optimize MQL conditions for surface roughness. The best cutting parameters of hard milling of AISI H13 determined as cutting speed, feed rate, depth of cut, and hardness of workpiece were obtained in order to get improve the surface roughness under MQL conditions′ optimization. A regression model for surface roughness was established. The results of the study are as follows:
- In MQL conditions, the water-soluble oil lubricant, the 50 mL/h fluid flow and the 3 kg/cm2 pressures provided the best results for surface roughness in hard-milling of SKD 61.
- Lubricant and pressure are two factors most affecting the surface roughness. The pressure factor contributed 68.127% and the lubricant factor contributed 30.189% of the total effect. The effect of them carried statistical significance. The three parameters of MQL conditions explained 99.76% of variability in surface roughness.
- Under MQL conditions, the optimum cutting parameters are 70 m/min for the cutting speed, 0.01 mm/tooth for the feed rate, 0.2 mm in depth of cut, and 40 HRC for workpiece hardness. Generally, higher cutting speed, lower feed rate, lower depth of cut, and lower workpiece hardness lead to good surface roughness under the MQL condition.
- Feed rate and depth of cut are the most influential factors related to surface roughness in the linear regression model. The effect of these factors (i.e., feed rate, depth-of-cut, and workpiece hardness) have statistical significance.
- The linear regression model is considered to be statistically significant. The four parameters of cutting conditions explained 85.09% of variability in surface roughness.
Acknowledgments
The author would like to thank Wei-Lin Chen, Wen-Hsiung Li and Jhan-Hong Ye in Precision and Nano Engineering Laboratory, Department of Mechanical Engineering (ME) at the National Kaohsiung University of Applied Sciences (KUAS) for their important helping and useful discussion in the experiments of the study.
Author Contributions
The-Vinh Do conducted the theoretical analysis and experiments and prepared the manuscript. Quang-Cherng Hsu provided the guidance and improved the quality of the work.
Conflicts of Interest
The authors declare no conflict of interest.
References
- Lobanov, A. Technological advantages of hard milling. Russ. Eng. Res. 2007, 27, 396–397. [Google Scholar] [CrossRef]
- Schulz, H.; Moriwaki, T. High-speed machining. CIRP Ann. Manuf. Technol. 1992, 41, 637–643. [Google Scholar] [CrossRef]
- An, Q.; Wang, C.; Xu, J.; Liu, P.; Chen, M. Experimental investigation on hard milling of high strength steel using PVD-AlTiN coated cemented carbide tool. Int. J. Refract. Met. Hard Mater. 2014, 43, 94–101. [Google Scholar] [CrossRef]
- Denkena, B.; Köhler, J.; Bergmann, B. Development of cutting edge geometries for hard milling operations. CIRP J. Manuf. Sci. Technol. 2015, 8, 43–52. [Google Scholar] [CrossRef]
- Phafat, N.G.; Deshmukh, R.R.; Deshmukh, S.D. Study of Cutting Parameters Effects in MQL-Employed Hard-Milling Process for AISI H13 for Tool Life. In Applied Mechanics and Materials; Trans Tech Publ.: Zurich, Switzerland, 2013; pp. 240–245. [Google Scholar]
- Dhar, N.; Kamruzzaman, M.; Ahmed, M. Effect of minimum quantity lubrication (MQL) on tool wear and surface roughness in turning AISI-4340 steel. J. Mater. Process. Technol. 2006, 172, 299–304. [Google Scholar] [CrossRef]
- Khan, M.; Mithu, M.; Dhar, N. Effects of minimum quantity lubrication on turning AISI 9310 alloy steel using vegetable oil-based cutting fluid. J. Mater. Process. Technol. 2009, 209, 5573–5583. [Google Scholar] [CrossRef]
- Weinert, K.; Inasaki, I.; Sutherland, J.W.; Wakabayashi, T. Dry machining and minimum quantity lubrication. CIRP Ann. Manuf. Technol. 2004, 53, 511–537. [Google Scholar] [CrossRef]
- Dhar, N.R.; Islam, M.W.; Islam, S.; Mithu, M.A.H. The influence of minimum quantity of lubrication (MQL) on cutting temperature, chip and dimensional accuracy in turning AISI-1040 steel. J. Mater. Process. Technol. 2006, 171, 93–99. [Google Scholar] [CrossRef]
- Kang, M.C.; Kim, K.H.; Shin, S.H.; Jang, S.H.; Park, J.H.; Kim, C. Effect of the minimum quantity lubrication in high-speed end-milling of AISI D2 cold-worked die steel (62 HRC) by coated carbide tools. Surf. Coat. Technol. 2008, 202, 5621–5624. [Google Scholar] [CrossRef]
- Liang, S.Y.; Ronan, A. Minimum Quantity Lubrication in Finish Hard Turning; Georgia Institute of Technology: Atlanta, GA, USA, 2003. [Google Scholar]
- Iqbal, A.; He, N.; Li, L. Empirical modeling the effects of cutting parameters in high-speed end milling of hardened AISI D2 under MQL environment. In Proceedings of the World Congress on Engineering, London, UK, 6–8 July 2011.
- Thakur, D.; Ramamoorthy, B.; Vijayaraghavan, L. Optimization of minimum quantity lubrication parameters in high speed turning of superalloy Inconel 718 for sustainable development. Signal 2009, 20, 224–226. [Google Scholar]
- Gandhe, V.; Jadhav, V. Optimization of minimum quantity lubrication parameters in turning of EN-8 steel. Int. J. Eng. Tech. Res. 2013, 1, 11–14. [Google Scholar]
- Barnabas, J.; Tamizharasan, T. Optimization of MQL parameters during turning for the minimization of flank wear using DoE, PSO and SAA. J. Inst. Eng. India Ser. C 2012, 93, 133–139. [Google Scholar] [CrossRef]
- Benardos, P.; Vosniakos, G.C. Predicting surface roughness in machining: A review. Int. J. Mach. Tools Manuf. 2003, 43, 833–844. [Google Scholar] [CrossRef]
- Hasçalık, A.; Çaydaş, U. Optimization of turning parameters for surface roughness and tool life based on the Taguchi method. Int. J. Adv. Manuf. Technol. 2008, 38, 896–903. [Google Scholar] [CrossRef]
- Asiltürk, I.; Akkuş, H. Determining the effect of cutting parameters on surface roughness in hard turning using the Taguchi method. Measurement 2011, 44, 1697–1704. [Google Scholar] [CrossRef]
- Gopalsamy, B.M.; Mondal, B.; Ghosh, S. Taguchi method and ANOVA: An approach for process parameters optimization of hard machining while machining hardened steel. J. Sci. Ind. Res. 2009, 68, 686–695. [Google Scholar]
- Ding, T.; Zhang, S.; Wang, Y.; Zhu, X. Empirical models and optimal cutting parameters for cutting forces and surface roughness in hard milling of AISI H13 steel. Int. J. Adv. Manuf. Technol. 2010, 51, 45–55. [Google Scholar] [CrossRef]
- Outeiro, J. Optimization of Machining Parameters for improved Surface Integrity of AISI H13 Tool Steel. In Proceedings of the Machines et Usinage a Grande Vitesse (MUGV), Saint-Etienne, France, 16–18 October 2012; pp. 1–10.
- Ghani, J.; Choudhury, I.; Hassan, H. Application of Taguchi method in the optimization of end milling parameters. J. Mater. Process. Technol. 2004, 145, 84–92. [Google Scholar] [CrossRef]
- Phadke, M.S. Quality engineering using design of experiments. In Quality Control, Robust Design, and the Taguchi Method; Springer: Berlin, Germany; Heidelberg, Germany, 1989; pp. 31–50. [Google Scholar]
- Fratila, D.; Caizar, C. Application of Taguchi method to selection of optimal lubrication and cutting conditions in face milling of AlMg3. J. Clean. Prod. 2011, 19, 640–645. [Google Scholar] [CrossRef]
© 2016 by the authors; licensee MDPI, Basel, Switzerland. This article is an open access article distributed under the terms and conditions of the Creative Commons by Attribution (CC-BY) license (http://creativecommons.org/licenses/by/4.0/).


