Article

Effect of the Quality Property of Table Grapes in Cold Chain Logistics-Integrated WSN and AOW

1
College of Information and Electrical Engineering, China Agricultural University, Beijing 100083, China
2
Beijing Laboratory of Food Quality and Safety, China Agricultural University, Beijing 100083, China
3
Shandong Institute of Commerce and Technology, Jinan 250103, China
4
College of Economics and Management, China Agricultural University, Beijing 100083, China
*
Authors to whom correspondence should be addressed.
Appl. Sci. 2015, 5(4), 747-760; https://doi.org/10.3390/app5040747
Submission received: 18 August 2015 / Accepted: 30 September 2015 / Published: 10 October 2015

Abstract

:
Table grapes are very popular for their high nutritional and therapeutic value. The objective of this work was to study the effect of table grapes’ quality property in cold chain logistics for improving the transparency and traceability of table grapes’ cold chain logistics and ensuring the table grapes’ quality and safety. Temperature and relative humidity are monitored by adopting the wireless sensor network (WSN) as the fundamental network infrastructure and adaptive optimal weighted data fusion (AOW) for the adaptive data fusion. The cold chain process, firmness quality and adaptive data fusion of temperature and relative humidity were evaluated in an actual cold chain logistics. The results indicate that the WSN and AOW methods could effectively reflect the real-time temperature and relative humidity information and quality property, improve the transparency and traceability in the cold chain and ensure the preservation of the quality and safety of table grapes. The AOW performance analysis shows that the AOW, whose mean absolute error and mean relative error of the temperature data are 0.06 °C and 8.61% and relative humidity data are 0.12% and 0.23%, respectively, could fuse the sensor data accurately, efficiently and adaptively and meet the actual application requirements.

1. Introduction

Table grapes are very popular for their high nutritional and therapeutic value. However, table grapes deteriorate easily by pathogen infection due to their characteristics of being soft and having a high moisture content, which lead to the quality and safety issues of table grapes that have received worldwide attention [1,2]. Cold chain logistics is an effective measure to ensure that table grapes are stored in a low temperature environment all of the time by using artificial refrigeration technology when they are in various links, such as processing, storage, transportation, sale, etc., and to reduce the quality losses of table grapes [3,4,5].
Cold chain management has become crucial, challenging and important. However, the cold chain logistics system is still complex, and the information asymmetry is high, as well. It is urgent to conduct research on the dynamic characteristic of the cold chain environment by intelligent monitoring technology to complete the sensor data acquisition and processing, improve the transparency and traceability of the cold chain logistics and guarantee the quality and safety of the table grapes [6,7].
Though there are many environmental factors that affect the quality and safety of table grapes, temperature and relative humidity are the main factors that affect the quality and safety of table grapes during the cold chain logistics [8,9]. The temperature is the key factor that directly affects the respiration intensity of the table grapes and the activity of the enzymes. Suitable temperature management is becoming a very important function of the table grapes’ cold chain logistics to extend the quality and storage period [10,11]. The table grapes’ quality will not be maintained in a good condition if the relative humidity is too high or too low, which is conducive to reducing the losses of the table grapes’ moisture content as much as possible [12,13]. It is necessary to monitor in real time, to control the temperature and relative humidity and to analyze the quality to keep table grapes in a suitable refrigerated condition during the whole cold chain logistics.
Firmness is an important quality to judge the freshness and softening degree of table grapes, which could indirectly verify the preservation of table grapes [14,15]. The other quality indicators are mainly the moisture loss [16,17], decay rate [18], abscission rate [19], total soluble solids (TSS) [20], titratable acid (TA) [21] and sensory evaluation [22]. However, owning to the complex cold chain logistics system, firmness is the easiest quality indicator among these quality indicators to measure using a handheld durometer during the cold chain logistics, while the others need special instruments or environments. Therefore, it is practicable and important to select firmness to evaluate the quality of table grapes in actual cold chain logistics.
Traditional methods, such as temperature and humidity recorders and radio frequency identification technology, are the most popular, reliable and accurate ways to monitor the cold chain. However, such methods have high management costs with off-line monitoring [23,24]. Applying wireless sensor network (WSN) to monitor the cold chain logistics of table grapes, which integrates sensor technology, embedded computing, networking, wireless communication technology and distributed processing together to sense information from monitored objects in the environment and which sends it to the end-user via wireless and multi-hop network, has been an inevitable trend [25,26,27]. WSN has been widely adopted and applied in agricultural [28,29,30], environmental monitoring [31,32], industrial [33,34] and many other important areas.
Adaptive optimal weighted data fusion (AOW) has provided an adaptive way to fuse the data with high efficiency and accuracy, which is beneficial for the storage, transmission and processing of natural signals, without the restriction of the fixed characteristics of normal data fusion that the algorithm cannot vary with the changing signal [35,36,37]. The AOW not only fuses the sensor data efficiently and accurately with relative little complexity and calculation, but also brings the benefits of simple adaptive fusion and compression in a WSN, which meets the limited resource constraint of WSNs [38,39,40].
Based on the above discussion, this study aims to evaluate the temperature and relative humidity, and table grapes’ quality property in cold chain logistics to improve the transparency and traceability of cold chain logistics and to ensure the quality and safety of the table grapes by adopting the WSN as the fundamental network infrastructure and the AOW for the adaptive data fusion. The cold chain process, data fusion performance and the firmness quality of table grapes are evaluated to realize more precise and accurate monitoring, tracing and control for the table grapes’ cold chain logistics.

2. Materials and Methods
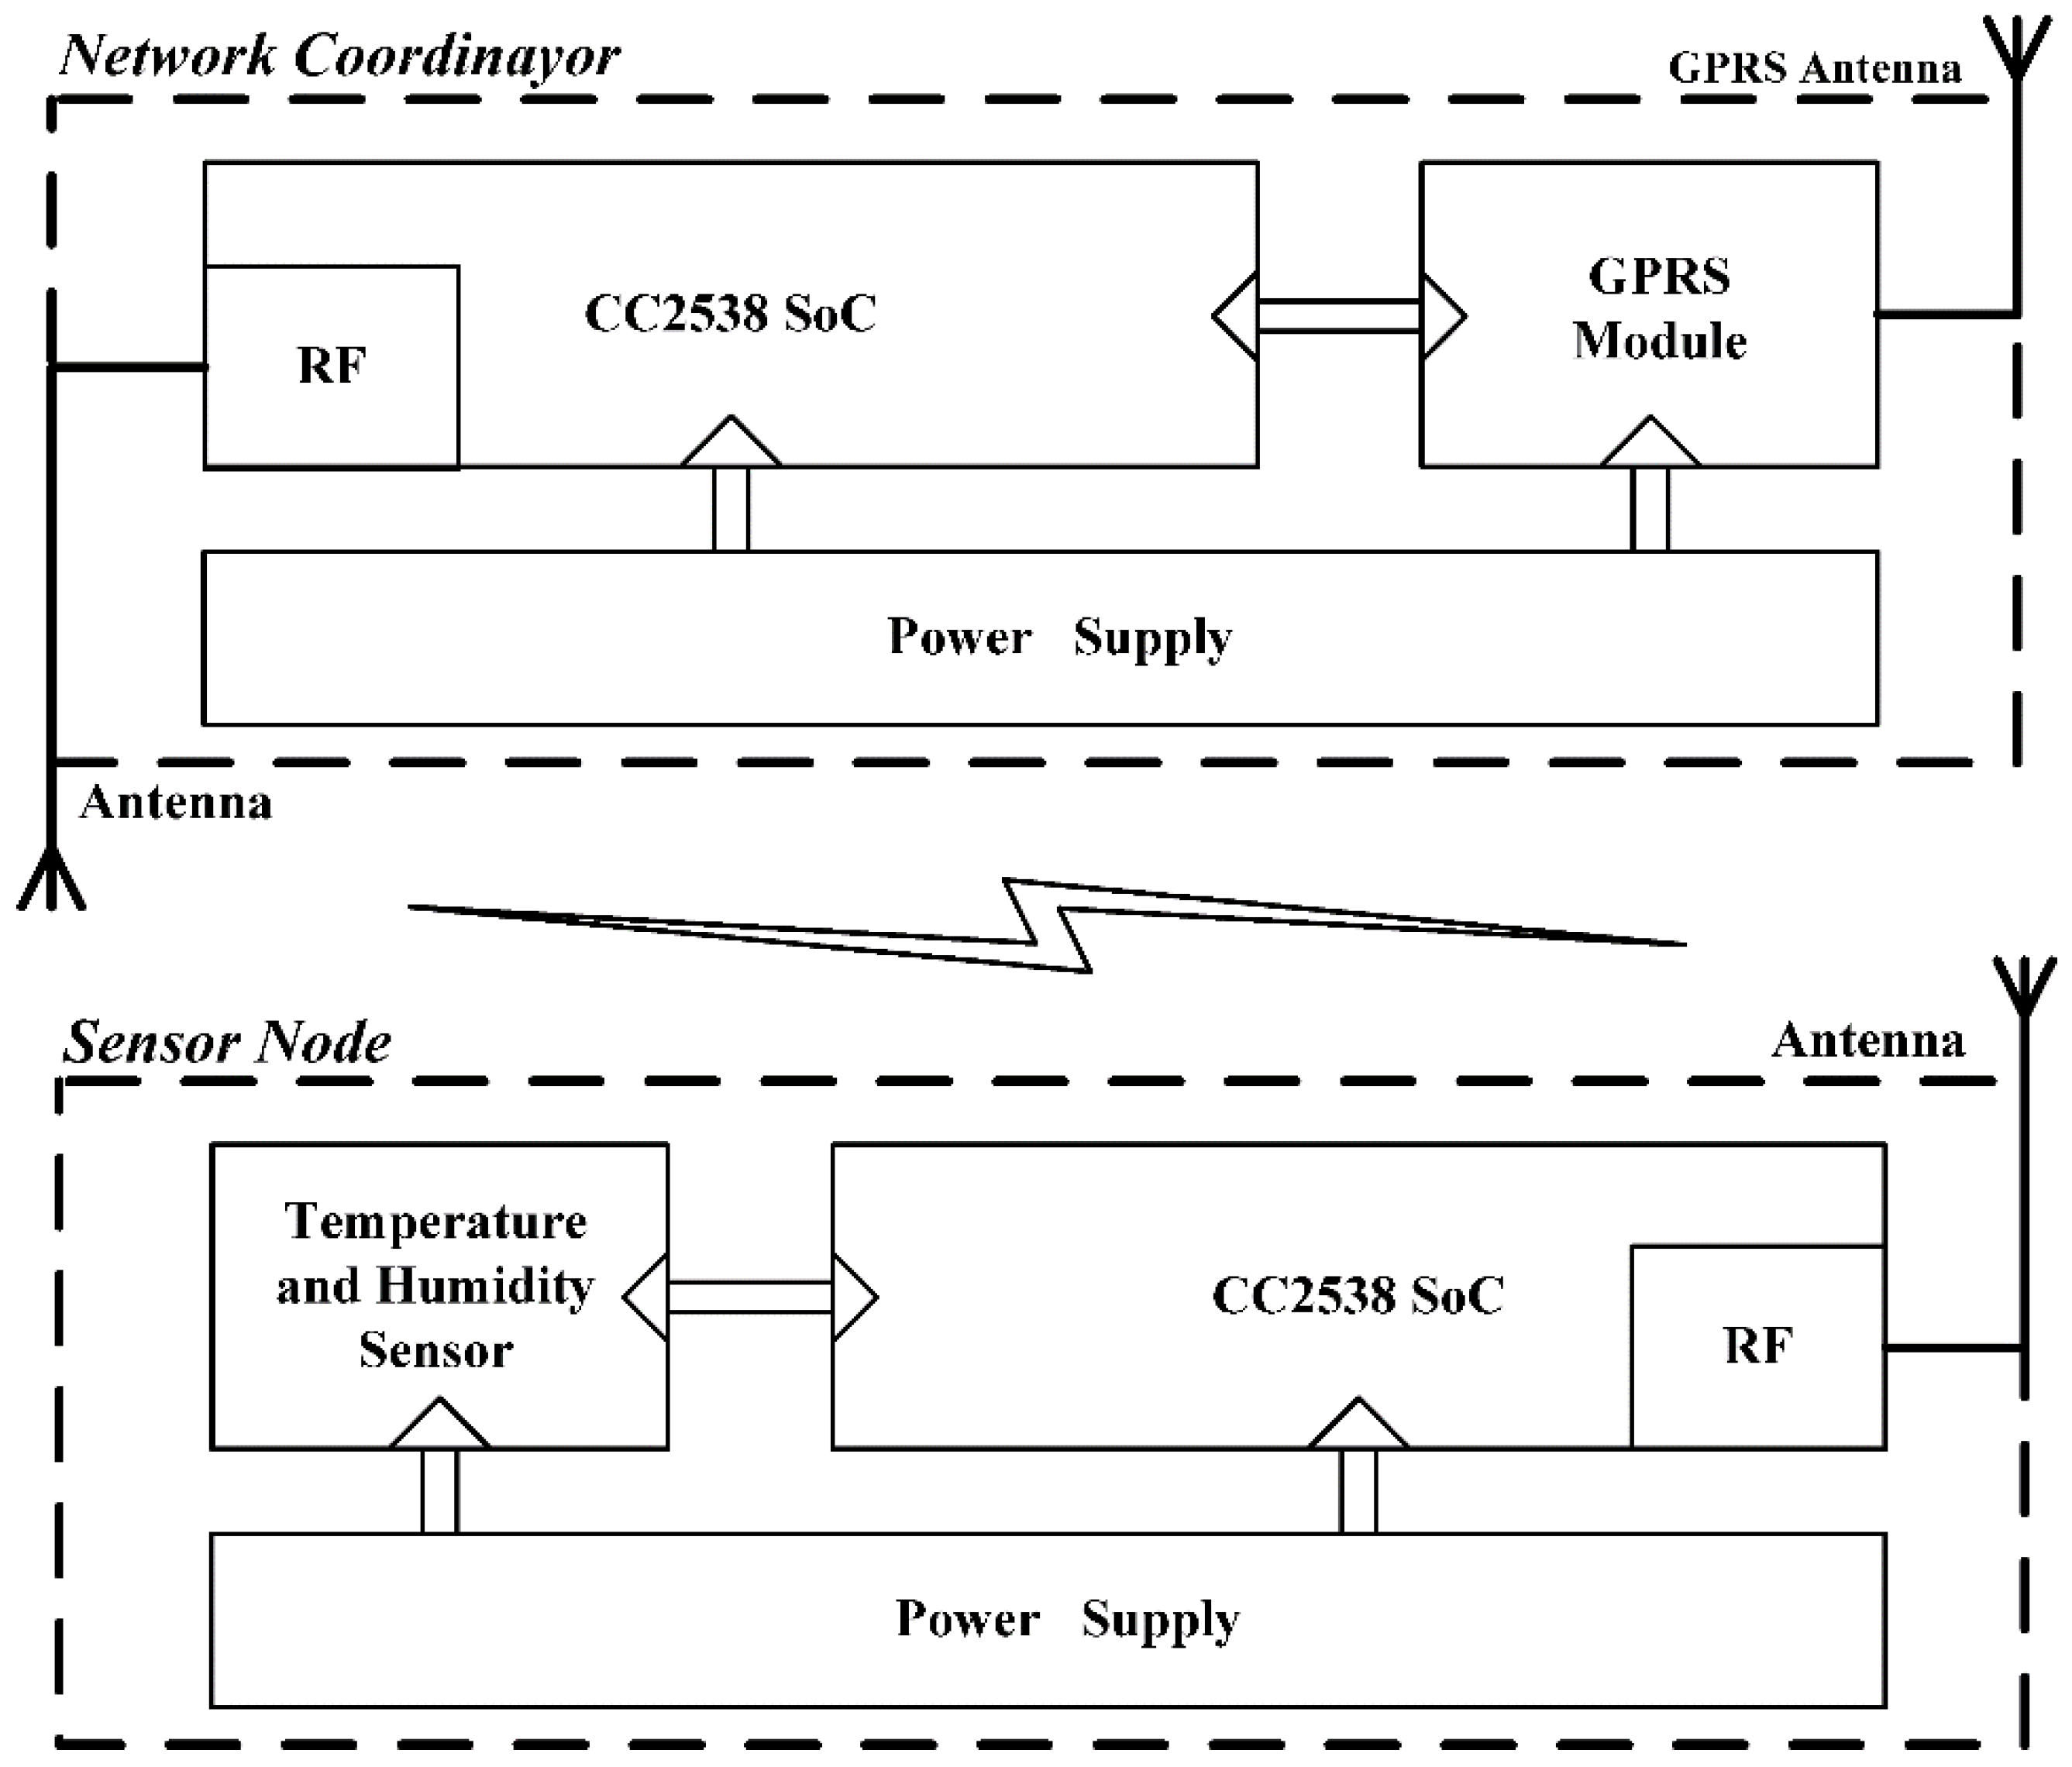
The WSN nodes (China Agricultural University, Beijing, China) are designed and implemented in this section, and the adaptive optimum weighted data fusion method, which includes the optimal weighted data fusion and the dynamic adjustment of weight coefficient, are also described in detail.

2.1. WSN Nodes

The WSN consists of the sensor nodes and the network coordinator. The network coordinator, which creates and controls the entire network and aggregates the sensor data from the sensor nodes, is the key device in the WSN. The sensor nodes, which are responsible for the temperature and relative humidity data acquisition and sending, include a microcontroller, a temperature-relative humidity sensor and a battery power supply. The network coordinator consists of a microcontroller and a general packet radio service (GPRS) remote module (Comway Electrionic Corp., Beijing, China). The CC2538 wireless sensor system-on-chip (SoC) (Texas Instruments Inc., Dallas, TX, USA), which integrates a radio frequency transceiver with a powerful Advanced RISC Machine (ARM) Cortex-M3-based microcontroller system with up to 32 KB on-chip RAM and up to 512 KB on-chip flash with a robust 2.4-GHz IEEE 802.15.4 radio, is adopted as the microcontroller in the sensor nodes and the network coordinator. The microcontroller enables the nodes to handle complex network stacks with security, demanding applications and over-the-air downloads to improve the integration and optimization of the hardware design and transmission distance.
The temperature and relative humidity parameters are monitored in real time and controlled by the sensor nodes in the refrigeration truck (China International Marine Containers (GROUP) Co., Ltd, Shenzhen, China) to satisfy the best storage requirement for the table grapes. The ranges of the temperature and relative humidity in table grapes’ cold chain logistics are from −1 °C to 0 °C and 90% to 95%, respectively [6,9]. The temperature and relative humidity data in the cold chain logistics are acquired and monitored by adopting the digital temperature and relative humidity sensor SHT10, whose range of temperature and relative humidity are from −40 °C to +123.8 °C and 0% to 100%, respectively, and the accuracy is ±0.5 °C and ±3.0% respectively. The supply voltage of the sensor node is supplied by a lithium battery (Anwin Electronics Co. Ltd, Shenzhen, China), whose nominal voltage and capacity is 3.7 V and 3600 mAh, respectively, while the network coordinator is equipped with a 5-V, 2-A power adapter to provide a continuous supply. Figure 1 illustrates the diagram of the sensor nodes and network coordinator hardware.
Figure 1. Diagram of the sensor node and network coordinator hardware. GPRS, general packet radio service.
Applsci 05 00747 g001

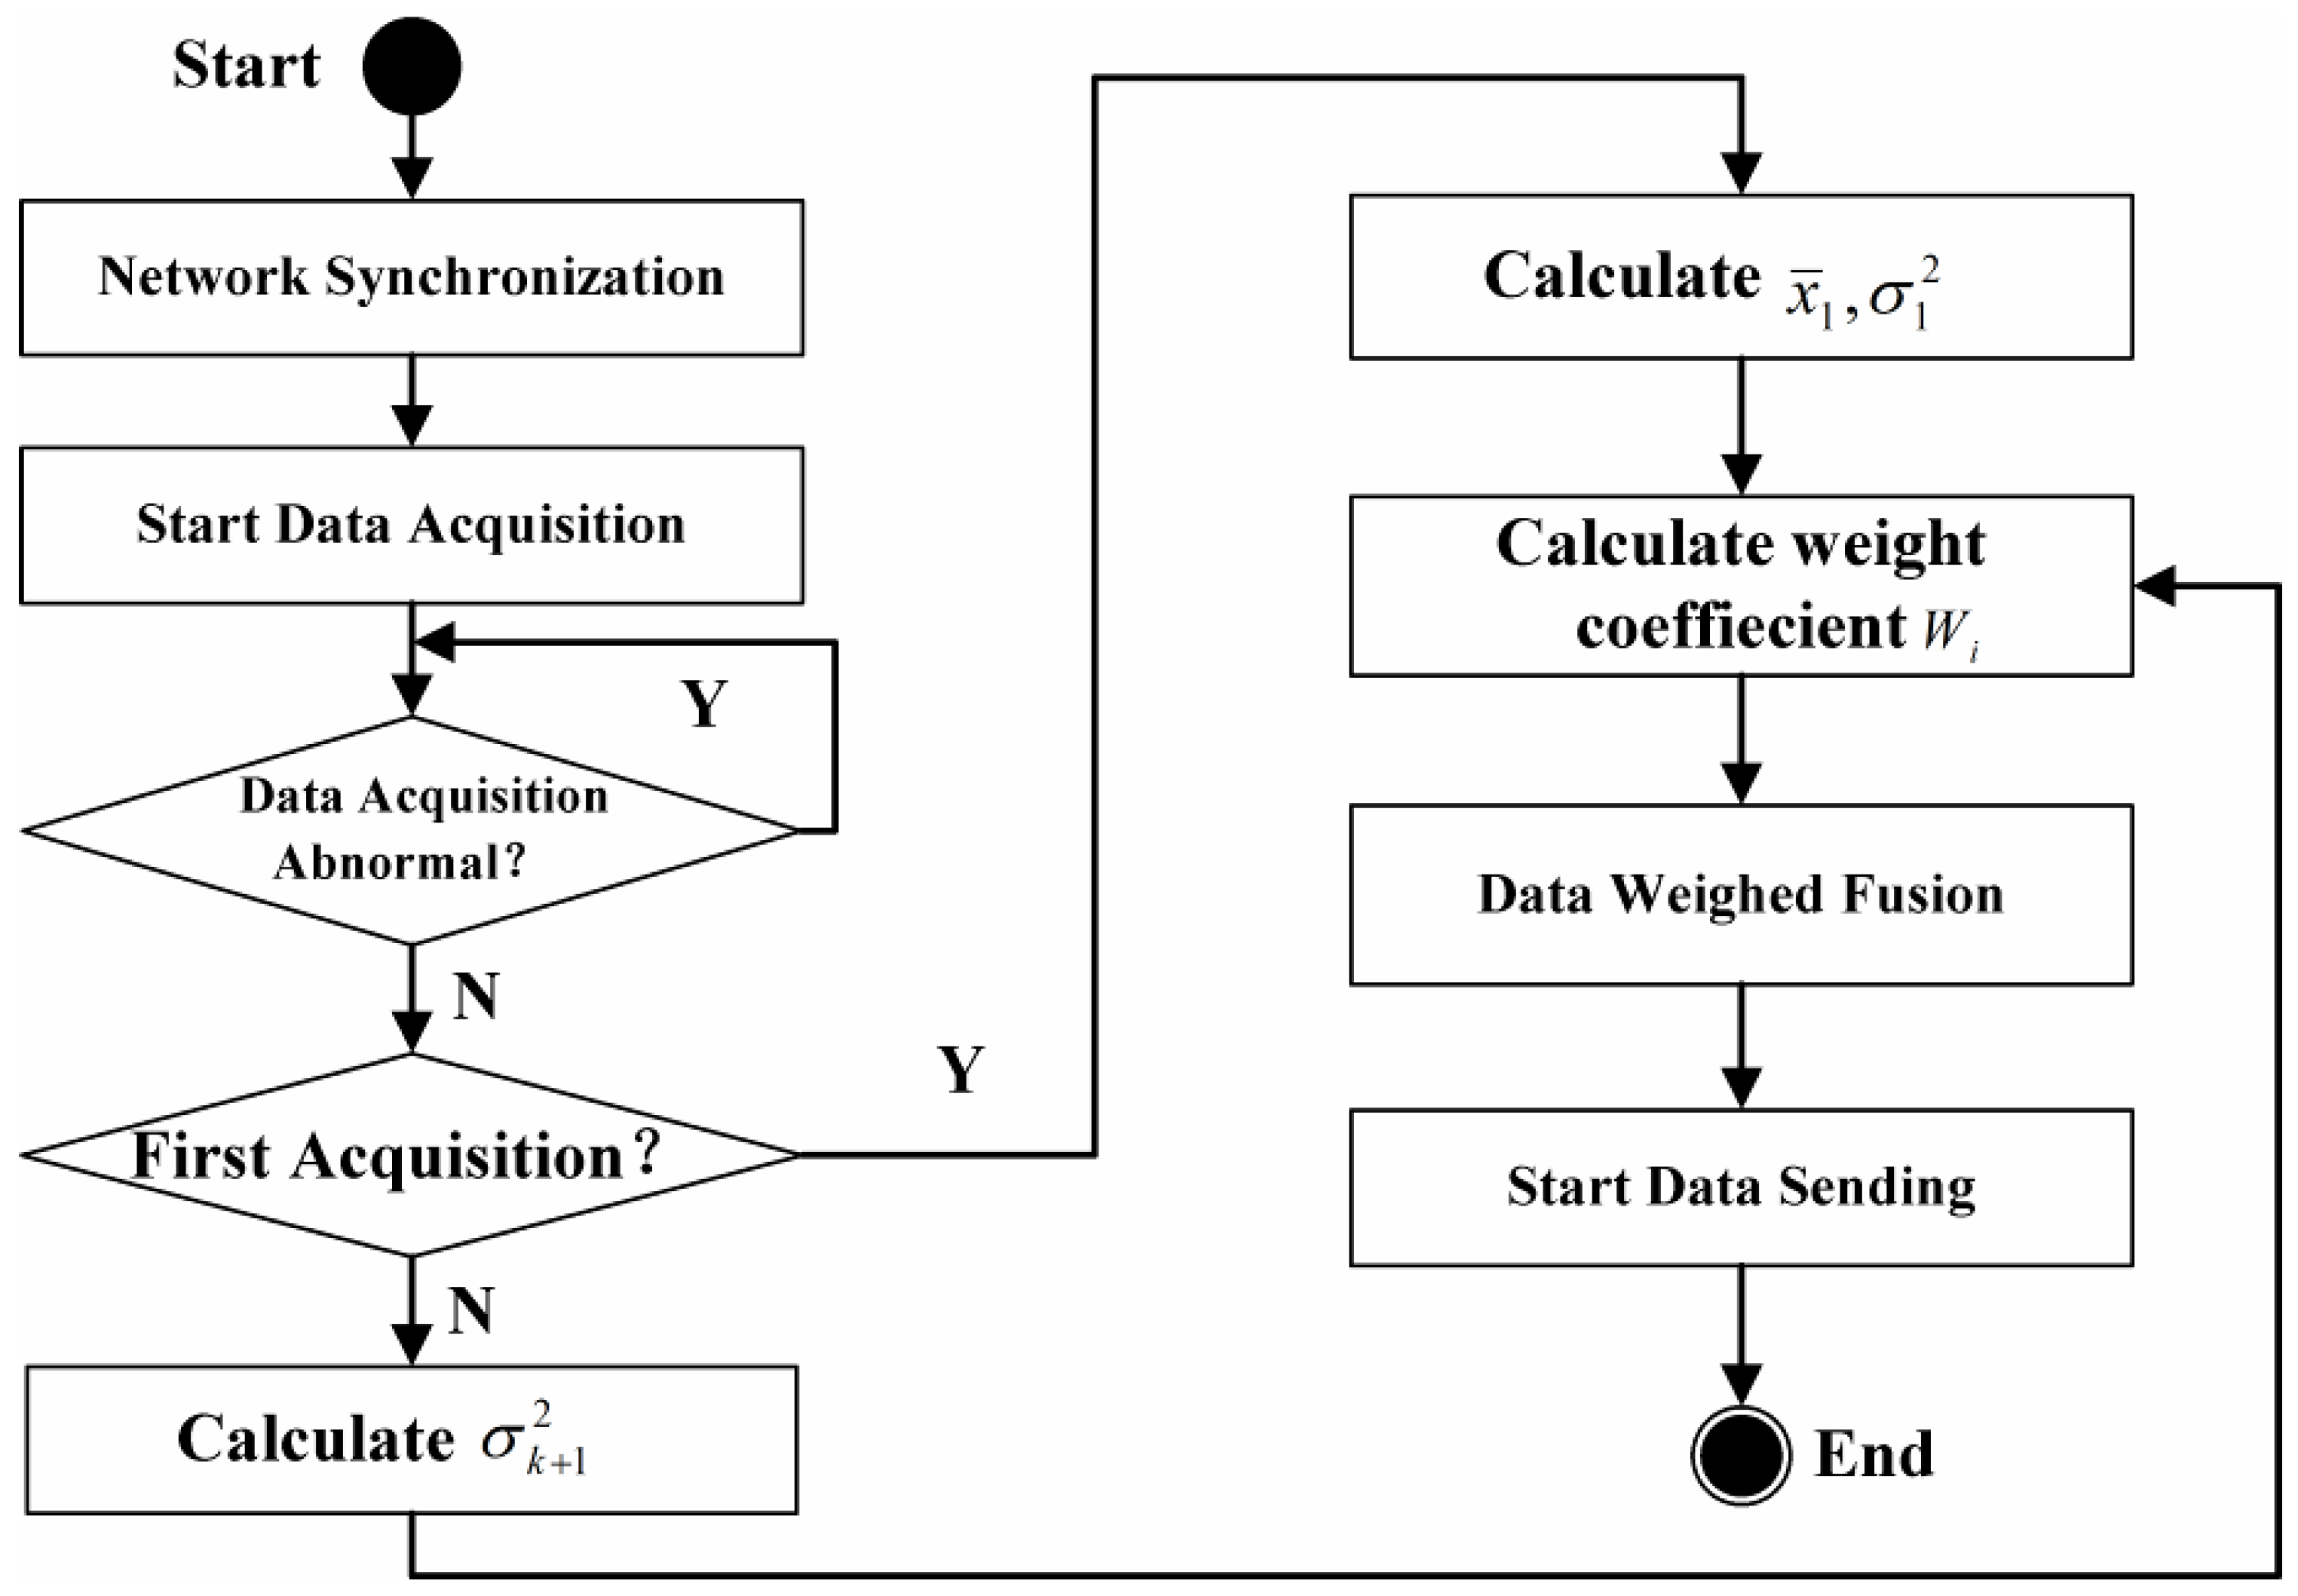
2.2. Optimal Weighted Data Fusion

Assume the acquired sensor data deviations of the n sensor nodes are σ 1 2 , σ 2 2 , , σ n 2 , respectively; the actual sensor data value is X ; the acquired sensor data are X 1 , X 2 , , X n , respectively, which are independent of each other; and the weight coefficients are W 1 , W 2 , , W n , respectively. The estimate sensor value X ^ and overall mean square error σ 2 after data fusion satisfy the following Equations (1) and (2):
X ^ = i = 1 n W i X i , i = 1 n W i = 1
σ 2 = E [ ( X X ^ ) 2 ] = E [ ( X i = 1 n W i X i ) 2 ] = i = 1 n W i 2 σ i 2
According to Equation (2), the overall mean square error σ 2 is the multivariate quadratic function that has the minimum value. The weight coefficient W i ( i = 1 , 2 , n ) and the minimum overall mean square error σ min 2 are shown in Equations (3) and (4).
W i = 1 / | σ i 2 j = 1 n 1 σ j 2 |
σ min 2 = 1 / | i n 1 / σ i 2 |
The sensor data acquired from the sensor nodes have their own optimal weight coefficient under the minimum overall mean square deviations condition. The optimal weight coefficients W 1 , W 2 , , W n are calculated by the deviations of n sensor nodes σ 1 2 σ 2 2 , , σ n 2 . The optimal weight coefficients need to be dynamically adjusted during the sensor data acquirement because of the interference factors, such as the environment.

2.3. Dynamic Adjustment of Weight Coefficient

Assuming the real-time data of the sensor node are x i ( i = 1 , 2 , , k ) , then the mean value x ¯ k and mean square error σ k 2 of these k sensor data are indicated in Equations (5) and (6).
x ¯ k = 1 k i = 1 k x i
σ k 2 = 1 k i = 1 k ( x i x ¯ k ) 2
Therefore, the mean value x ¯ k + 1 and mean square error σ k + 1 2 of the k + 1 sensor data would be calculated by the k sensor data results, which are demonstrated in Equations (7) and (8).
x ¯ k + 1 = 1 k + 1 i = 1 k + 1 x i = 1 k + 1 ( i = 1 k x i + x k + 1 ) = k x ¯ k + x k + 1 k + 1
σ k + 1 2 = 1 k + 1 i = 1 k + 1 ( x i x ¯ k + 1 ) 2 = k k + 1 σ k 2 + k k + 1 2 ( x k x ¯ k + 1 ) 2
Finally, the optimal weight coefficients W 1 , W 2 , , W n would be calculated as Equation (3) by using the real-time results of Equation (8), which realizes the dynamic adjustment of the weight coefficient and the adaptive fusion for the weighted data acquired from the sensor nodes. Figure 2 indicates the flow chart of the whole optimal weighted data fusion process in the sensor nodes.
Figure 2. Flow chart of the optimal weighted data fusion in the sensor node.
Applsci 05 00747 g002

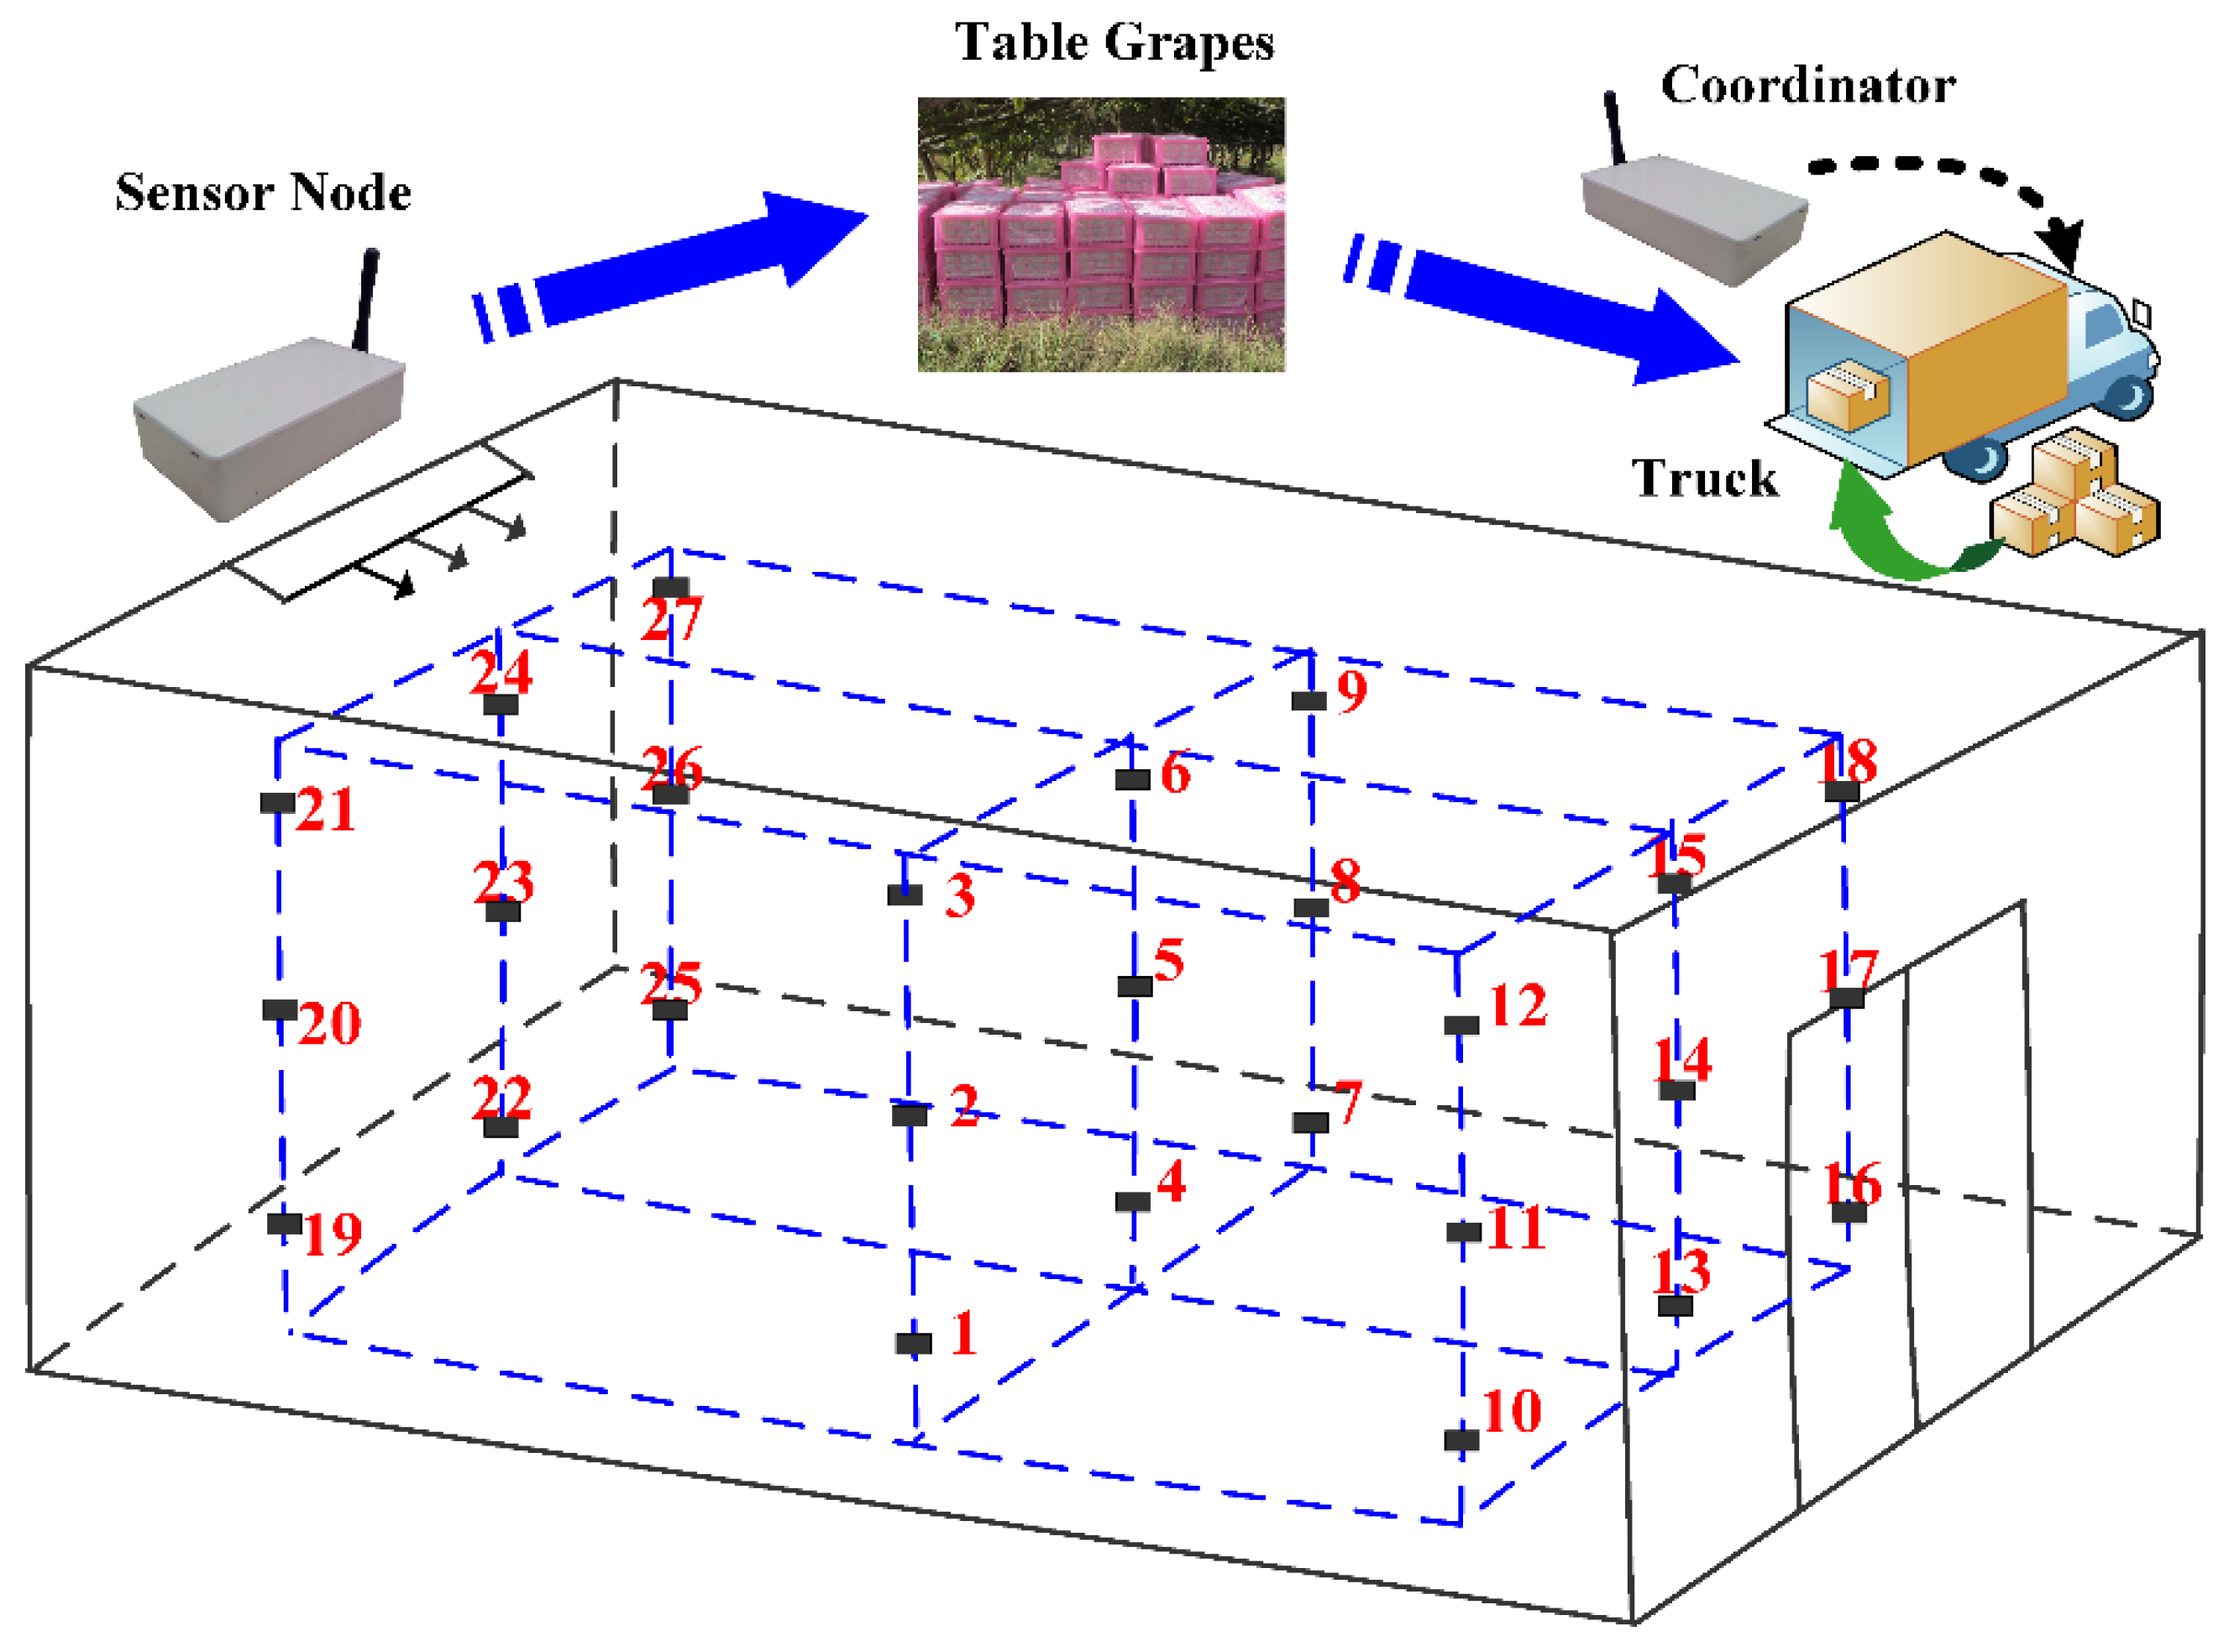
2.4. Implementation Scenario

The Kyoho table grapes (Vitis vinifera L. × V. labrusca L. cv. Kyoho) (Bole, China) cold chain logistics were chosen. The quality of firmness was assessed using a handheld durometer (AGY-2, Beijing, China) by measuring force used for pressing grapes by 1 mm and expressed as Newton per meter. Ten grapes were randomly selected, and analyses were performed in triplicate.
Figure 3 indicates the sensor nodes and coordinator deployment at the refrigeration truck in cold chain logistics. The WSN, which comprised 27 sensor nodes and a network coordinator node, was deployed in the field of a refrigeration truck for 15 days of transportation in cold chain logistic from Xingjiang to Guangdong province in China. The length, width and height of the refrigerated truck are about 3.0 m × 2.5 m × 2.4 m. Each sensor node, supplied with a 3.7-V, 1800-mAh lithium battery, was integrated into a plastic box with external antenna and put into the box of the table grapes before loading. The network coordinator, supplied with a 5.0-V, 2.0-A adaptor, was deployed at the driver’s cab, and the sensor data can be transmitted in real time to the remote control center located at the company’s office in Beijing via the GPRS (China Mobile Communication Co. Ltd., Beijing, China).
The data acquisition interval of the sensor nodes is set to 1 s, and the data sending interval of the network coordinator is set to 1 min. The length of a transmitted data packet is nine bytes, which includes the sensor ID (one byte), the temperature data (four bytes) and the battery voltage (four bytes). The sensor nodes calculate in real time the weight coefficients and fuse the sensor data, while the network coordinator aggregates the temperature and relative humidity data acquired from the sensor nodes every data acquisition interval and finally transmits the fusion data to the remote control center for further analysis and processing via the GPRS every data sending interval during the cold chain logistics.
The cold chain logistics process of table grapes and the data fusion of the temperature and relative humidity are analyzed and evaluated to improve the transparency and traceability of the temperature and relative humidity in the cold chain logistics and to ensure the quality and safety of the table grapes according to the implementation scenario.
Figure 3. The sensor nodes and coordinator deployment at the refrigerated truck.
Applsci 05 00747 g003

3. Results and Discussion

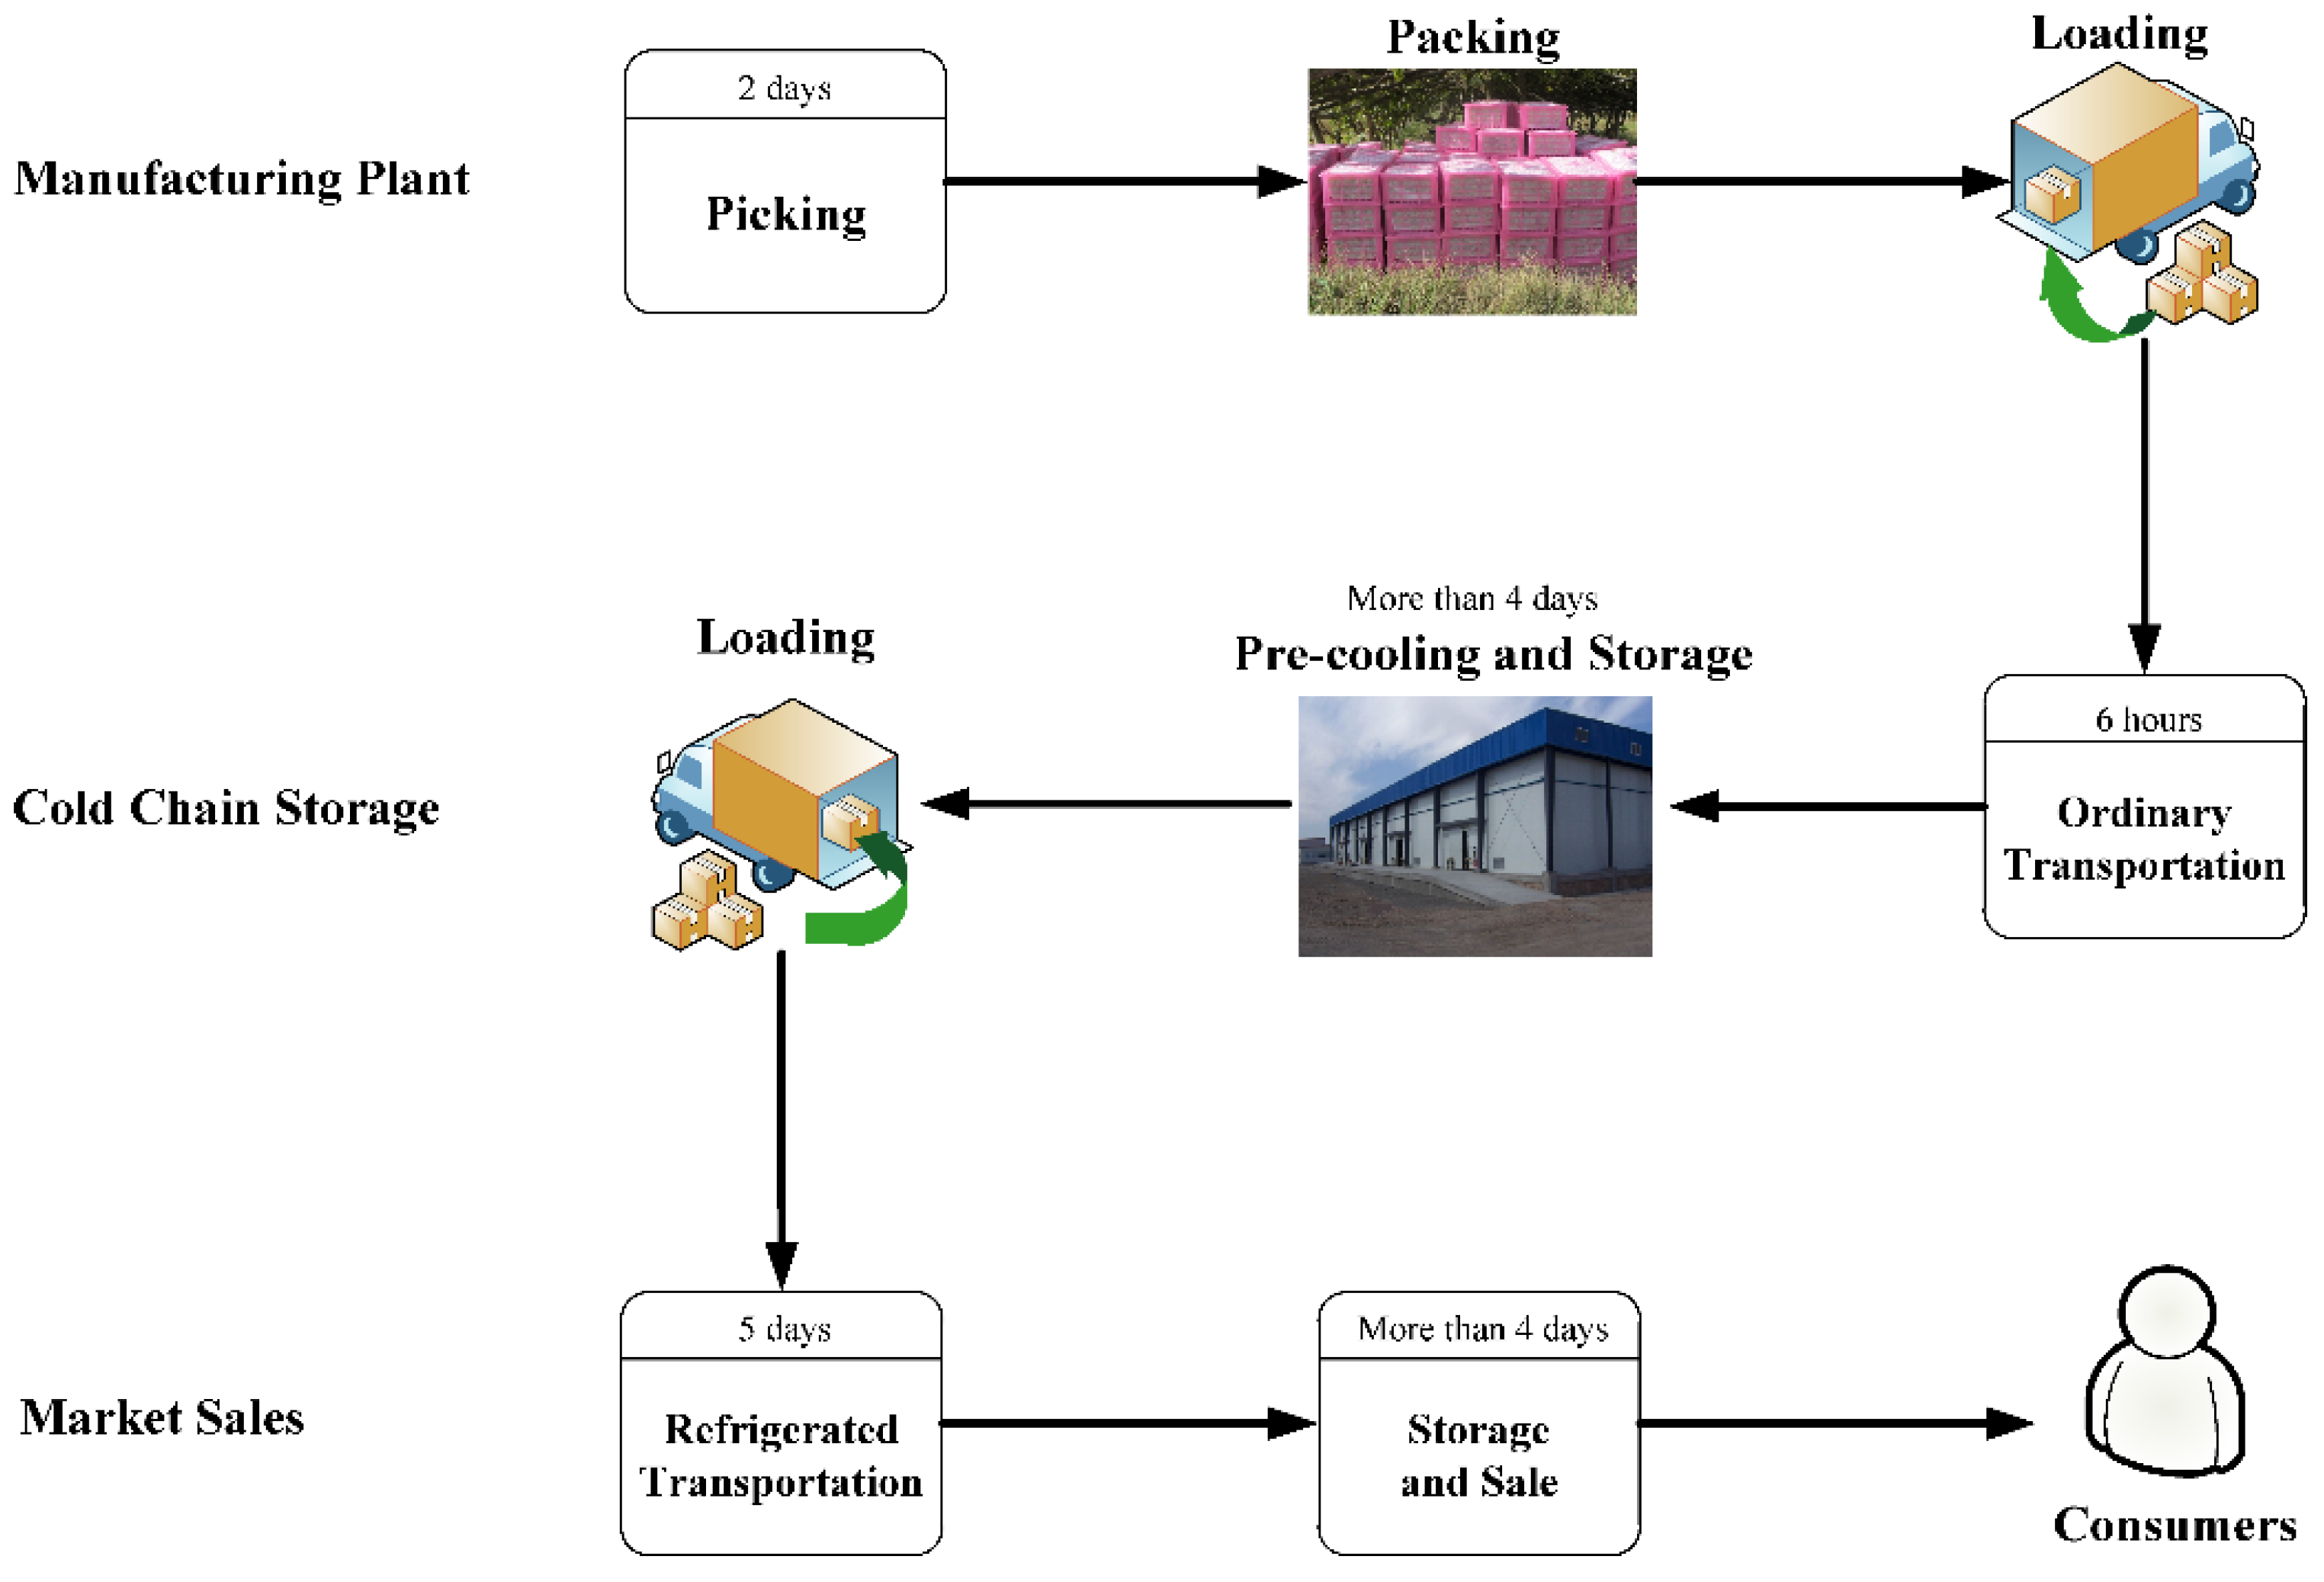
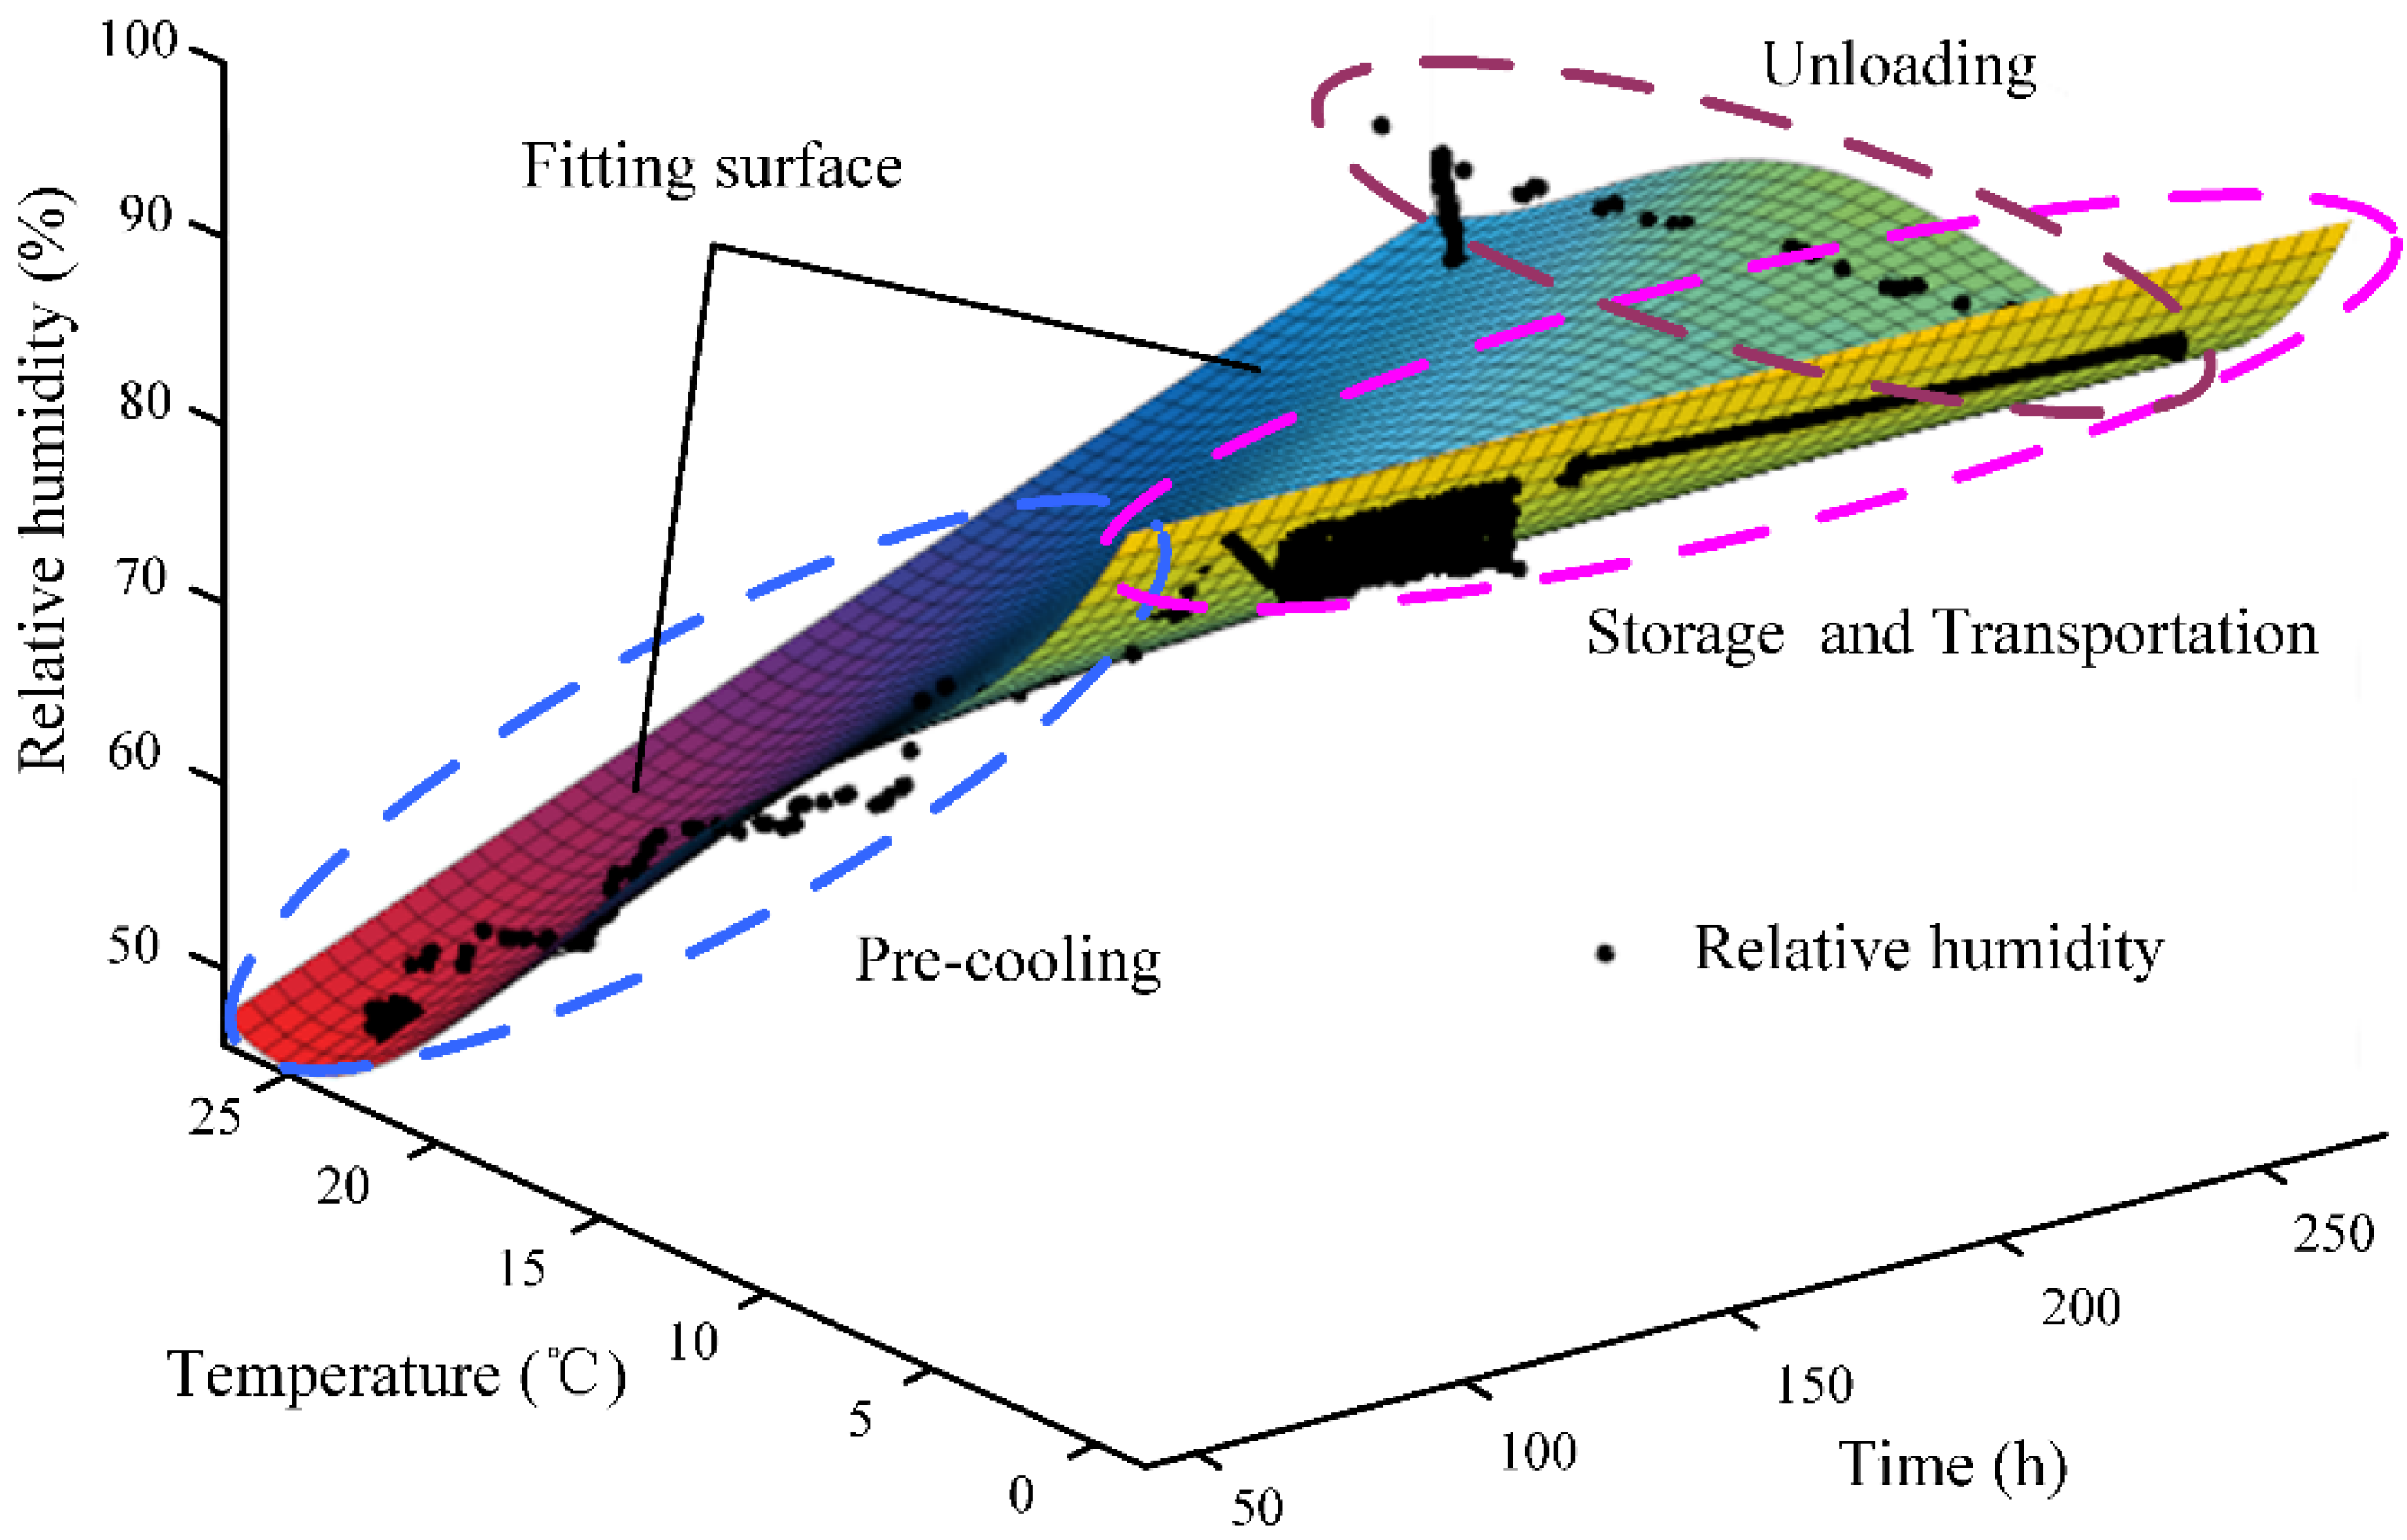
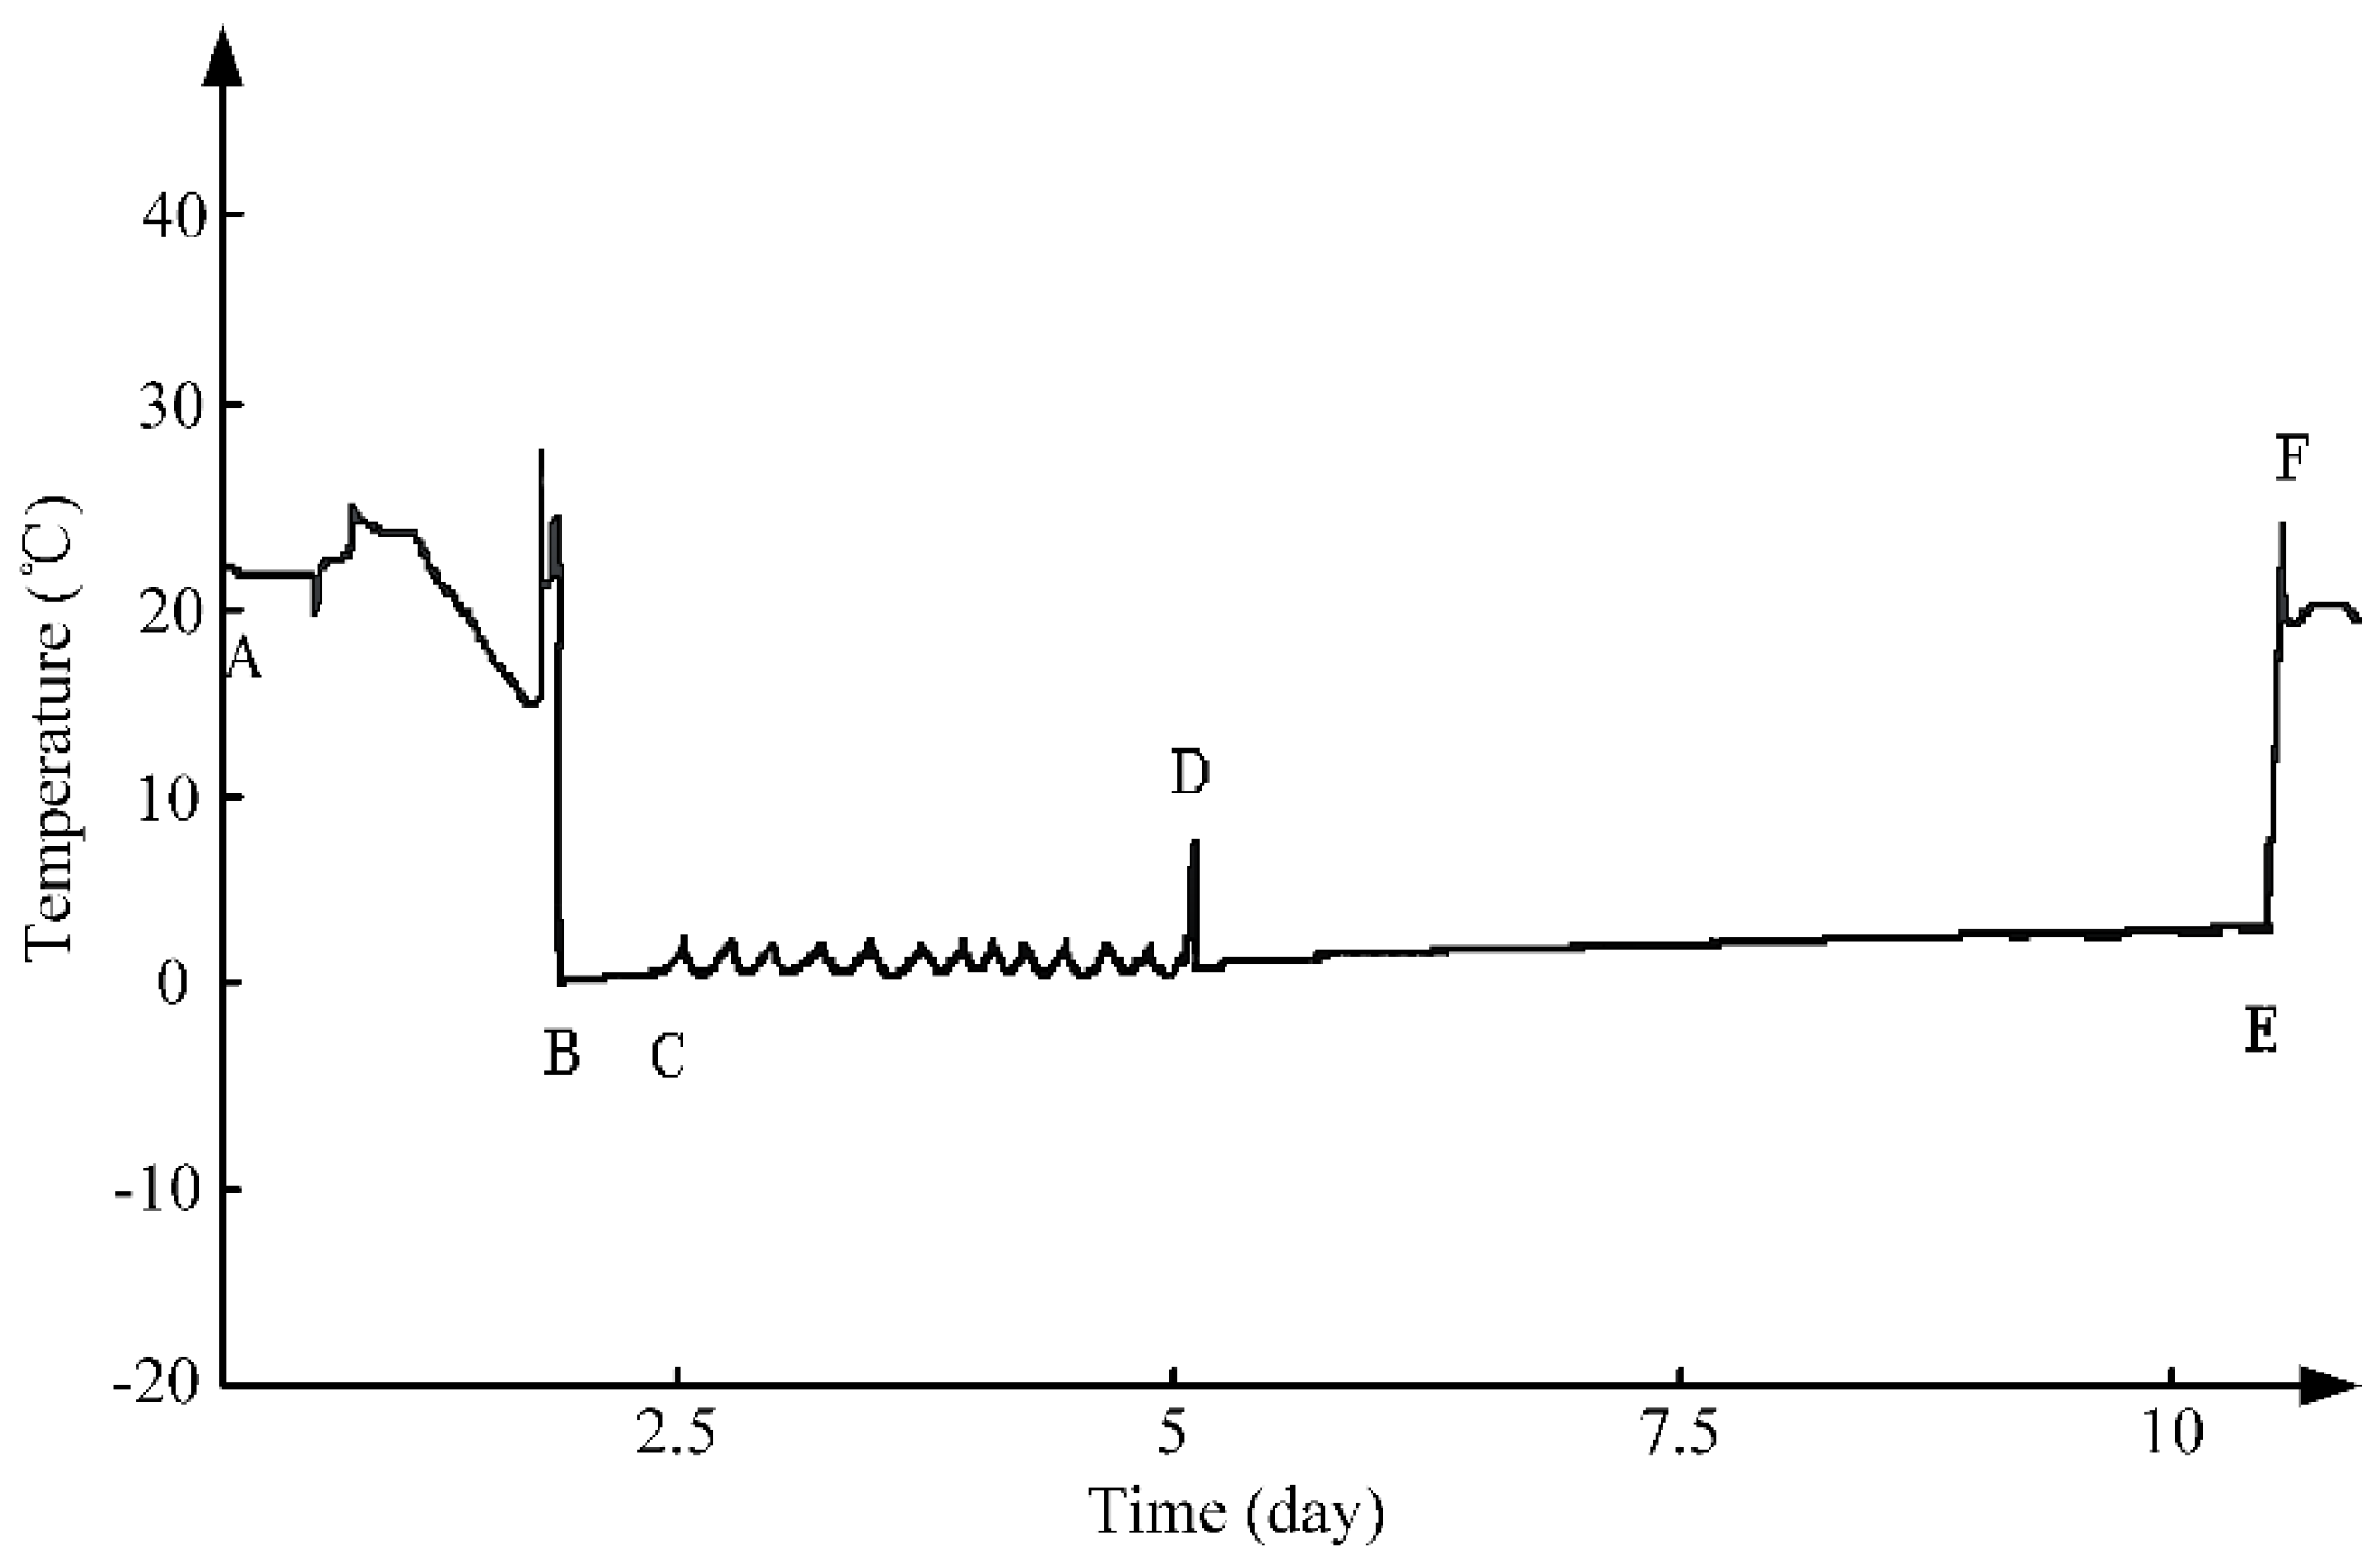
3.1. Process Analysis of Table Grapes’ Cold Chain Logistics

The process of table grapes’ cold chain logistics is illustrated as Figure 4 and analyzed in Table 1. The table grapes were transported from Xingjiang to Guangdong province in China for about 15 days, the one-way transportation distance of which is about 4300 km.
Figure 4. Process of table grapes’ cold chain logistics.
Applsci 05 00747 g004
Table 1. Cold chain logistics process of table grapes.
StepOperationDescriptionRemark
1Picking and PackingTable grapes should be picked when fully ripe in the evening with dry weather conditions and packed into boxes.Temperature and relative humidity varied with the ambient temperature.
2Ordinary TransportationTable grapes are transported to cold storage by ordinary truck.Temperature and relative humidity varied with the ambient temperature.
3Pre-coolingPre-cooling for the picked table grapes because they are still in the metabolism.Temperature of 0 °C or lower and relative humidity of 90% or higher.
4StorageTable grapes are stored at a low and stable temperature and relative humidity for cold chain storage.Temperature of 0 °C or lower and relative humidity of 90% or higher with about 3 days or more.
5LoadingTable grapes are loaded.About 6 h or lower.
6Refrigerated TransportationTable grapes are transported in a low and stable temperature and relative humidity condition.Temperature of 0 °C or lower and relative humidity of 90% or higher with about 5 days or more.
7UnloadingTable grapes are unloaded for sale.About 6 h or lower.
8SaleTable grapes are sold in the market.Temperature and relative humidity varied with the ambient temperature.
Figure 5. The curve of the temperature in the table grapes’ cold chain logistics.
Applsci 05 00747 g005
The curve of the temperature in the whole table grapes’ cold chain logistics is demonstrated in Figure 5. The AB segment is the picking and packing process for table grapes at the farm, and the temperature in the AB segment is mainly varied with the ambient temperature. The temperature is about 25 °C in this process. The BC segment is the pre-cooling process, whose pre-cooling temperature is about −2 °C in the cold storage after the picking and packing process. The CD segment is the preservation storage process. The temperature is stable at about 0 °C. The DF segment is the refrigerated transportation process. The temperature is stable at about 0 °C, as well. The EF segment is the table grapes’ unloading process. The temperature decays rapidly from the normal temperature to the refrigerated temperature at about −2 °C in the BC segment. The D point is the table grapes’ loading process, and the temperature in this range rises to about 8 °C and then decays to about 0 °C rapidly. The temperature in the EF segment rises rapidly from the refrigerated temperature to the normal temperature at about 25 °C and then varies with the ambient temperature.

3.2. Adaptive Data Fusion Analysis of Table Grapes’ Cold Chain Logistics

The optimal weighted data fusion effective and error are analyzed to evaluate the accuracy of the sensor data acquired by sensor nodes under the whole table grapes’ cold chain logistics. The mean square error and weight coefficients were calculated at the sensor node every data acquisition interval and then transmitted to the remote control center via the GPRS in the network coordinator according to the scenario’s setup. Figure 6 describes the temperature and relative humidity with surface fitting by the MATLAB software (MathWorks Incorporated, Natick, MA, USA) after the data fusion.
Both of them are relatively stable during the cold chain logistics transportation. According to Figure 5 and Figure 6, the relative humidity rises from the normal relative humidity to the refrigerated relative humidity at about 92% as the temperature decays from the normal temperature to the refrigeration temperature at about −2 °C. Then, they keep the relative stable condition in the preservation storage process until the table grapes’ loading. The relative humidity decays from the refrigerated relative humidity to the normal relative humidity at about 64% as the temperature rises from the refrigerated temperature to the normal temperature at about 25 °C for the table grapes’ unloading.
Figure 6. Temperature and relative humidity in the cold chain logistics after data fusion.
Applsci 05 00747 g006
The performance results of the fused temperature and relative humidity in the cold chain, compared to the arithmetic mean, are shown in Table 2. The mean absolute error and mean relative error of the temperature data are 0.06 °C and 8.61% and the relative humidity data are 0.12% and 0.23%, respectively, is more accurate than the arithmetic mean. However, the run time of AOW is longer than that of arithmetic mean, and the mean battery charge status is 93.2% of the arithmetic mean and 91.5% of the AOW, respectively, after 15 days’ transportation in the cold chain. These may be caused by the adaptive weight coefficients’ calculation. However, the run time and mean battery charge status meet the actual real-time application requirements in the cold chain logistics [6,34].
Table 2. Performance of the adaptive optimal weighted data fusion (AOW) compared to the arithmetic mean.
ParametersMean Absolute ErrorMean Relative ErrorRun TimeMean Battery Charge Status
TemperatureRelative humidityTemperatureRelative humidity
Arithmetic Mean0.35 °C1.56%19.54%2.99%1.508 s93.2%
AOW0.06 °C0.12%8.61%0.23%1.594 s91.5%
The results suggest that the adaptive optimal weighted data fusion could fuse the sensor data, accurately, efficiently and adaptively, which reflects the real-time data dynamic characteristic in the refrigeration truck during the whole cold chain logistics of table grapes.

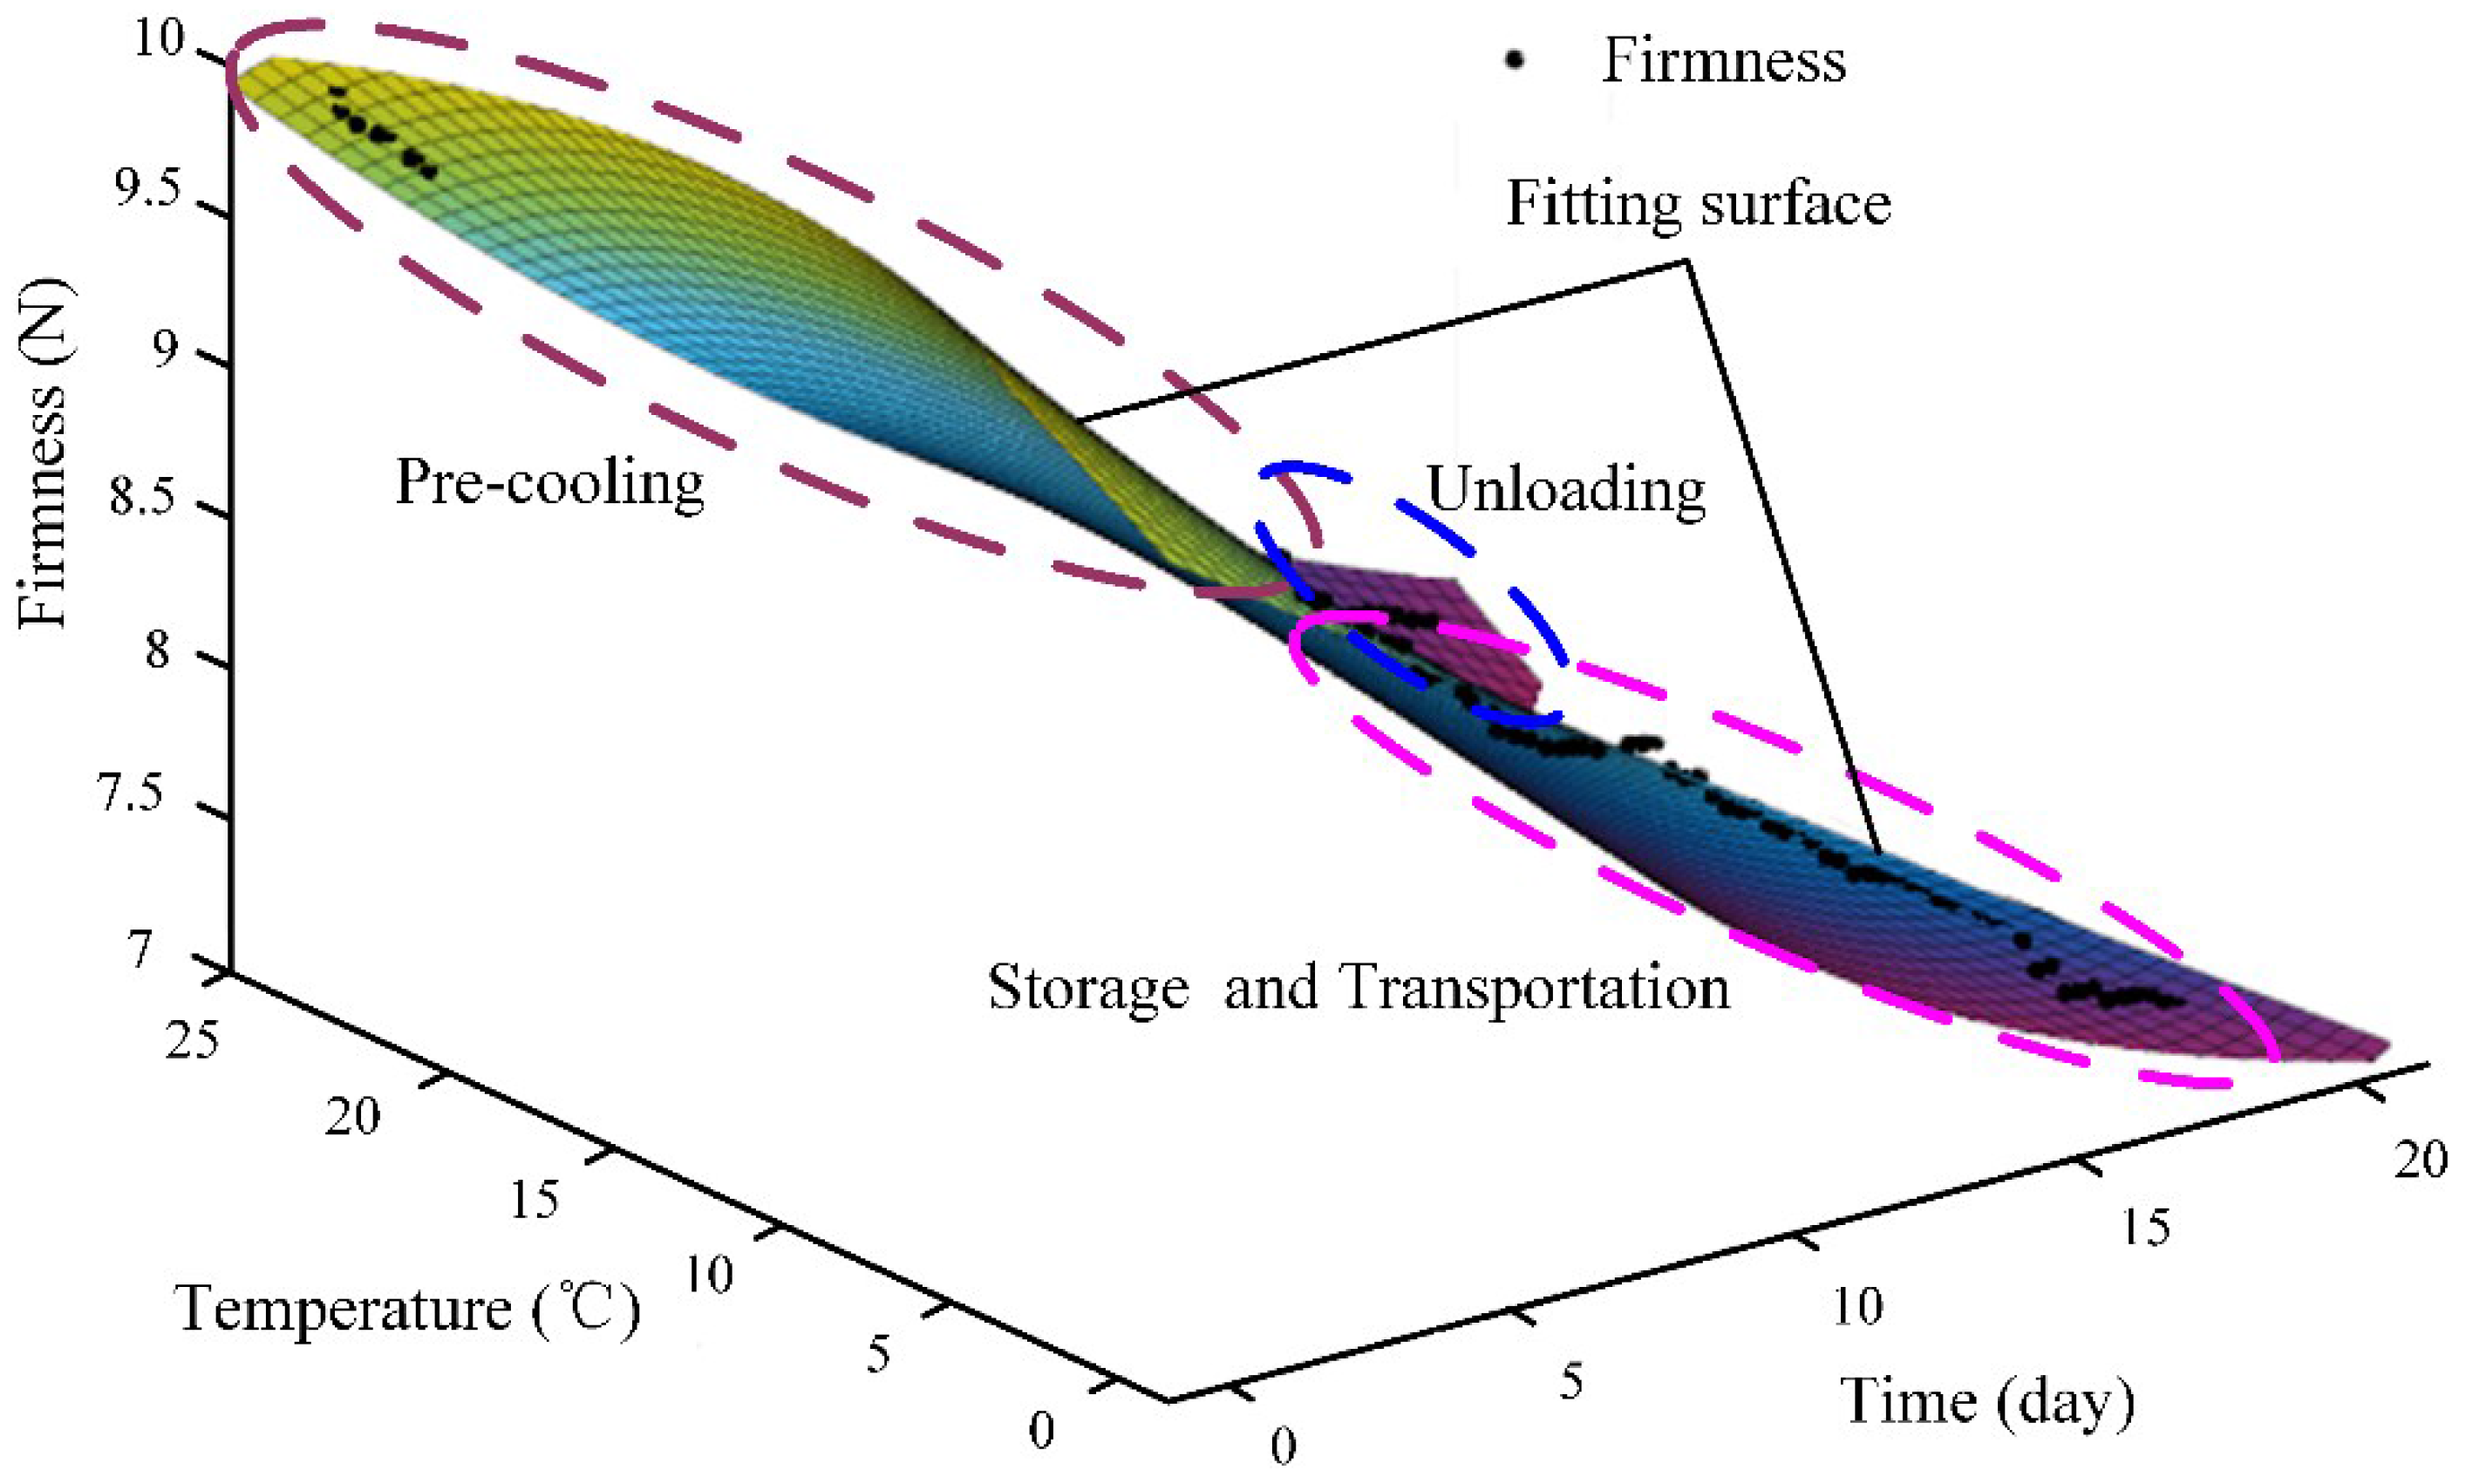
3.3. Firmness Analysis of Table Grapes’ Cold Chain Logistics

The chart of the firmness of table grapes in the cold chain is shown in Figure 7. Firmness decreases over time during the cold chain logistics, and the rate of firmness loss differed significantly. The higher the temperature, the faster the firmness loss was.
Figure 7. Firmness of table grapes in the cold chain.
Applsci 05 00747 g007
The results indicate that the transparency of the table grapes’ cold chain logistics is improved by the analysis of the dynamic temperature and firmness quality of the table grapes’ cold chain, which ensure the preservation quality and safety of table grapes during the cold chain logistics.

4. Conclusions

This paper aims to study the effect of table grapes’ quality property in cold chain logistics for improving the transparency and traceability of the cold chain logistics and ensuring the table grapes’ quality and safety. WSN and AOW are applied to demonstrate the temperature and relative humidity characteristics in the table grapes’ cold chain logistics.
WSN technology enables real-time sensor data acquisition by the wireless network infrastructure in the field of cold chain logistics. The AOW method enables the sensor data to be transmitted to the remote control center in an adaptive way and reflects the acquired sensor data with high accuracy and efficiency.
The cold chain process, firmness quality and adaptive data fusion of temperature and relative humidity were evaluated. The results indicate that the WSN and AOW methods could effectively reflect the real-time temperature and relative humidity information and quality propriety, improve the transparency and traceability in the cold chain and ensure the preservation quality and safety of table grapes. The AOW performance analysis shows that the AOW, whose mean absolute error and mean relative error of the temperature data are 0.06 °C and 8.61% and relative humidity data are 0.12% and 0.23%, respectively, could fuse the sensor data accurately, efficiently and adaptively and meet the actual application requirements.
Although WSN and AOW have been combined to evaluate the adaptive temperature and relative humidity fusion of the table grapes’ cold chain logistics in this study, theses methodologies could be exploited by future researchers or practitioners in improving the monitoring methods to perform wider cold chain monitoring tasks.

Acknowledgments

This research is funded by “Supported by the Program for New Century Excellent Talents in University” (NECT-11-0491) from the Ministry of Education of China and the Agricultural Scientific and Technological Achievements Transforming Fund of China (Shandong).

Author Contributions

Xiaoshuan Zhang and Jun Li conceived of and designed the experiments and analyzed the cold chain logistics, they made the same contributions. Xinqing Xiao and Xiang Wang performed the experiments and analyzed the data. Xinqing Xiao wrote the paper. Xiaoshuan Zhang and Enxiu Chen contributed to the paper’s modification and refinement.

Conflicts of Interest

The authors declare no conflict of interest.

References

  1. Zhang, J.; Zhang, X.; Zhang, L.; Li, S.; Hu, J. Design on wireless SO2 sensor node based on CC2530 for monitoring table grape logistics. J. Food Agric. Environ. 2013, 11, 115–117. [Google Scholar]
  2. Feng, J.; Wang, X.; Fu, Z.; Mu, W. Assessment of consumers’ perception and cognition toward table grape consumption in China. Br. Food J. 2014, 116, 611–628. [Google Scholar]
  3. Ngcobo, M.E.K.; Opara, U.L.; Thiart, G.D. Effects of packaging liners on cooling rate and quality attributes of table grape (cv. Regal Seedless). Packag. Technol. Sci. 2012, 25, 73–84. [Google Scholar] [CrossRef]
  4. Qi, L.; Xu, M.; Fu, Z.; Mira, T.; Zhang, X. (CSLDS)-S-2: A WSN-based perishable food shelf-life prediction and LSFO strategy decision support system in cold chain logistics. Food Control 2014, 38, 19–29. [Google Scholar] [CrossRef] [Green Version]
  5. Stahl, V.; Ndoye, F.T.; el Jabri, M.; le Page, J.F.; Hezard, B.; Lintz, A.; Geeraerd, A.H.; Alvarez, G.; Thuault, D. Safety and quality assessment of ready-to-eat pork products in the cold chain. J. Food Eng. 2015, 148, 43–52. [Google Scholar] [CrossRef]
  6. Qi, L.; Han, Y.; Zhang, X.; Xing, S.; Fu, Z. Real time monitoring system for aquatic cold-chain logistics based on WSN. Trans. Chin. Soc. Agric. Mach. 2012, 43, 134–140. [Google Scholar]
  7. Liao, W.-J.; Lien, T.-W.; Hisao, B.-R.; Wang, H.-S.; Yang, C.-F.; Tarng, J.-H.; Nien, C.-C.; Chiu, T.-C. Sensor integrated antenna design for applications in cold chain logistic services. IEEE Trans. Antennas Propag. 2015, 63, 727–735. [Google Scholar] [CrossRef]
  8. Meng, X.; Li, B.; Liu, J.; Tian, S. Physiological responses and quality attributes of table grape fruit to chitosan preharvest spray and postharvest coating during storage. Food Chem. 2008, 106, 501–508. [Google Scholar] [CrossRef]
  9. Xiao, X.; Qi, L.; Fu, Z.; Zhang, X. Monitoring method for cold chain logistics of table grape based on compressive sensing. Trans. Chin. Soc. Agric. Eng. 2013, 29, 259–266. [Google Scholar]
  10. Fu, Z.; Yao, M.; Ma, C.; Qi, L.; Zhang, X. Applicability of a chemical time temperature indicator as a quality indicator for table grape. J. China Agric. Univ. 2013, 18, 186–191. [Google Scholar]
  11. Zhang, J.; Li, D.; Xu, W.; Fu, Y. Preservation of Kyoho grapes stored in active, slow-releasing pasteurizing packaging at room temperature. Lwt-Food Sci. Technol. 2014, 56, 440–444. [Google Scholar] [CrossRef]
  12. Bai, J.-W.; Sun, D.-W.; Xiao, H.-W.; Mujumdar, A.S.; Gao, Z.-J. Novel high-humidity hot air impingement blanching (HHAIB) pretreatment enhances drying kinetics and color attributes of seedless grapes. Innov. Food Sci. Emerg. Technol. 2013, 20, 230–237. [Google Scholar] [CrossRef]
  13. Kim, W.R.; Aung, M.M.; Chang, Y.S.; Makatsoris, C. Freshness Gauge based cold storage management: A method for adjusting temperature and humidity levels for food quality. Food Control 2015, 47, 510–519. [Google Scholar] [CrossRef]
  14. Balic, I.; Ejsmentewicz, T.; Sanhueza, D.; Silva, C.; Peredo, T.; Olmedo, P.; Barros, M.; Verdonk, J.C.; Paredes, R.; Meneses, C.; et al. Biochemical and physiological study of the firmness of table grape berries. Postharvest Biol. Technol. 2014, 93, 15–23. [Google Scholar] [CrossRef]
  15. Carreno, I.; Antonio Cabezas, J.; Martinez-Mora, C.; Arroyo-Garcia, R.; Luis Cenis, J.; Martinez-Zapater, J.M.; Carreno, J.; Ruiz-Garcia, L. Quantitative genetic analysis of berry firmness in table grape (Vitis vinifera L.). Tree Genet. Genom. 2015, 11. [Google Scholar] [CrossRef]
  16. Solyom, K.; Kraus, S.; Mato, R.B.; Gaukel, V.; Schuchmann, H.P.; Jose Cocero, M. Dielectric properties of grape marc: Effect of temperature, moisture content and sample preparation method. J. Food Eng. 2013, 119, 33–39. [Google Scholar] [CrossRef]
  17. Sabale, R.; Shabeer, T.P.A.; Utture, S.C.; Banerjee, K.; Jadhav, M.R.; Oulkar, D.P.; Adsule, P.G.; Deshmukh, M.B. Dissipation kinetics, safety evaluation, and assessment of pre-harvest interval (PHI) and processing factor for kresoxim methyl residues in grape. Environ. Monit. Assess. 2014, 186, 2369–2374. [Google Scholar] [CrossRef] [PubMed]
  18. Hassanpour, H. Effect of Aloe vera gel coating on antioxidant capacity, antioxidant enzyme activities and decay in raspberry fruit. Lwt-Food Sci. Technol. 2015, 60, 495–501. [Google Scholar] [CrossRef]
  19. Li, M.; You, X.; Wen, R.; Zhang, Y.; Sun, J.; Li, Z.; Wei, P.; Li, L.; Li, C. Preservation quality and physiological biochemical characteristics of abscission fruit of grape during cold storage. J. South. Agric. 2014, 45, 1883–1889. [Google Scholar]
  20. Arazuri, S.; Diezma, B.; Blanco, R.; Garcia-Ramos, F.J. Comparison of different pre-treatments to improve accuracy of total soluble solids content prediction models in grapes using a portable NIR spectrophotometer. J. Food Agric. Environ. 2014, 12, 218–223. [Google Scholar]
  21. Lopez de Lerma, N.; Moreno, J.; Peinado, R.A. Determination of the optimum sun-drying time for Vitis vinifera L. cv. tempranillo grapes by E-nose analysis and characterization of their volatile composition. Food Bioprocess Technol. 2014, 7, 732–740. [Google Scholar] [CrossRef]
  22. Kim, I.H.; Oh, Y.A.; Lee, H.; Bin Song, K.; Min, S.C. Grape berry coatings of lemongrass oil-incorporating nanoemulsion. Lwt-Food Sci. Technol. 2014, 58, 1–10. [Google Scholar] [CrossRef]
  23. Wang, T.; Zhang, J.; Zhang, X. Fish product quality evaluation based on temperature monitoring in cold chain. Afr. J. Biotechnol. 2013, 9, 6146–6151. [Google Scholar]
  24. Badia-Melis, R.; Ruiz-Garcia, L.; Garcia-Hierro, J.; Villalba, J.I.R. Refrigerated fruit storage monitoring combining two different wireless sensing technologies: RFID and WSN. Sensors 2015, 15, 4781–4795. [Google Scholar] [CrossRef] [PubMed]
  25. Qi, L.; Zhang, J.; Mark, X.; Fu, Z.; Chen, W.; Zhang, X. Developing WSN-based traceability system for recirculation aquaculture. Mathem. Comput. Model. 2011, 53, 2162–2172. [Google Scholar] [CrossRef] [Green Version]
  26. Alayev, Y.; Chen, F.; Hou, Y.; Johnson, M.P.; Bar-Noy, A.; la Porta, T.F.; Leung, K.K. Throughput maximization in mobile WSN scheduling with power control and rate selection. IEEE Trans. Wirel. Commun. 2014, 13, 4066–4079. [Google Scholar] [CrossRef]
  27. Suryadevara, N.K.; Mukhopadhyay, S.C.; Kelly, S.D.T.; Gill, S.P.S. WSN-based smart sensors and actuator for power management in intelligent buildings. IEEE/ASME Trans. Mechatron. 2015, 20, 564–571. [Google Scholar] [CrossRef]
  28. Qi, L.; Tian, D.; Zhang, J.; Zhang, X.; Fu, Z. Sensing data compression method based on SPC for agri-food cold-chain logistics. Trans. Chin. Soc. Agric. Mach. 2011, 42, 129–134. [Google Scholar]
  29. Coates, R.W.; Delwiche, M.J.; Broad, A.; Holler, M. Wireless sensor network with irrigation valve control. Comput. Electron. Agric. 2013, 96, 13–22. [Google Scholar] [CrossRef]
  30. Badia-Melis, R.; Garcia-Hierro, J.; Ruiz-Garcia, L.; Jiménez-Ariza, T.; Villalba, J.I.R.; Barreiro, P. Assessing the dynamic behavior of WSN motes and RFID semi-passive tags for temperature monitoring. Comput. Electron. Agric. 2014, 103, 11–16. [Google Scholar] [CrossRef]
  31. Weimer, J.; Krogh, B.H.; Small, M.J.; Sinopoli, B. An approach to leak detection using wireless sensor networks at carbon sequestration sites. Int. J. Greenh. Gas Control 2012, 9, 243–253. [Google Scholar] [CrossRef]
  32. Xu, G.; Shen, W.; Wang, X. Applications of wireless sensor networks in marine environment monitoring: A survey. Sensors 2014, 14, 16932–16952. [Google Scholar] [CrossRef] [PubMed]
  33. Shen, W.; Zhang, T.; Gidlund, M.; Dobslaw, F. SAS-TDMA: A source aware scheduling algorithm for real-time communication in industrial wireless sensor networks. Wirel. Netw. 2013, 19, 1155–1170. [Google Scholar] [CrossRef]
  34. Xiao, X.; Zhu, T.; Qi, L.; Moga, L.M.; Zhang, X. MS-BWME: A wireless real-time monitoring system for brine well mining equipment. Sensors 2014, 14, 19877–19896. [Google Scholar] [CrossRef] [PubMed]
  35. Niri, E.D.; Farhidzadeh, A.; Salamone, S. Adaptive multisensor data fusion for acoustic emission source localization in noisy environment. Struct. Health Monit. Int. J. 2013, 12, 59–77. [Google Scholar] [CrossRef]
  36. Shu, J.; Hong, M.; Zheng, W.; Sun, L.-M.; Ge, X. Multi-sensor data fusion based on consistency test and sliding window variance weighted algorithm in sensor networks. Comput. Sci. Inf. Syst. 2013, 10, 197–214. [Google Scholar]
  37. Zhang, M.; Shen, M. Research of WSN-based data fusion in water quality monitoring. Comput. Eng. Appl. 2014, 50, 234–238. [Google Scholar]
  38. Chen, F.; Chandrakasan, A.P.; Stojanovic, V.M. Design and analysis of a hardware-efficient compressed sensing architecture for data compression in wireless sensors. IEEE J. Solid-State Circuits 2012, 47, 744–756. [Google Scholar] [CrossRef]
  39. Li, Y.; Zhang, Q.; Wu, S.; Zhou, R. Efficient data gathering with network coding coupled compressed sensing for wireless sensor networks. Inf. Technol. J. 2013, 12, 1737–1745. [Google Scholar]
  40. Javadi, S.H.; Peiravi, A. Fusion of weighted decisions in wireless sensor networks. IET Wirel. Sensor Syst. 2015, 5, 97–105. [Google Scholar] [CrossRef]

