Review

Irregular Homogeneity Domains in Ternary Intermetallic Systems

by
Jean-Marc Joubert
*,
Mohamed Andasmas
and
Jean-Claude Crivello
Chimie Métallurgique des Terres Rares (CMTR), Institut de Chimie et des Matériaux Paris-Est (ICMPE), Centre National de la Recherche Scientifique (CNRS) Université Paris-Est Créteil, 2-8 rue Henri Dunant 94320 Thiais Cedex, France
*
Author to whom correspondence should be addressed.
Appl. Sci. 2015, 5(4), 1570-1589; https://doi.org/10.3390/app5041570
Submission received: 19 October 2015 / Revised: 20 November 2015 / Accepted: 25 November 2015 / Published: 4 December 2015

Abstract

:
Ternary intermetallic A–B–C systems sometimes have unexpected behaviors. The present paper examines situations in which there is a tendency to simultaneously form the compounds ABx, ACx and BCx with the same crystal structure. This causes irregular shapes of the phase homogeneity domains and, from a structural point of view, a complete reversal of site occupancies for the B atom when crossing the homogeneity domain. This work reviews previous studies done in the systems Fe–Nb–Zr, Hf–Mo–Re, Hf–Re–W, Mo–Re–Zr, Re–W–Zr, Cr–Mn–Si, Cr–Mo–Re, and Mo–Ni–Re, and involving the topologically close-packed Laves, χ and σ phases. These systems have been studied using ternary isothermal section determination, DFT calculations, site occupancy measurement using joint X-ray, and neutron diffraction Rietveld refinement. Conclusions are drawn concerning this phenomenon. The paper also reports new experimental or calculated data on Co–Cr–Re and Fe–Nb–Zr systems.

Graphical Abstract

1. Introduction

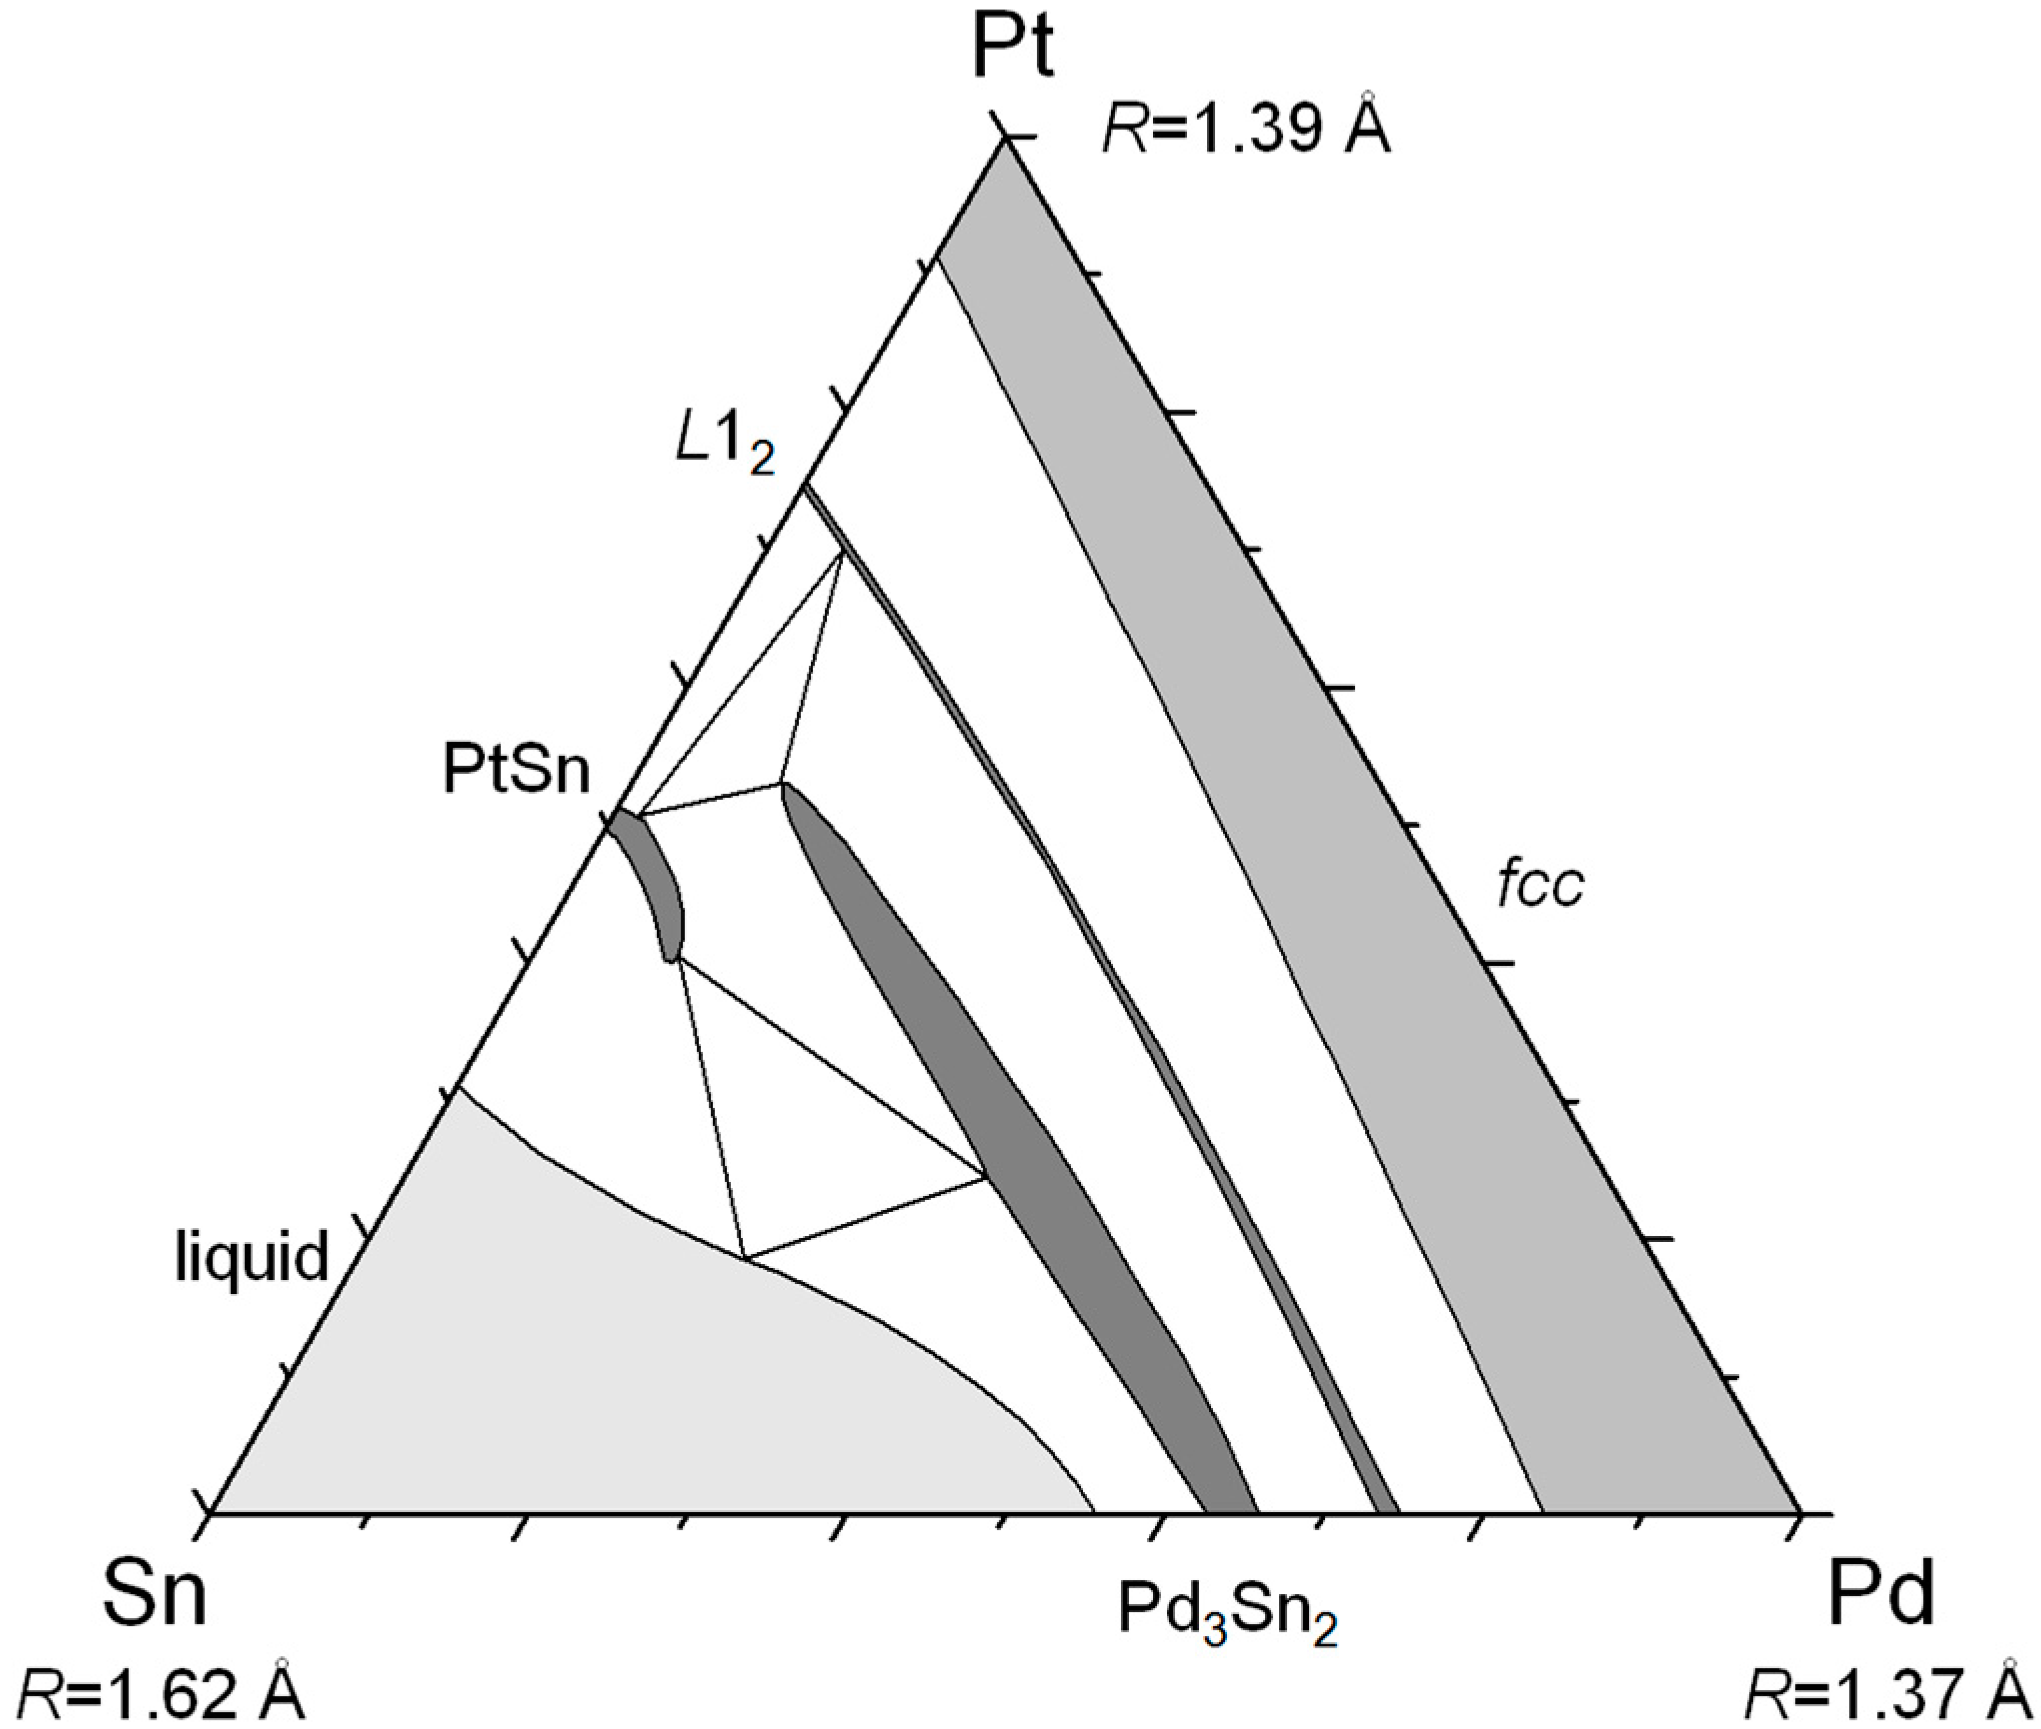
Figure 1 shows an example of a typical compound forming ternary system. In Sn–Pt–Pd, one compound (Pd3Sn2) extends deeply in the ternary field towards a metastable Pt3Sn2 phase; another (L12) is going from one of the binary systems to the other crossing the complete composition field. Both homogeneity domains are parallel to the Pt–Pd axis. In such a case, a substitutional model can be anticipated to account for the composition changes within the homogeneity domains, justified by the similar electronic properties and atomic radii of these two latter atoms. This type of system will be called regular in the sense that, if one element is close to another element in terms of electronic properties and/or atomic radius, then, the homogeneity domains are oriented parallel to the axis defined by these two elements.
Figure 1. Isothermal section at 1000 °C of the Sn–Pt–Pd system (redrawn from [1], Copyright 1981, Mineralogical Association of Canada).
Applsci 05 01570 g001
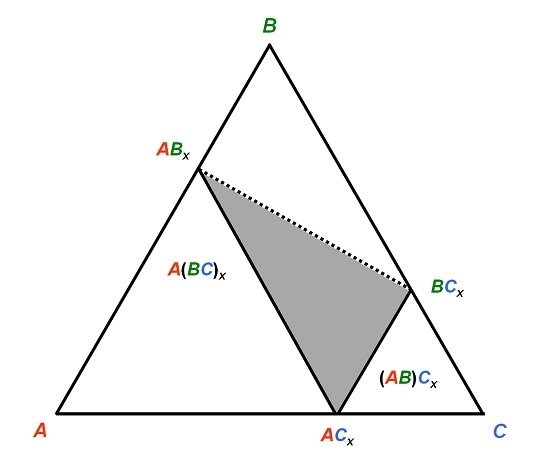
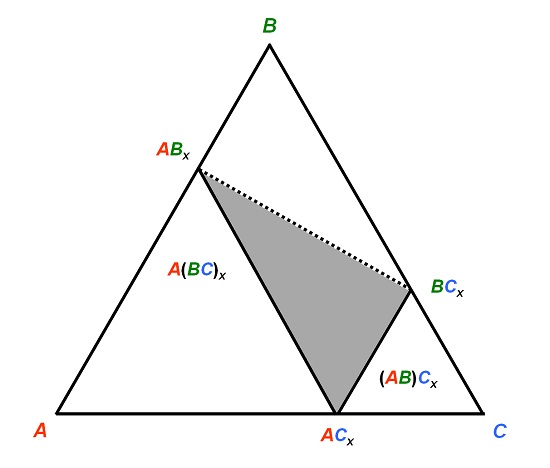
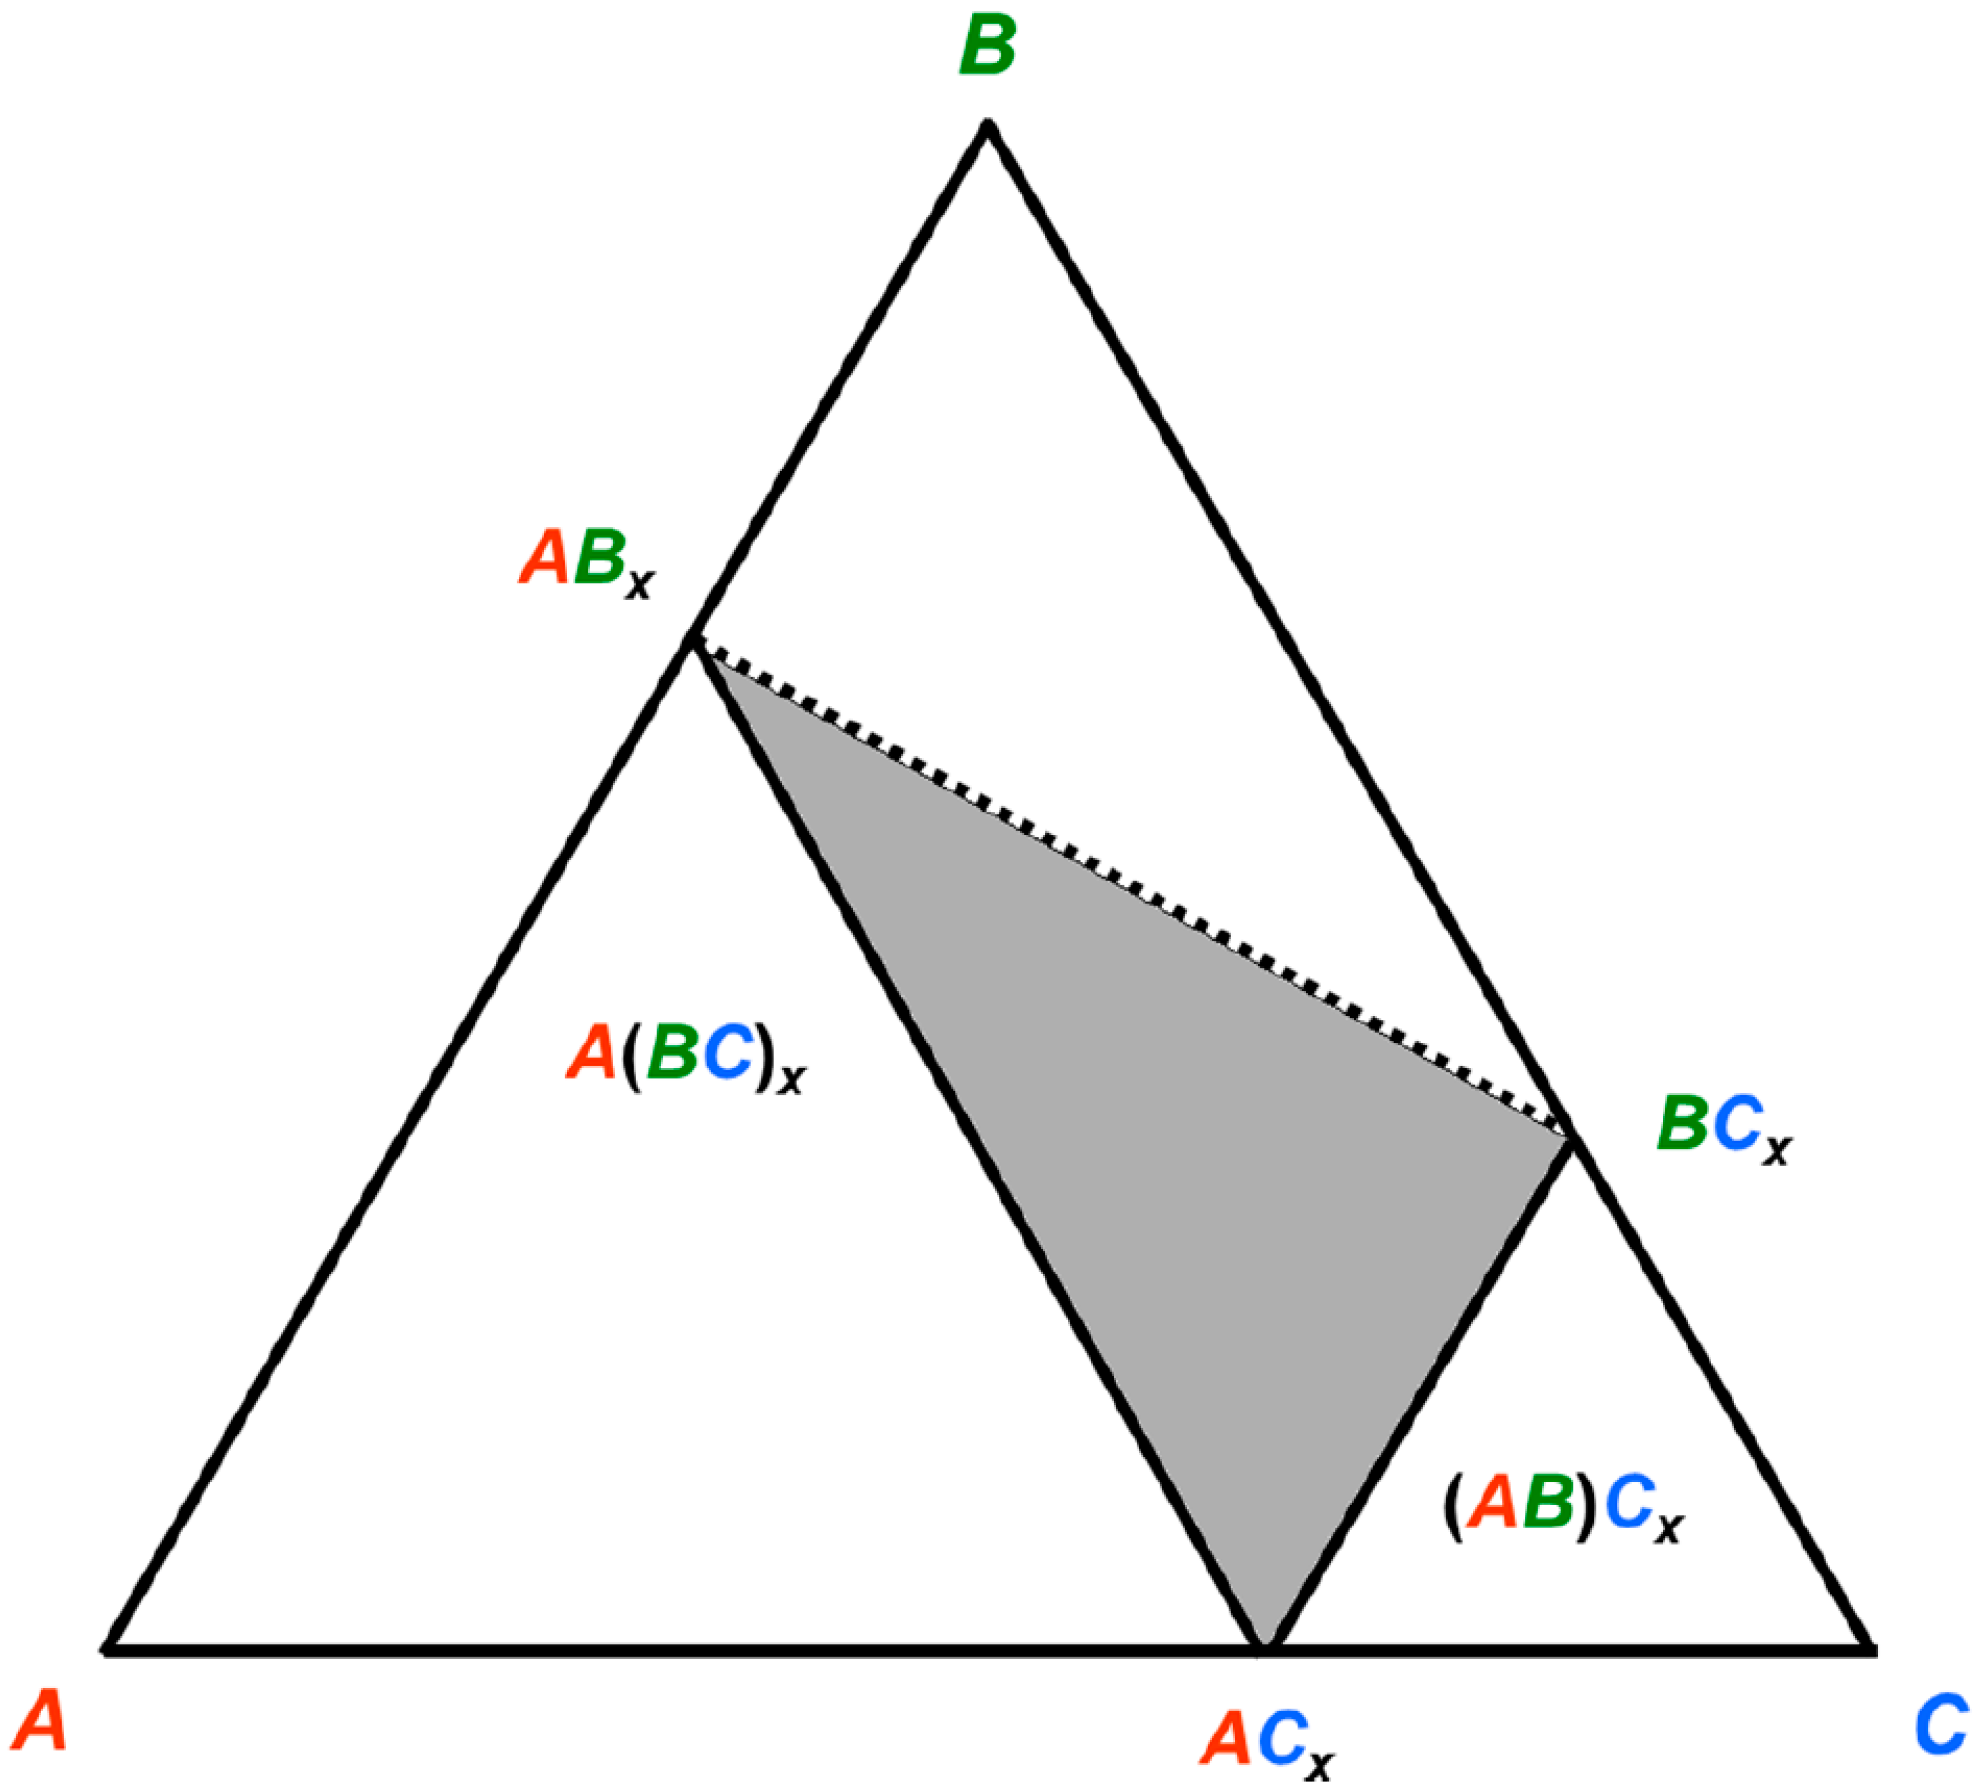
Let’s imagine now a system A–B–C as exemplified in Figure 2 so that RA > RB > RC. A compound ACx forms. Generally the larger atom A would occupy the sites with higher coordination number (CN). There may be a tendency for the intermediate size B atom to replace C in order to form a stable (or metastable) ABx. However, there may also be a tendency for B to form with C the compound BCx. Due to its larger size, B should then occupy the sites with high CN. If the stability of the phase is driven by geometrical reasons (the larger atom occupies the sites with high CN), then the three compounds ACx, ABx, and BCx respect the size criterion. This has two distinct consequences. First, one may find rather irregular shapes of the homogeneity domain in the phase diagram, typically located within the triangle drawn in Figure 2, since starting from ACx, B may have a tendency to substitute for both A and C. Second, one should expect a site preference reversal of the intermediate B atom when crossing the homogeneity domain between ABx and BCx (dashed line in Figure 2). This is not without consequences on the ternary phase stability.
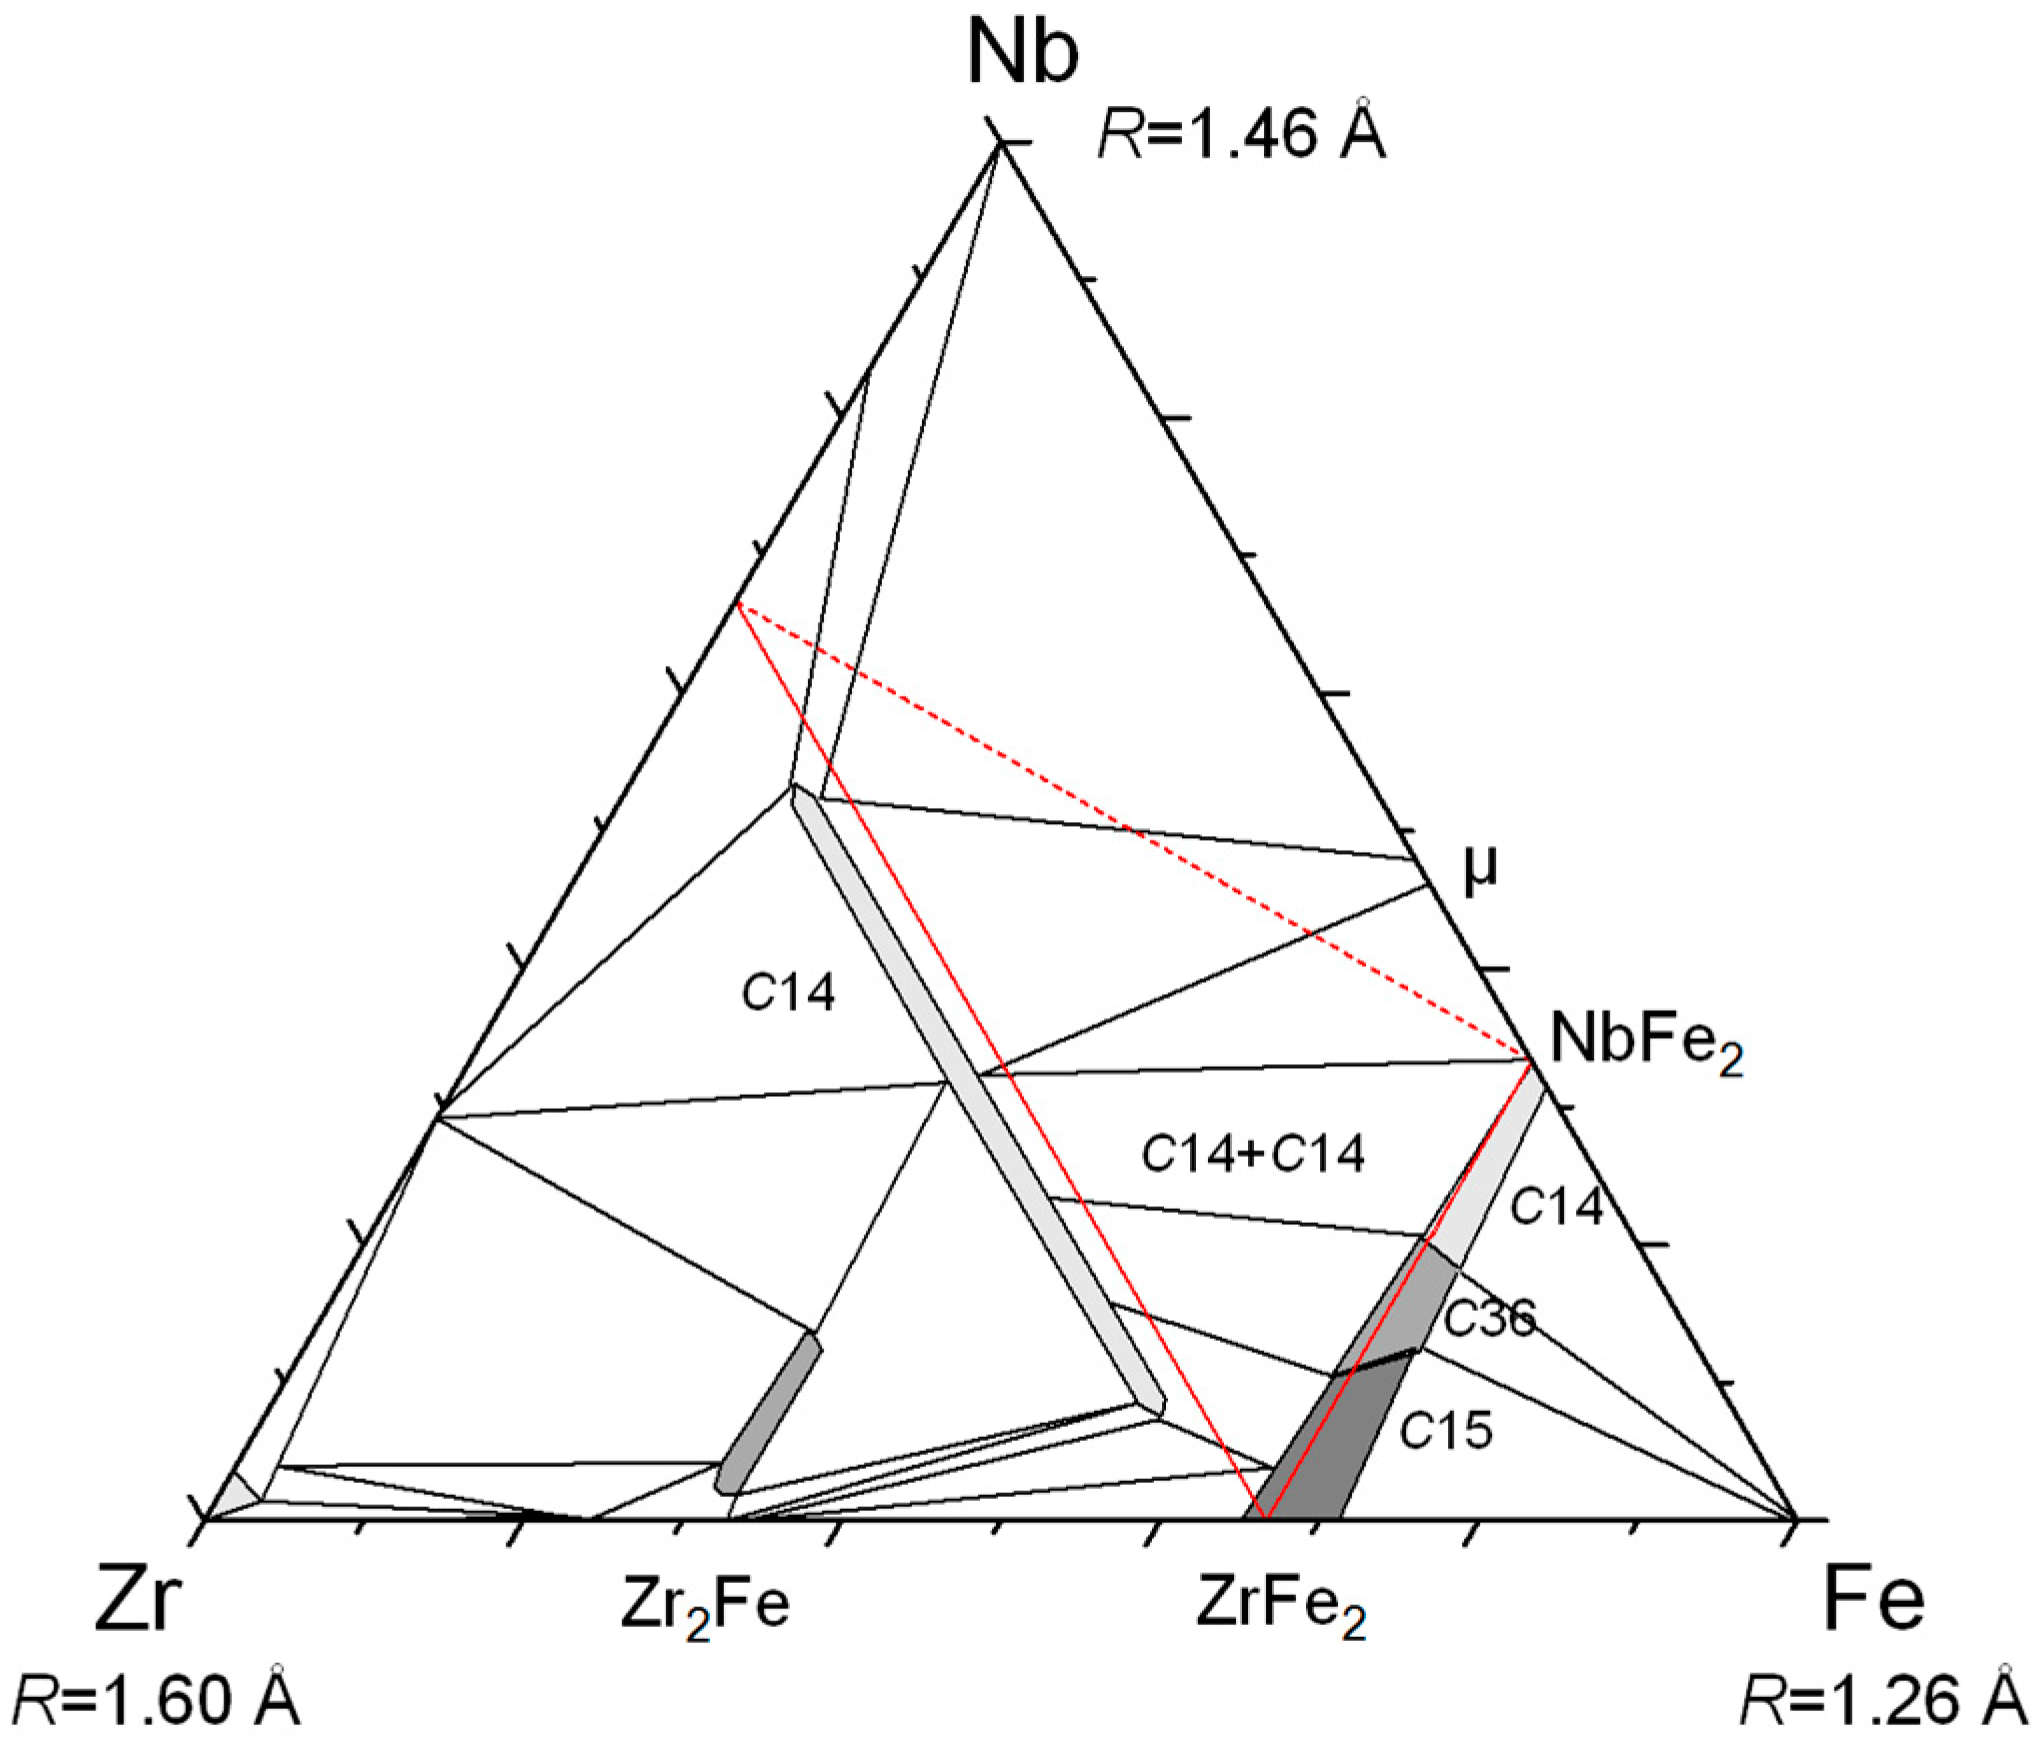
This type of system will be called irregular for the following reasons. Though rather unusual, this phenomenon may happen in real systems. As far as we know, it has never been described in detail in previous literature. The present paper reviews the systems in which this phenomenon has been demonstrated though not yet analyzed and we tried to derive some conclusions about the occurrence of this phenomenon. To avoid confusion, all the systems will be named and the phase diagrams will be drawn respecting the order A–B–C with RA > RB > RC. Results from the literature are described but new results obtained especially on the systems Zr–Nb–Fe and Re–Cr–Co are also presented.
Figure 2. Schematized isothermal section of a system ABC in which the compound ACx has a tendency to be substituted on both sites by the B atom, forming stable or metastable BCx and ABx compounds.
Applsci 05 01570 g002

2. Experimental Techniques and Methodology

Three techniques are now described that can be combined to study the phenomenon described in the present paper (for more details see [2]).
First, the study of the isothermal sections of phase diagrams is essential in order to assess the shape of the homogeneity domain. They can be collected from the literature or, when needed, one’s own determination can be made. Alloys can be synthesized by arc-melting of the pure elements followed by a convenient annealing at the required temperature and quenching. The characterization of the nature of the present phases is done by X-ray diffraction, and the composition of each phase is determined by electron probe micro-analysis (EPMA). In the present work, Re–Cr–Co alloys were obtained by arc melting of the pure elements (pellet obtained from the powders of Re and Cr, Alfa Aesar, 99.99%, and Co, Aldrich, 99.99%) followed by an annealing at 1150 °C in evacuated sealed silica tubes for six weeks. Due to difficulties in reducing the inhomogeneities related to the solidification in the Re-richer sample at this temperature, this sample was submitted to a first annealing treatment at 1500 °C under argon for 8 h in an induction furnace before the annealing at 1150 °C. The EPMA measurement was carried with a Cameca SX 100 apparatus using Kα lines for Cr and Co and Lα line for Re.
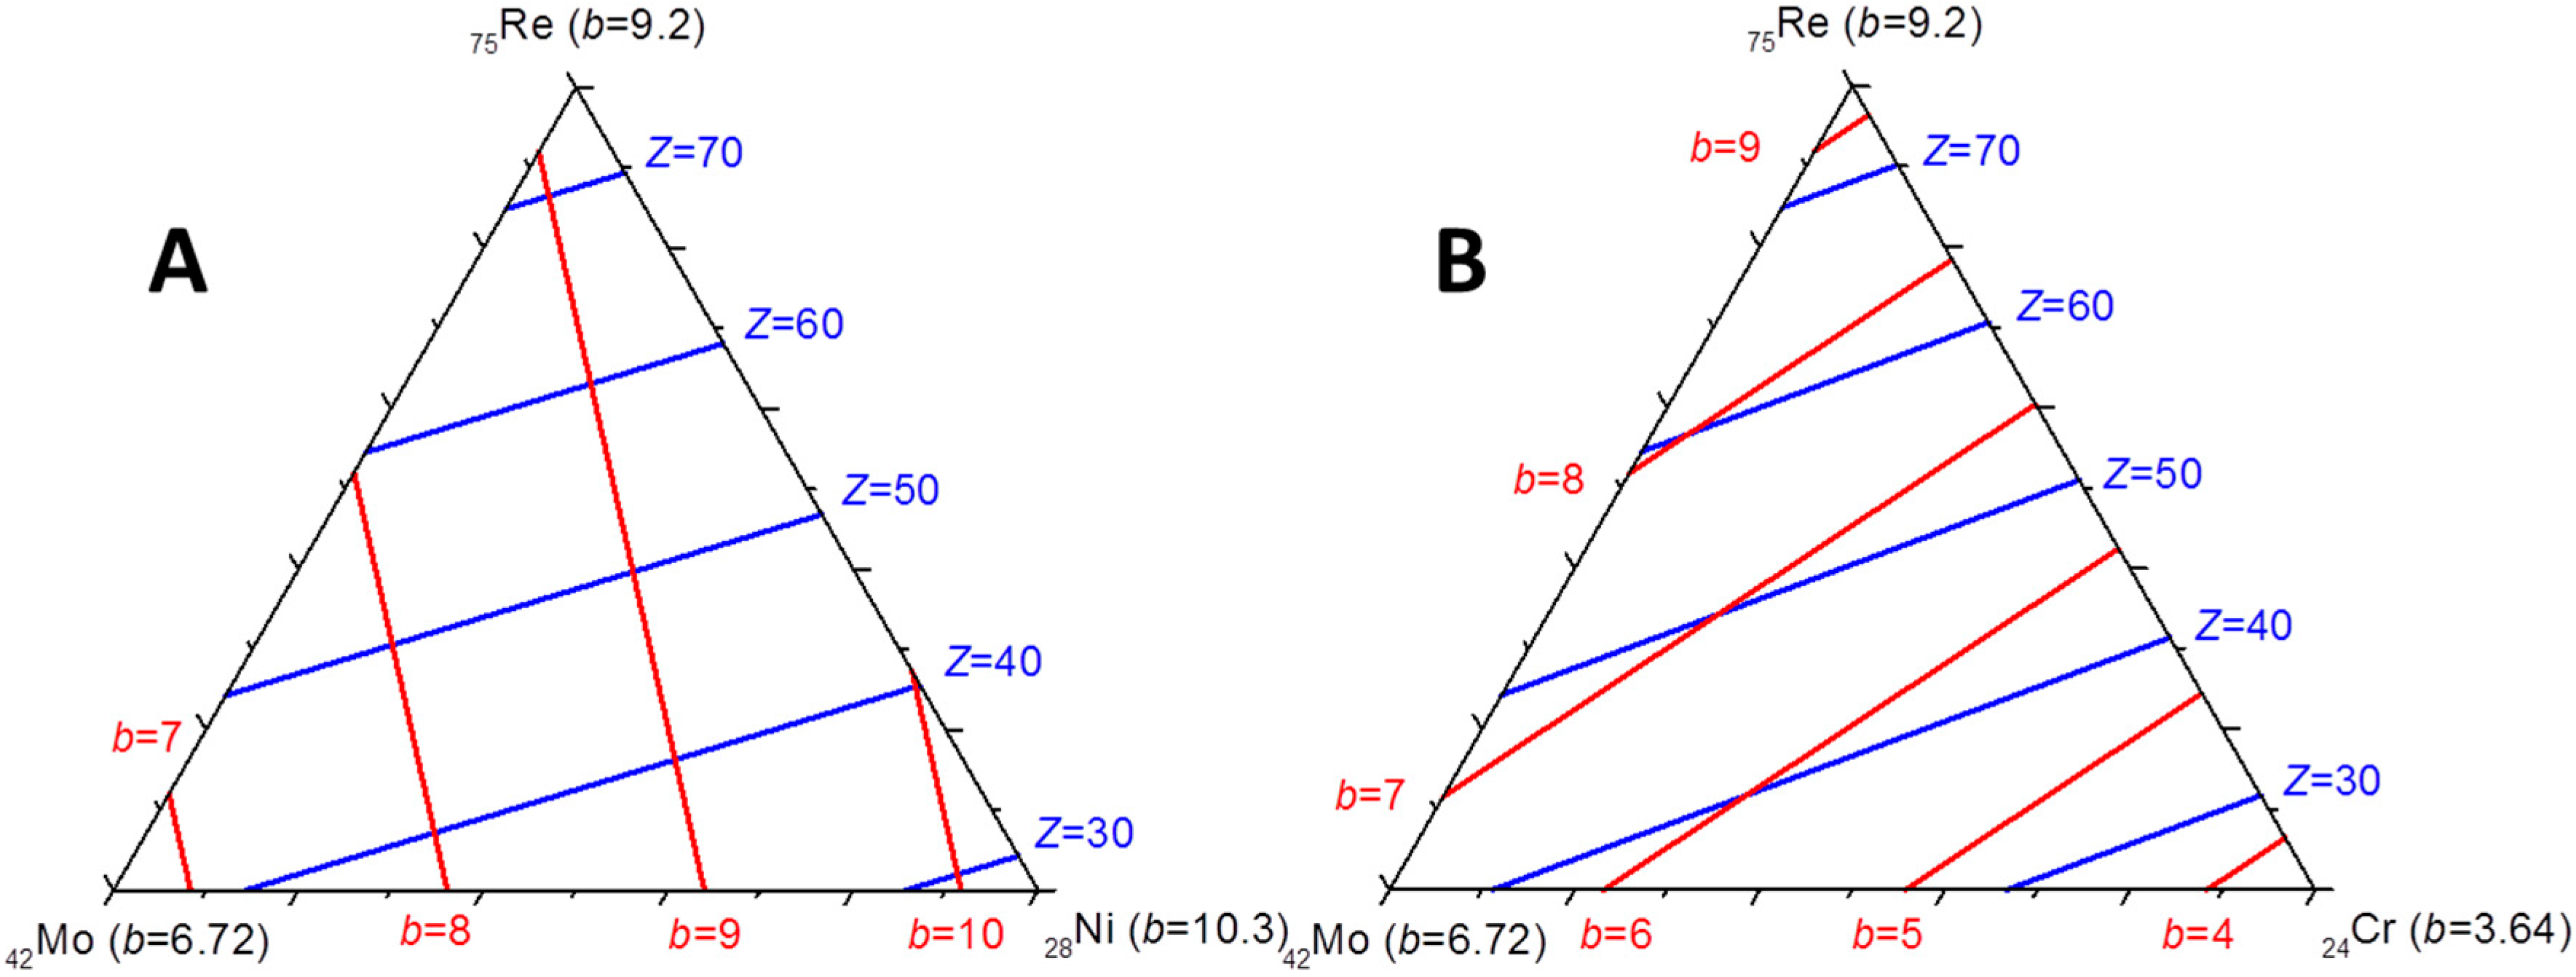
In the present study, devoted to site reversal, it is obviously of primary importance to be able to experimentally obtain the site occupancies of the three atoms on the different sites of the crystal structure as a function of composition. X-ray or neutron diffraction alone cannot be used to solve this type of problem since, from one diffraction dataset, one can obtain only one occupancy parameter per site to match the average scattering density. If one has to obtain, on each site, the two site occupancies necessary to define the structure when three elements are present together at the same position, one has to use two diffraction datasets in which the diffraction contrast is different. Ternary site occupancies can therefore be obtained in many cases by combined Rietveld refinement of neutron (ND) and X-ray (XRD) diffraction data. This is illustrated in 
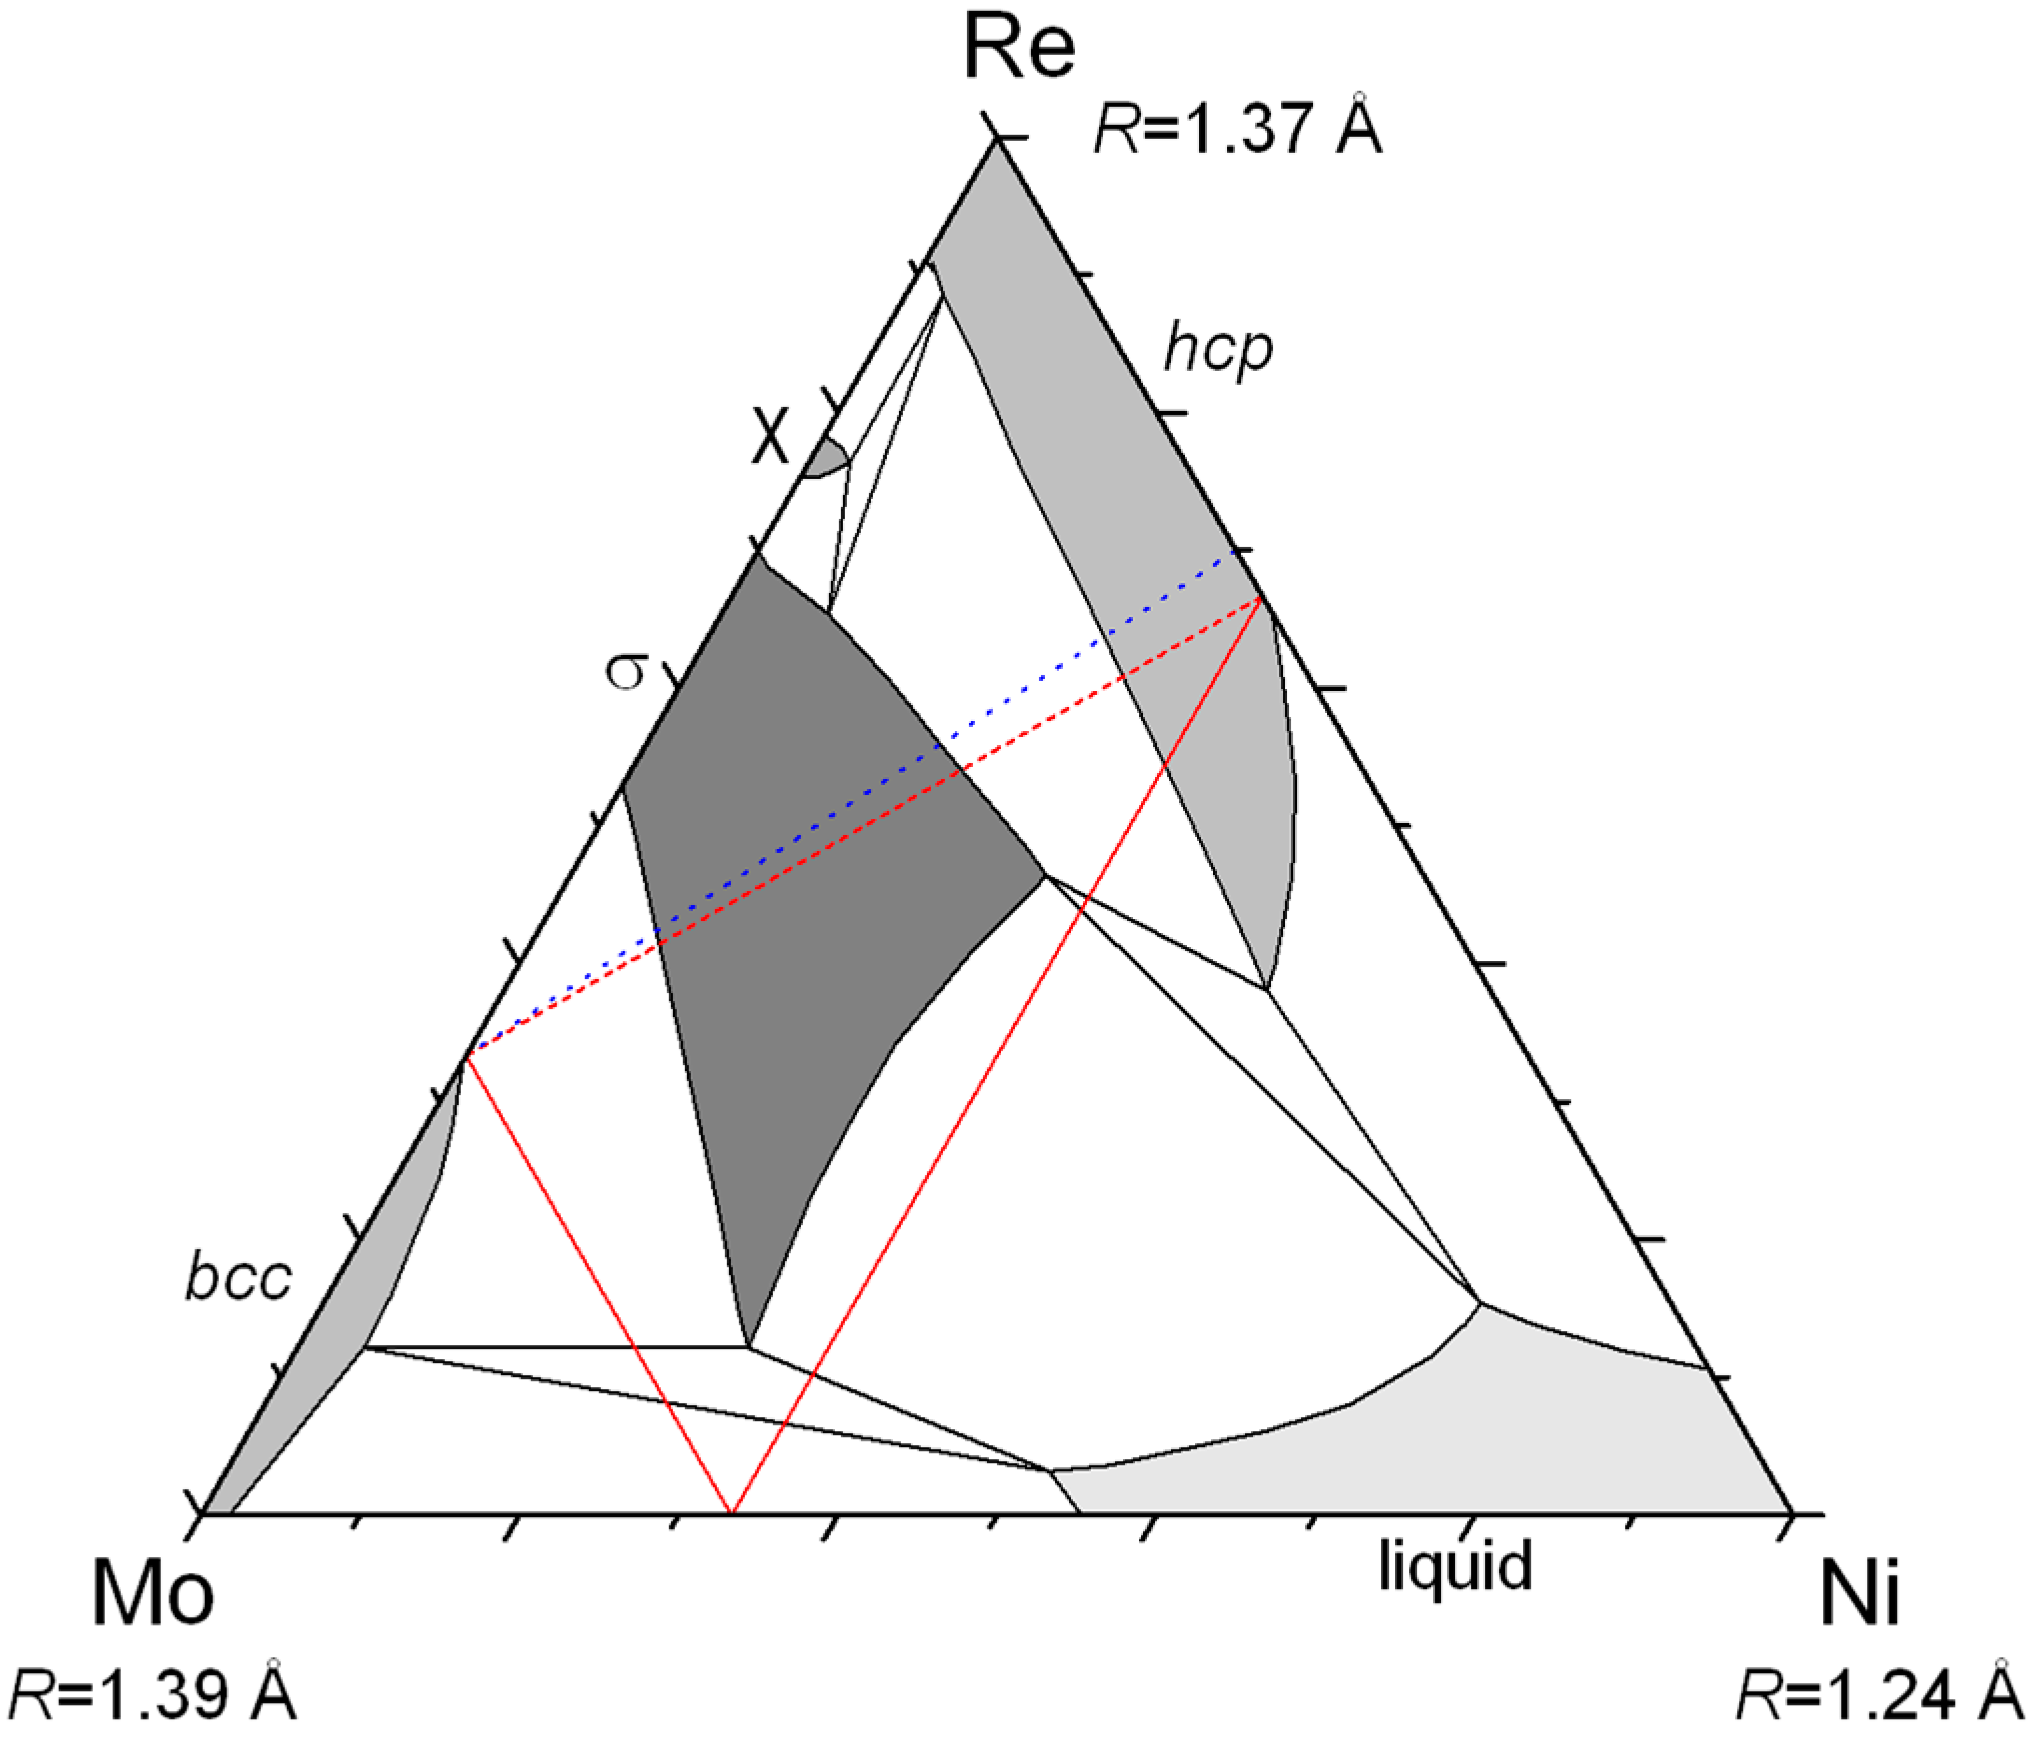
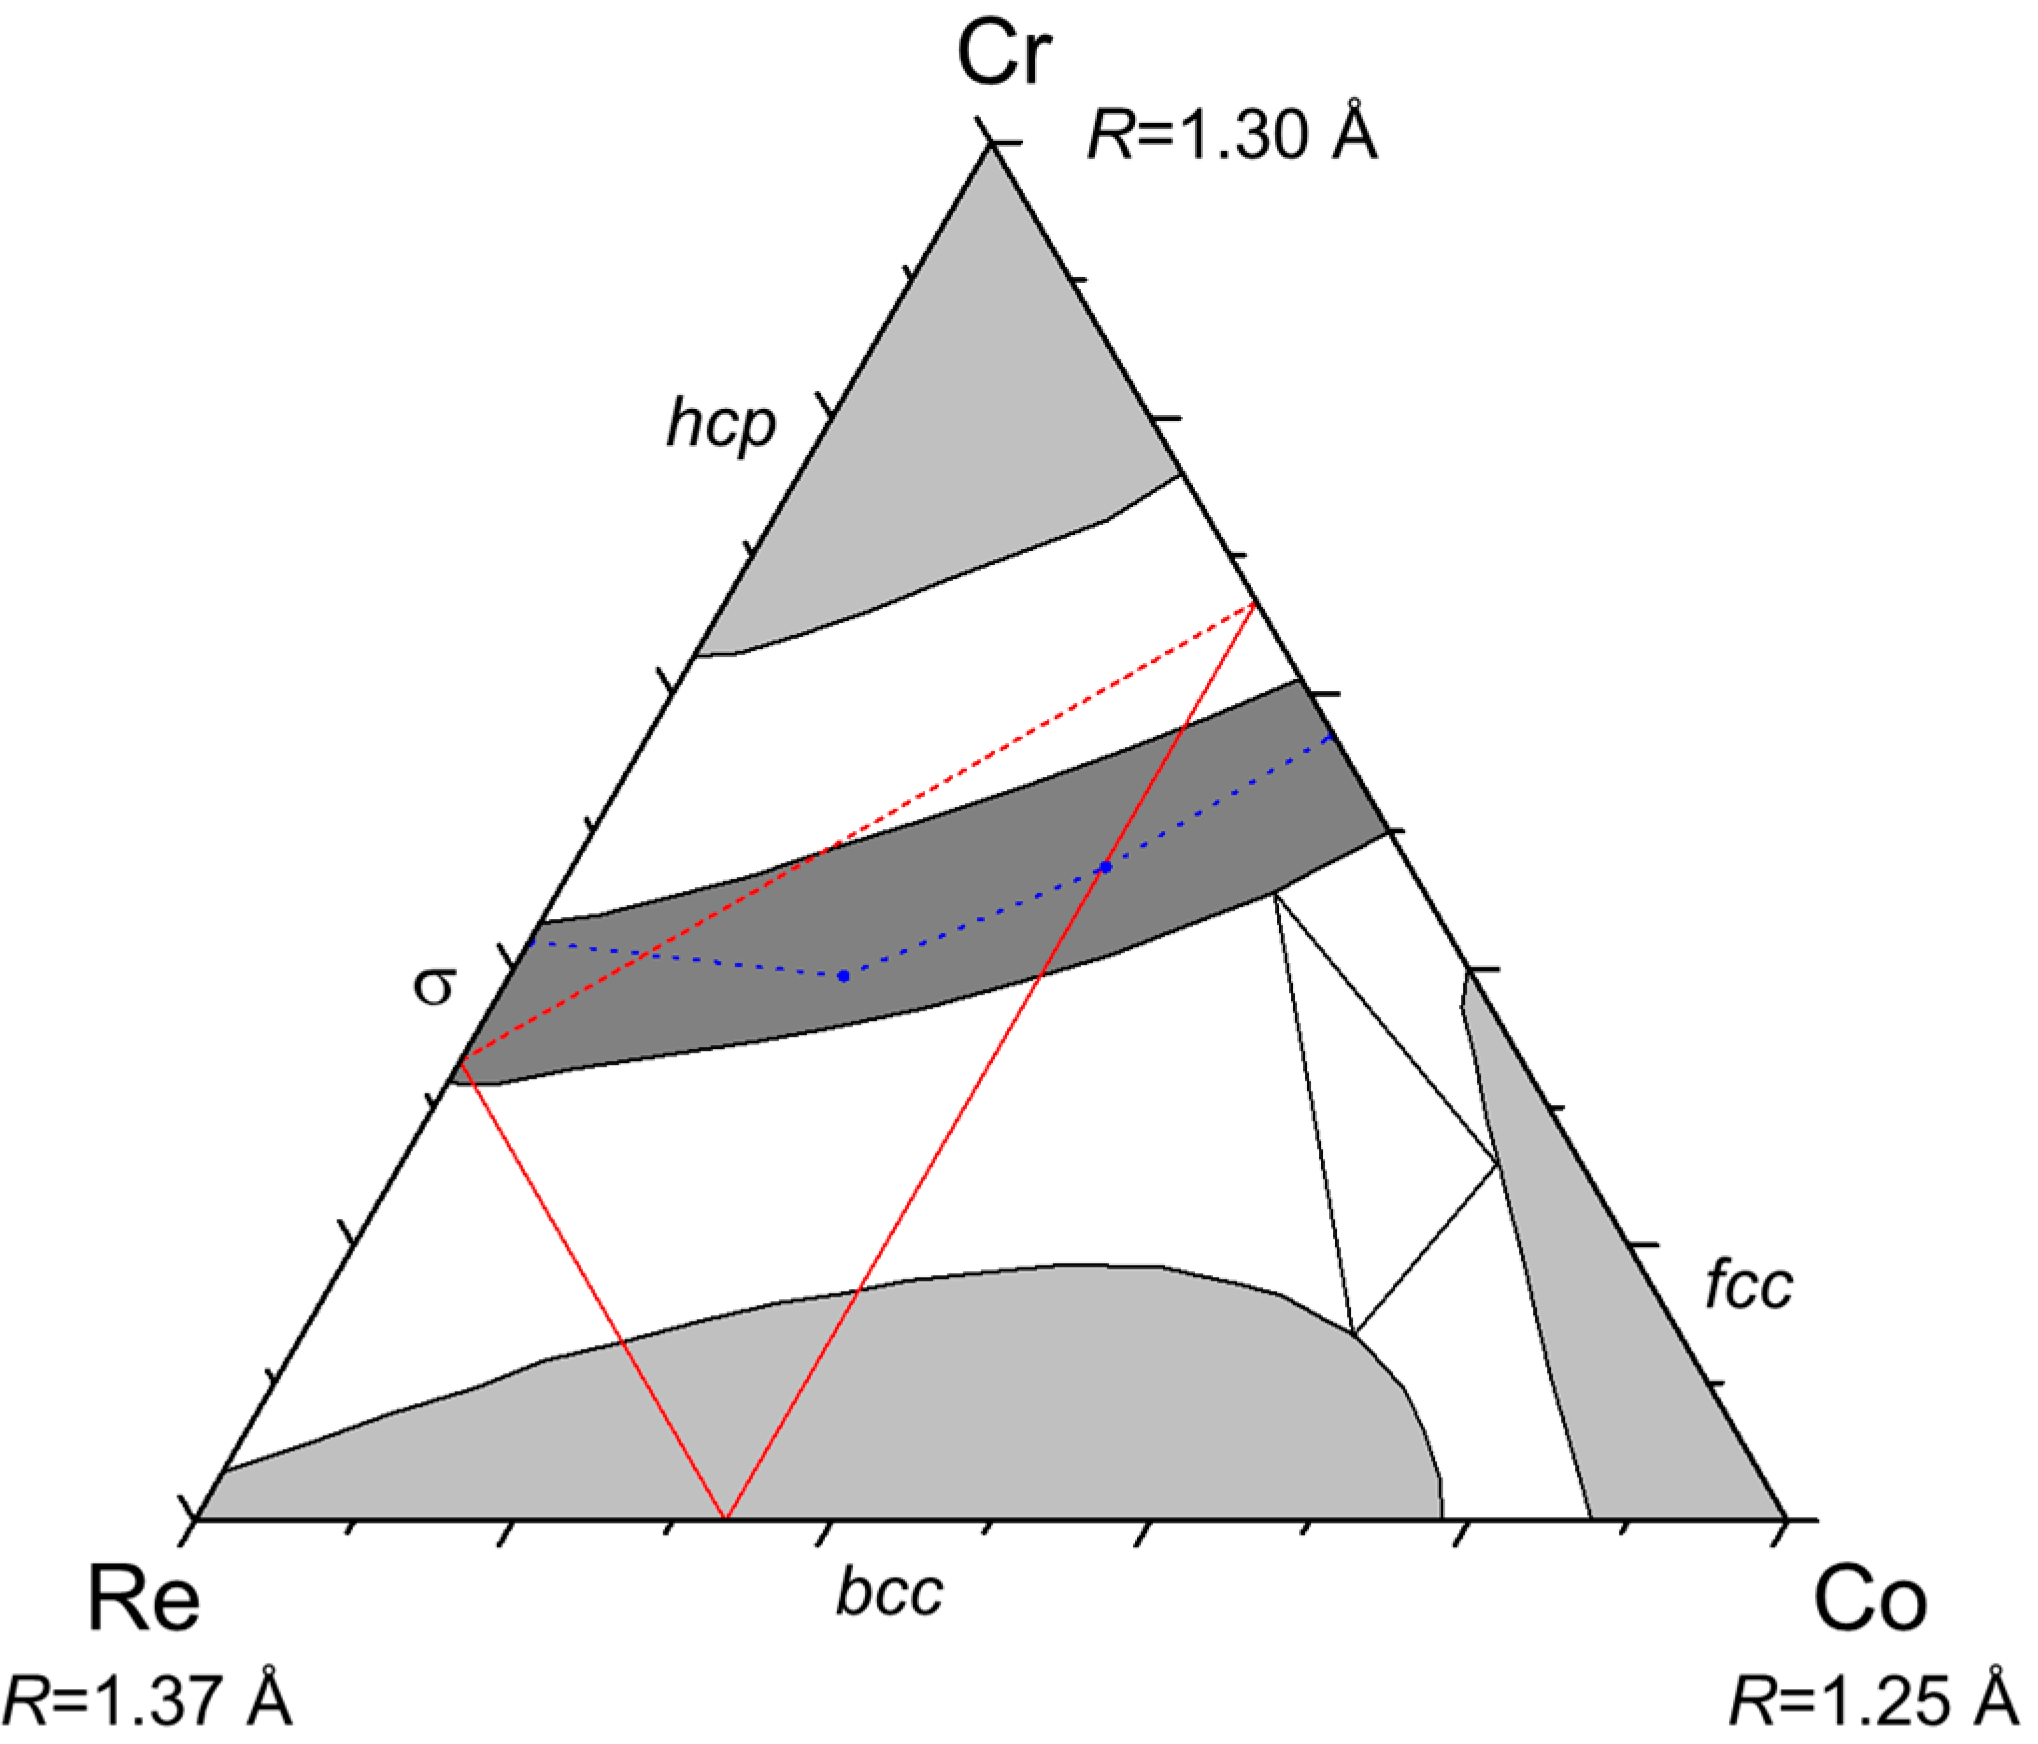
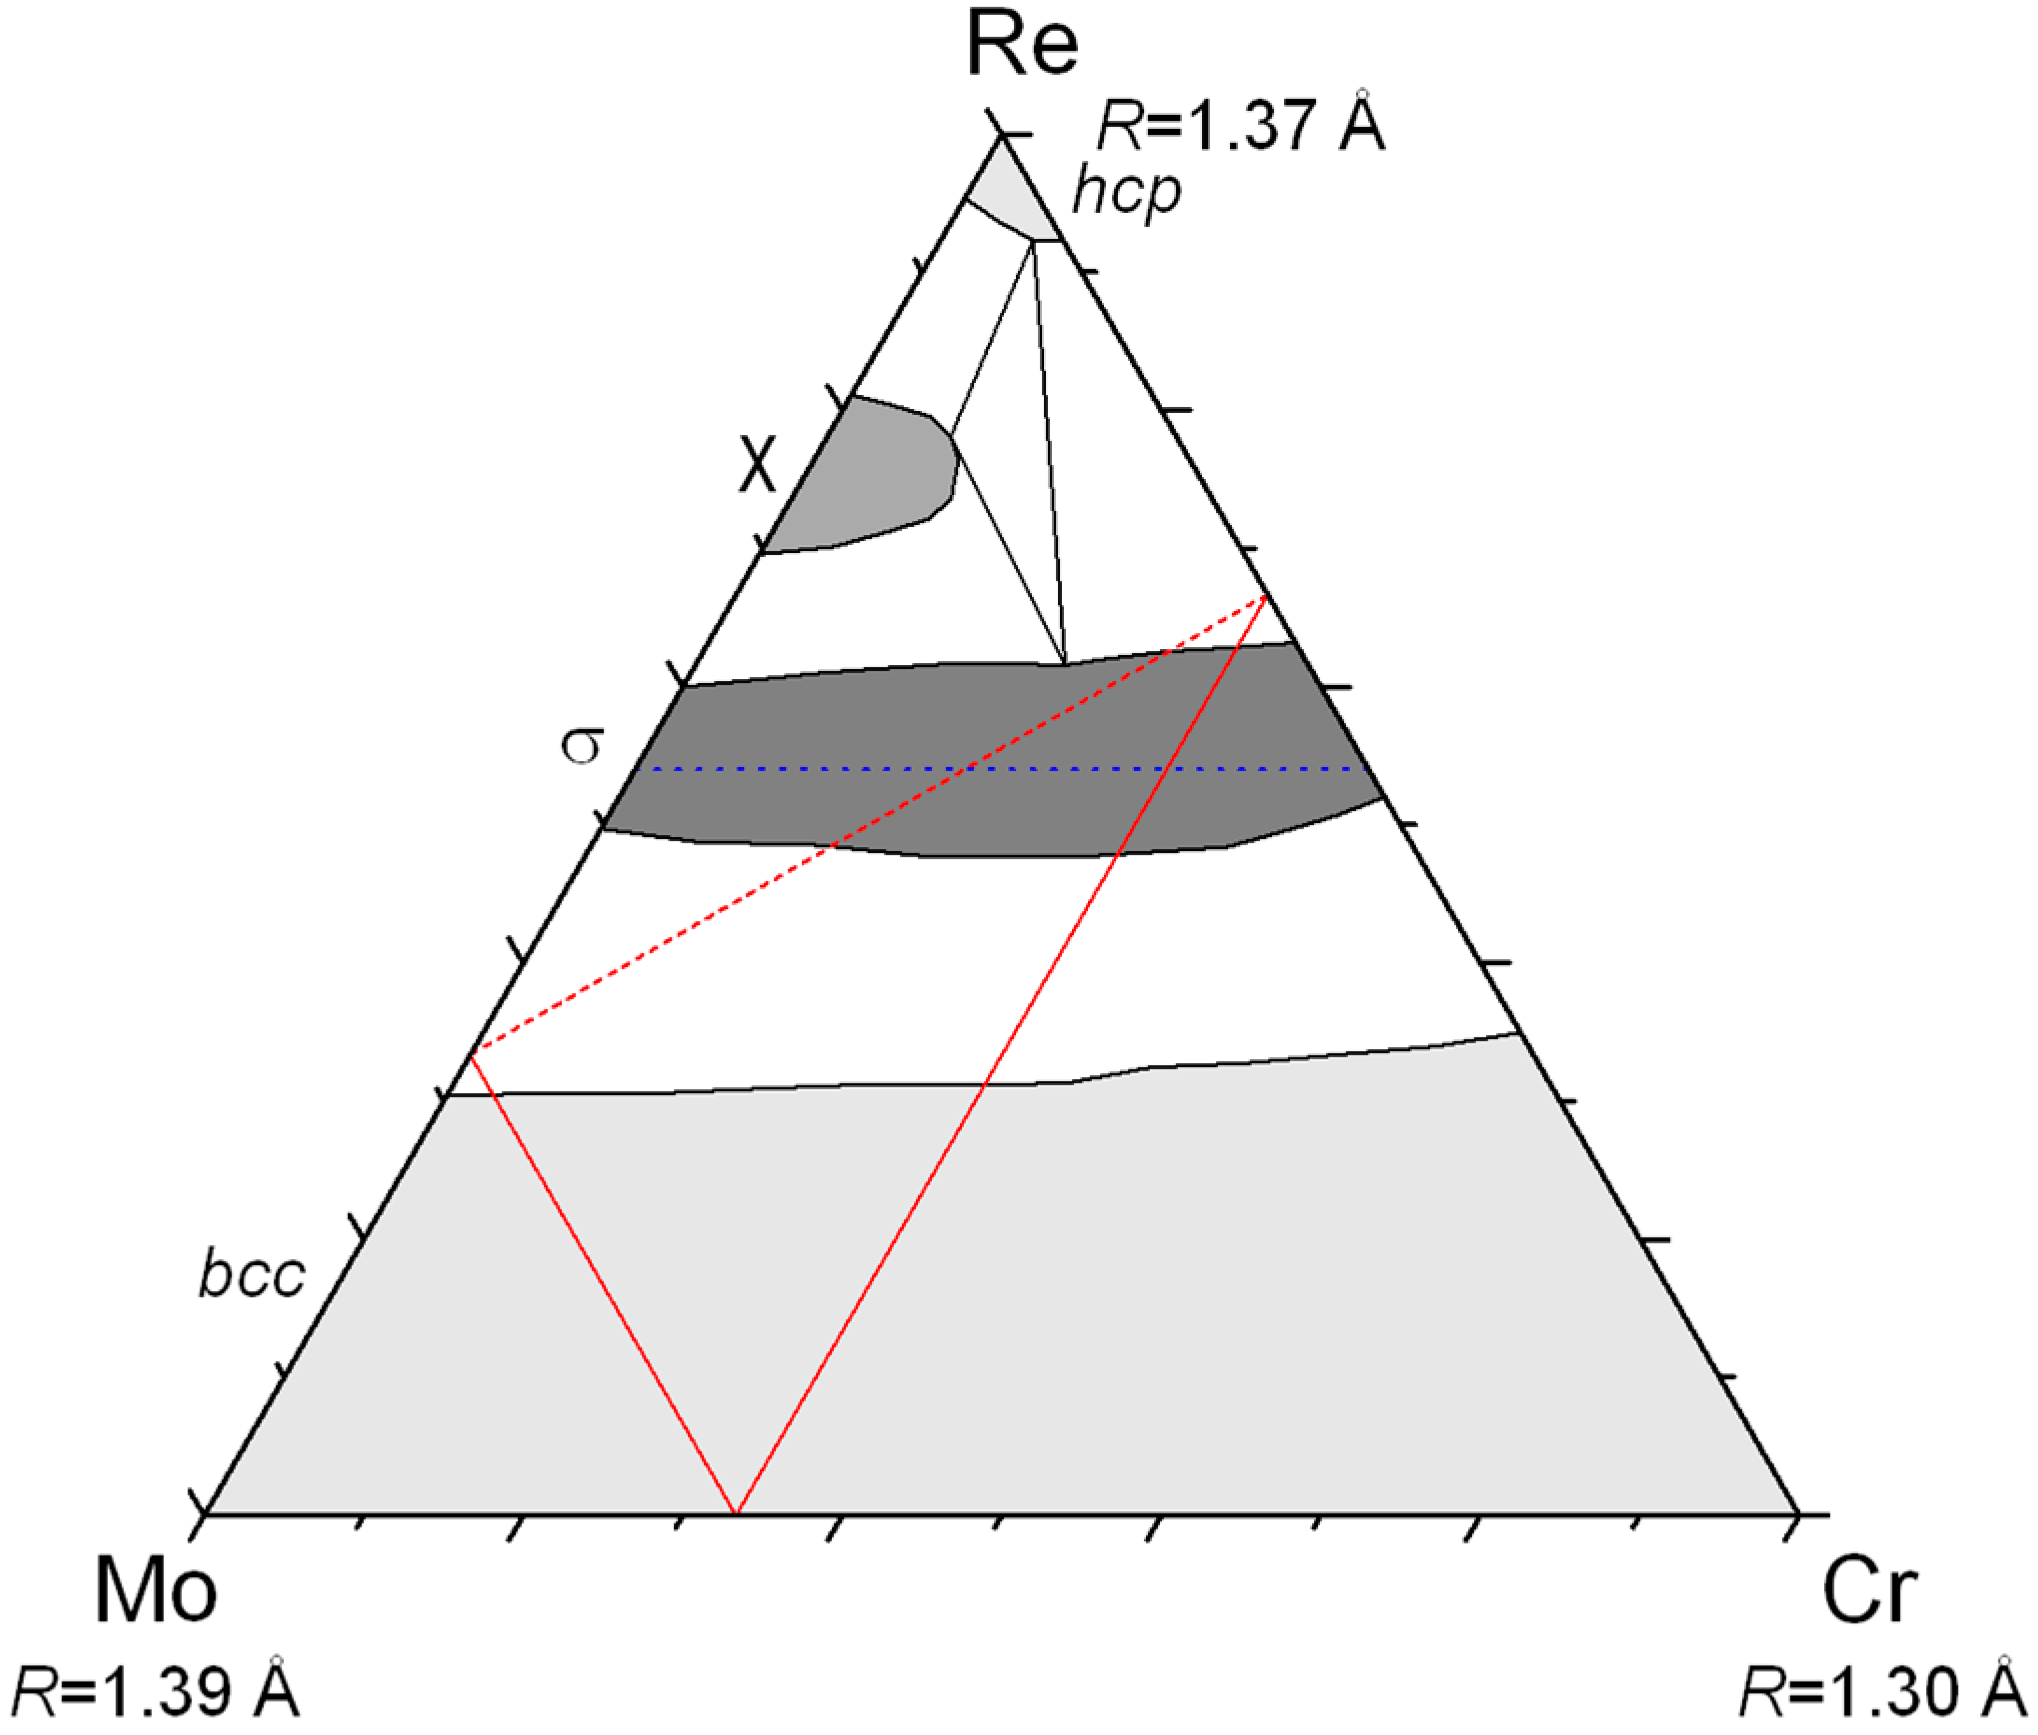
Figure 3 in the case of the Mo–Re–Ni system. The red lines show the locus of compositions giving the same neutron scattering density at a given site. All the site compositions on the line would give the same agreement with the diffraction data in a structure refinement if the neutron diffraction only was used. The same lines can be drawn for X-ray and it is evident that only one composition can result in a good refinement of both XRD and ND data. One may appraise how accurately the exact site composition can be determined in this particular system by the fact that the lines cross orthogonally. Note that this is not always the case and the accuracy depends on the relative values of the Fermi lengths and atomic numbers of the three present elements. In Figure 3, the example of the Mo–Re–Cr system is also presented for which the lines are almost parallel and the determination of ternary site occupancies would be much less accurate.
Figure 3. Diagrams showing as parallel lines the compositions of a site occupied by the three atoms Mo, Re, and Ni (A) or Cr (B), giving the same diffraction scattering density with X-rays (in blue; it is assumed that the scattering is proportional to the average Z) and neutrons (red).
Applsci 05 01570 g003
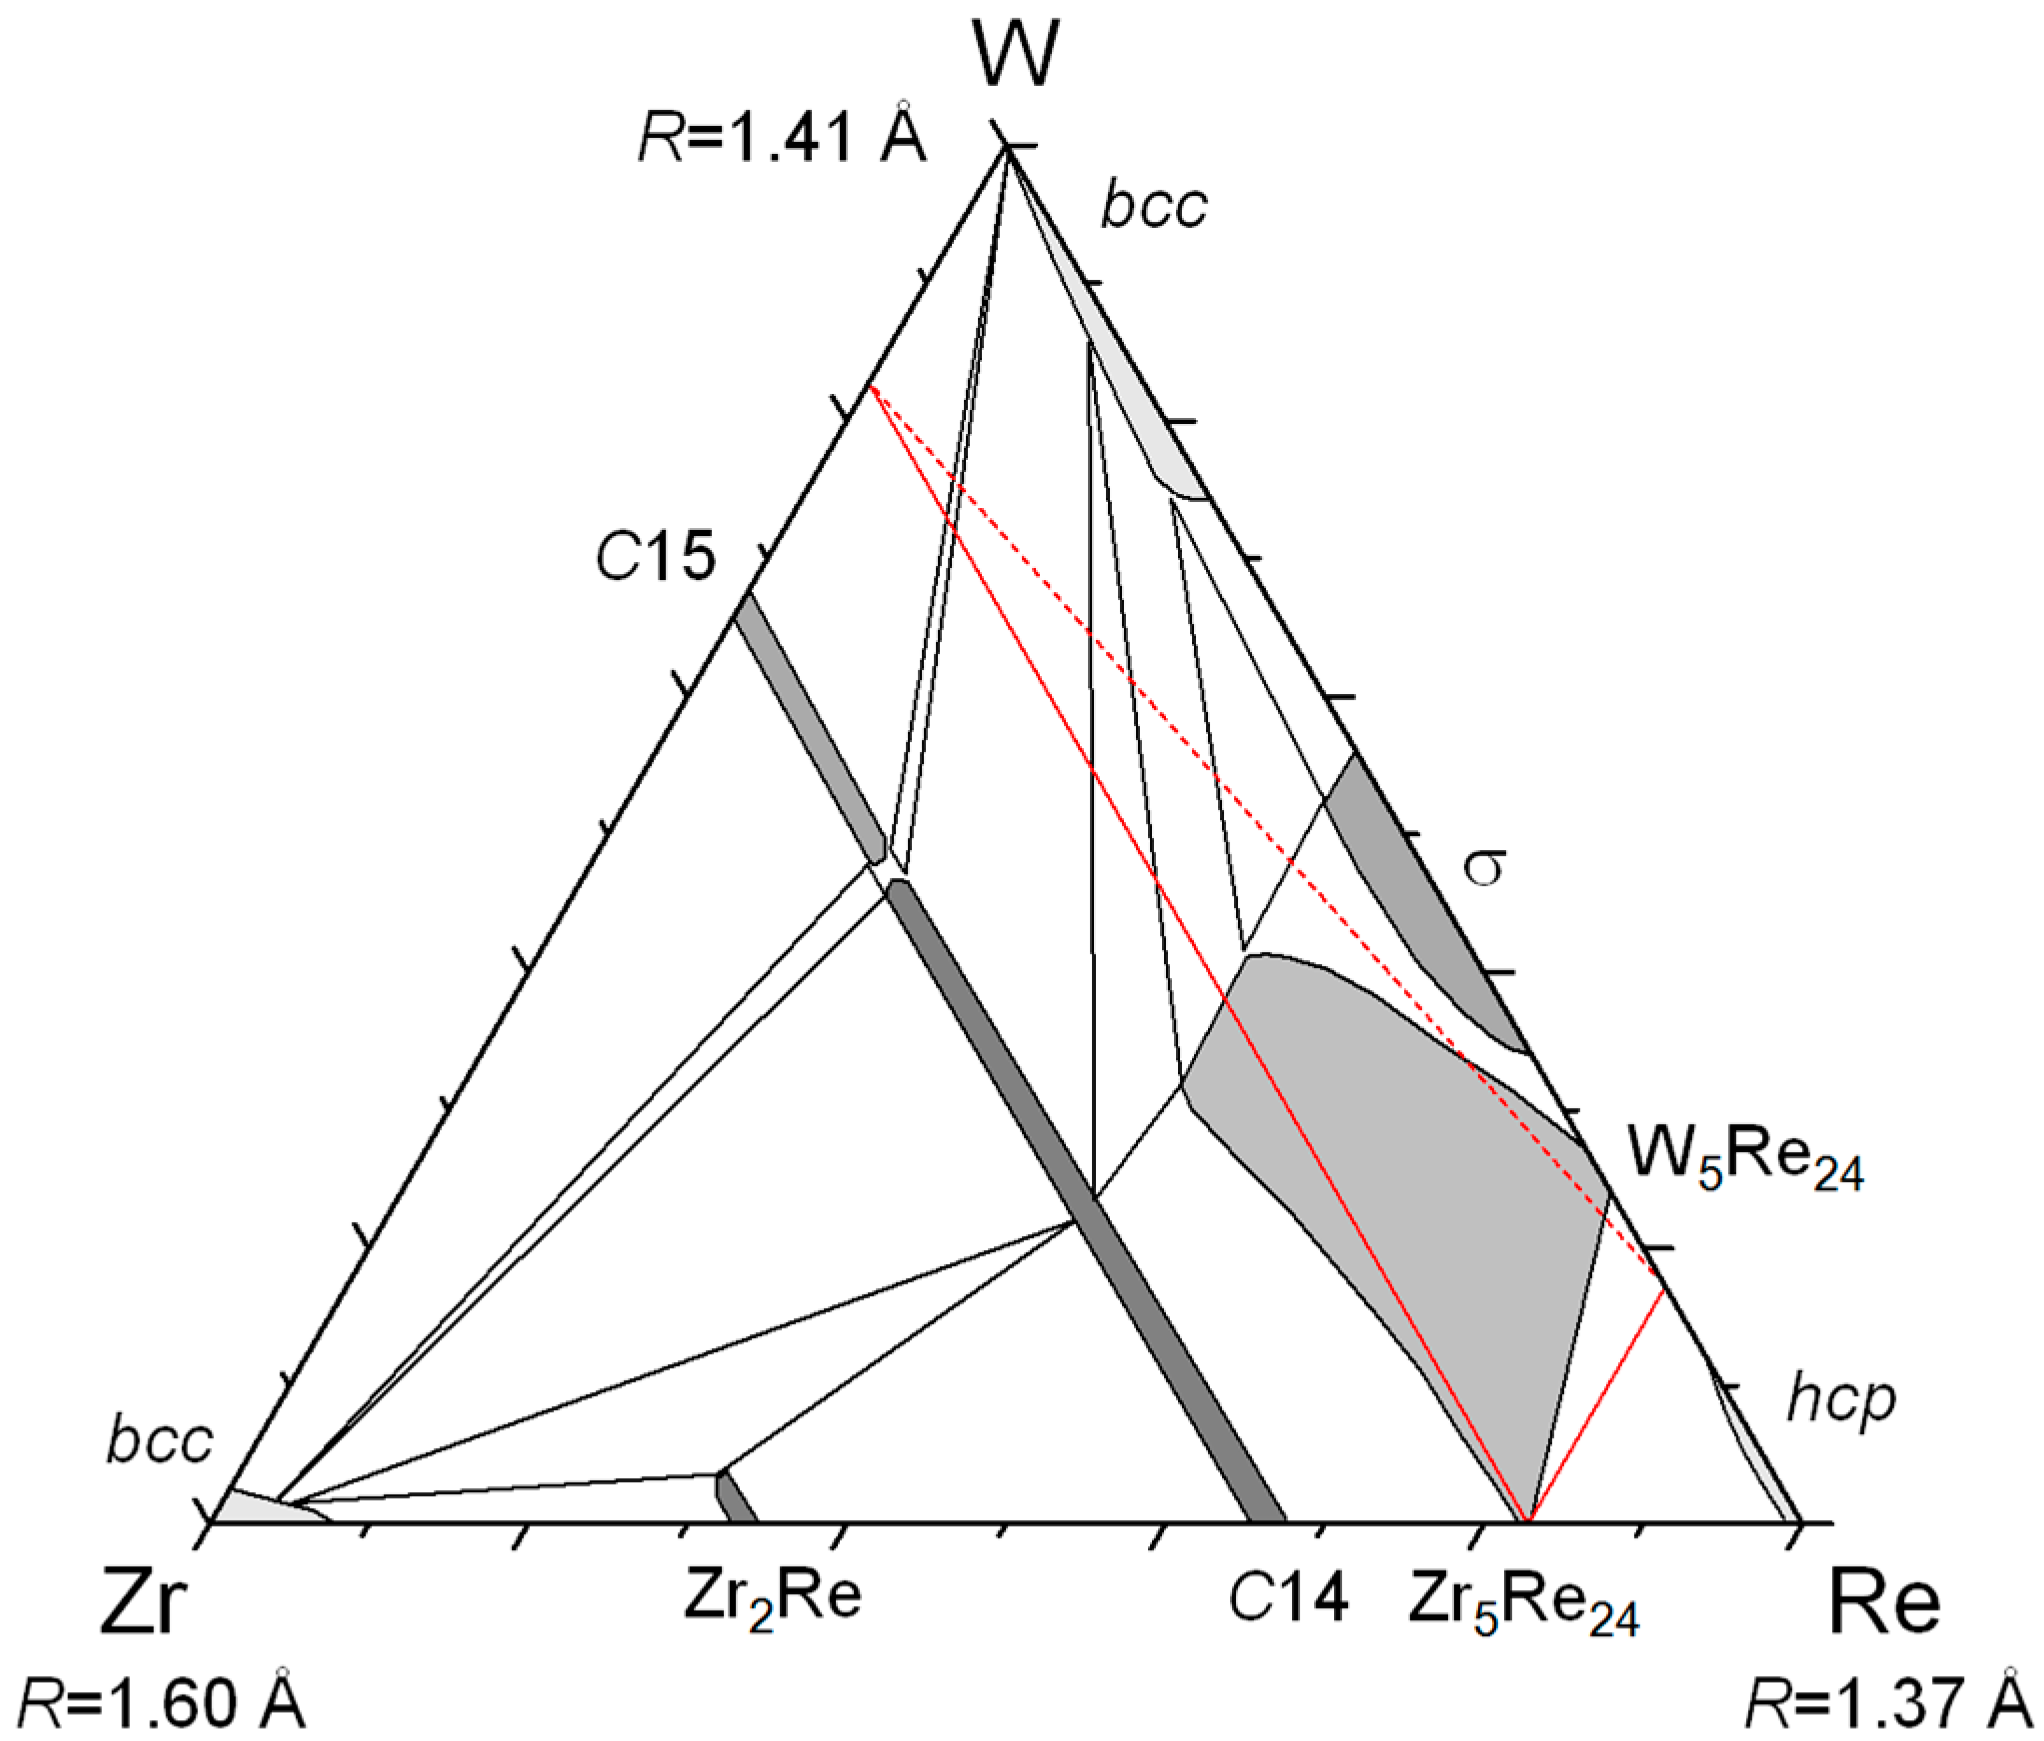
This technique was used in the case of Zr–W–Re [3], Mo–Re–Ni [4], and Re–Cr–Co systems (this work) in order to obtain the ternary site occupancies for the χ and the σ phases. In each case the neutron diffraction measurements were performed at Laboratoire Léon Brillouin (common laboratory CEA-CNRS) in Saclay, France using the instrument 3T2. The powder sample (typically 6–8 g, <63 μm) was placed in a vanadium cylinder (diameter 6 mm) and the measurement was performed at room temperature with Debye-Scherrer geometry in the presence of five detectors. For each pattern, data were recorded in the angular range 5° ≤ 2θ ≤ 121° with a step size of 0.05° using neutrons of wavelength 1.2253 Å. The X-ray measurements were done on a Bruker D8 Advance apparatus working in the Bragg-Brentano geometry in the θ–θ mode with Cu Kα radiation and a graphite monochromator in the diffracted beam. The usual conditions for the measurements are 5–120° (2θ), step 0.04°, time per step 20–60 s.
To determine site occupancies, the combined Rietveld analysis of XRD and ND data was conducted using the FULLPROF program in the multipattern mode (joint refinement). For refinement, the background was either interpolated between the peaks or refined with a polynomial. The pseudo-Voigt function was used to define the peak shape in both XRD and ND patterns. Because Re and Co present a non-negligible absorption coefficient for neutrons, an absorption correction was also applied by calculating the values of the absorption coefficient (μr) for each composition. To calculate the absorption coefficient, the density of non-compacted powders was estimated to be ~40% of the density of the material. Also, micro-absorption for the flat-plate geometry of X-ray measurements was taken into account in particular in order to be able to describe both XRD and ND data with a unique structural model including unique displacement parameters. The site occupancies are refined using a composition constraint and maintaining full occupancy at each site. The way to handle such complex relations between the parameters is described in [5].
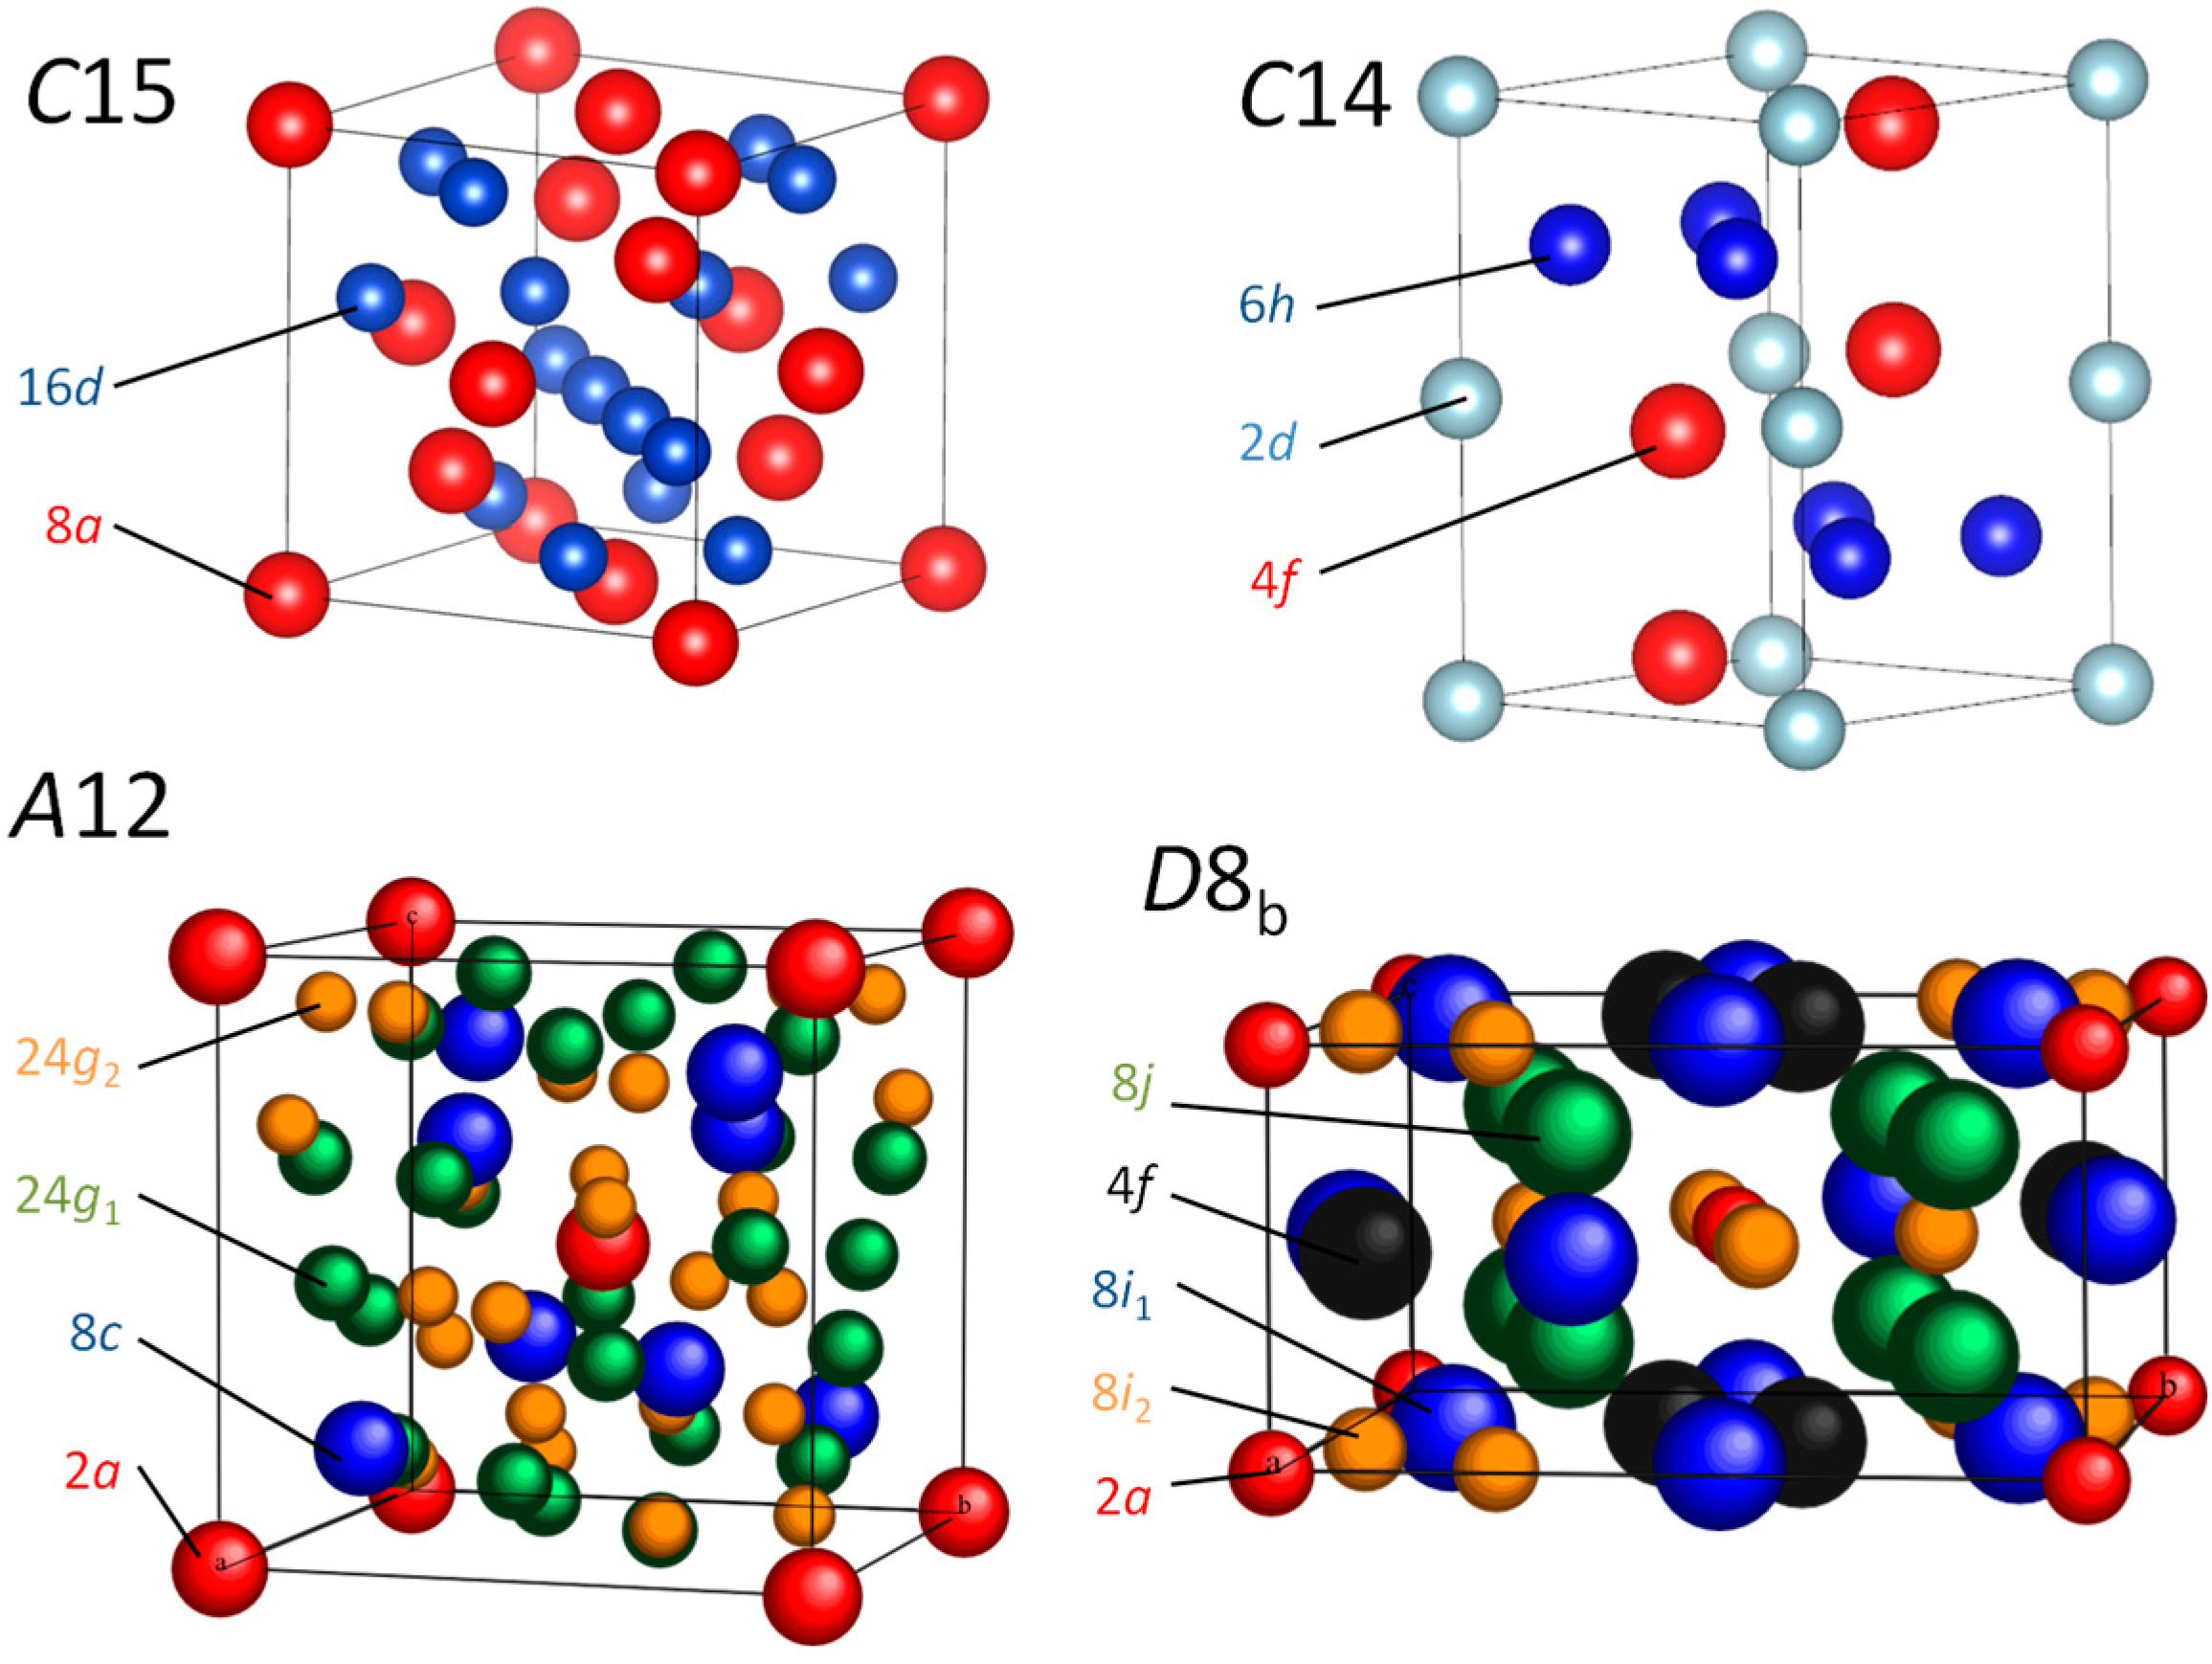
First-principles calculation of stable and metastable intermetallic phases has become routine. However, systematic calculations in ternary systems may become rather complex. For a crystal structure with n independent sites in the unit cell, the ordered distribution of three atoms among each site generates 3n configurations. If the calculation is feasible for intermetallic compounds with two or three sites like C15 and C14, it gets much more complex for phases like χ and σ with four and five sites generating 34 = 81 and 35 = 243 ordered configurations. For this reason, the ZenGen code was developed, allowing us to perform systematic calculations of all the configurations generated by the distribution of the three elements among the sublattices [6]. Above six sites, the computation time may become prohibitive due to the increase in both the number of configurations and the complexity of the structure; simplifications should be adopted, such as merging different crystallographic sites.
The presented calculations are based on the density functional theory (DFT) and were carried out using the VASP package [7,8]. The generalized gradient approximation (GGA) was used with the Perdew-Burke-Ernzerhof (PBE) exchange and correlation energy functional [9,10]. An energy cutoff of 400 eV was used for the plane wave basis set, and a dense grid of k-points was used with the sampling generated by the Monkhorst-Pack procedure [11]. For each ordered configuration, both the internal atomic coordinates and the lattice parameters were fully relaxed using successive steps, keeping the original cell structure. The conditions for the calculations (method, accuracy) have been detailed previously [3,4]. All the calculations have been handled using the ZenGen code [6] (generation of input files, job monitoring, extraction of results).
This procedure allows the calculation of the heat of formation of every compound generated by assigning each element to each crystal site, and gives access to the stability of the phase. At a finite temperature, the Gibbs energy is treated in the framework of the Calphad approach using the Compound Energy Formalism [12] in the Bragg-Williams-Gorsky approximation, i.e., considering only the configurational entropy and neglecting the entropy from atomic correlations and excess interaction parameters within the same sublattice. The procedure is described in [13]. Not only can the stability be obtained from the calculations in this approach but also the site occupancies as a function of composition and temperature. All the thermodynamic calculations are done with Thermo-Calc software.
New calculations have been carried out in the present paper, corresponding to the study of the Laves phases in Zr–Nb–Fe system and the σ phase in Re–Cr–Co systems.

3. Results and Discussion

3.1. Phase Description

Before describing the individual systems, we present the crystal structures that will be discussed in the following. Figure 4 shows the drawing of the different structures and Table 1 summarizes their main features including different names, site occupied, and coordination. All the phases pertain to the group of topologically close-packed structures (also known as Frank–Kasper phases) characterized by a high compacity and the presence of only certain coordination polyhedra. The Laves phases are a subgroup of these phases including the C14, C15, and C36 structures.
Table 1. List of the phases discussed in the following sections, with major crystallographic information.
StrukturberichtPhase NameStructure TypePearson SymbolSpace GroupnInequivalent SitesCN
C14Laves phaseMgZn2hP12P63/mmc32a12
4f16
6h12
C15Laves phaseMgCu2cF24Fd 3 ¯ m28a16
16d12
C36Laves phaseMgNi2hP24P63/mmc54e16
4f16
4f12
6g12
6h12
A12χ phaseαMncI58I 4 ¯ 3m42a16
8c16
24g13
24g12
D8bσ phaseCrFetP30P42/mnm52a12
4f15
8i14
8i12
8j14

3.2. Zr–Nb–Fe (Laves Phases)

The first example we will consider is the Zr–Nb–Fe system. The phase diagram of this system is shown in Figure 5, after the work of Granovsky et al. [14] and the compilation in [15]. The phase of interest is the Laves phase, which exists in its three polymorphic structures, C15, C14, and C36. The transformation of one structure into another along the section joining ZrFe2 and NbFe2 when Nb substitutes Zr is quite common and this type of transformation occurs in many different systems. What is less common, and more interesting, is the ability that Nb has to also substitute for the Fe in ZrFe2, giving rise to an extended C14 homogeneity range Zr(Fe1−xNbx)2 extending towards a metastable ZrNb2. One can therefore appraise the double extension of the Laves phases from ZrFe2 parallel to both the Nb–Fe and Zr–Nb axes, rather similar to what has been drawn in Figure 2. It is already strange to have the Zr2Fe homogeneity domain in one direction (parallel to the Zr–Nb axis) and the C14 domain in another direction (parallel to the Fe–Nb axis). Even stranger is the fact that this is now the same phase extending in two different directions. Noteworthy is the fact that this phenomenon also causes a miscibility gap inside the intermetallic phase with an observed equilibrium between two C14 structures (two phase domain marked C14 + C14), instead of a complete solubility domain.
Figure 4. Structure drawing of the phases discussed in the following.
Applsci 05 01570 g004
Figure 5. Isothermal section at 800 °C of the Zr–Nb–Fe system (redrawn from [14,15]). The red triangle shows the three ordered stable or metastable compositions of the Laves phase: ZrNb2, ZrFe2, and NbFe2, as in Figure 2 (solid lines: normal substitution, dashed line: site reversal).
Applsci 05 01570 g005
In order to better understand this phenomenon, DFT calculations have been carried out in this system. Figure 6 presents the ground state at 0 K of the C14 structure in the form of a ternary phase diagram. The figure clearly evidences the V-shape of the C14 phase extending from ZrFe2 to both ZrNb2 and NbFe2 compositions. One may also note the stability of the configuration corresponding to the composition Zr(Fe0.25Nb0.75)2 and the miscibility gap in the C14 phase between the two arms of the V. These two features reproduce what is observed in the experimental determination.

3.3. The Four Systems {Zr,Hf}–{Mo,W}–Re (χ Phase)

The four iso-electronic systems Zr–Mo–Re [16], Zr–W–Re [16], Hf–Mo–Re [17], and Hf–W–Re [18] share a common feature. They all present the Frank–Kasper χ phase not only extending from one to the other binary systems, but also deep inside the ternary system along a completely different direction toward the third binary system.
Figure 6. Ground state at 0 K of the C14 phase in the Zr–Nb–Fe system, obtained by DFT calculation (new results). Red lines represent an equilibrium tie-triangle, green lines are equilibrium tie-lines.
Applsci 05 01570 g006
From the isothermal section of the Zr–W–Re system [16] presented in Figure 7, it is important to note both the homogeneity domain extending from Zr5Re24 to the W5Re24 phase, therefore approximately parallel to the Zr–W axis, and the homogeneity domain of the Laves phase (in C14 and C15 structures) extending parallel to the other W–Re axis. This dual character of substitutional behavior (Zr by W and W by Re) is further demonstrated by the odd shape of the homogeneity domain of the χ phase that extends in both directions, i.e., has limiting compositions parallel to both the Zr–W and W–Re binary borders.
Figure 7. Isothermal section at 1350 °C of the Zr–W–Re system (redrawn from [16], Copyright 1970, Academy Science Ukraine). The red triangle shows the three ordered stable or metastable compositions of the χ phase, Zr5W24, Zr5Re24, and W5Re24, as in Figure 2 (solid lines: normal substitution, dashed line: site reversal).
Applsci 05 01570 g007
The four iso-electronic systems listed above show very similar features concerning the shape of the χ phase and only minor differences in their phase diagrams. Among these four systems, Zr–W–Re has been chosen for a deeper experimental study because it is more suited to the site occupancy determination by using combined XRD and ND (the contrast factors are more favorable). Our experimental and calculation results have been published in [3]. Their significance relative to our present study is developed below.
The χ phase has four inequivalent sites of multiplicity 2, 8, 24, and 24 with CN 16, 16, 13, and 12, respectively (for a detailed review on the crystal chemistry of this phase, see [19]). In binary systems, it tends to order at the composition A10B48 and A34B24. The homogeneity domain of this phase in this system has been explained by the stability of the ordered configurations Zr2Zr8Re24Re24, Zr2W8Re24Re24, W2W8Re24Re24, and Zr2Zr8W24Re24, and to the fact that W2W8Re24Re24 is close to stability. This indicates the ability of W to substitute in Zr5Re24 on both the Zr and Re sites. This is opposite to the behavior of the Laves phases, for which W substitutes only for Re. There are two reasons for this: the weak stability of both the C14 and C15 phases in the W–Re system, and the absence of ternary configurations able to stabilize the phase in the other direction in the ternary composition range (the C15 structure, having only two sites, does not generate ternary configurations, and C14 does not have configurations on the line joining ZrRe2 and WRe2).
Experimental site occupancies by joint Rietveld analysis of XRD and ND data have been compared to those obtained from the DFT calculations and are shown in [3]. The good agreement has confirmed the reliability of the DFT calculations to obtain this quantity. The W site reversal can therefore be studied from DFT data because the experimental measurements were not chosen to specifically study the reversal and because measurements obviously cannot extend, contrary to DFT calculations, to the metastable range of the phase. Site occupancies are plotted in Figure 8 between the compositions Zr5W24 and W5Re24. The section clearly shows the reversal of W atoms switching from low CN to high CN sites.
Figure 8. Calculated site occupancies at 1500 °C for the χ phase in the Zr–W–Re system along the composition line joining Zr5W24 and W5Re24 (dashed line in Figure 7).
Applsci 05 01570 g008

3.4. Cr–Mn–Si (σ Phase)

From now on, we will focus on the σ phase. This phase has five inequivalent sites of multiplicity 2, 4, 8, 8, and 8 and CN 12, 15, 14, 12, and 14, respectively (for a detailed review on the crystal chemistry of this phase, see [20]). In binary systems, it tends to order at the composition A2B. To start with, we can present an example taken from the literature: the Cr–Mn–Si system [21]. The phase diagram has been plotted in Figure 9. This system is interesting for different reasons. The σ phase is stable in the Cr–Mn system but very far from the ordered stoichiometric composition corresponding to the occupancy of the high CN by the larger atom (Cr) and the low CN by the smaller atoms (Mn): Cr2Mn. Secondly, from the study of the phase diagram, it appears that the σ is very close to stable in the binary Mn–Si system since its homogeneity domain stops only ~1 at. % from the binary border. Finally, the σ phase is not only extending between the Cr–Mn and Mn–Si systems, suggesting a possible replacement of Cr by Si atoms, but also points towards the third binary border of Cr–Si, parallel to the Cr–Mn binary with the same orientation as the homogeneity domain of A15 Cr3Si, suggesting a replacement of Mn by Cr atoms. In the absence of ternary site occupancy data, it is difficult to conclude about the site reversal and the stability of the phase in the ternary field. Given the atomic sizes and electronic properties, it is more probable that the intermediate atom is, in this case, Mn and that the reversal line would be going from the Cr–Mn to the Mn–Si system. As it corresponds to the stable homogeneity range of the phase, this would deserve an additional experimental study of site occupancies. As we will see, this type of data has been obtained for the σ phase in a number of other systems.
Figure 9. Isothermal section at 1000 °C of the Cr–Mn–Si system (redrawn from [21], Copyright 1960, Minerals Metals Materials Soc). The red triangle shows the three ordered stable or metastable compositions of the σ phase, Cr2Mn, Cr2Si, and Mn2Si, as in Figure 2 (solid lines: normal substitution, dashed line: site reversal).
Applsci 05 01570 g009

3.5. Mo–Re–Cr (σ Phase)

The phase diagram of the Mo–Re–Cr system (Figure 10) seems at first very regular. The σ phase exists in both the Mo–Re and Re–Cr systems at almost the same Re compositions. It extends in the ternary composition field, almost parallel to the Mo–Cr binary border. Additionally, Mo and Cr are iso-electronic elements; both crystallize with the same bcc structure and form a complete solid solution, so that one could anticipate a simple replacement of Mo by Cr atoms in the structure of the σ phase. This would be without taking into account the crystal structures and actual atomic distribution in the binary phases. Indeed, it has been shown [20] that, in the Re–Cr system, Re preferentially occupies the high CN sites, according to its larger atomic radius, while it occupies the low CN sites in the Mo–Re system, again according to the size criterion. The specificity of the Re–Cr system is such that it combines a bcc element with an hcp element, which has a larger atomic radius. This is almost unique since in general bcc elements are larger than hcp or fcc elements; this is due to the fact that Cr is a 3d and Re a 5d element. It has been shown that in this case the geometric prevails over the electronic effect and this is one of the rare examples in which the bcc element preferentially occupies the low CN sites. The fact that the σ phase shows up at the same Re composition in both systems is a coincidence. As usual for the σ phase, the phase appears far from its ideal composition, which would be Mo2Re and Re2Cr (joined by the red dashed line in Figure 10). The consequence of this difference of site preference is a complete site reversal of Re atoms in the ternary system, which has been studied in detail by DFT calculations [22]. This is illustrated in Figure 11, showing the site fractions for the three atoms as a function of composition across the homogeneity domain of the phase. Note that only the binary borders have been studied experimentally due to non-favorable diffraction contrast for the ternary alloys (see Figure 3).
Figure 10. Isothermal section at 1150 °C of the Mo–Re–Cr system (redrawn from [23], Copyright 1999, Elsevier Science). The red triangle shows the three ordered stable or metastable compositions of the σ phase, Mo2Re, Mo2Cr, and Re2Cr, as in Figure 2 (solid lines: normal substitution, dashed line: site reversal). The site occupancies of Figure 10 are calculated along the blue line.
Applsci 05 01570 g010
Figure 11. Calculated site occupancies at 1200 °C along the section Mo0.46Re0.54–Cr0.46Re0.54 (blue line in Figure 10). The symbols correspond to the experimental occupancies at 1000 °C (Cr–Re) [20] and 1200 °C (Mo–Re) [24].
Applsci 05 01570 g011

3.6. Mo–Re–Ni (σ Phase)

The phase diagram of this system was studied along two ternary isothermal sections at 1200 °C and 1600 °C (Figure 12) [25]. The shape of the homogeneity domain of the σ phase deserves special attention. Contrary to Mo–Re–Cr systems, the σ phase exists in only one binary system (Mo–Re). However, it extends from the binary Mo–Re border deep into the ternary field, not only towards the center of the composition field but also pointing towards Mo2Ni binary composition. This latter point can be explained by the fact that the σ phase is close to be stable in the binary Mo–Ni system (see the calculated ground state of the Mo–Ni system, K. Yaqoob (to be published)). It also extends toward the third binary system, Re–Ni.
Figure 12. Isothermal section at 1600 °C of the Mo–Re–Ni system (redrawn from [25], Copyright 2013, Elsevier Science). The red triangle shows the three ordered stable or metastable compositions of the σ phase, Mo2Re, Mo2Ni, and Re2Ni, as in Figure 2 (solid line: normal substitution, dashed line: site reversal). The site occupancies of Figure 13 are calculated along the blue line.
Applsci 05 01570 g012
Contrary to the Mo–Re–Cr system, this system could be studied experimentally due to particularly favorable diffraction selectivity using both XRD and ND diffraction (see Figure 3) [4]. Three ternary samples whose composition was chosen to be representative of the homogeneity domain were studied. The results demonstrated, for the first time experimentally, the site reversal of Re atoms when the composition is changed from Mo2Re to the Re–Ni binary. The results are shown along one section in Figure 13. The result is confirmed by DFT calculations and the agreement between the calculated and experimental site occupancies is exceptional.
Figure 13. Calculated and experimental site occupancies for the σ phase at 1200 °C along the section Mo2Re–Re0.7Ni0.3 (blue line in Figure 12) [4].
Applsci 05 01570 g013
One should note the difference between this system and the Mo–Re–Cr system. Starting from the Mo–Re system, the σ phase extends mainly towards the ACx compound (Mo2Ni), which is metastable while it extends towards the stable BCx compound in the Re–Cr system. Consequently, in Mo–Re–Cr, the site reversal is in the direction of the homogeneity domain, while in Mo–Re–Ni it is perpendicular. This is simply due to the relative stability of the three binary compounds ABx, ACx, and BCx.

3.7. Re–Cr–Co (σ Phase)

We have already discussed the peculiar features of the σ phase in the Re–Cr system. A σ phase is also present in the Cr–Co system, in which Cr occupies preferentially high CN sites according to both a larger atomic radius and the bcc character. Site occupancies have been studied in [26]. The ternary Re–Cr–Co system has been studied experimentally by Sokolovskaya et al. [27]. These authors have demonstrated a complete homogeneity domain between the σ phase present in the two binary systems. One could therefore expect the Cr reversal across the homogeneity domain of the σ phase. This system is particularly interesting because the stable homogeneity domain is just on the reversal line.
Two ternary samples have been synthesized and were annealed at 1150 °C. Their composition, homogeneity, and single phase character were checked by EPMA (see Table 2). They were studied by both XRD and ND. The compositions are shown on the phase diagram in Figure 14. The site occupancy results obtained by joint Rietveld refinement are shown together with binary data obtained by XRD or ND only [20,26] in Figure 15. On the same figure are presented the results of calculations from the DFT, as explained above. Both spin polarized and non-spin polarized calculations have been used. The difference is slight between both calculations but the non-spin polarized calculation seems to slightly better reproduce the experimental data. This phenomenon was also observed for the σ phase of another magnetic system (Re–Fe [28]). Though the uncertainty of the experimental results is larger than in the case of Mo–Re–Ni system since the relative XRD and ND contrasts are much less favorable, the reversal of Cr site occupancies is evident from both experiments and calculation.
Table 2. Re–Cr–Co samples synthesized in this work (new results).
Nominal Composition (at. %)Measured Composition (EPMA, at. %)PhaseLattice Parameters (Å)
Re39Cr42Co19Re39(3)Cr39(1)Co21(2)σ phasea = 9.093
c = 4.702
Re18Cr48Co34Re19.1(18)Cr47.4(7)Co33.5(12)σ phasea = 8.902
c = 4.596

3.8. Mo–Re–Cr–Ni (σ Phase)

Finally, as an outlook, our analysis could be extended to quaternary systems. For example, let us examine the two quaternary systems Mo–Re–Cr–Co and Mo–Re–Cr–Ni. These two systems are remarkable because the σ phase exists in many of its constituent binaries (Mo–Re, Re–Cr, Cr–Co, Mo–Co, metastable in Cr–Ni) and both Re and Cr may switch from high CN (Re in Re–Cr, Cr in Cr–Co and Cr–Ni) to low CN (Re in Mo–Re, Cr in Re–Cr) positions. One can therefore expect complicated site reversal in this system.
Figure 14. Isothermal section at 1150 °C of the Re–Cr–Co system (redrawn from [27], Copyright 1986, Elsevier Science). The red triangle shows the three ordered stable or metastable compositions of the σ phase, Re2Cr, Re2Co, and Cr2Co, as in Figure 2 (solid lines: normal substitution, dashed line: site reversal). The site occupancies of Figure 15 are calculated along the blue line joining experimental data points.
Applsci 05 01570 g014
Figure 15. Calculated and experimental site occupancies for the σ phase in the Re–Cr–Co system at 1150 °C along the blue line in Figure 14 (new results). The experimental data for the binary systems are taken from [20,26].
Applsci 05 01570 g015
For the first time, in a recent work, we have calculated by DFT all the 45 = 1024 configurations of the σ phase in a quaternary system [6]. We may use this calculation to compute the site occupancies from Mo2Re to Cr2Ni in the tetrahedron of compositions (Figure 16). The figure shows the two site reversals of Re and Cr. Re reversal is evident around 0.1 mole fraction Ni, Cr reversal can be seen by the fact that low CN sites are first occupied and then decrease and are overtaken by the high CN occupancies.
Figure 16. Calculated site occupancies for the σ phase at 1227 °C between Mo2Re and Cr2Ni.
Applsci 05 01570 g016

4. Discussion

In an A–B–C system in which B has an intermediate size between A (larger atom) and C (smaller atom), there may exist a tendency to form the same ordered phase in the three constituting binary systems. This may cause irregular, somewhat triangular, shapes of homogeneity domains in isothermal sections. If the atom ordering obeys geometrical criterion, then the fact that B is smaller than A but larger than C causes a reversal of the ordering. When crossing the homogeneity domain, the B atom has to switch from the site it occupies when associated with A atoms to the other sites when associated with C. Note that what is said about size and geometrical factors determining the site occupancies could be easily transposed to valence or electronic properties.
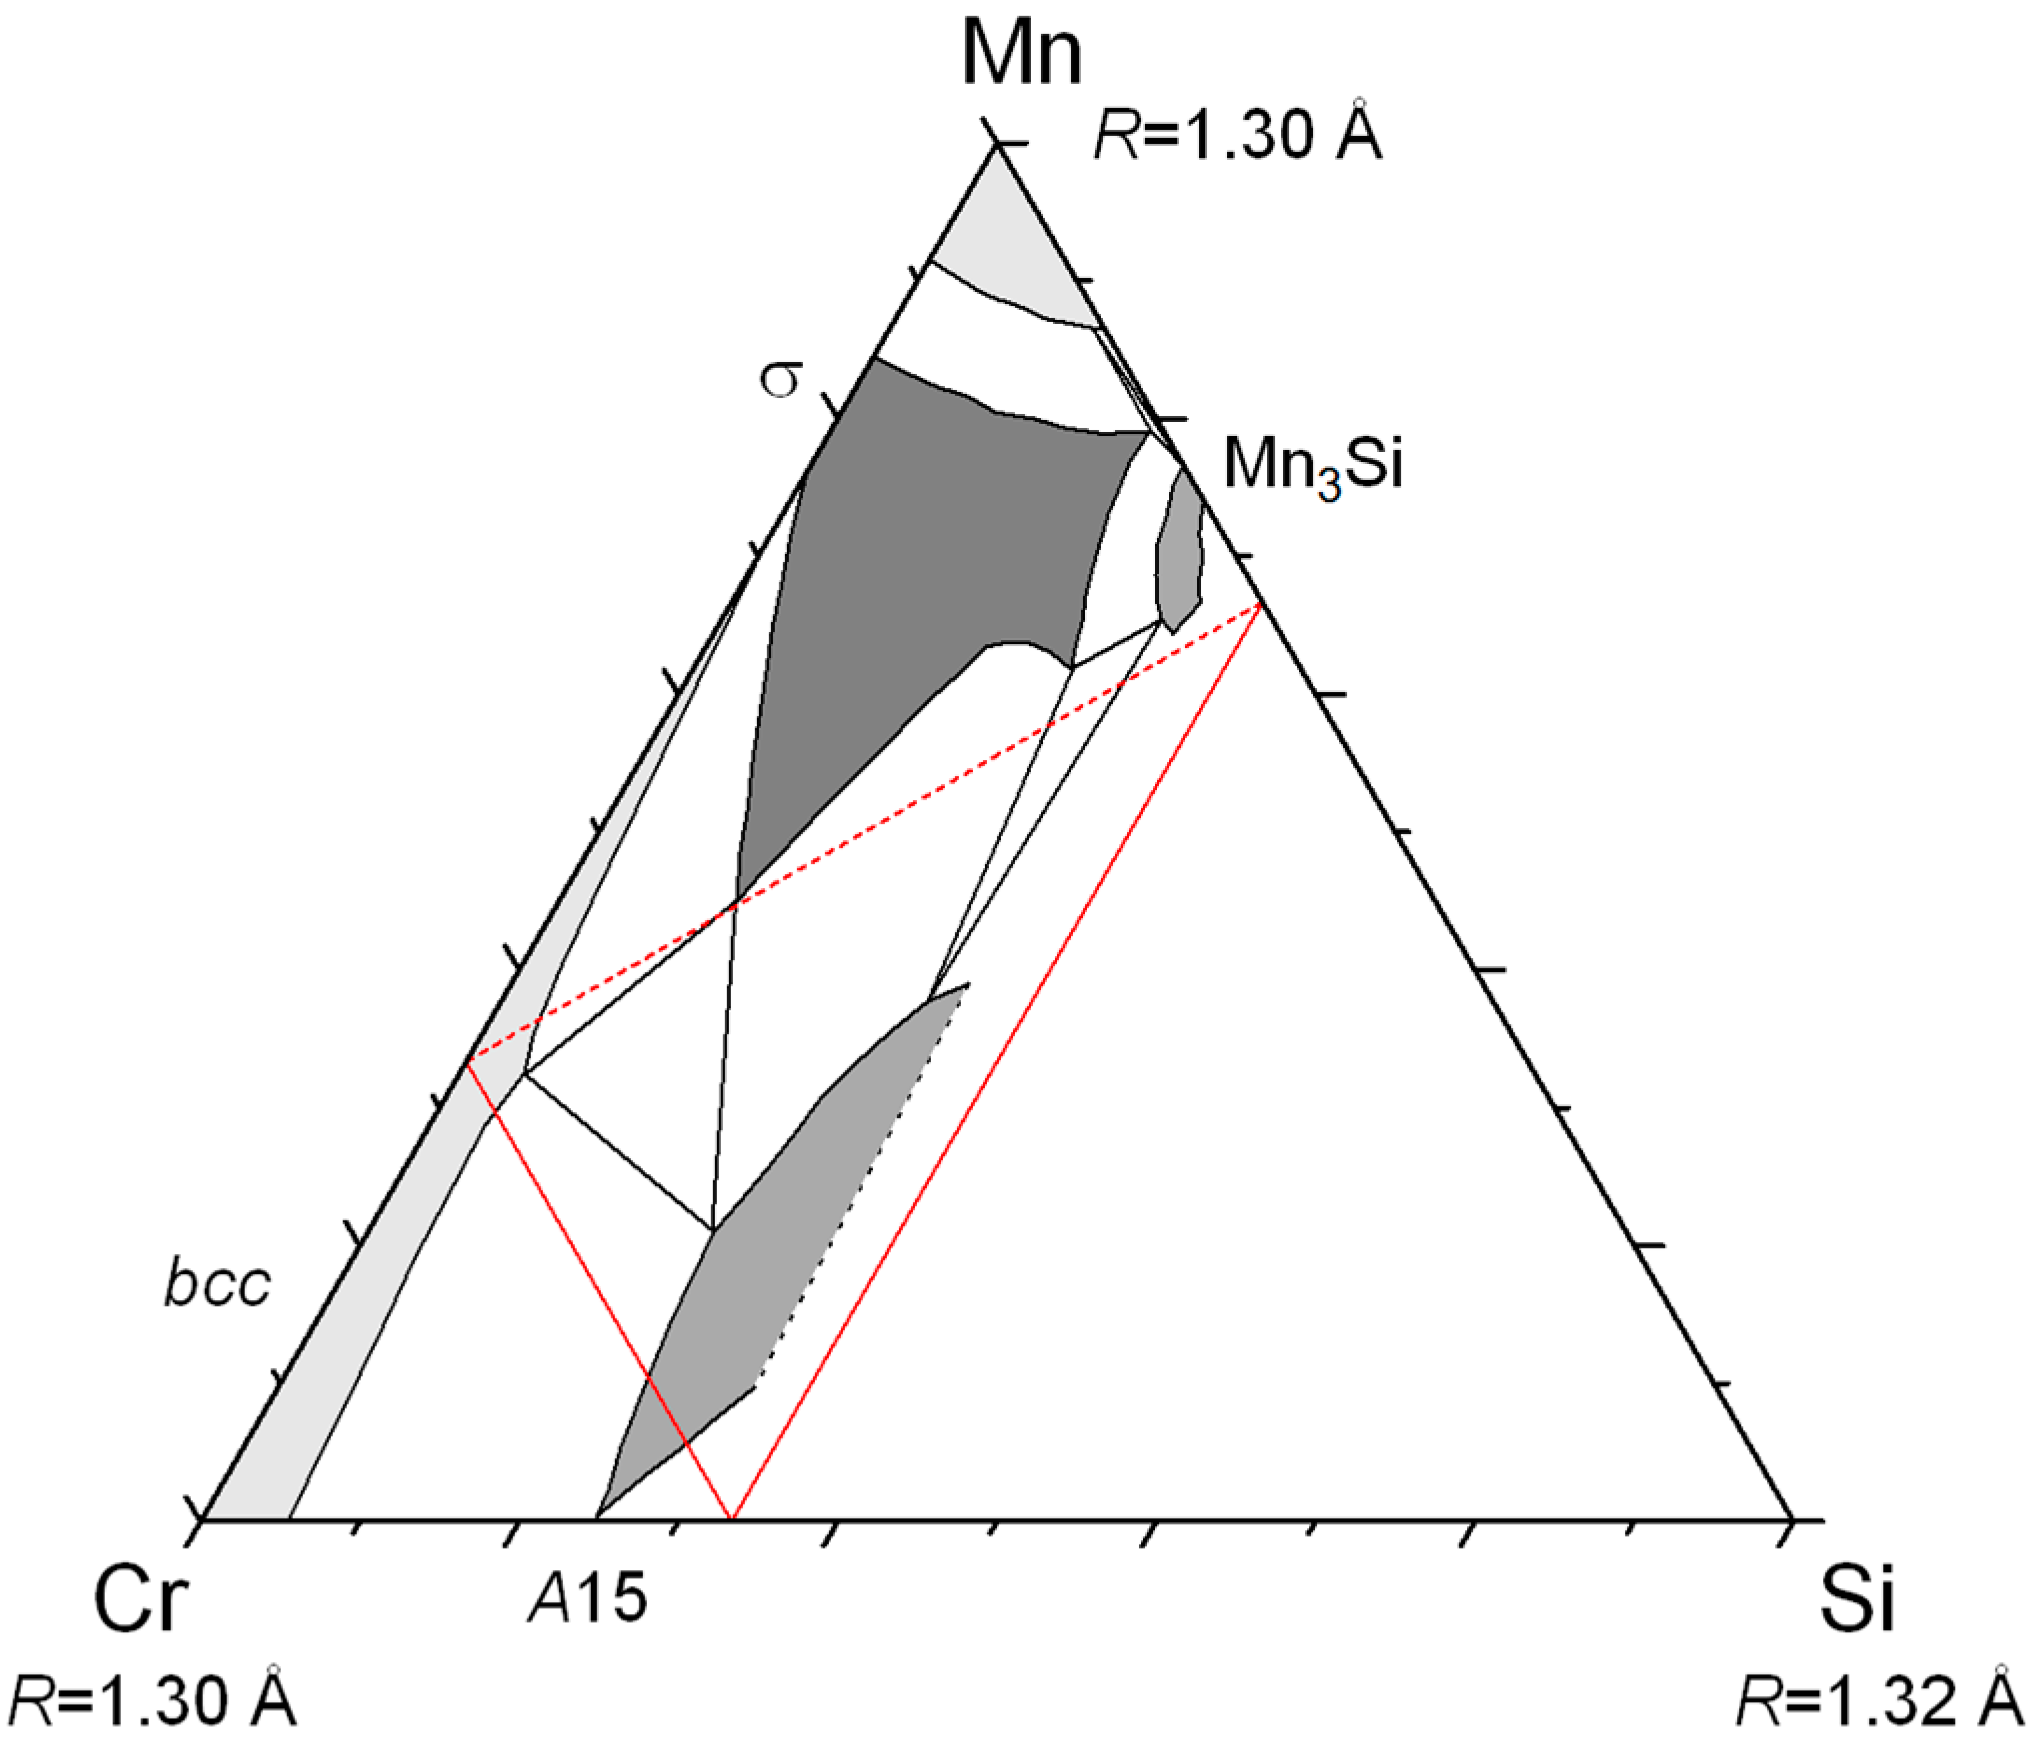
We have shown that this behavior is not pure speculation but actually exists in a number of ternary systems. Of course, the three compounds do not necessarily exist as stable phases but the important point is that they are sufficiently close to stability to produce extensive homogeneity domains pointing in their direction. We have shown examples in which two compounds (ACx and BCx: Zr–Nb–Fe, Zr–W–Re; ABx and BCx: Mo–Re–Cr, Re–Cr–Co) or one compound (ABx: Cr–Mn–Si, Mo–Re–Ni) only was stable. Calculations could be made in any system for any type of phase but are worthwhile only if an odd homogeneity domain (or known inverse atomic distribution in the binaries, like in the Mo–Re–Cr and Re–Cr–Co systems) points to the possible existence of site reversal.
We made a systematic scan of the Handbook of Ternary Alloys Phase Diagrams [29] to check for the occurrence of irregular homogeneity domains. The systems presented in this review are the only ones, to our knowledge, for which a detailed structural study of site reversal has been documented. Another interesting phase is the γ brass structure that has irregular homogeneity domains in many systems (e.g., Cd–Cu–Sn or Cu–Pt–Zn) but no detailed structural work showing that site reversal exists.
Let us examine in which systems this phenomenon may be observed. These systems must differ strongly from the systems in which one observes a simple substitution (generally observed when two elements are similar and one is different from the two others) or no substitution at all (the three elements are very different). There should be a similar difference of radius/electronegativity between A and B and between B and C and the three compounds ABx, ACx, and BCx should exist or be close to stability in the binary systems. This would exclude in principle the phases for which a strongly covalent bonding is involved or the bonding is metallic but very localized (systems with transition metals and rare earths). The irregular systems are therefore mainly systems associating three transition metals.
We have presented only phases pertaining to the group of the topologically close-packed (TCP) phases. It seems that this type of structure favors this phenomenon. First, because the bonding has to be mainly metallic, second because transition metal systems are favored because they offer along the transition series wide and smooth variations of atomic radius and electronegativity. Finally, because there are not so many intermetallic phases in transition metal systems that are not TCP. Other phases are ordered structures from the bcc, hcp, or fcc solid solutions. See, for example, the bow-shaped homogeneity domain of the B2 phase in the Al–Pd–Sc or Al–Ru–Sc systems. However, for B2 or L10, for example, there is no reversal since the two sites in the crystal structure are symmetrically equivalent.
For other ordered phases like L12, the situation is more complex. Note that the site reversal exists already in several binary systems like Au–Cu (L12 exists at both compositions AuCu3 and Au3Cu and crystallizes in two anti-structures). However, we could not find any ternary system showing reversal in a continuous manner. The reason is the presence of other ordered structures like ternary L21 for example or other intermetallic phases. Extensive homogeneity domains are not favored because of the low temperatures necessary to have ordered phases.
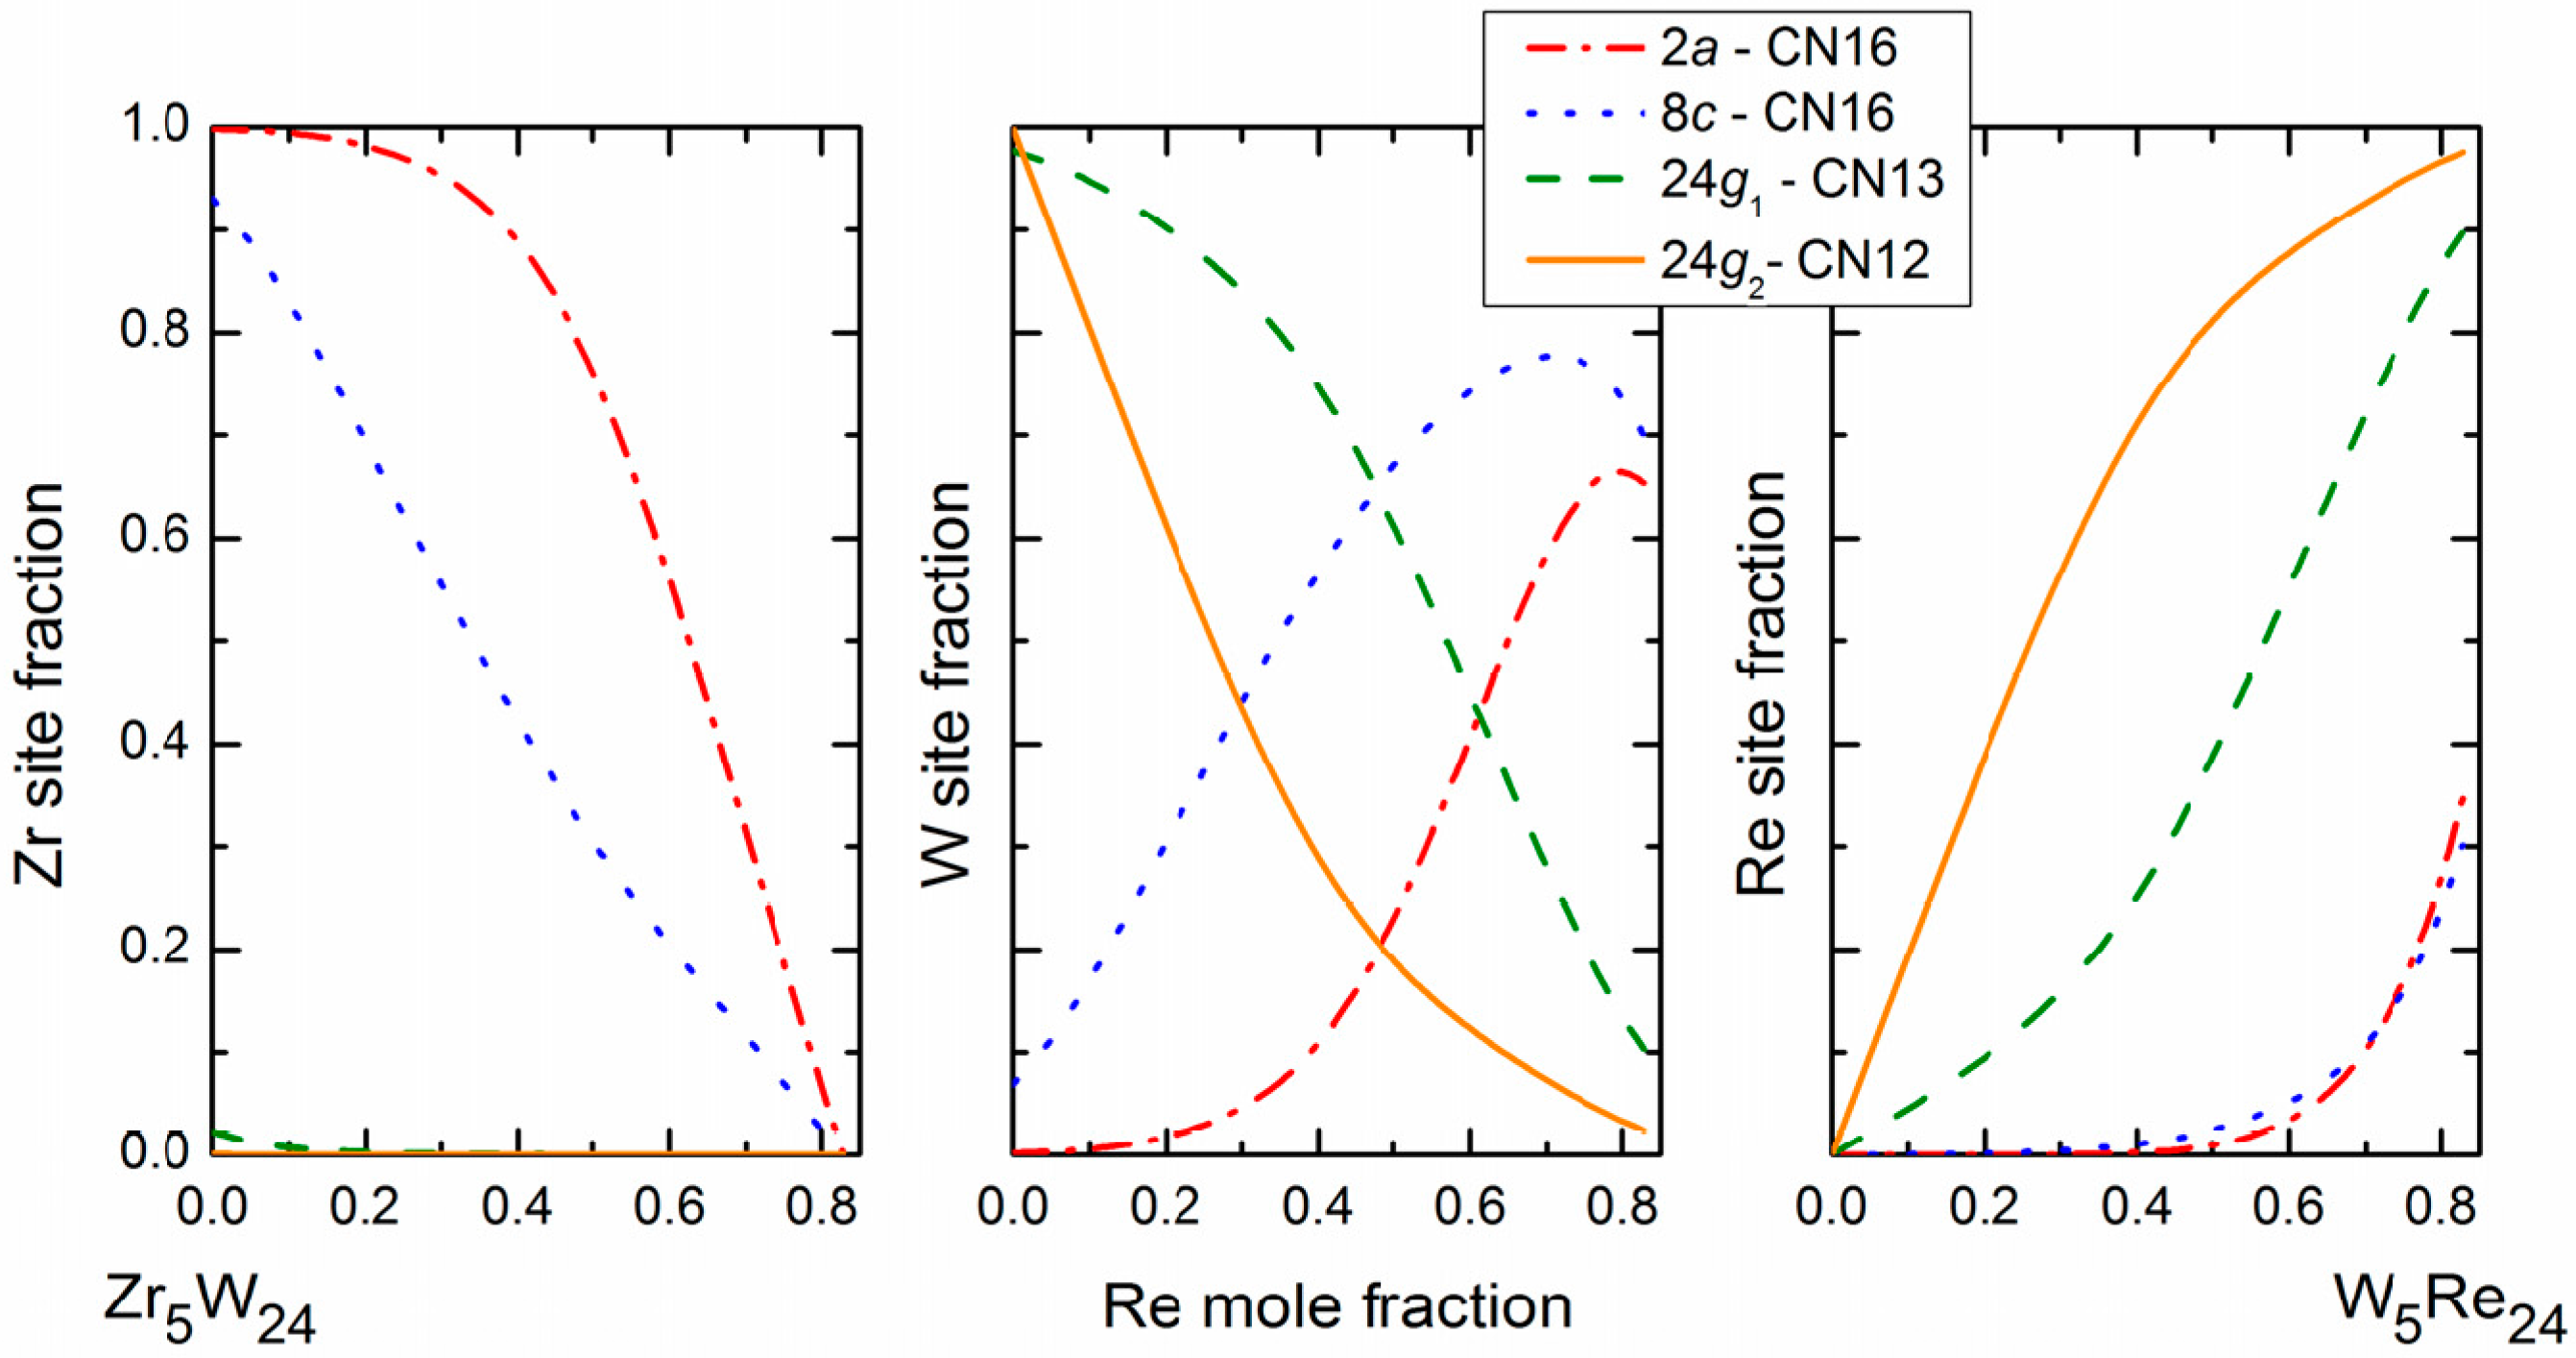
The TCP phases are known to have broad ranges of homogeneity and may be highly non-stoichiometric therefore offering certain structural flexibility. Their stability and site occupancies are more influenced by geometry and atomic sizes than the electronic properties of constituting atoms. They are therefore prone to show these irregular homogeneity domains caused by the geometric accommodation of three atoms of different sizes. The fact that, in these phases, the atomic radius monitors the site occupancies according to the site CN also favors this behavior. It also seems to be important to have ternary configurations stabilizing the phase (χ phase in Zr–W–Re, C14 phase in Zr–Nb–Fe). This is also typical of the TCP phases with their often complex structures.
Then, one may wonder why rhenium appears in most of the systems presented here. It is because rhenium has an intermediate size and intermediate electronic properties (half-filled d-band). Therefore, it forms many compounds (it is the element involved in the largest number of binary σ and χ phases) and it may be larger or smaller than the other element (Re is the large atom in Re–Cr–Co, the medium one in Mo–Re–Ni, and the small one in Zr–W–Re).
The B atom, through switching its preference from low CN sites to high CN sites, reaches a state in which it is completely disordered. In the middle of the dotted line in Figure 2, one reaches the composition (A0.5B0.5)(B0.5C0.5)x. The configurational entropy for this composition is equal to that of a binary disordered solid solution (−0.69 in unit of R) i.e., not very far from a completely disordered ternary solid solution (−1.10 in unit of R), so that one could expect a stabilization of this state at high temperatures due to entropic effects. By reference to high entropy alloys [30], we could propose the concept of high entropy intermetallic compounds.
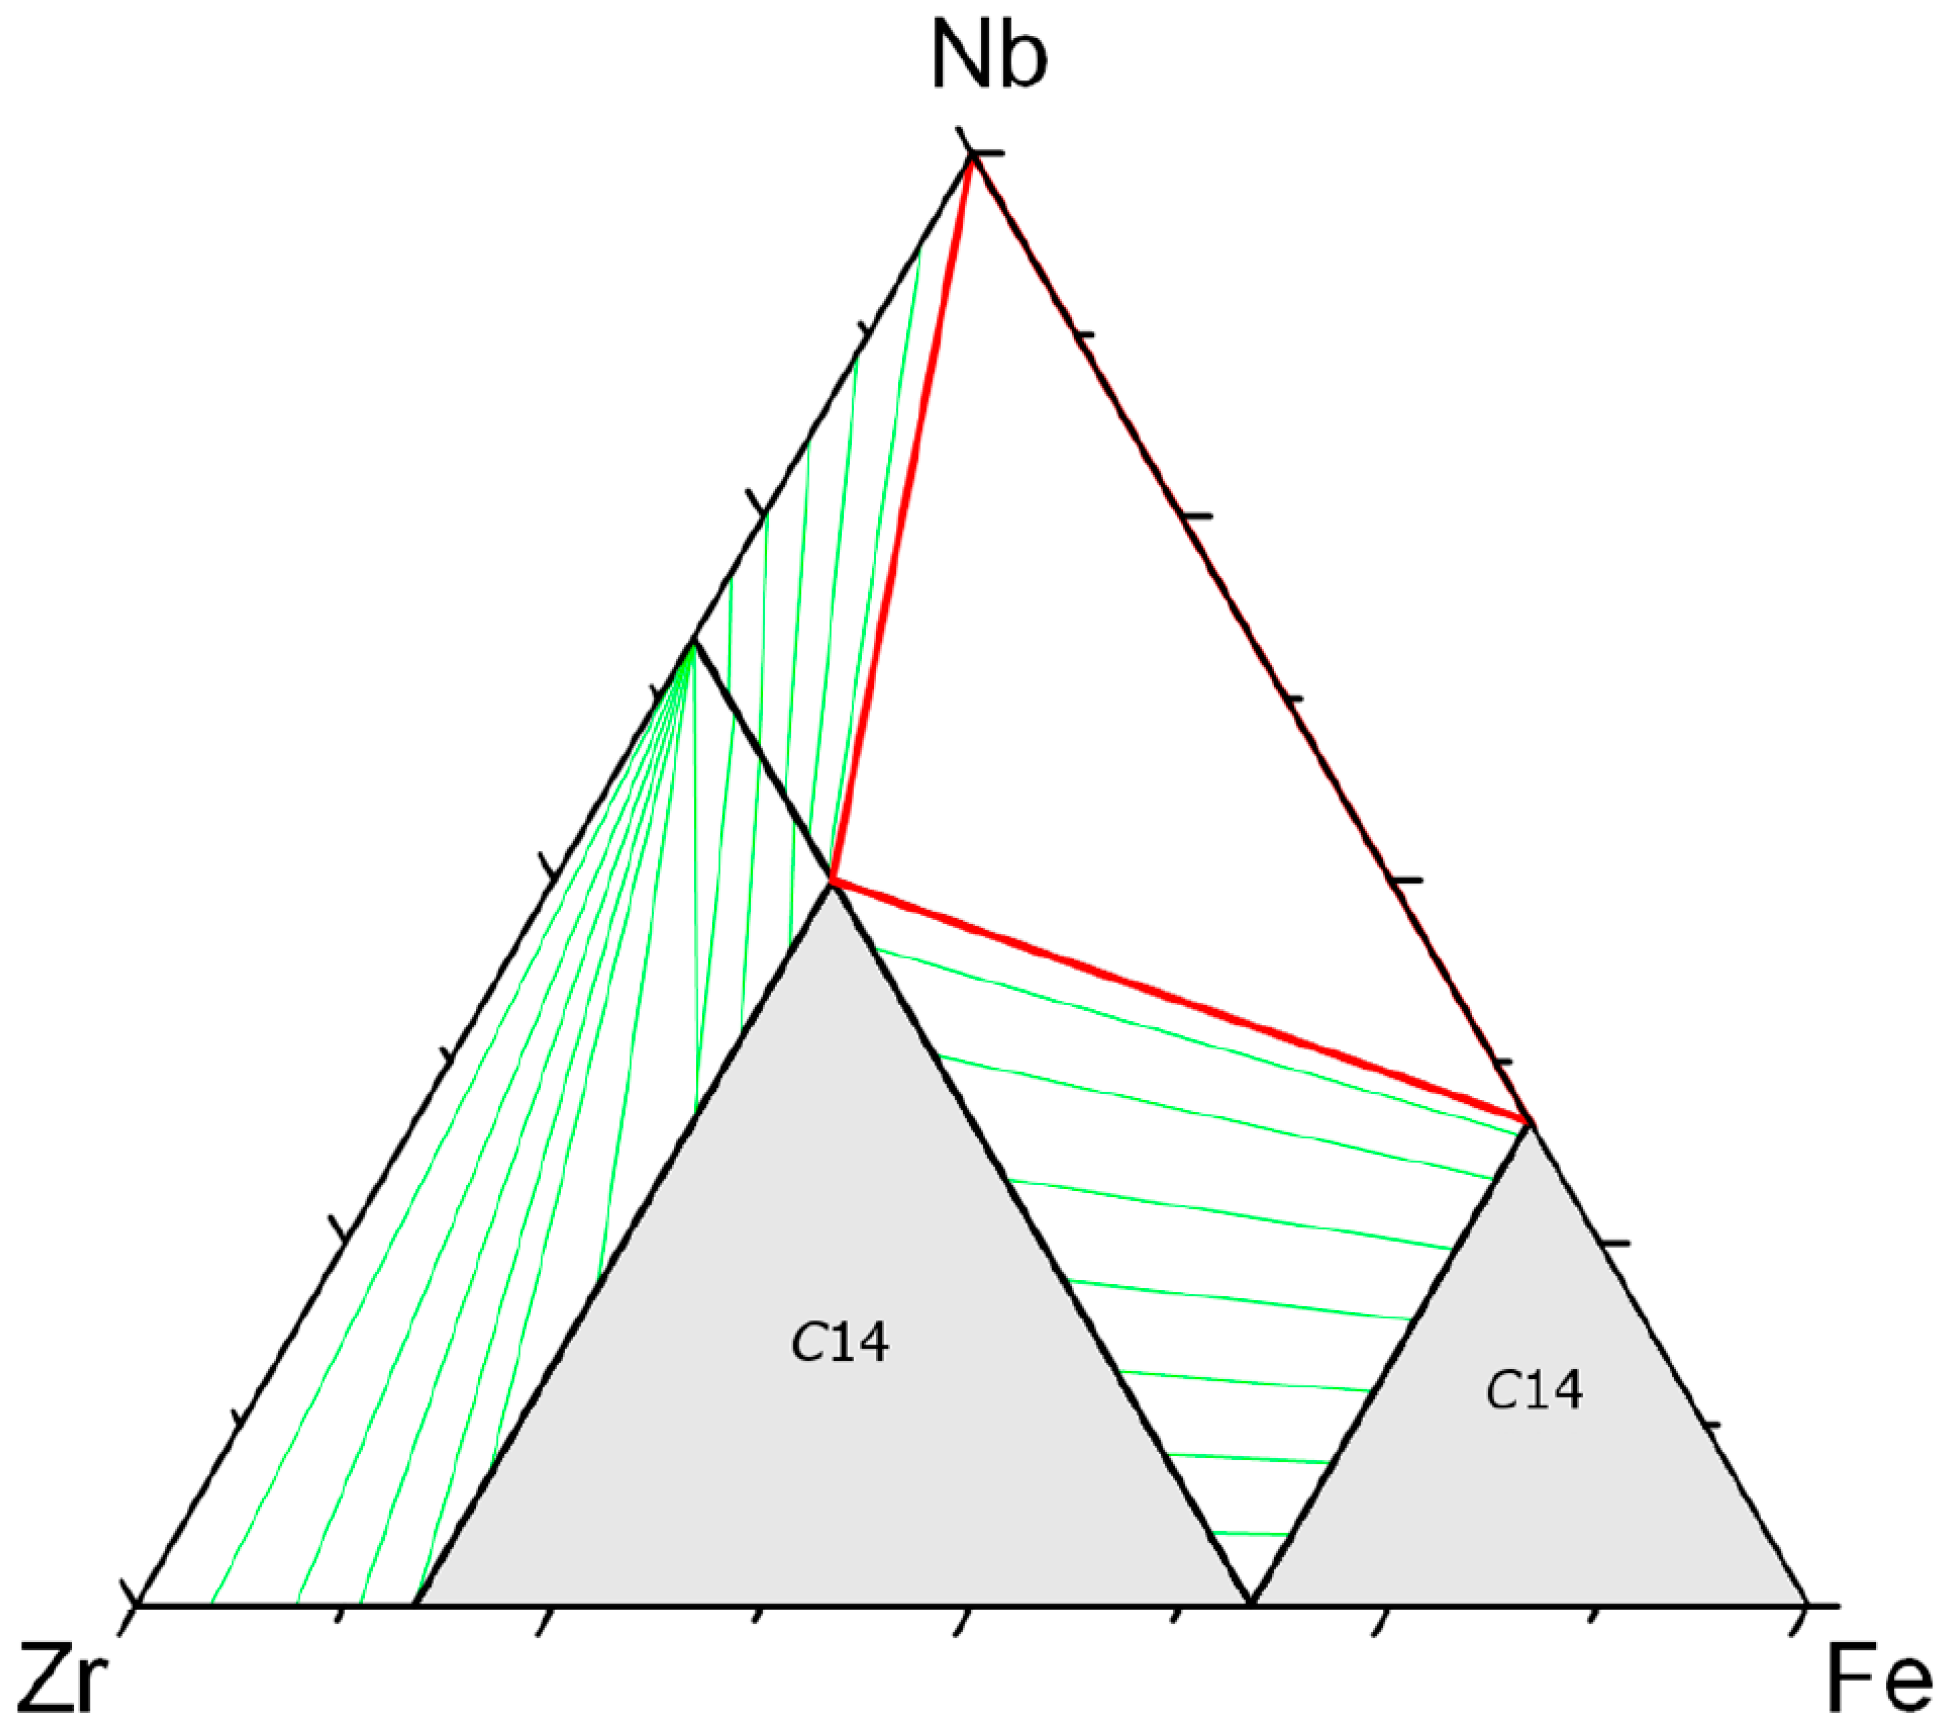
On the other hand, the site reversal should cause miscibility gaps inside the phase at low temperatures. A simple substitution can occur at low temperatures if ideal or with a negative enthalpy of mixing. This is not the case if one goes from ABx to BCx because the replacement cannot be done in one step and involves site reversal. This causes miscibility gaps, shown by phase diagram calculations at low temperatures from the DFT data (see, for example, the σ phase diagram of the Mo–Re–Cr system calculated at low temperature in [22]). Experimentally, the miscibility gap between the two C14 phases is clearly shown in the Zr–Nb–Fe system (see Figure 5) and also confirmed by the calculation.

5. Conclusions

We have shown that a number of ternary phases present, in their stable range, the possibility of switching their configuration. This is due to the fact that one of the atoms is both larger than one of the other atoms and smaller than the third one. This phenomenon has been shown by the evidence of irregular homogeneity domains and experimental determination of site occupancies. One should also mention the extreme importance of DFT calculations to get information about stability and to compute site occupancies because they allow the study of the metastable range of stability of the phases. This phenomenon of site occupancy reversal is mainly encountered in transition metal systems and TCP phases are primarily concerned.

Acknowledgments

DFT calculations were performed using HPC resources from GENCI-CINES (Grant 2015-096175). Financial support from the Agence Nationale de la Recherche (Project Armide 2010 BLAN 912 01) is acknowledged. The authors also want to thank Nathalie Dupin for useful and fruitful discussions.

Author Contributions

Jean-Marc Joubert formalized the idea of site reversal in ternary systems, made the bibliographic search, and wrote the manuscript. Mohamed Andasmas was responsible for the synthesis of Re–Cr–Co samples, made the characterization, and performed the neutron diffraction experiment. Jean-Claude Crivello was in charge of the DFT calculations, site occupancy, and phase diagram computation from DFT data. He was responsible for the design of most figures and made the critical revision of the manuscript. All authors have contributed to the manuscript and have approved the final version.

Conflicts of Interest

The authors declare no conflict of interest.

References

  1. Shelton, K.L.; Merewether, P.A.; Skinner, B.J. Phases and phase relations in the system Pd–Pt–Sn. Can. Mineral. 1981, 19, 599–605. [Google Scholar]
  2. Joubert, J.-M.; Crivello, J.-C. Non-stoichiometry and Calphad modelling of Frank-Kasper phases. Appl. Sci. 2012, 2, 669–681. [Google Scholar] [CrossRef]
  3. Joubert, J.-M.; Crivello, J.-C.; Andasmas, M.; Joubert, P. Phase stability in the ternary Re–W–Zr system. Acta Mater. 2014, 70, 56–65. [Google Scholar] [CrossRef]
  4. Yaqoob, K.; Crivello, J.-C.; Joubert, J.-M. Comparison of the site occupancies determined by combined Rietveld refinement and by DFT calculations: The example of the ternary Mo–Ni–Re σ phase. Inorg. Chem. 2012, 51, 3071–3078. [Google Scholar] [CrossRef] [PubMed]
  5. Joubert, J.-M.; Cerný, R.; Latroche, M.; Percheron-Guégan, A.; Yvon, K. Site occupancies in LaNi5 three-substituted compound determined by means of multiwavelength X-ray powder diffraction. J. Appl. Crystallogr. 1998, 31, 327–332. [Google Scholar] [CrossRef]
  6. Crivello, J.-C.; Souques, R.; Bourgeois, N.; Breidi, A.; Joubert, J.-M. ZenGen, a tool to generate ordered configurations for systematic first-principles calculations: The Cr–Mo–Ni–Re system as a case study. Calphad 2015, 51, 233–240. [Google Scholar] [CrossRef]
  7. Kresse, G.; Furthmüller, J. Efficient iterative schemes for ab initio total-energy calculations using a plane-wave basis set. Phys. Rev. B 1996, 54, 11169–11186. [Google Scholar] [CrossRef]
  8. Kresse, G.; Joubert, D. From ultrasoft pseudopotentials to the projector augmented-wave method. Phys. Rev. B 1999, 59, 1758–1775. [Google Scholar] [CrossRef]
  9. Perdew, J.P.; Burke, K.; Ernzerhof, M. Generalized gradient approximation made simple. Phys. Rev. Lett. 1996, 77, 3865–3868. [Google Scholar] [CrossRef] [PubMed]
  10. Perdew, J.P.; Burke, K.; Ernzerhof, M. Erratum: Generalized gradient approximation made simple [Phys. Rev. Lett. 77, 3865 (1996)]. Phys. Rev. Lett. 1997, 78, 1396. [Google Scholar] [CrossRef]
  11. Monkhorst, H.J.; Pack, J.D. Special points for Brillouin-zone integrations. Phys. Rev. B 1976, 13, 5188–5192. [Google Scholar] [CrossRef]
  12. Sundman, B.; Ågren, J. A regular solution model for phases with several components and sublattices, suitable for computer applications. J. Phys. Chem. Solids 1981, 42, 297–301. [Google Scholar] [CrossRef]
  13. Dupin, N.; Fries, S.G.; Joubert, J.-M.; Sundman, B.; Sluiter, M.; Kawazoe, Y.; Pasturel, A. Using Nb–Ni µ phase first principles results in the Bragg-Williams approximation to calculate finite temperature thermodynamic properties. Philos. Mag. 2006, 86, 1631–1641. [Google Scholar] [CrossRef]
  14. Granovsky, M.S.; Canay, M.; Lena, E.; Arias, D. Experimental investigation of the Zr corner of the ternary Zr–Nb–Fe phase diagram. J. Nucl. Mater. 2002, 302, 1–8. [Google Scholar] [CrossRef]
  15. Raghavan, V. Fe–Nb–Zr (iron-niobium-zirconium). J. Phase Equilibr. 2003, 24, 354–355. [Google Scholar] [CrossRef]
  16. Teslyuk, M.Y.; Ivanets, N.A.; Dorosh, R.V. Investigation of phase equilibria in Zr–Mo–Re and Zr–W–Re ternary systems. Rhenium New Tech. Tr. Vses. Soveshch. Probl. Reniya 1970, 2, 26–30. [Google Scholar]
  17. Taylor, A.; Doyle, N.J.; Kagle, B.J. The ternary alloy system molybdenum-rhenium-hafnium. Trans. ASM 1963, 56, 49–67. [Google Scholar]
  18. Taylor, A.; Doyle, N.J. The ternary alloy system tungsten-rhenium-hafnium. Trans. ASM 1965, 58, 341–352. [Google Scholar]
  19. Joubert, J.-M.; Phejar, M. The crystal chemistry of the χ phase. Prog. Mater. Sci. 2009, 54, 945–980. [Google Scholar] [CrossRef]
  20. Joubert, J.-M. Crystal chemistry and Calphad modelling of the σ phase. Prog. Mater. Sci. 2008, 53, 528–583. [Google Scholar] [CrossRef]
  21. Gupta, K.P.; Rajan, N.S.; Beck, P.A. Effect of Si and Al on the stability of certain sigma phases. Trans. Metall. Soc. AIME 1960, 218, 617–624. [Google Scholar]
  22. Crivello, J.-C.; Palumbo, M.; Abe, T.; Joubert, J.-M. Ab initio ternary σ-phase diagram: The Cr–Mo–Re system. Calphad: Comput. Coupling Phase Diagrams Thermochem. 2010, 34, 487–494. [Google Scholar] [CrossRef]
  23. Slyusarenko, E.M.; Borisov, V.A.; Sofin, M.V.; Kerimov, E.Y.; Chastukhin, A.E. Determination of phase equilibria in the system Ni–V–Cr–Mo–Re at 1425 K using the graph method. J. Alloys Compd. 1999, 284, 171–189. [Google Scholar] [CrossRef]
  24. Farzadfar, S.-A.; Levesque, M.; Phejar, M.; Joubert, J.-M. Thermodynamic assessment of the Molybdenum-Rhenium System. Calphad 2009, 33, 502–510. [Google Scholar] [CrossRef]
  25. Yaqoob, K.; Joubert, J.-M. Experimental investigation of the Mo–Ni–Re system. J. Alloys Compd. 2013, 559, 101–111. [Google Scholar] [CrossRef]
  26. Cieslak, J.; Dubiel, S.M.; Reissner, M. Site occupancy and lattice parameters in sigma-phase Co–Cr alloys. Acta Crystallogr. 2012, B68, 123–127. [Google Scholar] [CrossRef] [PubMed]
  27. Sokolovskaya, E.M.; Tuganbaev, M.L.; Stepanova, G.I.; Kazakova, E.F.; Sokolova, I.G. Interaction of cobalt with chromium and rhenium. J. Less-Common Met. 1986, 124, L5–L7. [Google Scholar] [CrossRef]
  28. Breidi, A.; Andasmas, M.; Crivello, J.-C.; Dupin, N.; Joubert, J.-M. Experimental and computed phase diagrams of the Fe–Re system. J. Phys.: Condens. Matter 2014, 26, 485402. [Google Scholar] [CrossRef] [PubMed]
  29. Villars, P.; Prince, A.; Okamoto, H. Handbook of Ternary Alloy Phase Diagrams; American Society for Metals International: Materials Park, OH, USA, 1997. [Google Scholar]
  30. Yeh, J.-W.; Chen, S.-K.; Lin, S.-J.; Gan, J.-Y.; Chin, T.-S.; Shun, T.-T.; Tsau, C.-H.; Chang, S.-Y. Nanostructured high-entropy alloys with multiple principal elements: Novel alloy design concepts and outcomes. Adv. Eng. Mater. 2004, 6, 299–303. [Google Scholar] [CrossRef]

