2. Numerical Simulations
We have solved numerically the Liouville equations for a four-level ladder system coherently interacting with a tricolor pulse without the assumptions of the rotating-wave approximation (RWA). Avoiding the RWA in the density-matrix formalism allows to account for the interaction of all the Fourier components of the pulses with all the permitted transitions in the system, and therefore in our study we can evaluate the effect of large detuning and chirp of ultrashort pulses with a broad range of intensities. The density matrix equations that we numerically solve are as follows [
24].
where
are the populations of the levels
i, the off-diagonal elements
represent the coherences between levels
,
are the dipole coupling coefficients of the corresponding electronic transitions, and
are the angular frequencies of the transitions
, with
being the energies of the corresponding quantum states. The decay rates of the transitions
are given by
, and the population relaxation rates of the levels satisfy
,
,
. The overall rate
, which is inversely proportional to the population decay time
of level
i (
), is thus given by the sum of each deactivation pathway in the four-level system. The decay rates of the coherences are defined by
,
,
,
,
and
, which include the relaxation of the coherences and the pure coherence dephasing rates
, which are defined as the inverse of the corresponding pure coherence dephasing times (
). The laser pulses used in our simulations are of Gaussian shape, with the electric field
given by
where
,
and
are the peak amplitudes of the three pulse components
,
and
, and
,
and
are the respective optical angular frequencies. The duration of the pulses is given by
, where
is the full width at half maximum of the pulse intensity profile. In the present study we consider ultrashort pulses of ps and fs durations, so that considering an effective dipole coupling coefficient such as
Cm for all transitions, the peak intensities for 2
π pulses of 10 ps and 100 fs durations result in
W/cm
and
W/cm
, respectively.
The level structure that we have chosen in our simulations corresponds to the energy levels of sodium
Na, in particular our ground state represents the sodium 3
s state, the intermediate states are the 3
p and 4
s states, and the upper state is the 7
p state. We numerically integrate Equation (
1) with an algorithm based on a 4–5 order Runge-Kutta solver which scans the areas of the three pulse components
,
and
between 0 to 4
π in steps of 0.01
π. Starting with the system in the ground 3
s state the goal is to obtain complete population transfer to the 7
p state. We first consider a trichromatic pulse with a duration of 10 ps composed of three resonant components with central wavelengths of 589 nm, 1141 nm and 781 nm (see
Figure 1). We obtain that the only solution for total population transfer from the ground state 3
s to the highest state 7
p is the set of pulse areas
,
, and
, as it is illustrated in
Figure 1. As it is shown in
Figure 1, the intermediate levels 3
p and 4
s are temporally occupied during the interaction process, but at the end of the interaction all the population is efficiently transferred to the 7
p state. By varying the area of pulses
and
in a 4% we obtain that the population transfer to the 7
p state is reduced to roughly 98%, which gives an estimation of the accuracy of our result. In the inset of
Figure 1 we show how doubling the area of each pulse the
-pulse effect is retrieved, with all the population being back to the ground state at the end of the interaction.
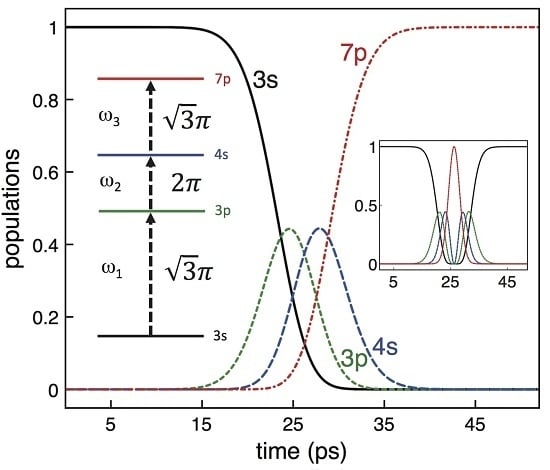
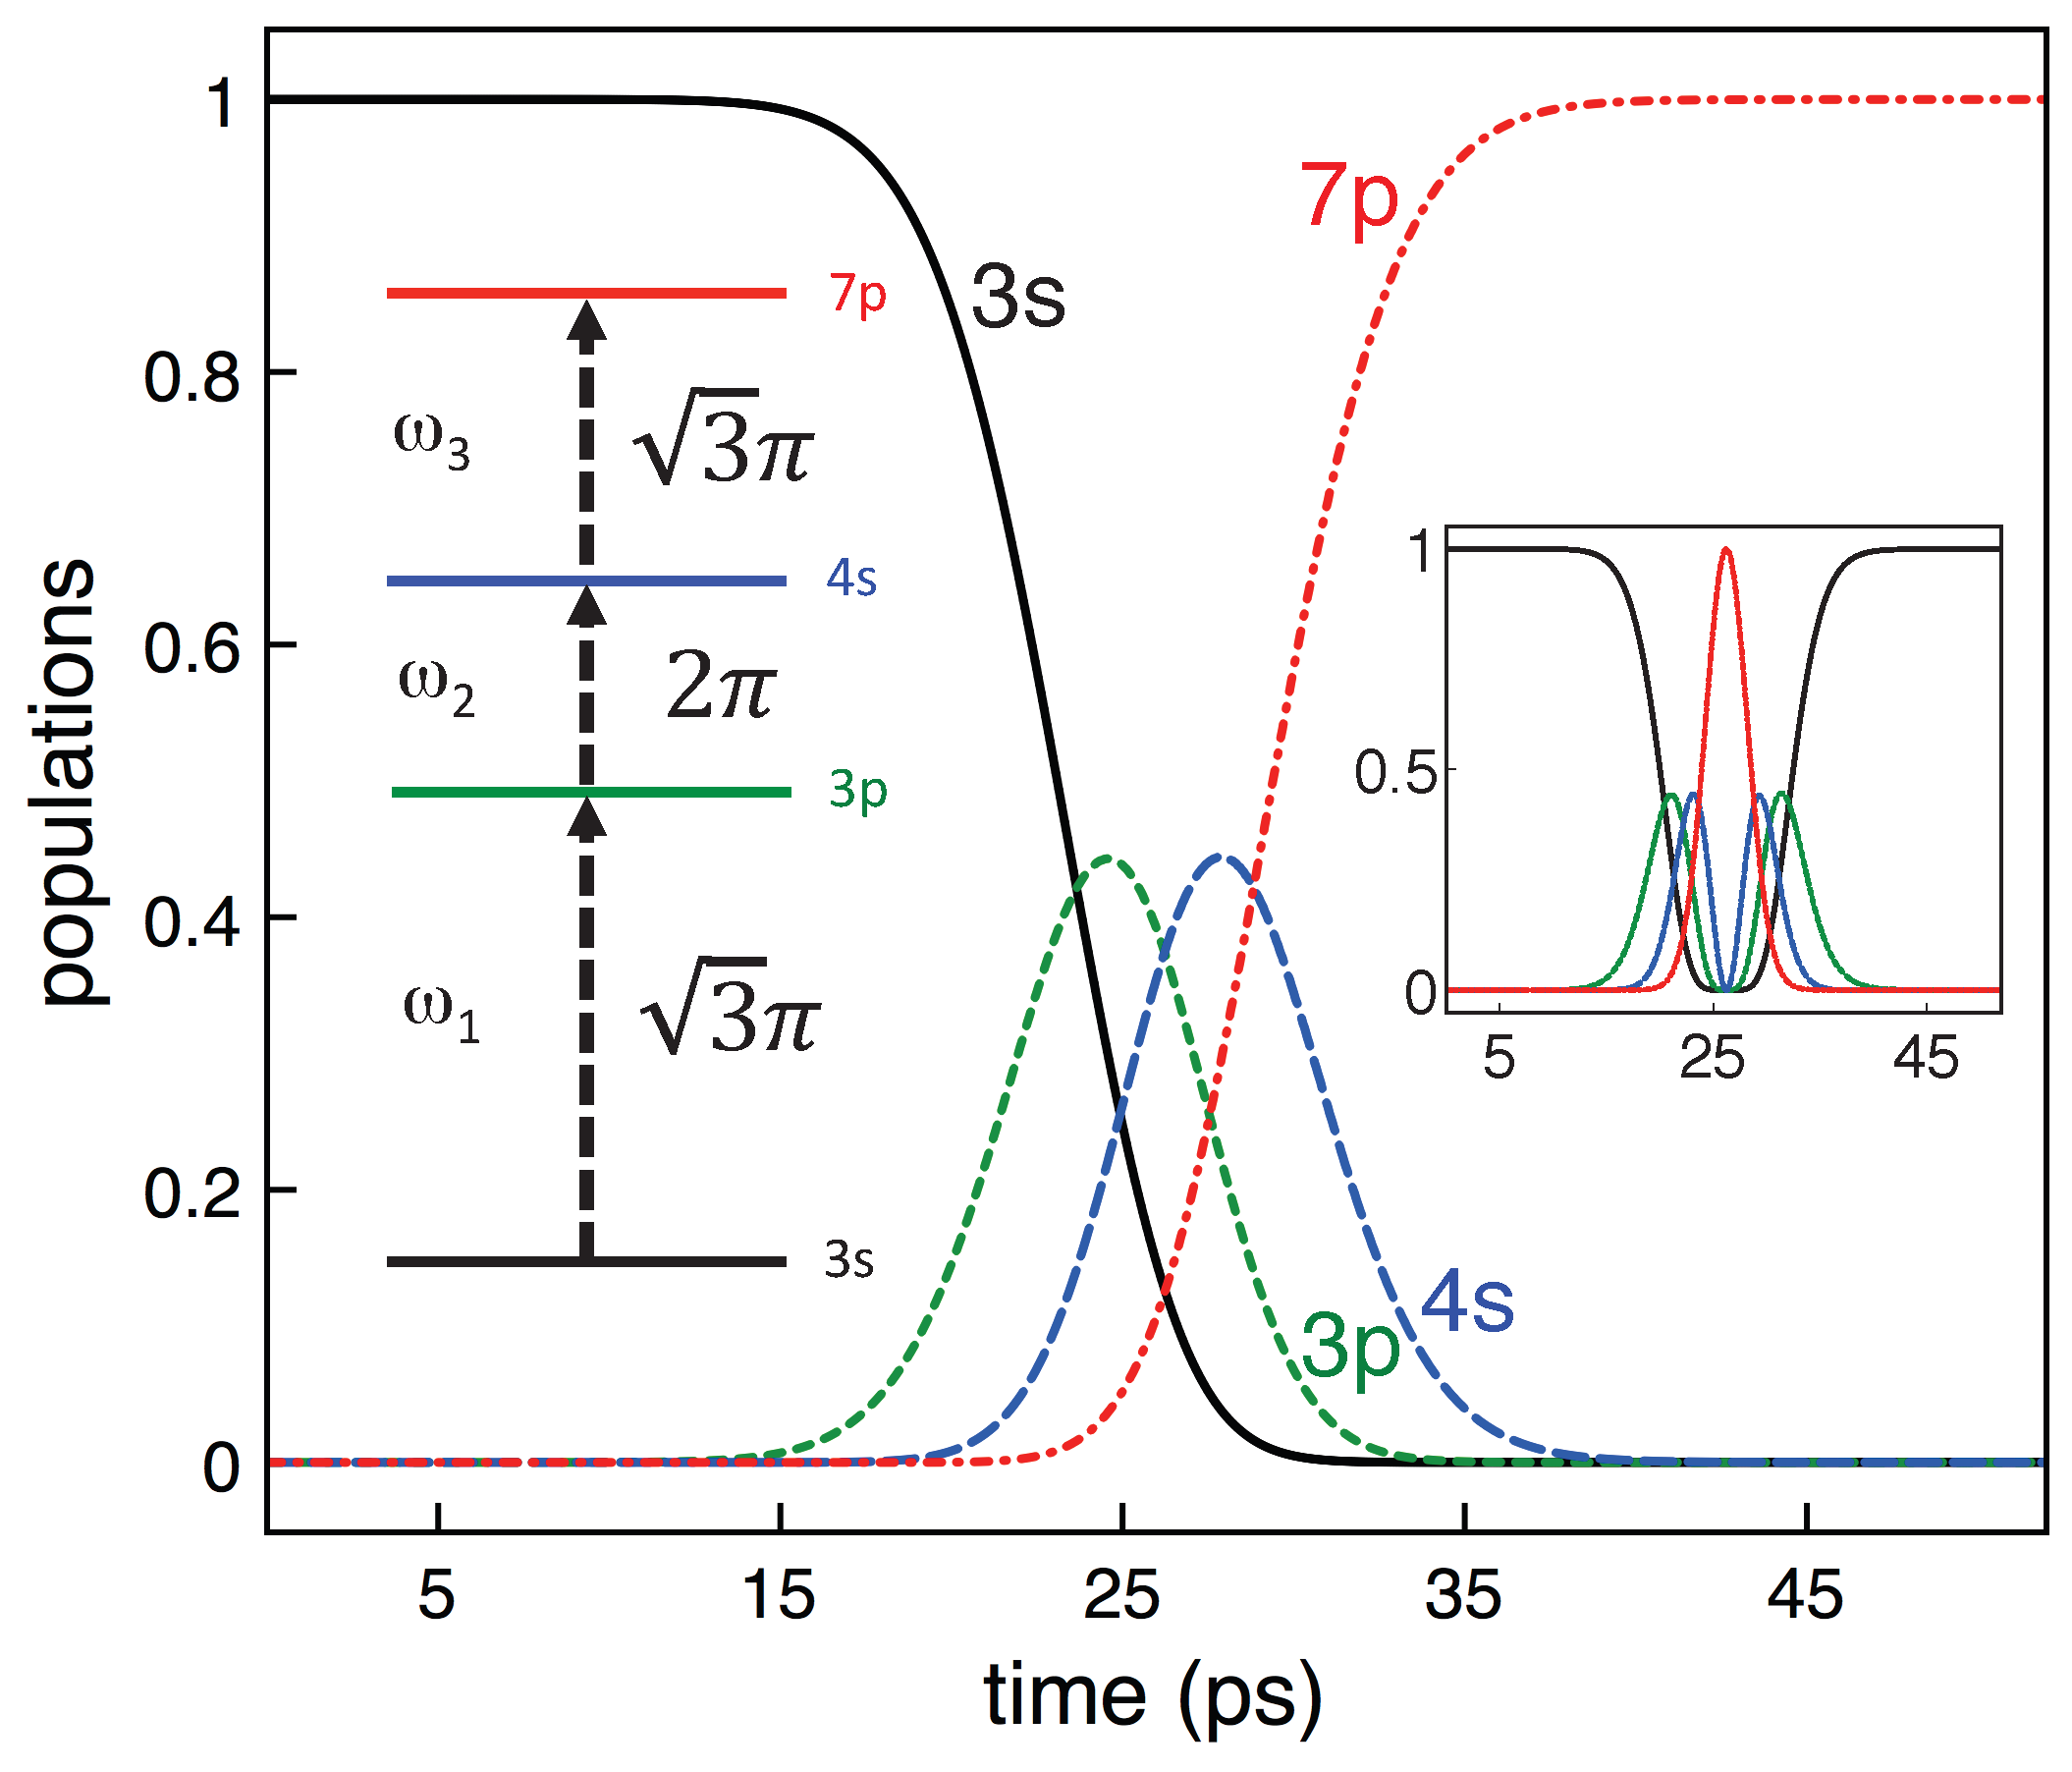
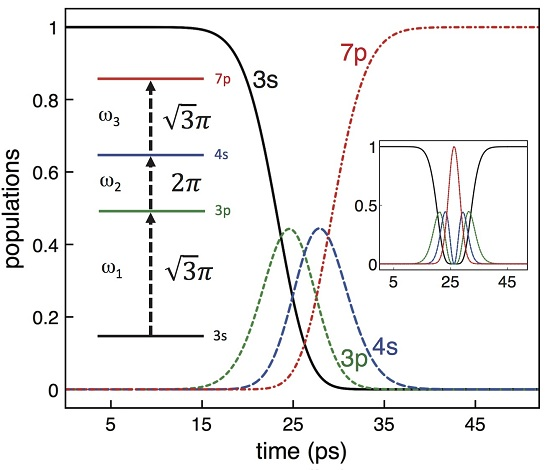
Figure 1.
Time evolution of the populations of the four levels, as indicated, for a “π-pulse” transition produced by a tricolor resonant 10 ps Gaussian pulse of central angular frequencies , and . The inset on the left shows a scheme of the four-level ladder system with the pulse areas that completely invert the population. Atomic sodium has been considered in our study as an example, with transition energies such as cm (589 nm for 3s–3p), cm (1141 nm for 3p–4s), and cm (781 nm for 4s–7p). The inset on the right shows a complete oscillation of a “-pulse”, which is produced with the corresponding double pulse areas , , and .
The solution that we report can be scaled to other pulse durations, which is also described in the case of a three-level ladder system [
12]. Indeed, we find that complete population inversion is reproduced for pulses longer than 10 ps and also for shorter pulses. The limitation of the result is determined, on the one hand, on the relaxation times and line-broadening factors of the system, which prevent the usability of long pulses, and on the other hand, on the value of the transition dipole moments combined with the duration of the pulse, since weak coupling dipole moments with ultrashort pulses result in large peak intensities involving carrier field dynamics [
26] and ac-Stark shifts that preclude the population inversion effect. As an example, for values of the transition dipole moments in sodium as
Cm,
Cm, and
Cm, and considering 10 ps laser pulses, the peak intensity of the corresponding laser pulses for
,
, and
illumination is
W/cm
,
W/cm
,
W/cm
, which results in a population inversion to the 7
p state of 99.3%. This population inversion is reduced to 98% for 5 ps pulses and to 84% for 1 ps pulses, which require pulse peak intensities of two more orders of magnitude. Dephasing times of the considered transitions in sodium are in general of the order of ns and therefore they do not influence the results obtained in the present study, which considers ps and fs pulses, but as commented above the complete density matrix equations including dephasing rates need to be computed for longer pulses.
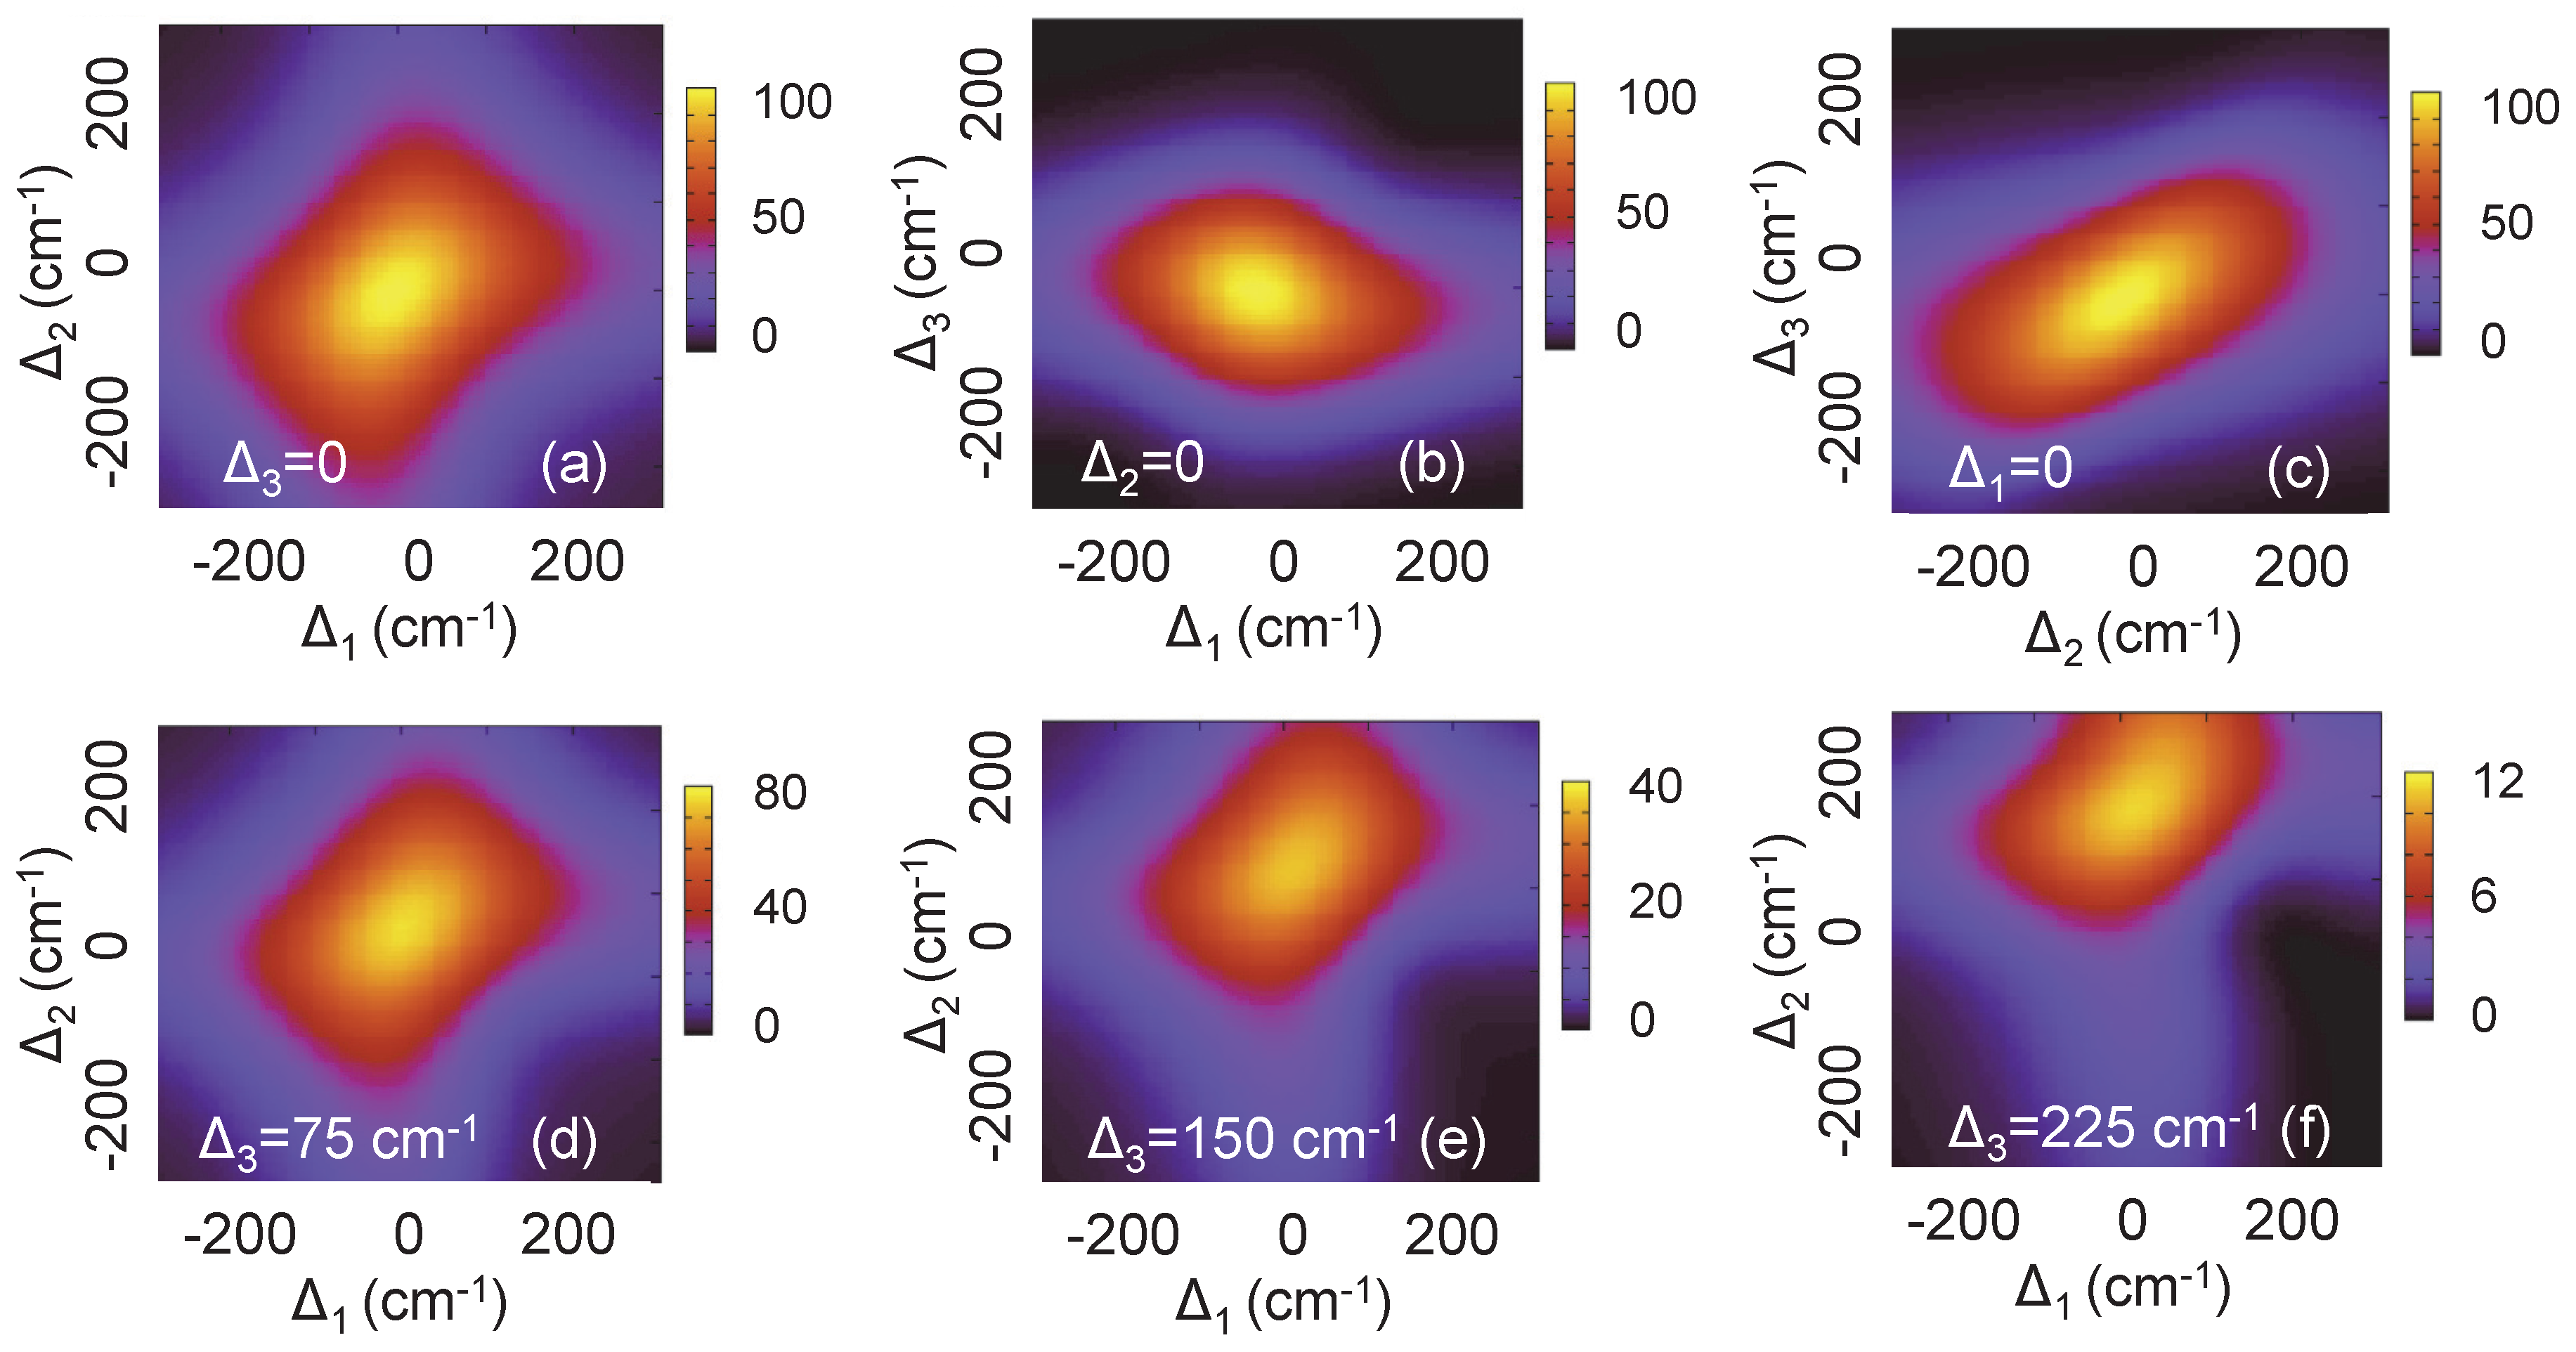
Figure 2.
Study of the effect of field detuning on the population inversion from level
to level 7
p in atomic sodium (see
Figure 1) for 100 fs pulses. Note that in
(a–
c) the most yellow regions correspond to 100% population transfer; while in (
d–
f), they correspond to 80%, 40% and 12%, respectively.
We have investigated the robustness of the full
π-pulse trichromatic scheme against detuning and chirp of the laser pulses by considering different pulse durations. In order to study the effect of field detuning we define the following detuning parameters:
,
and
, with
corresponding to the energy transition of the
levels (
s,
p,
s,
p, see
Figure 1).
corresponds to all field detunings that keep the three-photon resonance between levels 7
p and 3
s,
means that the two-photon resonance between 3
s and 4
s is maintained, and
means that the
field is in resonance with the 3
s–3
p transition.
Figure 2 shows how complete population inversion from level 3
s to level 7
p is affected by detuning in the case of using 100 fs pulses.
Figure 2a shows the results obtained when the three-photon resonance between 3
s and 7
p is kept (
). In the case shown in
Figure 2b the two-photon resonance between 3
s and 4
s is maintained while the frequency of the three pulses is varied (
). In
Figure 2c the results corresponding to having resonance in the lowest transition 3
s–3
p are shown (
). In these three first cases we observe a roughly symmetrical geometry around the center of the figure where the detuning is zero (
), which shows the sensitivity of the complete inversion effect. We observe that for inversion to stay at values larger than 95% the system supports detuning of the order of about 100 cm
, which roughly corresponds to the width of the Gaussian 100 fs pulses used (147 cm
). In
Figure 2d–f the three detuning parameters have been varied simultaneously.
Figure 2d shows that for
cm
a comparable detuning
produces a population inversion as high as 80%. The combined effect of
and
is further shown in
Figure 2e for a higher value of
cm
, where a corresponding higher value of
reduces the inversion to about 40%. For larger values of
population inversion is basically suppressed, as it is shown in
Figure 2f, where the yellow color in the plot represents only a 12% of inversion. For longer pulses the supported detuning is scaled accordingly with the duration of the pulses, as it was also reported in the case of a three-level system interacting with two phase-locked pulses [
12]. This is, if a factor
m is multiplied to the duration of the pulse, the same factor
m divides the scale of the supported detuning, which concurs with the fact the detuning should be comparable to the spectral width of the pulses. The optimal pulse duration for a particular application and the corresponding effect of detuning will therefore be dependent basically on the line-broadening factors of the system under consideration and the value of the dipole moments of the transitions, which for ultrafast population inversion have to be high enough not to involve too strong laser fields, as commented above.
We next have considered pulse chirp on the three pulses interacting with the four-level system and have computed its effect for different transform limited (TL) pulse durations. In
Figure 3 the effect of pulse chirp on the final populations is shown. The populations of the four levels after the pulse interaction are plotted as a function of the spectral chirp parameter
, which has been implemented in the Fourier domain as
, with
being the group delay dispersion (GDD) added to the spectral phase of the pulse. We note that, as only the spectral phase of the laser pulse is varied in our study, the frequency content remains as the TL pulse for any value of the spectral chirp
. The rephasing of the spectral components produces a time broadening of the pulse given by
, where
is the full width at half maximum of the chirped pulse intensity profile [
22], and therefore we implement the regular effect produced by for instance propagating the laser pulse in a linear dispersive medium. For GDD measurements of atmospheric and other gases with ultrashort pulses see, e.g., [
27].
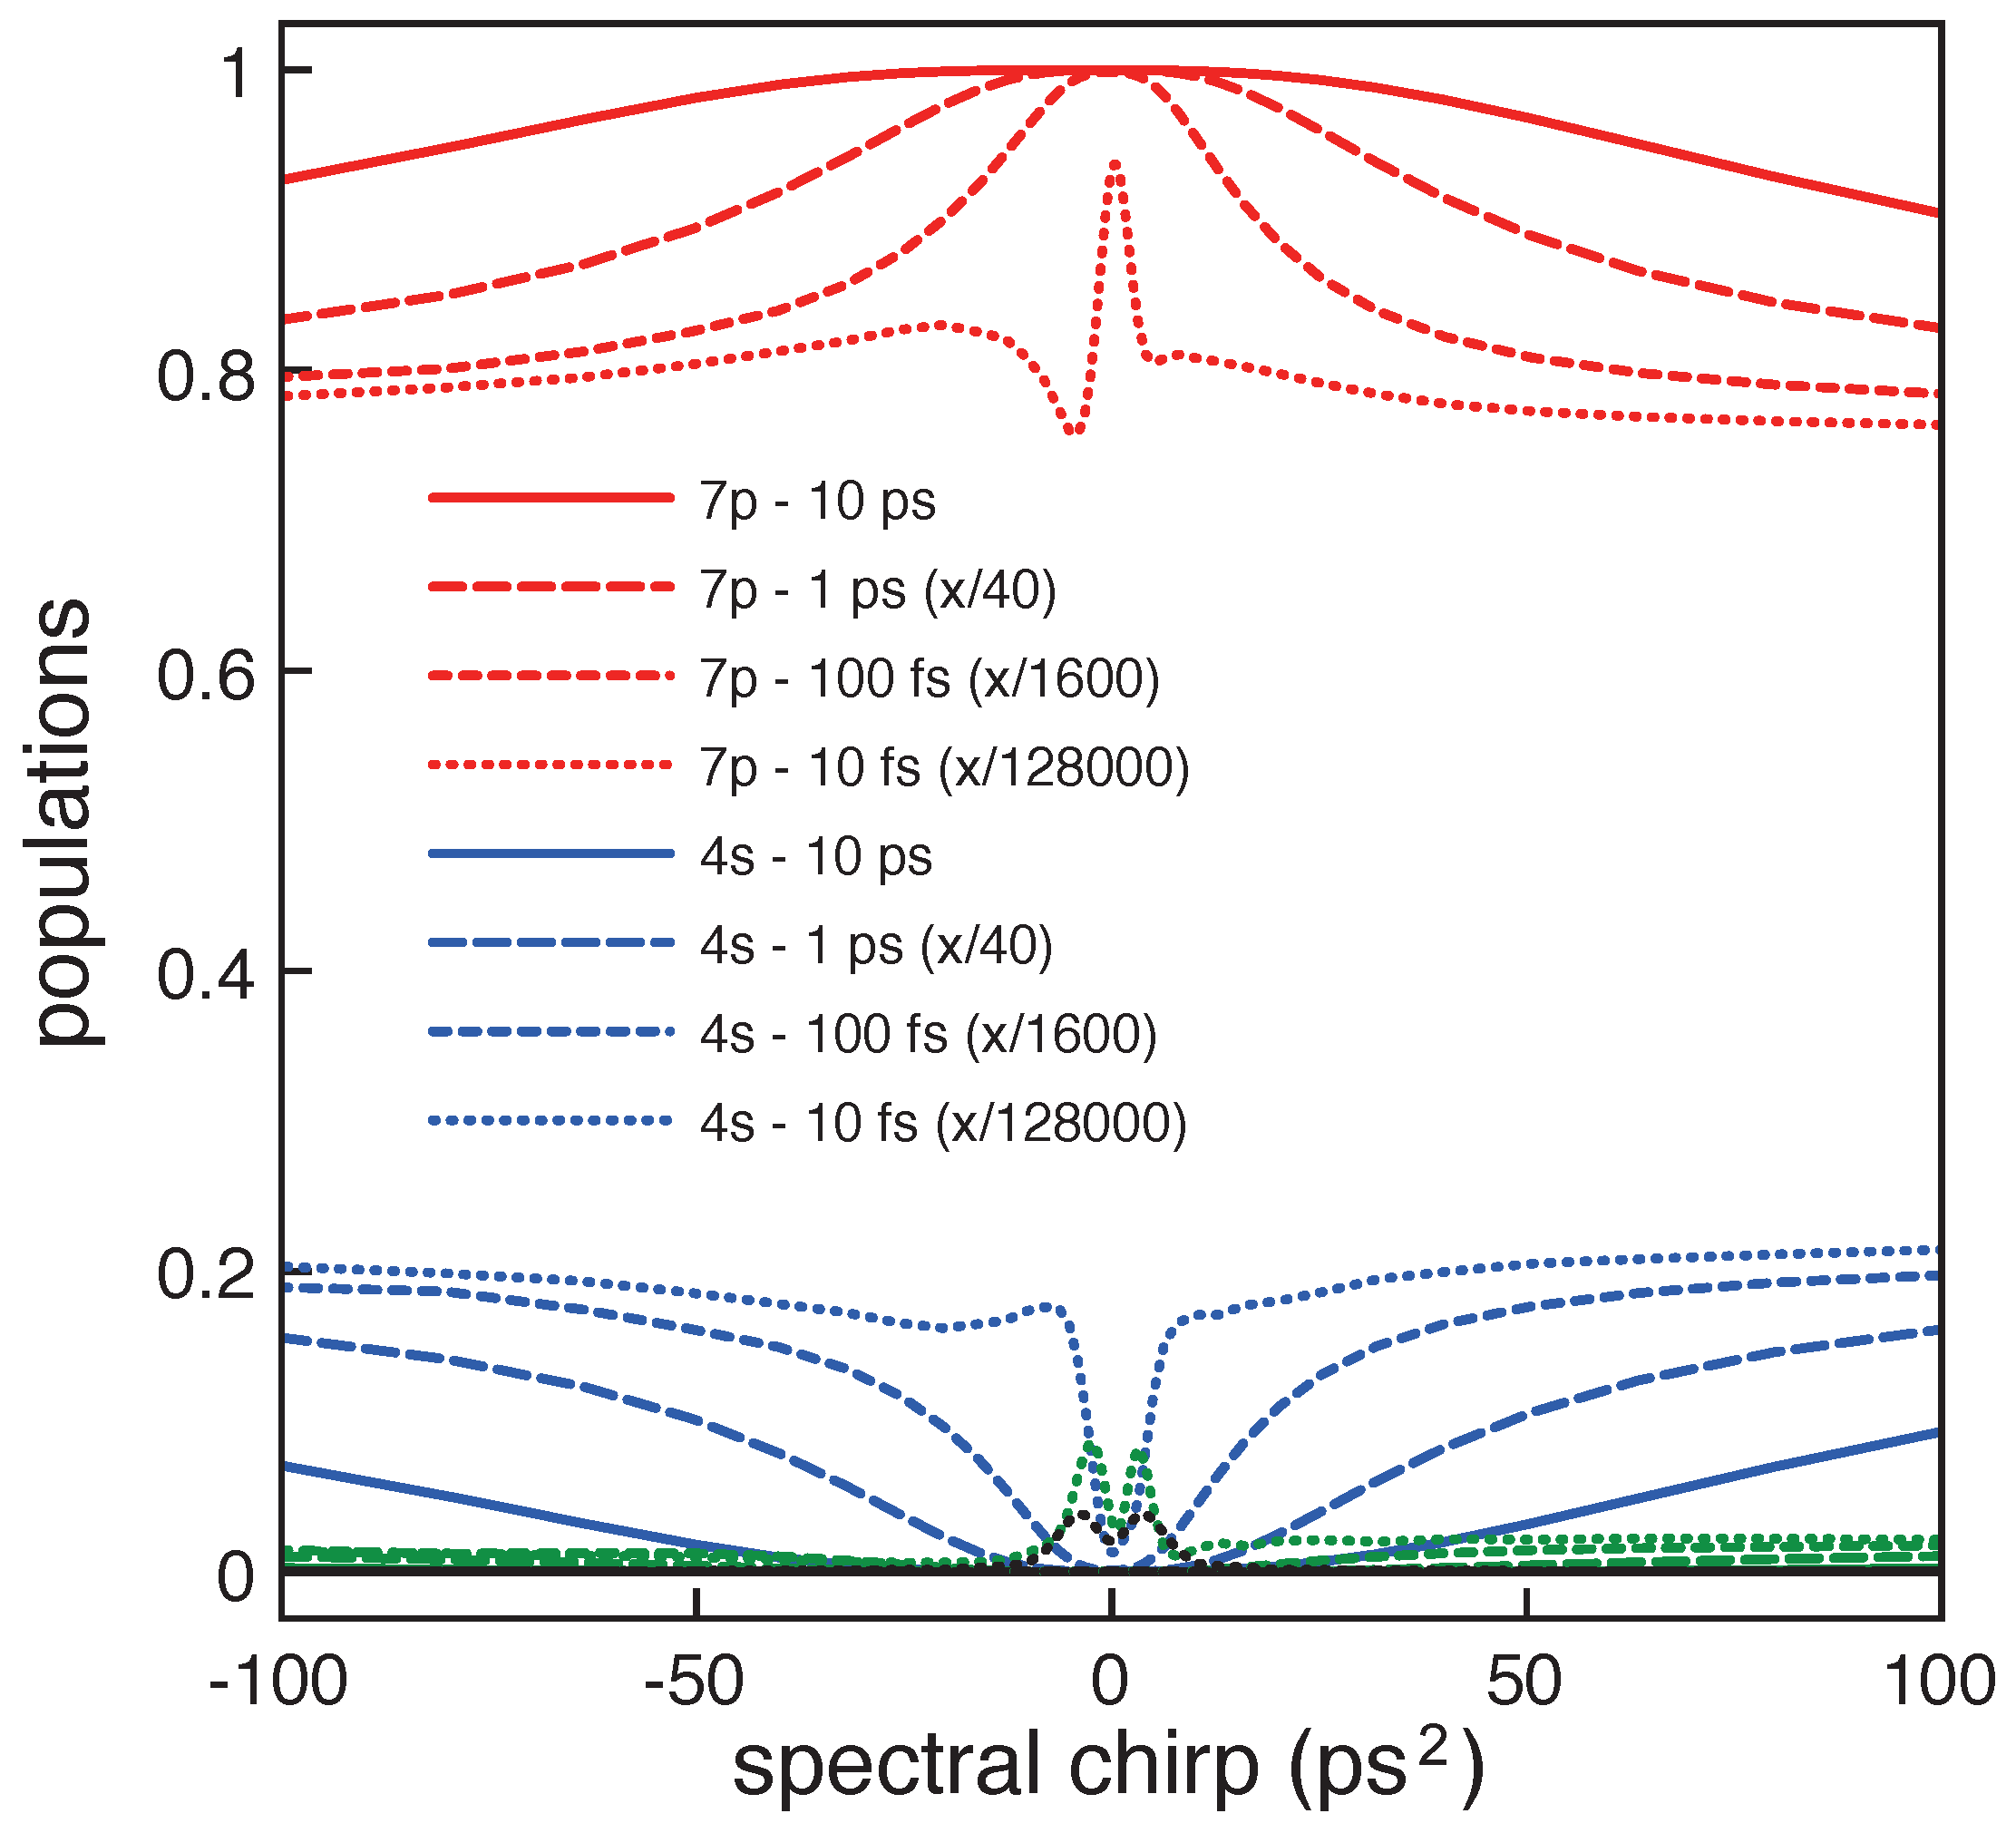
Figure 3.
Effect of pulse chirp on the populations of the four levels after the interaction for different durations of the corresponding TL pulses. Indicated are the final populations of levels 7p (red lines) and 4s (blue lines); levels 3p and 3s become basically unpopulated in all cases (green and black lines). Note that the x-axis has been scaled for the different cases as indicated in the legend of the figure. Clearly, the population inversion produced by the longer pulses is less affected by chirp.
Table 1.
Effect of GDD.
| | | % Inversion |
|---|
| 10 ps | 100 ps | 29.5 ps | ≈ 92% |
| 1 ps | 0.94 ps | 2.8 ps | ≈ 92% |
| 100 fs | 9765 fs | 289 fs | ≈ 92% |
In our study we have considered the same amount of spectral chirp for the three frequency components of the interacting pulse and with central frequencies resonant to their closest transition (
,
,
). The red lines in
Figure 3 correspond to the final population in level 7
p, the blue lines show the final population in level 4
s, and the green and black lines (close to zero) are the final populations in levels 3
p and 3
s. It is clear from
Figure 3 that the main effect of pulse chirp in the case that we have considered is to bring part of the final population to level 4
s, while levels 3
p and 3
s remain basically unpopulated. Note that the
x-axis in
Figure 3 have been scaled for the different pulse durations, as it is indicated in the legend of the figure. We observe that the trichromatic
π-pulse effect is robust for spectral chirps of the order of ps
for TL pulses of 10 ps. In
Table 1 we show the GDD (
) values supported for the pulses with TL durations of
= 1 ps, 10 ps and 100 fs for a reduction in the population inversion to values of ≈ 92%, together with the associated pulse broadening (
). Clearly, the shorter pulses support a lower value of chirp, with a pulse broadening that corresponds roughly to three times the TL duration for the three cases. We finally observe that the large electric fields associated to shorter pulses of the considered pulse areas prevent complete population inversion, as shown for the case of 10 fs pulses by the red-dotted line in
Figure 3.


